
Comparative Assessment of Spire and COSMIC-2 Radio Occultation Data Quality
 ,
,  ,
,
Abstract
1. Introduction
2. Data and Methodology
2.1. GNSS-RO Data
2.2. ERA5 Datasets
2.3. Radiosonde Data
2.4. Methodology
3. Comparison Results
3.1. Initial Analysis
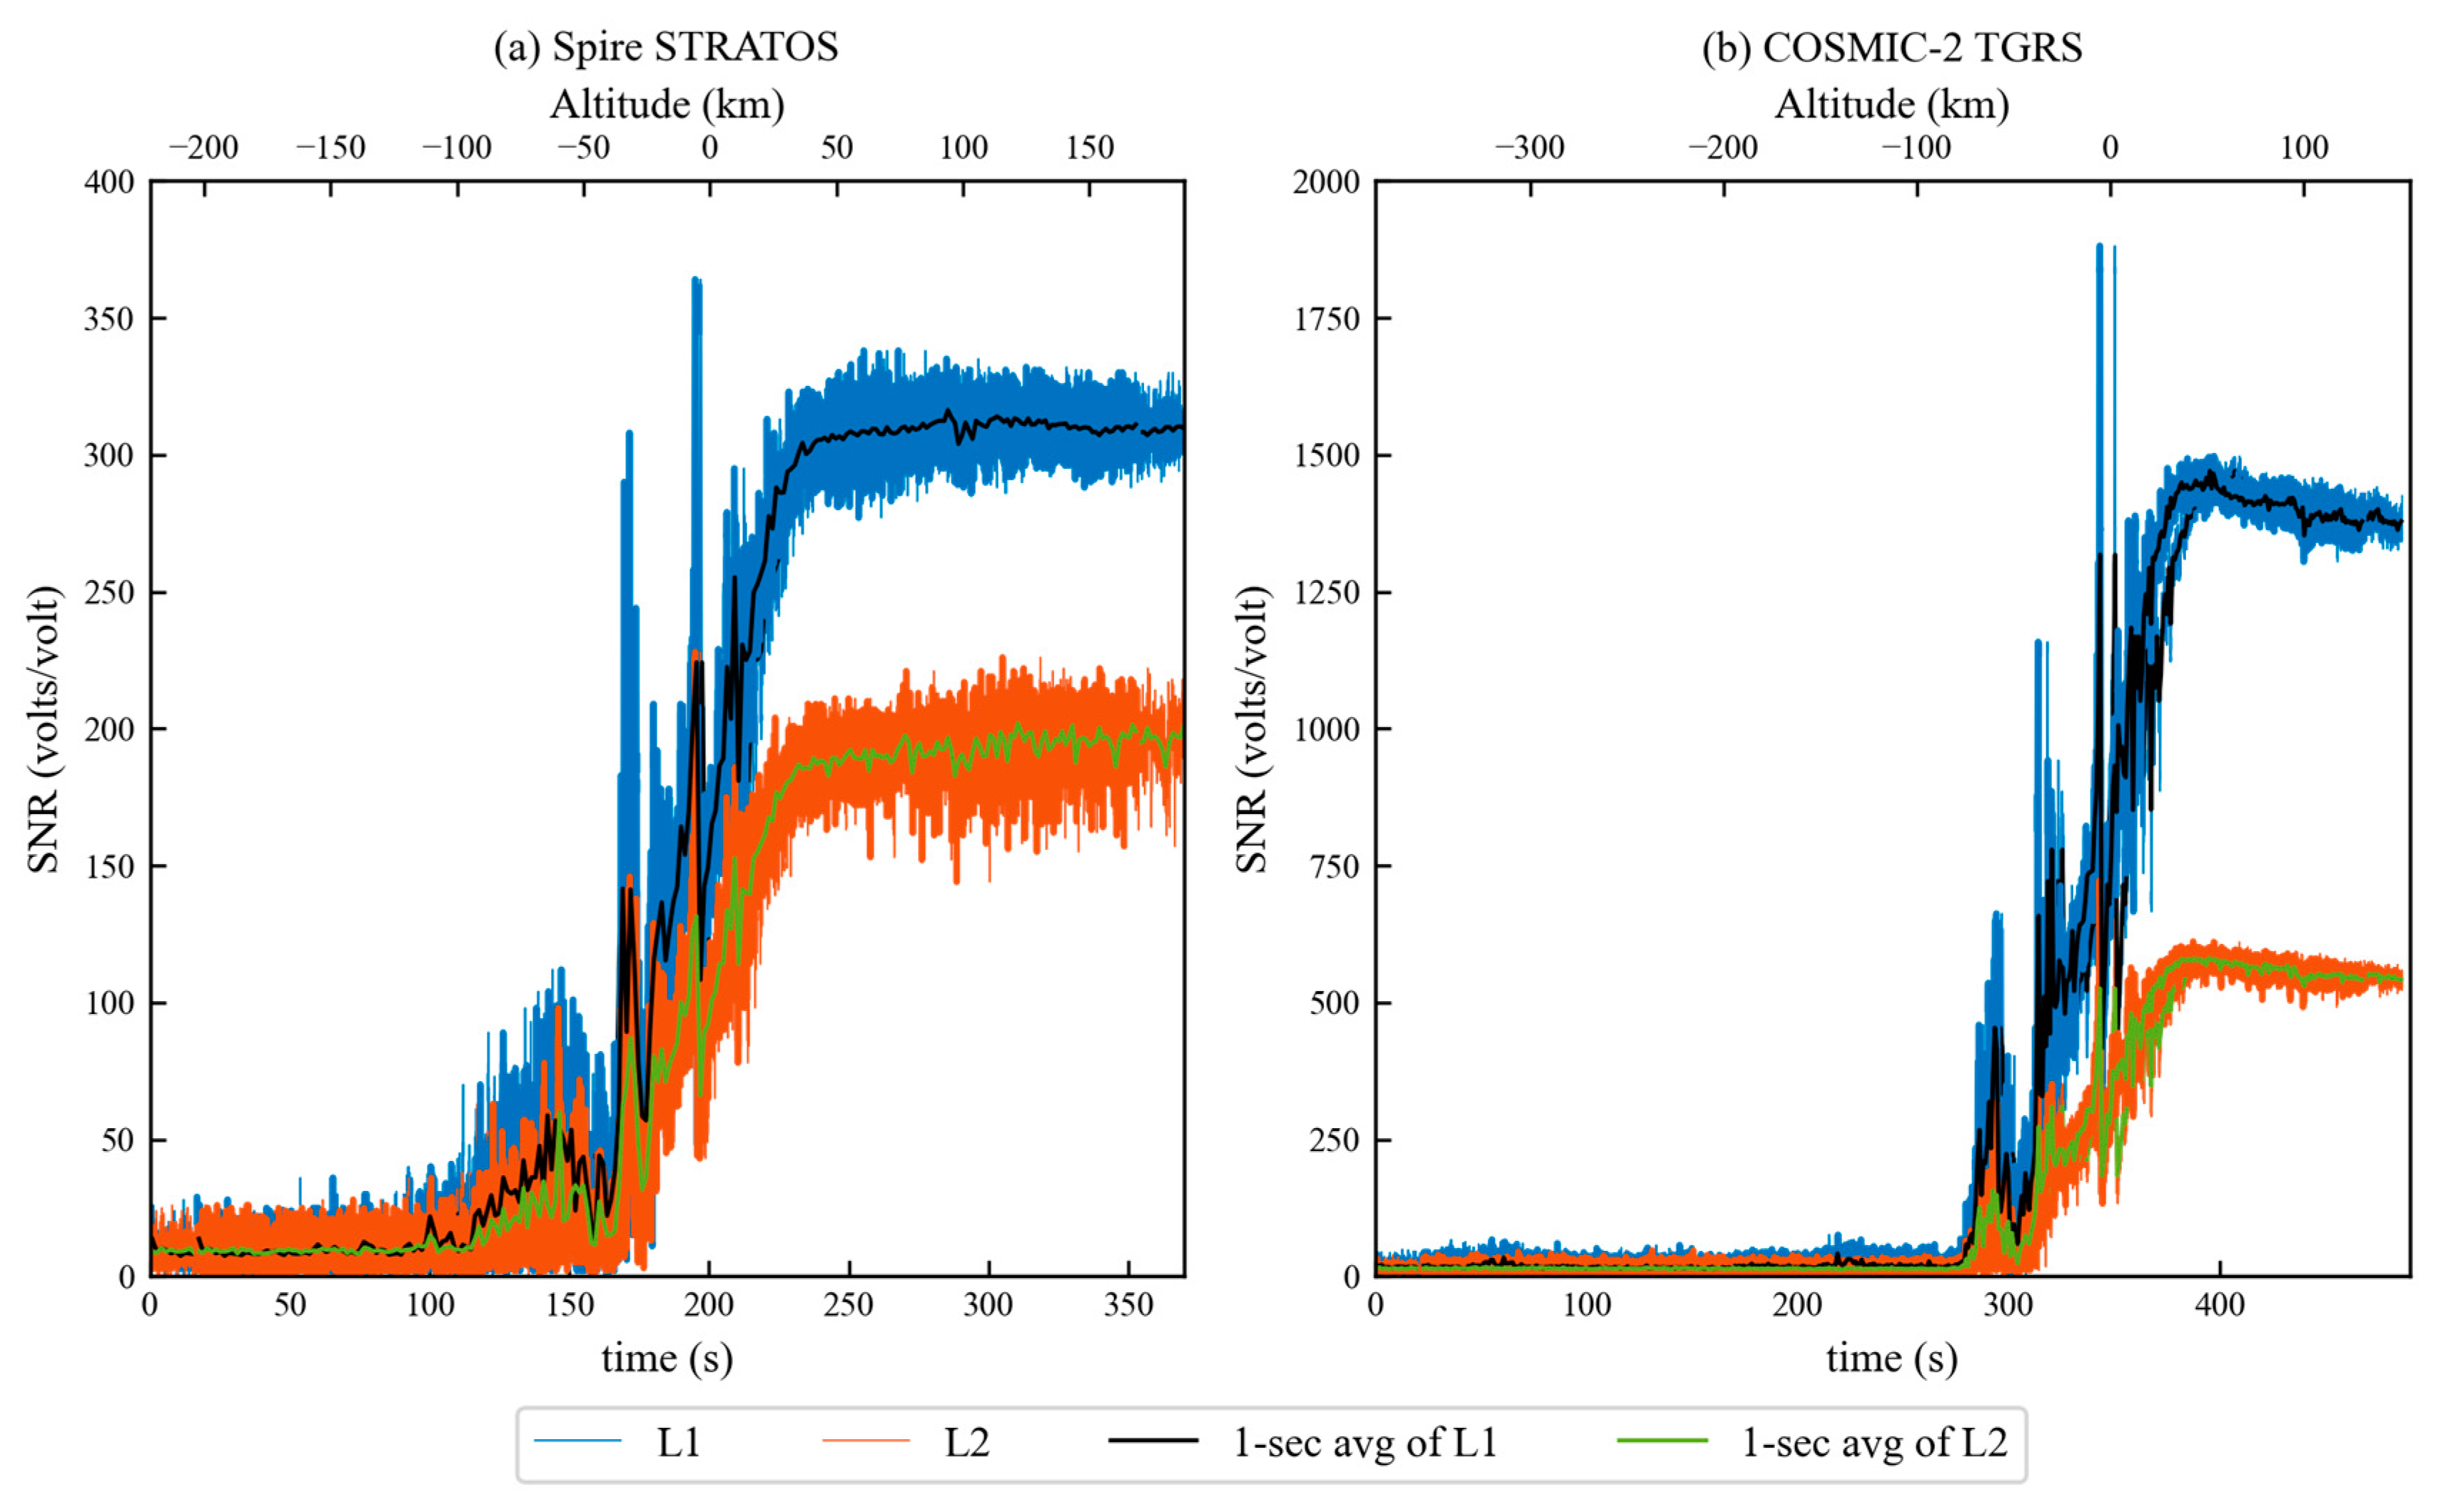
3.2. SNR
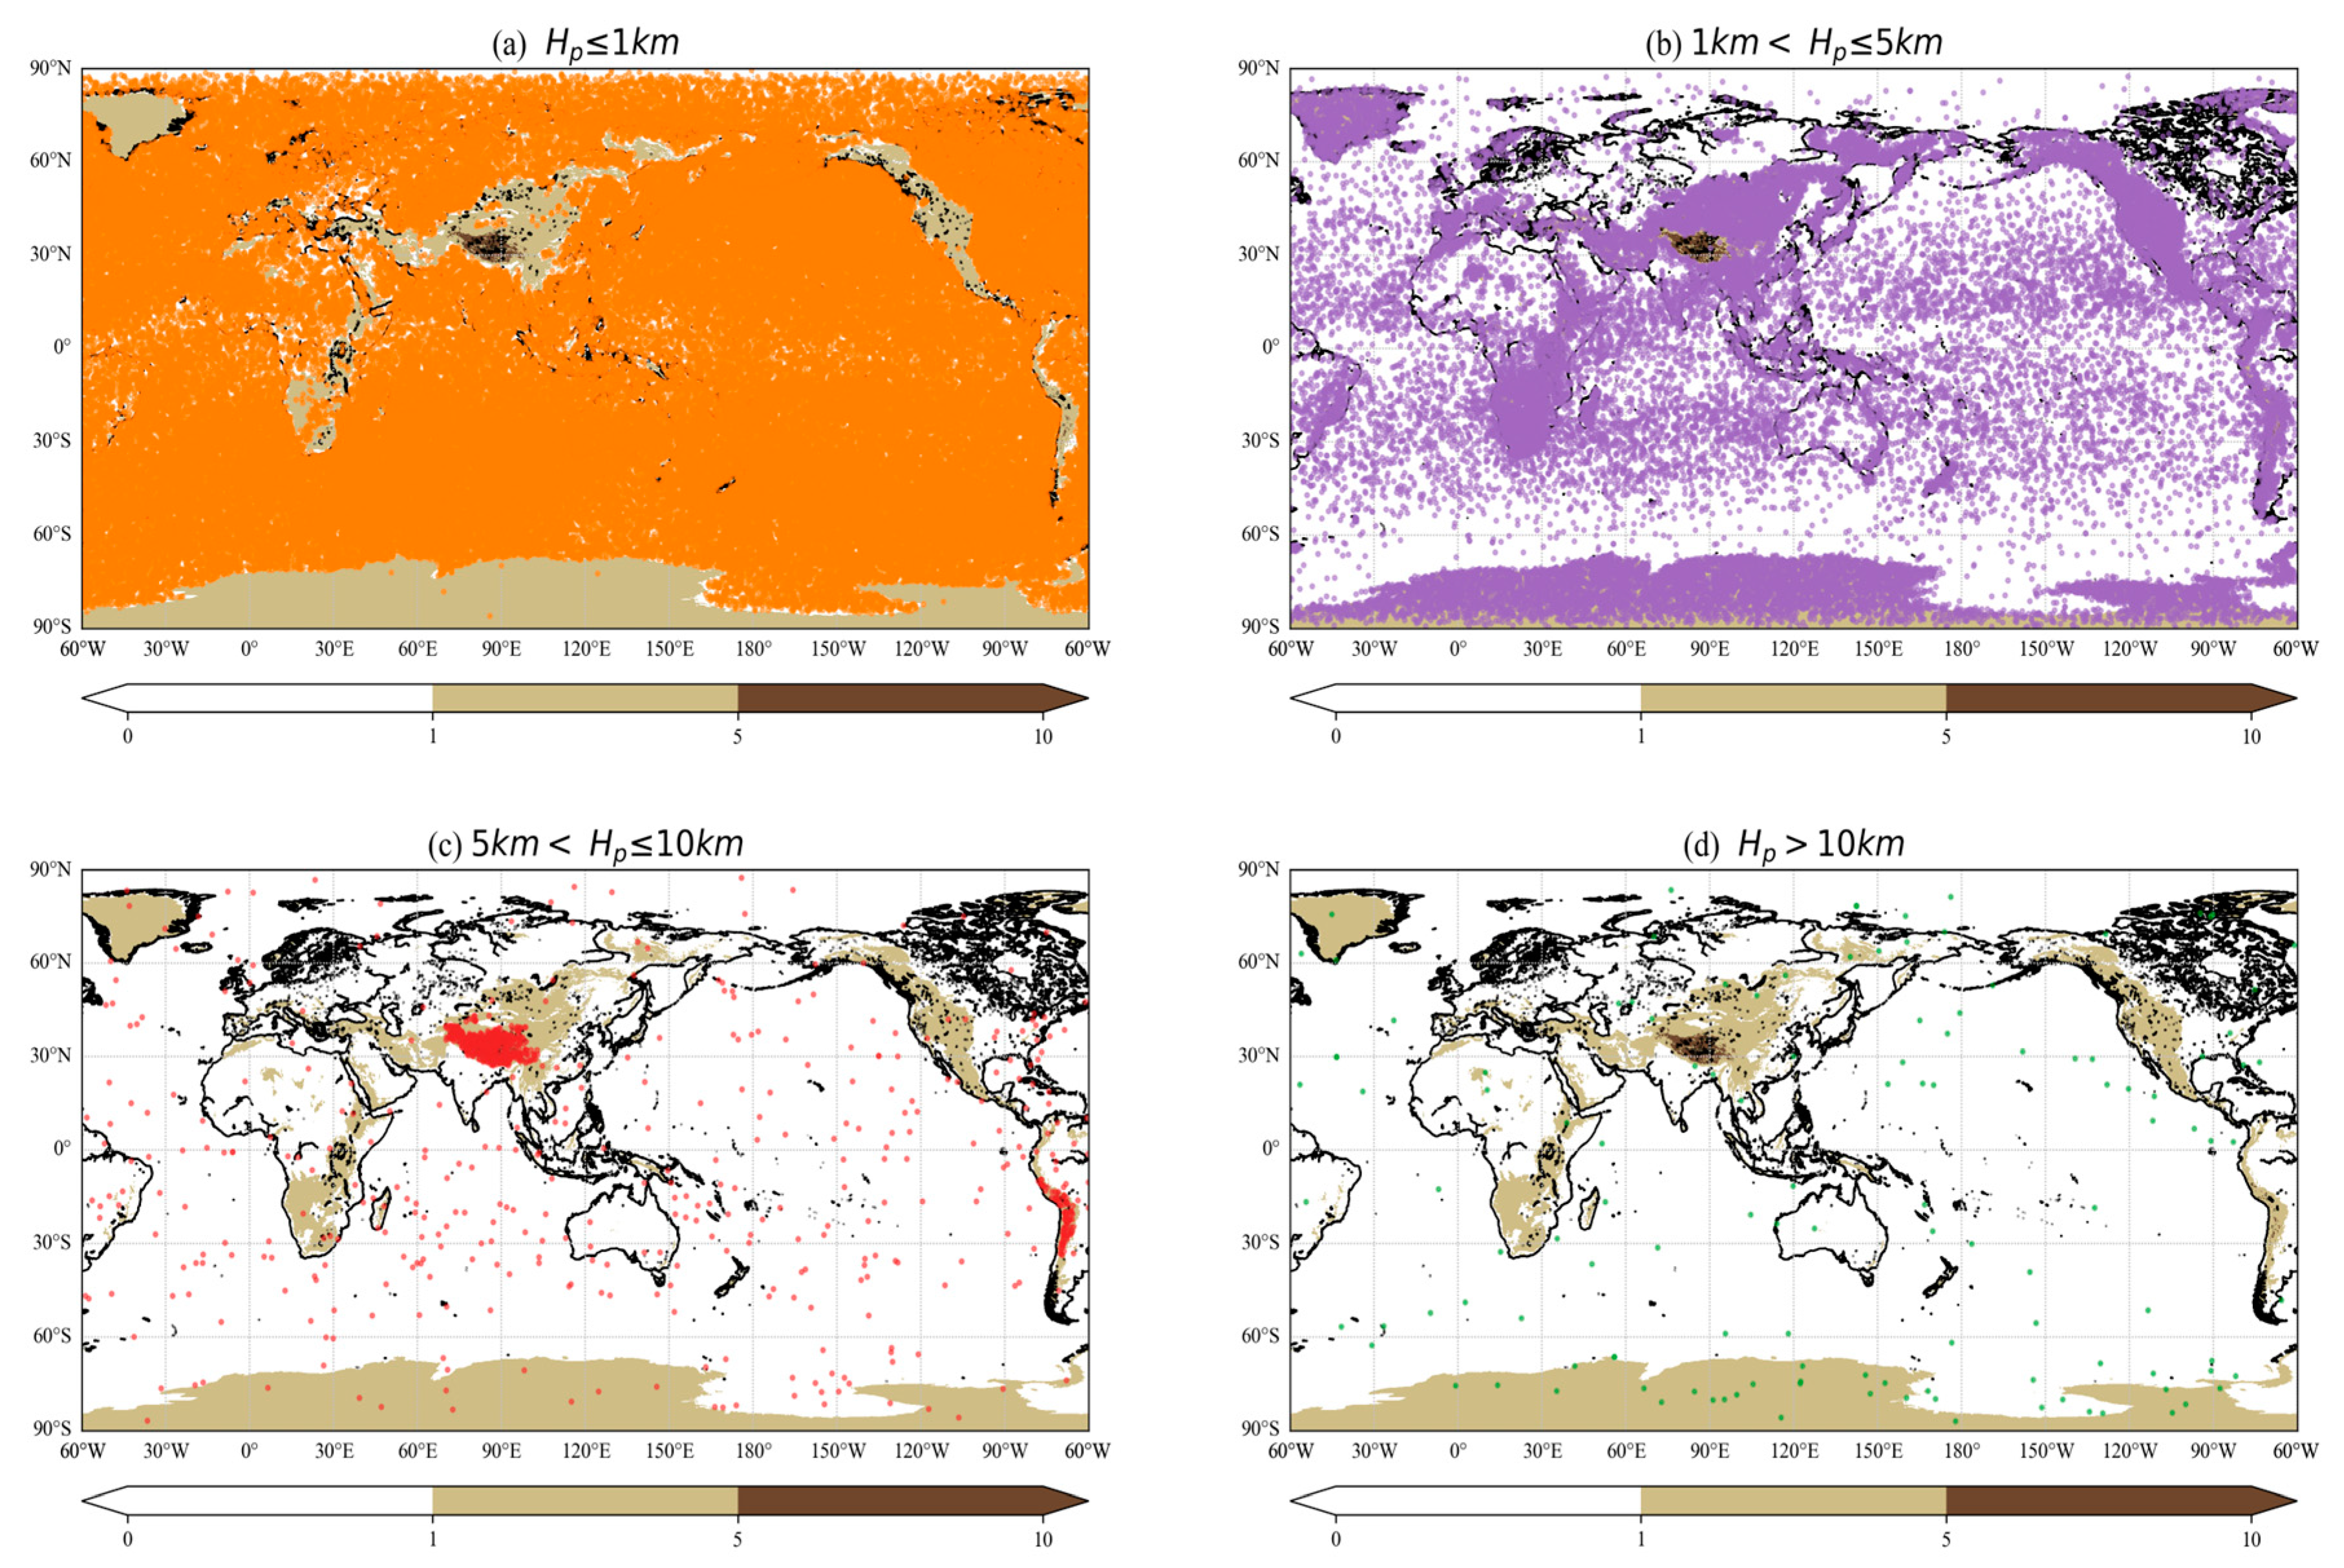
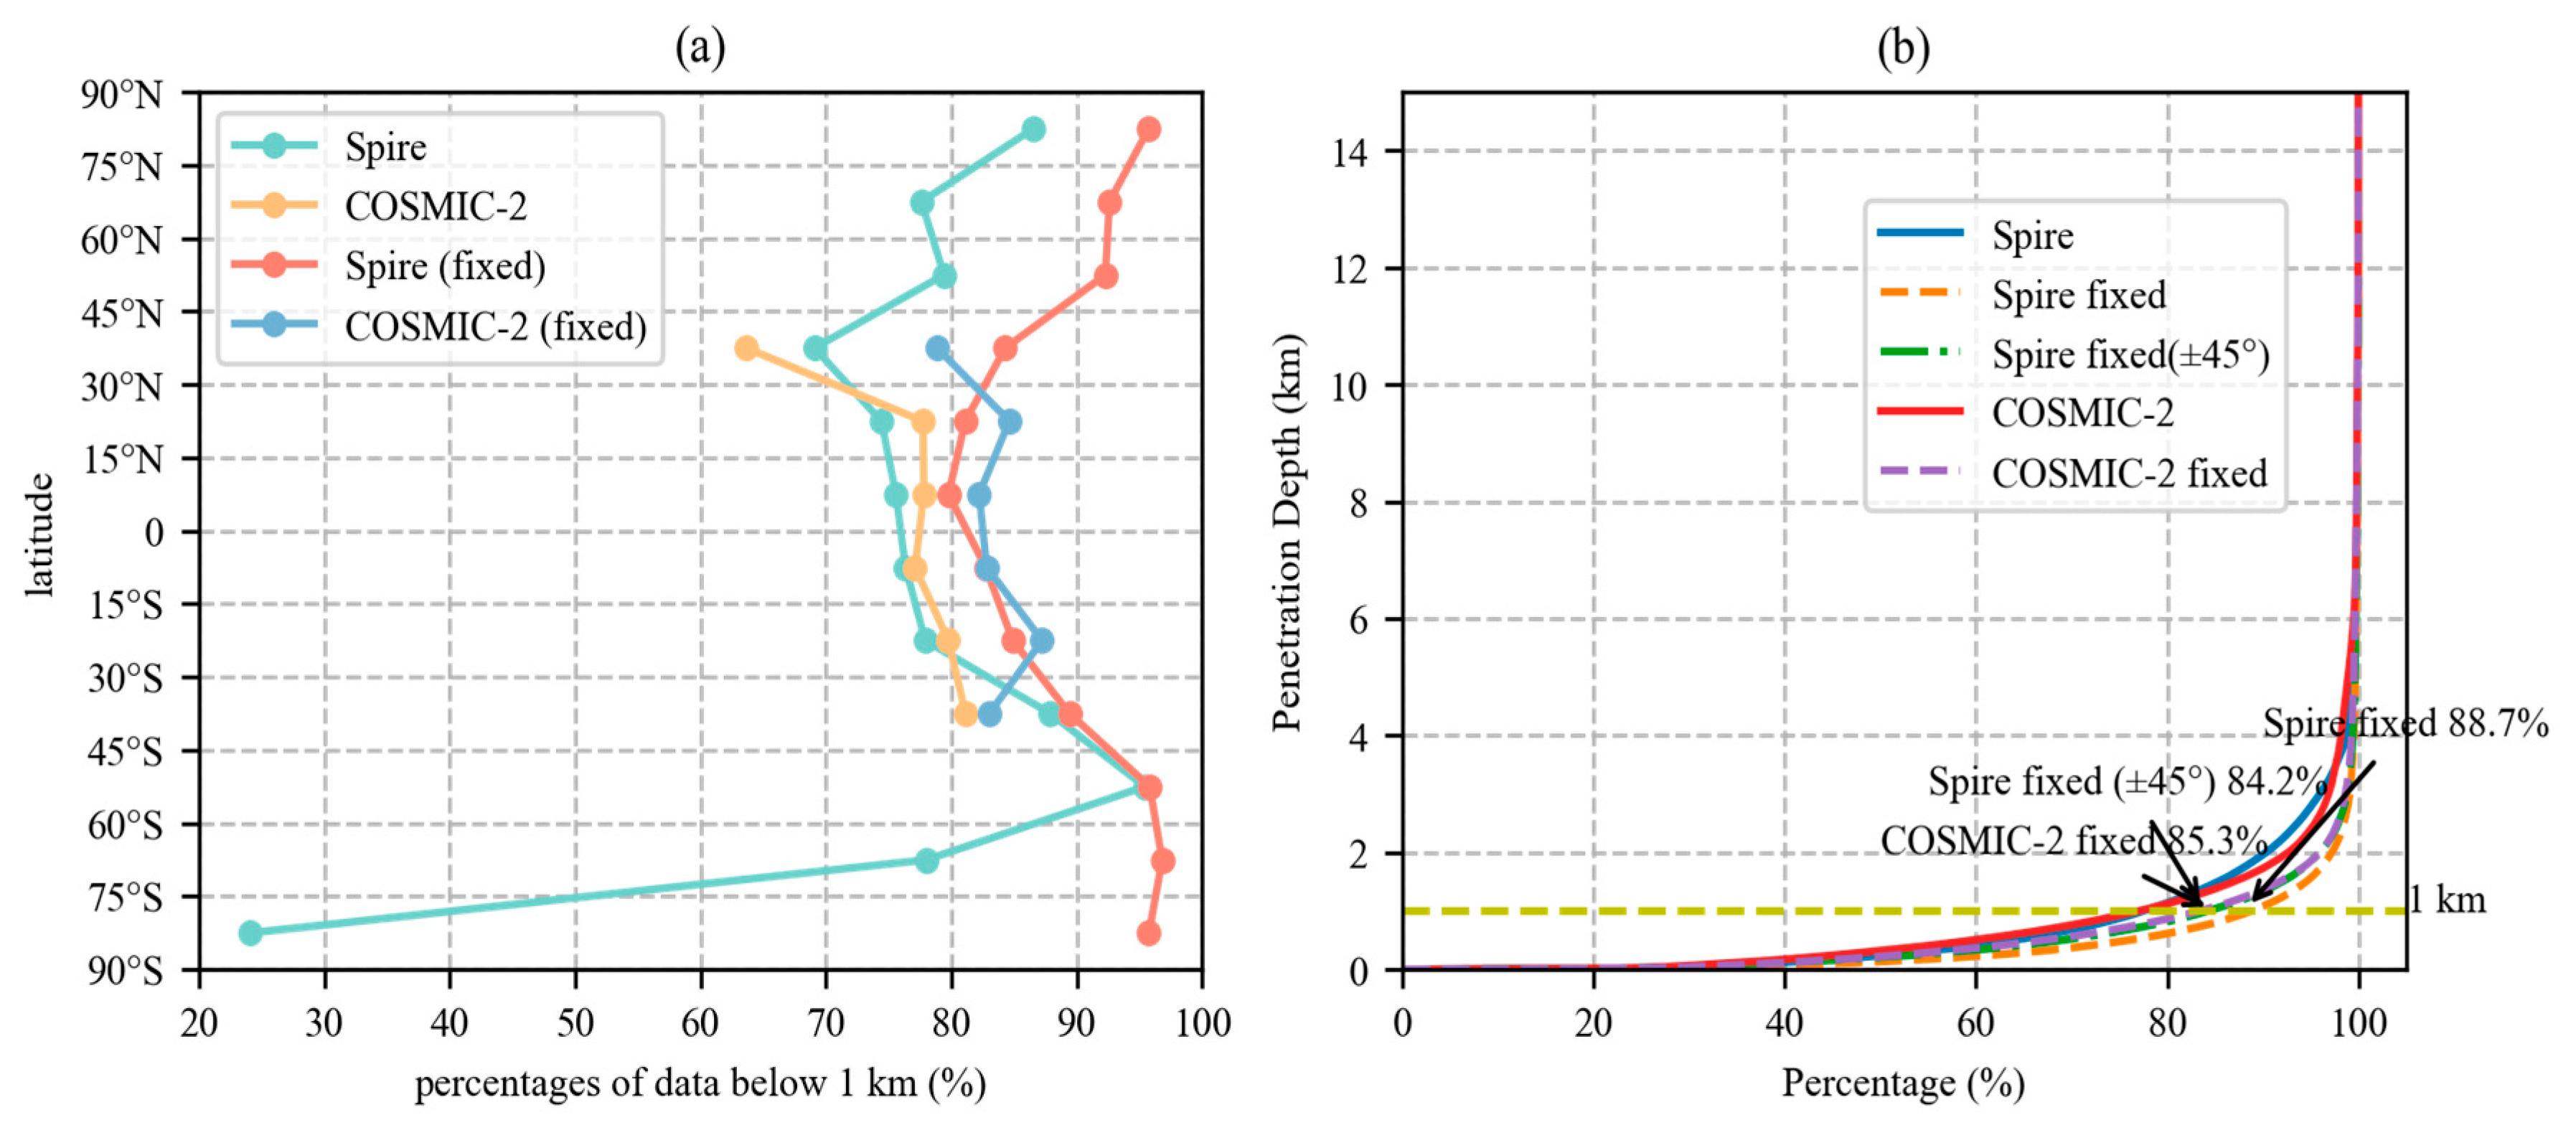
3.3. Penetration
3.4. RO Retrieval Quality Assessment
4. Discussion
5. Conclusions
- Spire’s RO events demonstrated global coverage due to various orbiting geometries, while COSMIC-2 events were concentrated in the tropics and reduced at higher latitudes.
- GPS-derived RO events were generally more abundant than GLONASS-derived events in both Spire and COSMIC-2 datasets. And GLONASS-derived RO events slightly outnumbered those derived from GALILEO for Spire.
- STRATOS payload on Spire, equipped with lower-gain antennas, exhibited weaker signal capturing compared to IGOR (COSMIC-1) and significantly weaker than TRGS (COSMIC-2).
- The SNR averages of the GLONASS-derived RO events in the Spire data are much stronger than those of the GPS-derived events, while for COSMIC-2, the strengths of the SNR averages had the same magnitudes, with little difference observed between the GPS- and GLONASS-derived RO events.
- In the same coverage area (±45°), COSMIC-2 demonstrated better penetration ability than Spire.
- Based on the research by Gorbunov et al. (2022) [27], it has been revealed that the SNR serves as an indicator of signal strength and holds a crucial role in penetration. Penetration depth was found to be influenced by SNR, GNSS, RO modes, topography, and latitude, as revealed by combined results obtained in Section 3.2 and Section 3.3.
- Compared to the ERA5 and radiosonde products, the Spire and COSMIC-2 datasets have identical retrieval qualities when considering the RO data of Spire and COSMIC-2. The accuracy of the neutral-atmosphere Spire data products acquired herein was comparable with those of COSMIC-2.
Author Contributions
Funding
Data Availability Statement
Conflicts of Interest
References
- Bowler, N.E. Revised GNSS-RO observation uncertainties in the Met Office NWP system. Q. J. R. Meteorol. Soc. 2020, 146, 2274–2296. [Google Scholar] [CrossRef]
- Bai, W.; Deng, N.; Sun, Y.; Du, Q.; Xia, J.; Wang, X.; Meng, X.; Zhao, D.; Liu, C.; Tan, G.; et al. Applications of GNSS-RO to Numerical Weather Prediction and Tropical Cyclone Forecast. Atmosphere 2020, 11, 1204. [Google Scholar] [CrossRef]
- Yue, X.; Schreiner, W.S.; Pedatella, N.; Anthes, R.A.; Mannucci, A.J.; Straus, P.R.; Liu, J.-Y. Space Weather Observations by GNSS Radio Occultation: From FORMOSAT-3/COSMIC to FORMOSAT-7/COSMIC-2. Space Weather 2014, 12, 616–621. [Google Scholar] [CrossRef]
- Gleisner, H.; Ringer, M.A.; Healy, S.B. Monitoring global climate change using GNSS radio occultation. NPJ Clim. Atmos. Sci. 2022, 5, 6. [Google Scholar] [CrossRef]
- Ho, S.-P.; Anthes, R.A.; Ao, C.O.; Healy, S.; Horanyi, A.; Hunt, D.; Mannucci, A.J.; Pedatella, N.; Randel, W.J.; Simmons, A.; et al. The COSMIC/FORMOSAT-3 Radio Occultation Mission after 12 Years: Accomplishments, Remaining Challenges, and Potential Impacts of COSMIC-2. Bull. Am. Meteorol. Soc. 2020, 101, E1107–E1136. [Google Scholar] [CrossRef]
- Elrahman Yassien, A.; El-Kutb Mousa, A.; Rabah, M.; Saber, A.; Zhran, M. Analysis of spatial and temporal variation of precipitable water vapor using COSMIC radio occultation observations over Egypt. Egypt. J. Remote Sens. Space Sci. 2022, 25, 751–764. [Google Scholar] [CrossRef]
- Zhran, M.; Mousa, A. Planetary boundary layer height retrieval using GNSS Radio Occultation over Egypt. Egypt. J. Remote Sens. Space Sci. 2022, 25, 551–559. [Google Scholar] [CrossRef]
- Rocken, C.; Anthes, R.; Exner, M.; Hunt, D.; Sokolovskiy, S.; Ware, R.; Gorbunov, M.; Schreiner, W.; Feng, D.; Herman, B.; et al. Analysis and validation of GPS/MET data in the neutral atmosphere. J. Geophys. Res. Atmos. 1997, 102, 29849–29866. [Google Scholar] [CrossRef]
- Larsen, G.B.; Syndergaard, S.; Høeg, P.; Sørensen, M.B. Single frequency processing of Ørsted GPS radio occultation measurements. GPS Solut. 2005, 9, 144–155. [Google Scholar] [CrossRef]
- Mostert, S.; Koekemoer, J.-A. The science and engineering payloads and experiments on sunsat. Acta Astronaut. 1997, 41, 401–411. [Google Scholar] [CrossRef]
- Schmidt, T.; Wickert, J.; Marquardt, C.; Beyerle, G.; Reigber, C.; Galas, R.; König, R. GPS radio occultation with CHAMP: An innovative remote sensing method of the atmosphere. Adv. Space Res. 2004, 33, 1036–1040. [Google Scholar] [CrossRef]
- Hajj, G.A.; Ao, C.O.; Iijima, B.A.; Kuang, D.; Kursinski, E.R.; Mannucci, A.J.; Meehan, T.K.; Romans, L.J.; de la Torre Juarez, M.; Yunck, T.P. CHAMP and SAC-C atmospheric occultation results and intercomparisons. J. Geophys. Res. Atmos. 2004, 109, D06109–D06132. [Google Scholar] [CrossRef]
- Beyerle, G.; Schmidt, T.; Michalak, G.; Heise, S.; Wickert, J.; Reigber, C. GPS radio occultation with GRACE: Atmospheric profiling utilizing the zero difference technique. Geophys. Res. Lett. 2005, 32, L13806–L13810. [Google Scholar] [CrossRef]
- Liou, Y.; Pavelyev, A.G.; Liu, S.; Pavelyev, A.A.; Yen, N.; Huang, C.; Fong, C. FORMOSAT-3/COSMIC GPS Radio Occultation Mission: Preliminary Results. IEEE Trans. Geosci. Remote Sens. 2007, 45, 3813–3826. [Google Scholar] [CrossRef]
- Ho, S.-P.; Zhou, X.; Shao, X.; Zhang, B.; Adhikari, L.; Kireev, S.; He, Y.; Yoe, J.G.; Xia-Serafino, W.; Lynch, E. Initial Assessment of the COSMIC-2/FORMOSAT-7 Neutral Atmosphere Data Quality in NESDIS/STAR Using In Situ and Satellite Data. Remote Sens. 2020, 12, 4099. [Google Scholar] [CrossRef]
- Gorbunov, M.E.; Lauritsen, K.B.; Benzon, H.H.; Larsen, G.B.; Syndergaard, S.; Sørensen, M.B. Processing of GRAS/METOP radio occultation data recorded in closed-loop and raw-sampling modes. Atmos. Meas. Tech. 2011, 4, 1021–1026. [Google Scholar] [CrossRef]
- Li, X.; Zhang, K.; Meng, X.; Zhang, Q.; Zhang, W.; Li, X.; Yuan, Y. LEO–BDS–GPS integrated precise orbit modeling using FengYun-3D, FengYun-3C onboard and ground observations. GPS Solut. 2020, 24, 48. [Google Scholar] [CrossRef]
- Bowler, N.E. An assessment of GNSS radio occultation data produced by Spire. Q. J. R. Meteorol. Soc. 2020, 146, 3772–3788. [Google Scholar] [CrossRef]
- Ruston, B.; Swadley, S.; Baker, N. An evaluation of GNSS-RO data from NOAA Commercial Radio Occultation Purchase using the NRL global NWP system. In Proceedings of the 8th International Radio Occultation Working Group Meeting, Virtual Meeting, 7–13 April 2021. [Google Scholar]
- Wickert, J.; Reigber, C.; Beyerle, G.; König, R.; Marquardt, C.; Schmidt, T.; Grunwaldt, L.; Galas, R.; Meehan, T.K.; Melbourne, W.G.; et al. Atmosphere sounding by GPS radio occultation: First results from CHAMP. Geophys. Res. Lett. 2001, 28, 3263–3266. [Google Scholar] [CrossRef]
- Schreiner, W.; Sokolovskiy, S.; Hunt, D.; Rocken, C.; Kuo, Y.H. Analysis of GPS radio occultation data from the FORMOSAT-3/COSMIC and Metop/GRAS missions at CDAAC. Atmos. Meas. Tech. 2011, 4, 2255–2272. [Google Scholar] [CrossRef]
- Chen, S.-Y.; Liu, C.-Y.; Huang, C.-Y.; Hsu, S.-C.; Li, H.-W.; Lin, P.-H.; Cheng, J.-P.; Huang, C.-Y. An Analysis Study of FORMOSAT-7/COSMIC-2 Radio Occultation Data in the Troposphere. Remote Sens. 2021, 13, 717. [Google Scholar] [CrossRef]
- Masters, D.; Nguyen, V.; Irisov, V.; Nogues-Correig, O.; Tan, L.; Yuasa, T.; Ringer, J.; Rocken, C.; Gorbunov, M. Commercial RO Becomes Reality: Rapid Growth, External Validation, and Operational Assimilation of Spire RO. In Proceedings of the 8th International Radio Occultation Working Group Meeting, Virtual Meeting, 7–13 April 2021. [Google Scholar]
- Johnston, B.R.; Randel, W.J.; Sjoberg, J.P. Evaluation of Tropospheric Moisture Characteristics Among COSMIC-2, ERA5 and MERRA-2 in the Tropics and Subtropics. Remote Sens. 2021, 13, 880. [Google Scholar] [CrossRef]
- Forsythe, V.V.; Duly, T.; Hampton, D.; Nguyen, V. Validation of Ionospheric Electron Density Measurements Derived From Spire CubeSat Constellation. Radio Sci. 2020, 55, e2019RS006953. [Google Scholar] [CrossRef]
- Juang, J.-C.; Tsai, Y.-F.; Chu, C.-H. On constellation design of multi-GNSS radio occultation mission. Acta Astronaut. 2013, 82, 88–94. [Google Scholar] [CrossRef]
- Gorbunov, M.; Irisov, V.; Rocken, C. The Influence of the Signal-to-Noise Ratio upon Radio Occultation Retrievals. Remote Sens. 2022, 14, 2742. [Google Scholar] [CrossRef]
- Irisov, V.; Nguyen, V.; Masters, D.; Sikarin, R.; Bloom, A.; Gorbunov, M.; Rocken, C. Comparison of Spire RO profiles Processed by UCAR and Spire. In Proceedings of the 8th International Radio Occultation Working Group Meeting, Virtual Meeting, 7–13 April 2021. [Google Scholar]
- Smith, E.K.; Weintraub, S. The Constants in the Equation for Atmospheric Refractive Index at Radio Frequencies. Proc. IRE 1953, 41, 1035–1037. [Google Scholar] [CrossRef]
- Palmer, P.I.; Barnett, J.J.; Eyre, J.R.; Healy, S.B. A nonlinear optimal estimation inverse method for radio occultation measurements of temperature, humidity, and surface pressure. J. Geophys. Res. Atmos. 2000, 105, 17513–17526. [Google Scholar] [CrossRef]
- Hersbach, H.; Bell, B.; Berrisford, P.; Hirahara, S.; Horányi, A.; Muñoz-Sabater, J.; Nicolas, J.; Peubey, C.; Radu, R.; Schepers, D.; et al. The ERA5 global reanalysis. Q. J. R. Meteorol. Soc. 2020, 146, 1999–2049. [Google Scholar] [CrossRef]
- Durre, I.; Yin, X.; Vose, R.S.; Applequist, S.; Arnfield, J. Enhancing the Data Coverage in the Integrated Global Radiosonde Archive. J. Atmos. Ocean. Technol. 2018, 35, 1753–1770. [Google Scholar] [CrossRef]
- Katrin, L.; Neill, B.; Elias, H.; Sean, H. Assimilating Spire and COSMIC-2 Data into the IFS; ECMWF Newsletter: Reading, UK, 2021. [Google Scholar]
- Spire Global, Inc. Orbital Debris Assessment Report (ODAR) 2020; Spire Global, Inc.: Vienna, VA, USA, 2020. [Google Scholar]
- Schreiner, W.S.; Weiss, J.P.; Anthes, R.A.; Braun, J.; Chu, V.; Fong, J.; Hunt, D.; Kuo, Y.-H.; Meehan, T.; Serafino, W.; et al. COSMIC-2 Radio Occultation Constellation: First Results. Geophys. Res. Lett. 2020, 47, e2019GL086841. [Google Scholar] [CrossRef]
- Sokolovskiy, S.V.; Schreiner, W.S.; Zeng, Z.; Hunt, D.C.; Kuo, Y.H.; Meehan, T.K.; Stecheson, T.W.; Mannucci, A.J.; Ao, C.O. Use of the L2C signal for inversions of GPS radio occultation data in the neutral atmosphere. GPS Solut. 2014, 18, 405–416. [Google Scholar] [CrossRef][Green Version]
- Jing, X.; Ho, S.-P.; Shao, X.; Liu, T.-C.; Chen, Y.; Zhou, X. Spire RO Thermal Profiles for Climate Studies: Initial Comparisons of the Measurements from Spire, NOAA-20 ATMS, Radiosonde, and COSMIC-2. Remote Sens. 2023, 15, 3710. [Google Scholar] [CrossRef]
- Sokolovskiy, S.; Schreiner, W.; Weiss, J.; Zeng, Z.; Hunt, D.; Braun, J. Initial assessment of COSMIC-2 data in the lower troposphere (LT). In Proceedings of the Joint 6th ROM SAF User Workshop and 7th IROWG Workshop, Helsingør, Denmark, 19–25 September 2019. [Google Scholar]
- Li, X.; Zhang, X.; Ren, X.; Fritsche, M.; Wickert, J.; Schuh, H. Precise positioning with current multi-constellation Global Navigation Satellite Systems: GPS, GLONASS, Galileo and BeiDou. Sci. Rep. 2015, 5, 8328. [Google Scholar] [CrossRef] [PubMed]
- Paziewski, J.; Sieradzki, R.; Wielgosz, P. On the Applicability of Galileo FOC Satellites with Incorrect Highly Eccentric Orbits: An Evaluation of Instantaneous Medium-Range Positioning. Remote Sens. 2018, 10, 208. [Google Scholar] [CrossRef]


| Projection | Regular Latitude-Longitude Grid |
|---|---|
| Horizontal coverage | Global |
| Horizontal resolution | 0.25° × 0.25° |
| Vertical coverage | 1000 hPa to 1 hPa |
| Vertical resolution | 37 pressure levels |
| Temporal resolution | Hourly |
| Required variables | Specific humidity, temperature, and geopotential |
| GNSS-RO Mission | Number of Profiles | Mode | GPS | GLONASS | GALILEO |
|---|---|---|---|---|---|
| Spire | 1,663,197 | Set | 26.46% | 14.80% | 12.14% |
| Rise | 19.97% | 15.29% | 11.34% | ||
| COSMIC-2 | 1,440,424 | Set | 34.08% | 18.71% | None |
| Rise | 29.43% | 17.78% | None |
| GNSS-RO Mission | GPS | GLONASS | GALILEO | Total |
|---|---|---|---|---|
| Spire | 371 | 708 | 480 | 503 |
| COSMIC-2 | 1315 | 1210 | None | 1276 |
| COSMIC-1 | 704 | None | None | 704 [38] |
| GNSS-RO Mission | Group | ||||
|---|---|---|---|---|---|
| Spire | GPS/Set | 78.62% | 19.75% | 1.55% | 0.08% |
| GPS/Rise | 77.38% | 21.08% | 1.46% | 0.09% | |
| GLONASS/Set | 78.29% | 20.16% | 1.49% | 0.06% | |
| GLONASS/Rise | 74.31% | 23.93% | 1.64% | 0.12% | |
| GALILEO/Set | 79.05% | 19.29% | 1.56% | 0.10% | |
| GALILEO/Rise | 73.29% | 24.57% | 2.02% | 0.12% | |
| Total | 76.60% | 22.20% | 1.07% | 0.13% | |
| COSMIC-2 | GPS/Set | 79.20% | 19.87% | 0.90% | 0.03% |
| GPS/Rise | 75.34% | 23.61% | 1.01% | 0.04% | |
| GLONASS/Set | 78.21% | 20.57% | 1.02% | 0.21% | |
| GLONASS/Rise | 75.09% | 23.62% | 1.21% | 0.08% | |
| Total | 78.12% | 20.79% | 1.01% | 0.08% |
Disclaimer/Publisher’s Note: The statements, opinions and data contained in all publications are solely those of the individual author(s) and contributor(s) and not of MDPI and/or the editor(s). MDPI and/or the editor(s) disclaim responsibility for any injury to people or property resulting from any ideas, methods, instructions or products referred to in the content. |
© 2023 by the authors. Licensee MDPI, Basel, Switzerland. This article is an open access article distributed under the terms and conditions of the Creative Commons Attribution (CC BY) license (https://creativecommons.org/licenses/by/4.0/).
Share and Cite
Qiu, C.; Wang, X.; Zhou, K.; Zhang, J.; Chen, Y.; Li, H.; Liu, D.; Yuan, H. Comparative Assessment of Spire and COSMIC-2 Radio Occultation Data Quality. Remote Sens. 2023, 15, 5082. https://doi.org/10.3390/rs15215082
Qiu C, Wang X, Zhou K, Zhang J, Chen Y, Li H, Liu D, Yuan H. Comparative Assessment of Spire and COSMIC-2 Radio Occultation Data Quality. Remote Sensing. 2023; 15(21):5082. https://doi.org/10.3390/rs15215082
Chicago/Turabian StyleQiu, Cong, Xiaoming Wang, Kai Zhou, Jinglei Zhang, Yufei Chen, Haobo Li, Dingyi Liu, and Hong Yuan. 2023. "Comparative Assessment of Spire and COSMIC-2 Radio Occultation Data Quality" Remote Sensing 15, no. 21: 5082. https://doi.org/10.3390/rs15215082
APA StyleQiu, C., Wang, X., Zhou, K., Zhang, J., Chen, Y., Li, H., Liu, D., & Yuan, H. (2023). Comparative Assessment of Spire and COSMIC-2 Radio Occultation Data Quality. Remote Sensing, 15(21), 5082. https://doi.org/10.3390/rs15215082