1. Introduction
New England salt marshes are important environments that provide many services to the surrounding landscapes and to humans [
1,
2,
3]. Under the correct geographic, salinity regime, and tidal amplitude conditions [
4,
5,
6], these environments are known to support strong biodiversity because they provide habitat and nurseries to many fish, crustacean, bird, and mammal species [
7,
8,
9]. The salt marsh functions of stabilizing soils, buffering waves, and absorbing energy and flooding from storms and storm surges help to protect the local ecosystem and terrestrial coastlines [
10,
11,
12,
13]. These ecosystems are also known for their ability to trap sediments and filter pollutants, keeping coastal waters clear for plants and animals to thrive [
14,
15]. Furthermore, salt marshes can be sinks in the global carbon cycle because they generate peat [
16].
But, these environments and the services they provide are under an ongoing threat because of many natural and anthropogenic drivers [
12,
17,
18]. Over the past century, from 1900 to 2010, it is estimated that global mean sea levels have risen between 0.17 and 0.21 m [
19] and are expected to continue to increase by 0.09–0.18 m by 2030, by 0.15–0.38 m by 2050, and from 0.3 to 1.3 m by 2100 [
20]. As sea levels continue to rise, shifts from less to more flood-tolerant plant species within salt marshes are being recorded [
18]. These shifts in plant species could eventually lead to the conversion of these ecosystems to mudflats [
21]. Though historical measures of loss have been difficult to calculate because of changing definitions of what constitutes a salt marsh and a lack of consistent baseline data [
22], some losses have been correlated to coastal county population densities [
23]. Additionally, the input of excess nitrogen loads from agriculture upstream of salt marshes has been shown to create hypoxic regions downstream, called “dead zones”, where all the plant and animal species die off [
17,
24]. Furthermore, the creation of infrastructures, such as road crossings, dikes, dams, berms, or tidal gates, causes tidal restrictions that convert upriver salt marshes to freshwater marshes [
25,
26,
27], allow for the invasion of common reed (
Phragmites australis) monocultures [
28], and bring about the subsidence of marshes due to increased oxidation rates that lead to higher decomposition rates [
29]. These tidal restrictions can also acidify marsh soils, which can reduce primary production [
30] and reduce the creation of peat for wetland maintenance, thus putting restricted marshes at higher risk of rises in sea level [
31].
These drivers influence changes in water, soil, and light growing conditions across the marshes, affecting the competitive advantages and disadvantages of the plant species that live there. Different tolerances to variables, such as tidal flooding [
32,
33,
34,
35], saline conditions [
36,
37], nitrogen deprivation [
38,
39], oxygen deprivation [
40], and light deprivation [
41], create vegetation zones that support the growth of particular species while excluding others. For instance, the spatial distributions of common native marsh plant species, such as saltmarsh cordgrass (
Spartina alterniflora), salt hay (
Spartina patens), and blackgrass (
Juncus gerardii), are influenced by their susceptibilities to tidal flooding. [
42,
43,
44,
45,
46]. The ability of
Spartina patens to hold less oxygen in its shoots and roots during flooding conditions contributes to why
Spartina patens vs.
Spartina alterniflora does not grow well in regularly flooded low-marsh areas [
40]. Instead, the existence of hyper-saline conditions due to evaporation that is common to the middle of high-marsh areas favors
Spartina patens over other species that are less tolerant to these conditions [
37]. Additionally, the limited nitrogen environment of the high marsh makes it difficult for smooth cordgrass (
Spartina alterniflora) to colonize this area unless influxes of nitrogen occur [
47]. Furthermore, the introduction of the invasive species
Phragmites australis within some salt marshes provides an example of how tall salt marsh plants can deprive their competition of the light needed for photosynthesis and growth [
41].
Remote sensing provides a means to monitor and map vegetation species within salt marshes, but there are many options available to implement this technology [
22,
48,
49,
50,
51,
52,
53]. The remote sensing of salt marshes has typically been completed using satellite or aerial platforms. However, low-spatial-resolution (30 m) Landsat satellite-derived imagery tends to have pixel sizes that are too large to capture the fine detail of narrow vegetation patch widths that are common in many salt marshes, leading to the misclassification of species or the need to create broad vegetation classes [
54,
55,
56]. Medium-spatial-resolution (10 m) satellite images, such as those from the European Space Agency (ESA) Sentinel Satellite, can map salt marsh vegetation at the species granularity (a measure of the level of class resolution from individual species to groupings of species) but might need to be corrected for tidal effects that introduce spectral noise to coastal pixels [
57]. High-spatial-resolution (<10 m) satellite imagery from commercial satellites, such as QuickBird, WorldView, and Ikonos, can be used to map local salt marshes, but these images are not always available and may be cost-prohibitive for some projects.
Modern aerial color-infrared photography, although of high spatial resolution (<10 m) [
44,
45,
58,
59,
60], usually requires their missions to be scheduled many days in advance, leaving them susceptible to changes in weather conditions. Modern high-spatial-resolution (0.3 m) color-infrared aerial imagery has been shown to be useful for mapping salt marsh vegetation species as part of the Coastal Change Analysis Program (C-CAP) [
61]. With spatial resolutions from 0.3 to 0.6 m, National Agriculture Imagery Program (NAIP) color-infrared imagery may also be useful to map salt marsh vegetation types, but this imagery is only collected once every one-to-three-year cycle [
62]. Alternatively, very high-spatial-resolution (<10 cm) multispectral imagery derived from unoccupied aerial vehicles (UAVs) (also known as unmanned aerial vehicles) can be collected multiple times during a growing season at the temporal discretion of the user [
63,
64]. This is important in coastal environments where complex factors, such as seasonal phenology, tidal cycles, and storm events, may influence the spectra of the targets being imaged [
65,
66,
67].
To date, multispectral UAV-derived imagery has been used to complement satellite imagery and aerial photography to characterize vegetation types in coastal salt marsh landscapes [
68,
69,
70]. Some researchers have also utilized multispectral and hyperspectral UAV imagery independent of satellite or aerial imagery to map the distribution of salt marsh plant species [
67,
71,
72] and other characteristics of coastal salt marshes, such as vegetation biomass [
67,
73], geomorphology [
74], or coastal processes [
53]. However, despite these recent advances in remote-sensing applications, limited research focuses on how spectral, elevation, and temporal characteristics of UAV imagery affect vegetation classification accuracies within these landscapes.
Thus, the innovative goal of our research was to test how various combinations of spectral, elevation, and temporal characteristics of UAV-derived remotely sensed imagery affect the accuracy of plant species classifications within a salt marsh. In doing so, we sought to build upon previous research to guide our work. Schmidt and Skidmore (2003) [
58] and Belluco et al. (2006) [
49], when assessing in-field hyperspectral measurements and a series of varying-resolution remotely sensed satellite image products, concluded that improving spatial resolution is more important than improving spectral resolution for classifying salt marsh plant species. These findings suggest the potential of UAV-derived imagery for classifying salt marsh species accurately because UAV-borne cameras can capture their data at a very high spatial resolution (<10 cm) [
75,
76]. Also, because Artigas and Yang (2006) [
77] showed that salt marsh species are distinct in the near-infrared region of the electromagnetic spectrum by assessing in-field hyperspectral measurements, we looked to test if UAV remotely sensed imagery inclusive of a near-infrared band would improve the imagery’s classification accuracies. Additionally, as Lee and Shan (2003) [
78] showed that adding an elevation data layer to 3 m spatial-resolution Ikonos satellite imagery increased the accuracy of vegetation classes that had similar spectral characteristics, we looked to test if adding an elevation layer to centimeter-level spatial-resolution UAV imagery would increase its classification accuracies as well. Because UAV imagery can be processed with a photogrammetry technique called “Structure from Motion” (SfM) to generate X-, Y-, and Z-coordinate point clouds and subsequently interpolated digital elevation models (DEMs) [
74,
79], we looked to complete this processing within our study to establish an elevation layer needed for testing. Furthermore, as Gilmore et al. (2010) [
59] have shown evidence that the spectral reflectance of marsh plant species varies seasonally within hyperspectral in-field samples and Artigas and Yang (2006) [
77] provided empirical observations that marsh plant species are most distinctive to the human eye during the fall season, we looked to assess if the classification accuracy of UAV imagery in late summer and early fall seasons will vary within our study areas as well. Previous studies have already established that UAVs can capture single- or multi-date imagery [
63,
64]. Accuracy assessments of classified imagery have historically been completed by first collecting observations at ground reference points and comparing those observations to spatially and temporally concurrent classifications. Plant species reference observations have historically been collected through in-person ground-truth species identification or remote air-truth species identification within high-spatial-resolution imagery [
68,
80].
The objectives of our work were the following: First, both Red, Green, Blue (RGB) camera and Red, Green, Near-Infrared (RGN) camera salt marsh image classifications would be created and assessed to determine how their accuracies differed. Second, salt marsh image composites with and without an additional elevation layer would be created and assessed to determine if the new layer altered the accuracies of the classifications. Third, all these classifications would be created and their accuracy assessed over a time series of unique dates during late summer and early fall to determine how they differed seasonally from each other.
Thus, based on the findings of previous research literature, our project goal, and the intended objectives of this study, we hypothesized that:
Using UAV imagery inclusive of a near-infrared band would improve vegetation classification total accuracies over those of true-color imagery alone within our study areas;
Adding a DEM layer to UAV-derived imagery band combinations over our study areas would improve the imagery’s classification total accuracies;
UAV-derived vegetation classification total accuracies would vary during the late summer and early fall within our study areas.
4. Discussion
4.1. Classification Total Accuracies
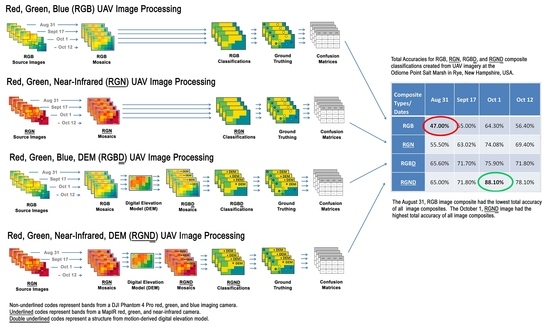
Within our research, we utilized a UAV to acquire aerial imagery for classifying and mapping the locations of plant species across a salt marsh environment. The use of <3 cm very high-spatial-resolution imagery enabled us to map the fine detail of narrow vegetation patch widths that are common within salt marshes. Our results showed that the 1 October RGND composite created from our UAV-derived imagery yielded the best total accuracy of 88.1% when classifying seven vegetation types across New Hampshire salt marsh study area 1 and 85.13% in study area 2.
4.1.1. Total Accuracies Relative to Other UAV Salt Marsh Vegetation Classification Studies
Of the identified studies where independent UAV imagery has been used for the classification of salt marsh plant species to date, our total accuracies do differ [
67,
71,
72]. One study in Wadden Sea National Park, on Hallig Nordstrandischmoor Island, along the German coast of the North Sea [
71], achieved between 92.9% and 95.0% accuracies. However, the Wadden Sea National Park study utilized object-based image analysis as opposed to pixel-based analysis, as was used within our study. The Wadden Sea National Park study also classified three vegetation and five non-vegetation classes, while our study classified seven vegetation classes. Although we did not compare object versus pixel-based analysis and various vegetation class granularities, we believe that this area of study could be fruitful within our study area. A second study that took place in the Cadiz Bay wetland in southern Spain achieved a 96% accuracy [
72]. However, the Cadiz Bay wetland study used a hyperspectral camera to map four salt marsh species and one macroalga species within their study area vs. our seven vegetation species classes. Within a third study a multispectral camera and NDVI-derived layers were used for mapping the locations and seasonality of high and low salt marsh classes on Poplar Island in Maryland [
67], USA. However, within the Nardin study, no confusion matrix classification accuracies were reported. Instead, the Nardin study correlated UAV-imagery-derived normalized-difference vegetation index (NDVI) measures with vegetation characteristics collected in the field [
67].
4.1.2. Total Accuracies Relative to Other UAV Non-Salt Marsh Vegetation Classification Studies
Outside of salt marsh environments, UAVs have been shown to map species class granularities with total accuracies similar to those in our work. Lu and He (2017) [
96] utilized UAV-acquired blue, green, and near-infrared (BGN) composite imagery to map species within temperate grasslands in Southern Ontario, Canada, to an approximately 85% accuracy using an object-based classification approach. Schiefer et al. (2020) [
97] mapped forest tree species in the Southern Black Forest region of Germany with approximately 88% accuracy using UAV-acquired RGB imagery and neural networks. Neural networks rely on a training database that connects inputs to corresponding outputs that allow for the creation of complex functional relationships that are not easily envisioned by researchers [
98]. Furthermore, other studies that utilized the sub-pixel analysis of lower-resolution hyperspectral imagery and hybrid-analysis-method techniques have been shown to have 85% and 93% TAs when classifying plant species at a class-level granularity [
99,
100]. These studies differ from our work in that they used various image processing techniques in place of a simple maximum likelihood classification technique to achieve similar classification accuracies at a species granularity level. Our technique, however, utilized the addition of near-infrared (NIR) layers, digital elevation model (DEM) layers, and classification date comparisons to achieve our highest total accuracies. We speculate that a hybrid approach for utilizing NIR and DEM layers and date comparisons in conjunction with either object-based, neural-network, or subpixel-analysis techniques could provide future methods that achieve higher classification accuracies of UAV imagery for mapping salt marsh species in New Hampshire.
4.1.3. Total Accuracies Relative to Other Non-UAV Wetland Vegetation Classification Studies
With regard to non-UAV imagery, the TAs of our research approximately align with the TAs of salt marsh and other wetland classification studies that utilized lower-spatial-resolution Landsat imagery [
50,
51,
54]. However, in previous studies, the Landsat imagery that was used was only able to classify broad land-cover or vegetation classes [
50,
51,
54]. For instance, Sun et al. (2018) [
50] classified low-marsh, high-marsh, upper-high-marsh, and tidal-flat group classes using an NDVI time-series approach based on Landsat data within the Virginia Coast Reserve, USA, to achieve approximately 90% total accuracies. Harvey and Hill (2001) [
54] classified three broad tropical wetland vegetation groups using unsupervised classifications of Landsat data for an area in northern Australia to achieve from 86% to 90% total accuracies. And, Wang et al. (2019) [
51] classified eight broad land cover classes from Landsat data using random forest, support vector machine, and k-nearest neighbor machine learning algorithms for an estuary wetland in Lianyungang, China, to produce approximately 87%, 80%, and 77% total accuracies respectively. These uses of broad classifications of Landsat data speak to the findings of Belluco et al. (2006) [
49] that emphasize the importance of higher-resolution imagery for the classification of salt marsh vegetation at the species granularity level. We believe that high-resolution UAV imagery, as used in our study in place of the lower-resolution Landsat imagery as utilized in previous salt marsh studies, allowed for similar classification accuracies to be achieved within our work but at a finer species class granularity in place of broad vegetation classes. The creation of these species class granularities can help to better contribute to a finer-scale understanding of where individual species live within salt marshes and how they are changing over time. The downside to the use of UAV imagery over Landsat imagery, however, is that UAV imagery has much smaller footprints relative to Landsat imagery, thus making the process for collecting UAV imagery a more time-consuming endeavor for large-area analysis.
4.2. A Finer Discussion of CCCs, UAs, and PAs
4.2.1. A Finer Discussion of RGB Composite Classifications
Although the total accuracies (TAs) between image classification types and dates can provide an overall assessment of which image classifications are best and worst to use to monitor salt marsh species, finer assessments of cross-class confusions (CCCs), user accuracies (UAs), and producer accuracies (PAs) can provide insights into the dynamics of why classification total accuracies differ from each other. The RGB composite classifications created for study area 1 and study area 2 displayed notable instances of where SpAl and SpAl-SF had relatively high CCC percentages (
Table A1a–d and
Table A5a–c). These high confusions might be explained by the fact that these two vegetation types are variants of the same species but are usually found in different parts of a salt marsh. SpAl usually resides within a wide tidal range in the low-marsh region below the mean high-tide line. Conversely, SpAl-SF resides within a shallow tidal range in low depressions across the high marsh [
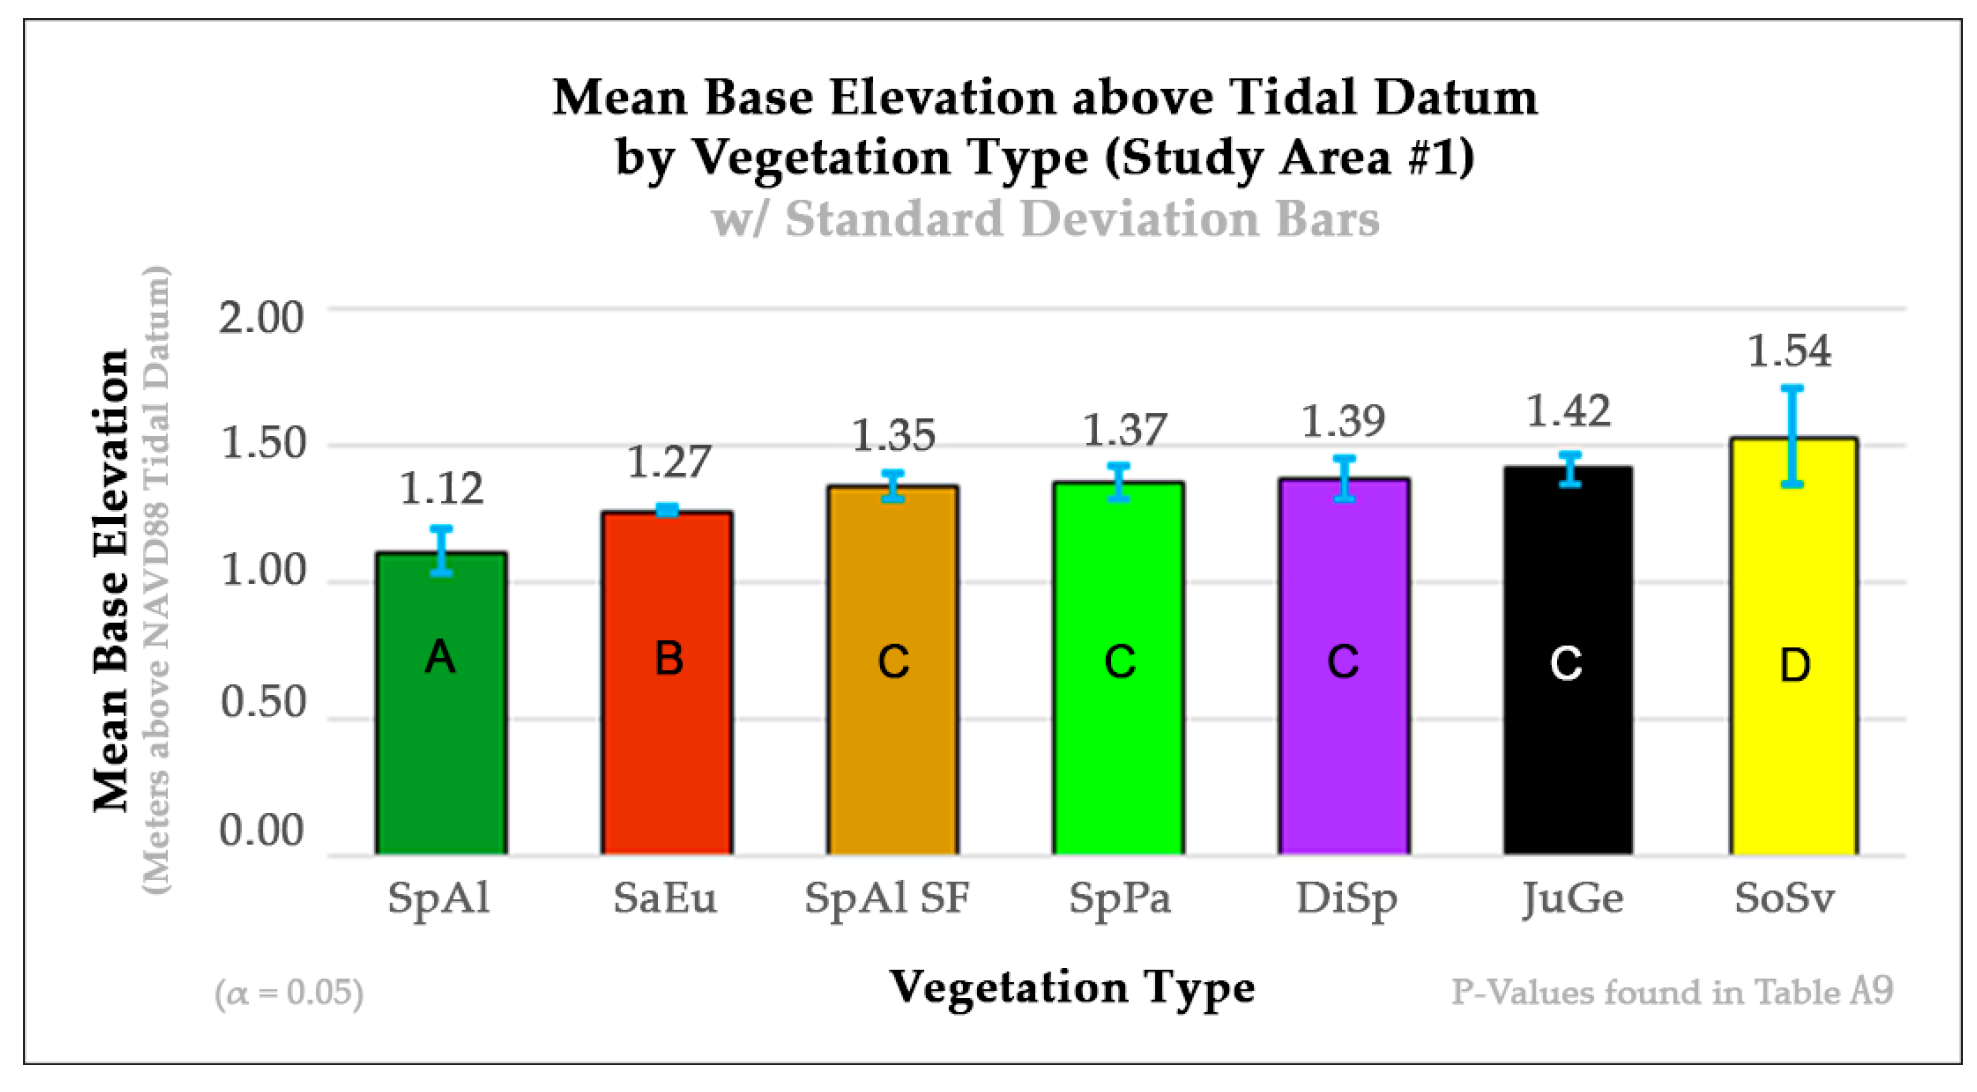
33]. The vegetation base elevation profiles created for each study area corroborate this explanation. In study area 1, SpAl had a mean base elevation of 1.12 m with a 0.076 m standard deviation, and SpAl-SF had a significantly different mean base elevation of 1.35 m with a 0.051 m standard deviation (
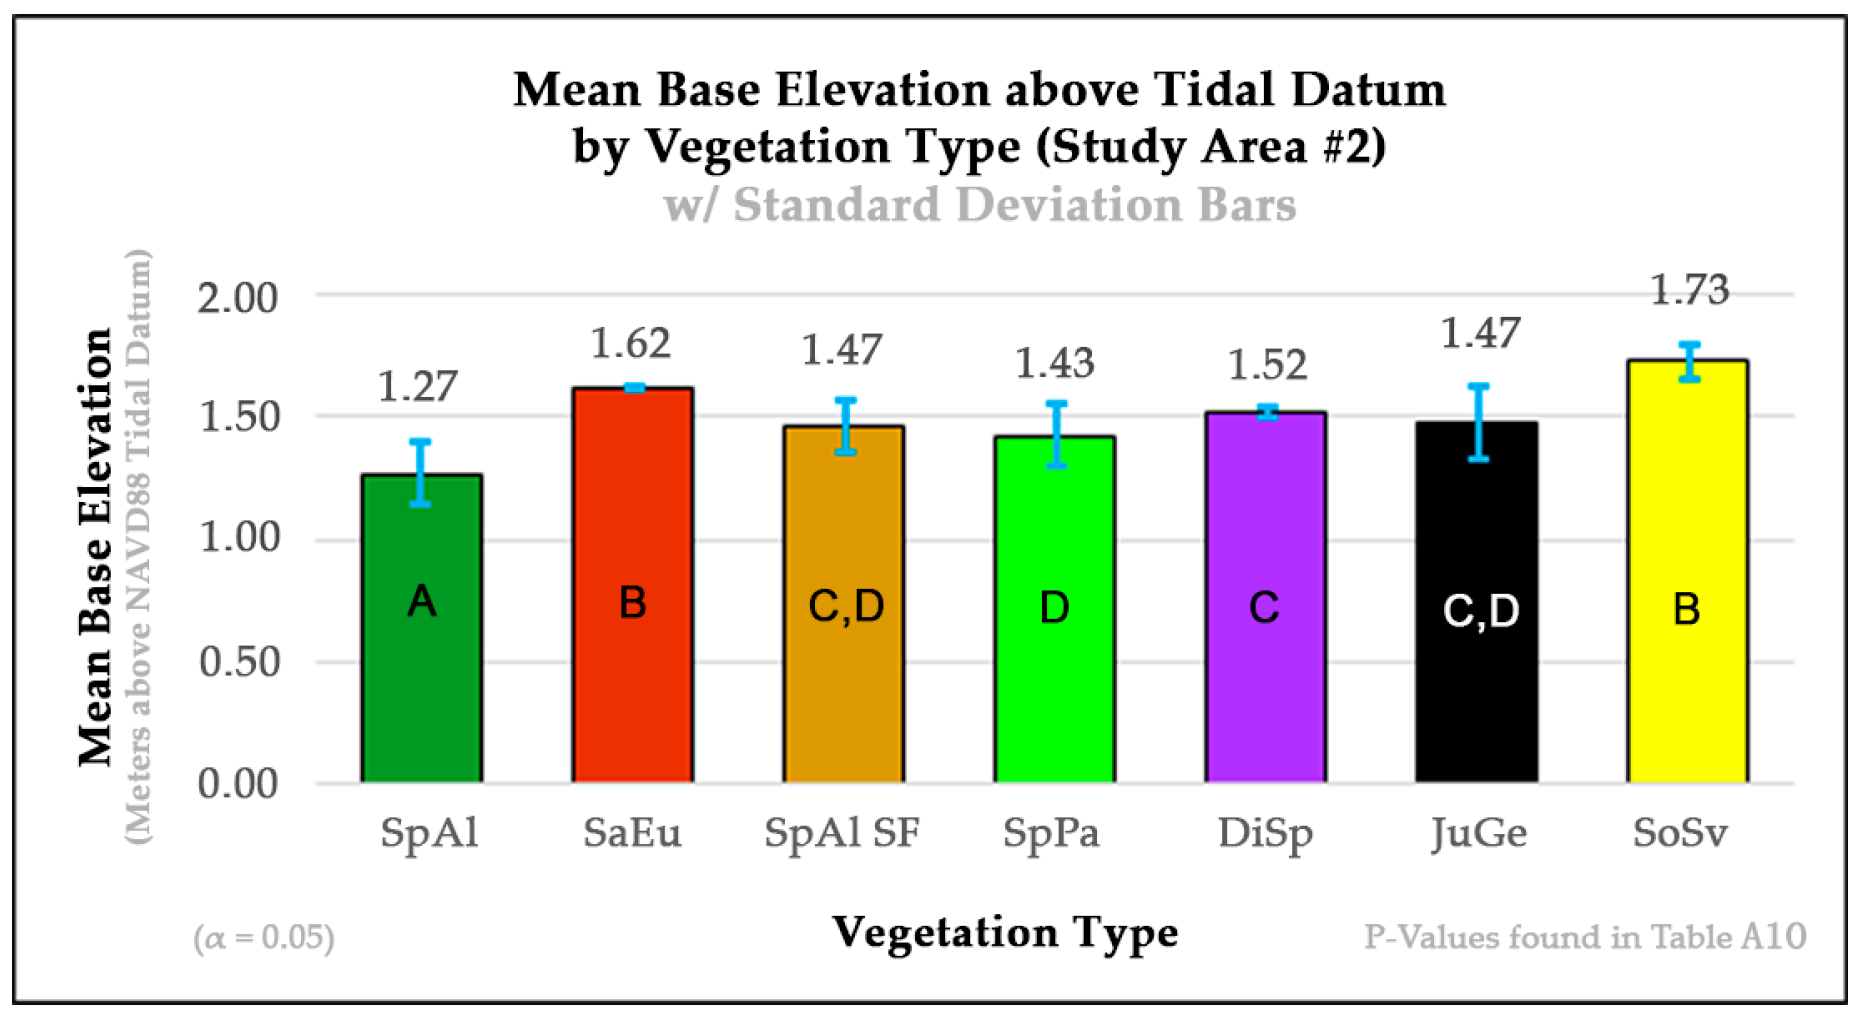
Figure 5). In study area 2, SpAl had a mean base elevation of 1.27 m with a 0.13 m standard deviation, and SpAl-SF had a significantly different mean base elevation of 1.47 m with a 0.11 m standard deviation (
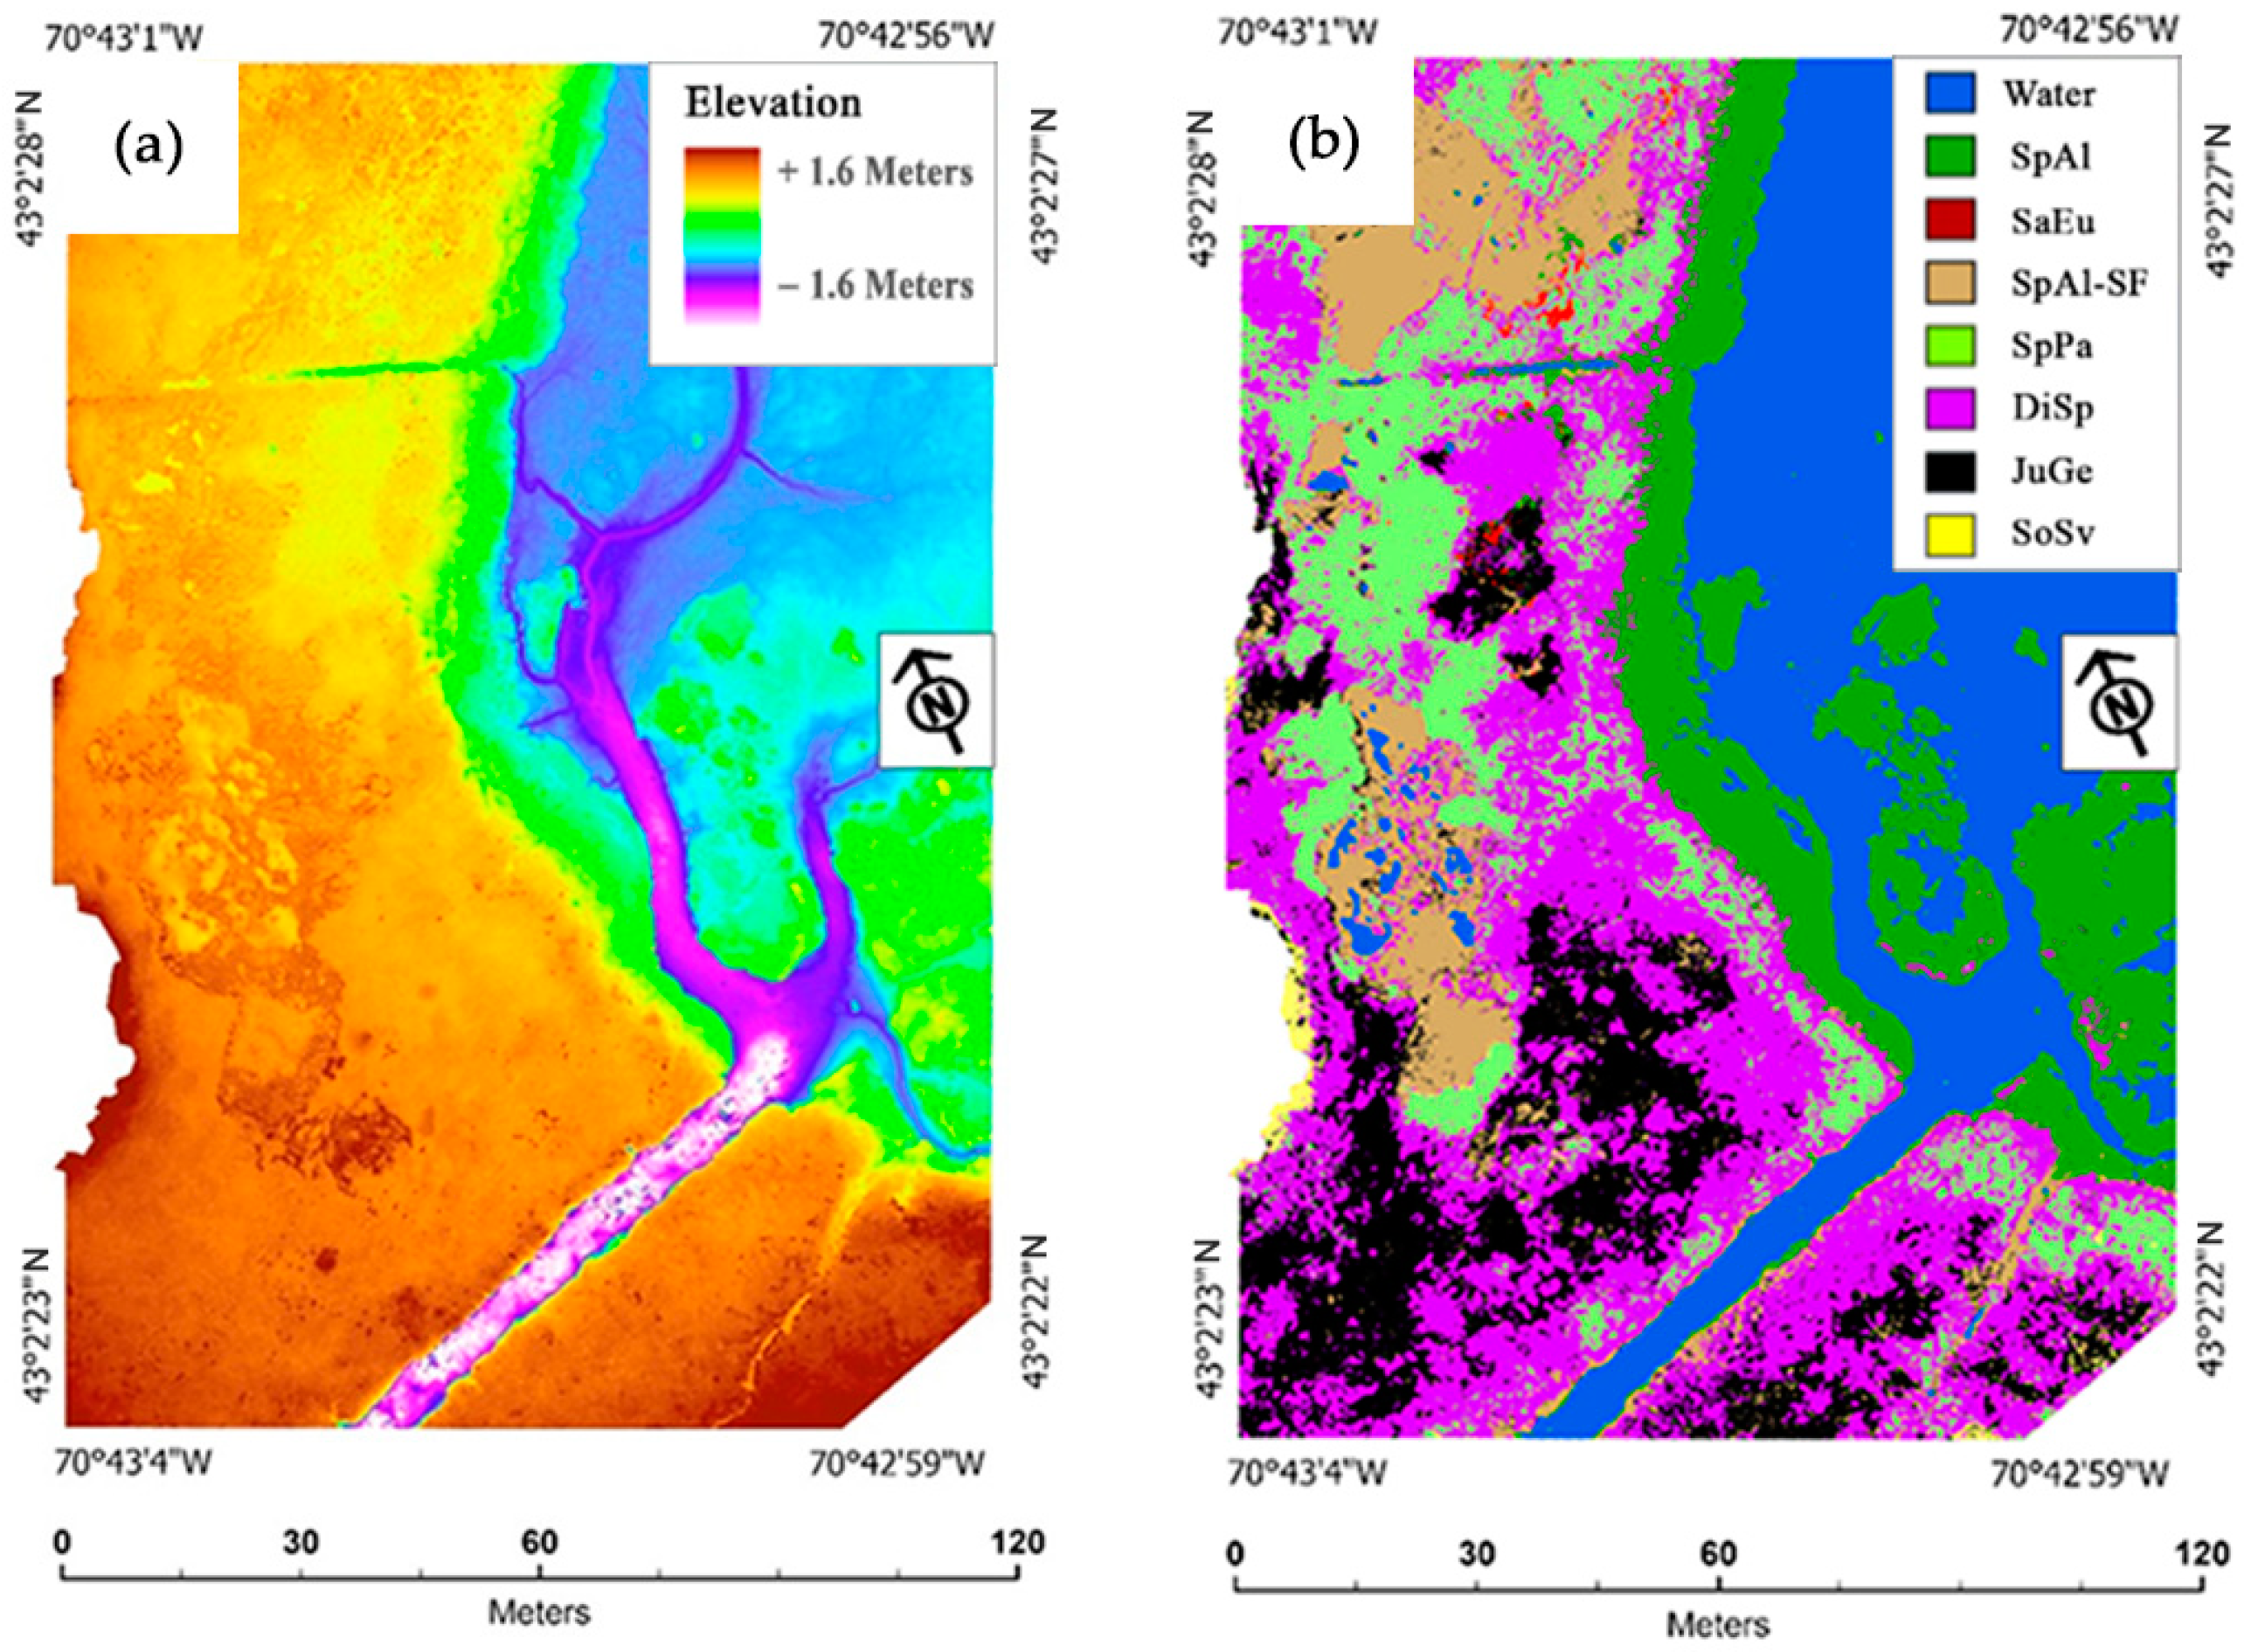
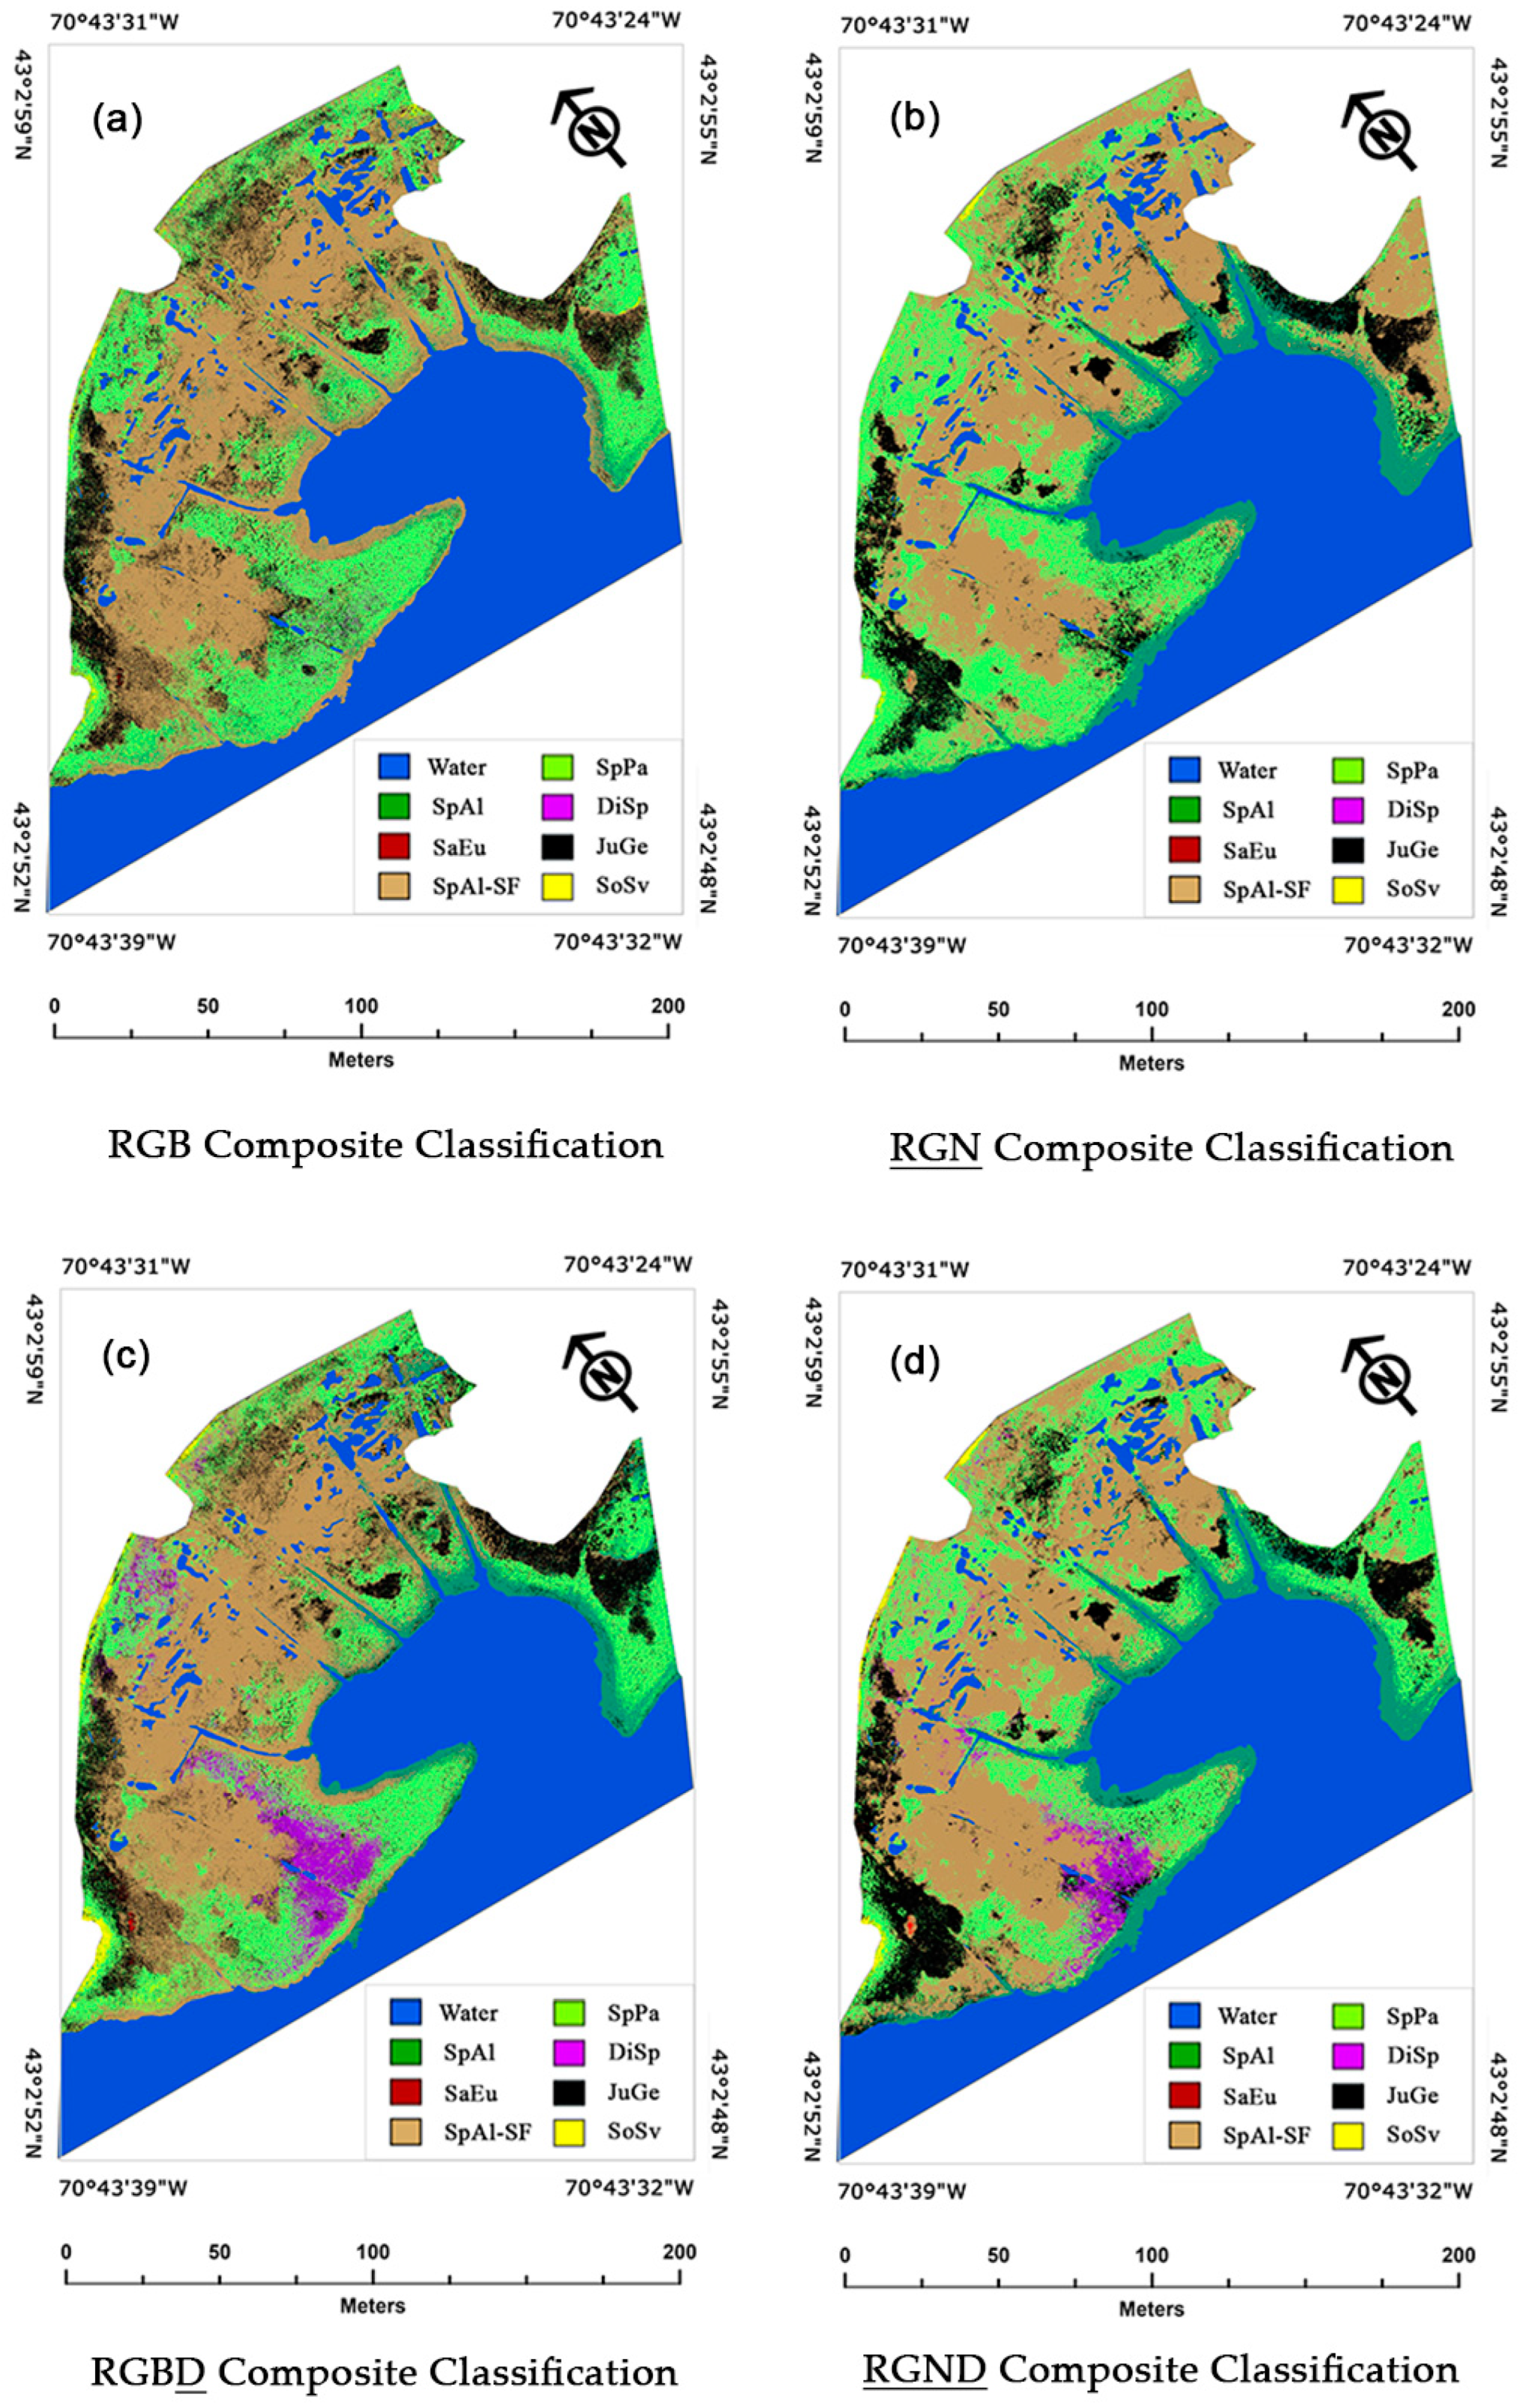
Figure 8). In study area 1, the mapping of the 1 October RGB composite classification next to the 1 October
RGND (the most accurate classification created for study area 1) provided a visual example of the large amounts of misclassified SpAl in the high marsh and misclassified SpAl-SF in the low marsh within the RGB classification (
Figure 3a,d). Likewise, in study area 2, the mapping of the 30 September RGB composite classification next to the 30 September
RGND (the most accurate classification created for study area 2) provided a visual example of the large amounts of misclassified SpAl-SF in the low marsh within the RGB classification (
Figure 6a,d).
4.2.2. A Finer Discussion of RGN Composite Classifications
The RGN composite classifications created for study areas 1 and 2 yielded higher TAs than their RGB classification counterparts (
Table 5a and
Table 6a). This result was not unexpected because Artigas and Yang (2006) [
77] showed how near-infrared segments of the electromagnetic spectrum in hyperspectral lab measurements could be useful to discriminate between prominent salt marsh species. In study area 1, the mapping of the 1 October RGB and
RGN composite classifications next to the 1 October
RGND (the most accurate classification created for study area 1) provided a visual example of how the
RGN composite, inclusive of a near-infrared band, helped to reduce the number of misclassifications between classes, such as SpPa vs. DiSp and JuGe vs. SpAl-SF, in the high marsh relative to the RGB classification (
Figure 3a,b,d). This example corresponds to a reduced CCC between the high-marsh classes, SpPa vs. DiSp and JuGe vs. SpAl-SF, within the
RGN classification confusion matrices, relative to their RGB counterparts. In study area 2, the mapping of the 30 September RGB and
RGN composite classifications next to the 30 September
RGND (the most accurate classification created for study area 2) provided a similar visual example of how the
RGN composite, inclusive of a near-infrared band, helped to reduce the number of misclassifications between classes, such as JuGe vs. SpPa and JuGe vs. SpAl-SF, in the high marsh relative to the RGB classification (
Figure 6a,b,d). This example corresponds to a reduced CCC between the high-marsh classes, JuGe vs. SpPa and JuGe vs. SpAl-SF, within the 30 September and 14 October instances of the
RGN classification confusion matrices, relative to their RGB counterparts. Within both study areas, the higher TAs, the visual improvements in high-marsh species accuracies, and the reduction in CCC between the high-marsh classes within the
RGN composite classifications over their RGB counterparts support hypothesis 1 of this research, which states that using imagery inclusive of a near-infrared band can help to improve vegetation classification accuracies over true-color imagery alone.
This assertion of hypothesis 1 for salt marshes diverges from the findings of Lisein (2015) [
101] and Grybas and Congalton (2021) [
76] when they mapped tree species. Their work showed that true-color RGB camera imagery could be more effective when mapping tree species than multispectral imagery inclusive of a near-infrared band. However, these two studies differ from our study in that their work created single classifications with imagery from multiple dates, taking advantage of the changing phenology over time to classify tree species. Within our study, we have shown that imagery inclusive of a near-infrared band favored higher total accuracies than true-color imagery alone when mapping salt marsh species per individual date. We attribute the higher accuracies obtained with the MapIR
RGN camera imagery over the accuracies obtained with the DJI RGB camera imagery because the former imagery tended to be more effective for classifying differences between the high-marsh species, SpPa vs. DiSp and JuGe vs. SpAl-SF, all of which comprised most of the vegetation cover across study area 1.
4.2.3. A Finer Discussion of RGBD Composite Classifications
The addition of an elevation layer,
D, to the RGB composites in study areas 1 and 2 also yielded higher TAs than just their RGB composites alone (
Table 5a and
Table 6a). In both study areas, the creation of the RGB
D composite classifications (
Table A3a–d and
Table A7a–c) revealed reduced CCC percentages between SpAl and SpAl-SF relative to their RGB counterparts (
Table A1a–d and
Table A5a–c). This reduction in CCC between these two spectrally similar classes is consistent with Lee and Shan’s (2003) [
78] findings that the inclusion of a digital elevation data layer within coastal IKONOS imagery can help to increase the classification accuracies of classes with similar spectral characteristics.
In study area 1, the RGB
D composites (
Table A3a–d) also yielded improved UAs and PAs for SoSv relative to their RGB counterparts (
Table A1a–d) but had less success at reducing CCCs between SpPa and DiSp, JuGe and DiSp, and JuGe and SpAl-SF. The addition of the digital elevation band,
D, to an RGB composite did more to increase accuracies in the low-marsh and terrestrial-border species of SpAl and SoSv but was not as effective at increasing accuracies between high-marsh species, such as SpAl-SF, SpPa, DiSp, and JuGe. The assessment of the vegetation base elevation marsh profile for study area 1 reveals that this might be the case because SpAl-SF, SpPa, and JuGe all reside at similar vertical base elevation ranges across the landscape, whereas SpAl resides at the statistically lower end of the base elevation profile (
Figure 5). These observations are consistent with the results of our Welch and Games–Howell test statistical analyses for study area 1 in that the base elevation of SpAl was statistically different from those of all the other vegetation types (
Figure 5). Furthermore, although the base elevation of SoSv is considered as statistically similar to those of all the high-marsh vegetation types in study area 1 (SpAl-SF, SpPa, DiSp, and JuGe), it was almost statistically different from that of SpAl-SF (
p-value 0.0772) (
Table A9), a class that the non-elevation-added
RGN classification confuses with SoSv (
Figure 3b,d). In study area 1, the mapping of the 1 October RGB and RGB
D composite classifications relative to the 1 October
RGND (the most accurate classification created for study area 1) provided a visual example of how the inclusion of the digital elevation model (DEM) improved the classification accuracies of SpAl and SoSv at the extreme ends of the salt marsh base elevation range. However, the addition of a DEM did less to improve the classification accuracies between species within the narrow elevation range of the high marsh, except for SpAl-SF, where it was confused with the spectrally similar species of SpAl and SoSv (
Figure 3a,c,d).
In study area 2, the creation of the RGB
D composite classifications (
Table A7a–c) also revealed some notable instances of reduced CCC percentages between SpAl vs. SoSv relative to their RGB counterparts (
Table A5a–c). For study area 2, the mapping of the 30 September RGB and RGB
D composite classifications relative to the 30 September
RGND (the most accurate classification created for study area 2) provides a visual example of how the inclusion of the digital elevation model (DEM) improved the classification accuracies of SpAl and SoSv at the extreme ends of the salt marsh elevation range (
Figure 6a,c,d). However, this mapping also provided a visual example of how the creation of the RGB
D classification improved the accuracies of SpPa and DiSp within the high marsh. This finding is inconsistent with that for study area 1, where the addition of a DEM to the RGB composite improved classification accuracies more within the low and terrestrial border species than on the high marsh. However, this observation is consistent with the marsh profile that we created for study area 2. The results of the Welch and Games–Howell test statistical analyses for study area 2 showed that the base elevation of SpPa was statistically different than that of DiSp (
Figure 8).
4.2.4. A Finer Discussion of RGND Composite Classifications
The
RGND composite classifications created for study areas 1 and 2 revealed improvements in TAs relative to their
RGN counterparts (
Table 5a and
Table 6a). In study area 1, the
RGND composite classifications (
Table A4a–d) also revealed improvements in both UAs and PAs in most vegetation classes relative to their
RGN counterparts (
Table A2a–d), with notably large increases in the SpAl and SoSv classes. These increases in UAs and PAs for SpAl and SoSv might also be attributed to their extreme lower and upper base elevation ranges across this project’s salt marsh elevation profile (
Figure 5). In study area 2, although there were some decreases in CCCs for SpAl vs. SpAl-SF and SpAl vs. SoSv, as was observed in study area 1, there were also some CCC decreases observed in DiSp vs. SpPa between the RGN and
RGND composite classifications that were less prevalent in study area 1. These observations are also consistent with the results of the Welch and Games–Howell test statistical analyses for study area 2, which showed that the base elevation of SpAl was statistically different from those of SpAl-SF and SoSv and that SpPa was statistically different than DiSp (
Figure 8). The mapping of the 1 October (study area 1) and 30 September (study area 2)
RGND composite classifications (the most accurate classifications created for each study area) relative to the 1 October (study area 1) and 30 September (study area 2) RGB,
RGN, and RGB
D classifications provided a visual example of how the inclusion of a near-infrared band and a digital elevation model improved the classification accuracy of species both at the extreme ends of the salt marsh elevation profile and within the more consistent elevation range of the high marsh (
Figure 3a–d and
Figure 6a–d). The higher TAs of the RGB
D and
RGND composite classifications over their RGB and
RGN counterparts and the visual and CCC improvements in the accuracy of the specific species classes in the RGB
D and
RGND classifications support hypothesis 2 of this research, providing evidence that the addition of a DEM layer to UAV-derived imagery band combinations can improve the imagery’s classification accuracy.
4.2.5. A Finer Discussion of the Salt Marsh Vegetation Elevation Profile
The salt marsh vegetation base elevation profile that we created for study area 1 (
Figure 5) and utilized within our RGBD and
RGND classifications shows roughly the same elevation order of plant species as a base elevation profile created for salt marshes within the nearby Great Bay Estuary region of New Hampshire, approximately 24 km (15 mi) up the Piscataqua River from our sampling locations [
61]. The differences between the Great Bay Estuary regional study and our study are that the Great Bay Estuary region study included low-marsh, SpAl-SF, high-marsh SpPa/DiSp, high-marsh-mix, JuGe, brackish-marsh,
Phragmites australis, and terrestrial-border-species class base elevations; whereas within our study, we parsed out the differences between the base elevations of SpAl, SaEu, SpAl-SF, SpPa, DiSp, JuGe, and SoSv from each other. With regard to the mean base elevations of species, our study area 1 species types showed upwards shifts of approximately 0.8 m (2.62 ft) in the low marsh, from 0.14 (0.45 ft) to 0.18 m (0.59 ft) in the high marsh, and 0.1 m (0.32 ft) at the terrestrial border compared to those in the Great Bay Stevens study. We suspect that the large difference between the low-marsh (SpAl) species’ mean base elevations in these two studies could be owing to an approximately 0.67 m (2.2 ft) difference in the height of the mean high tides between our study area and those at the far end of Great Bay where the Stevens study took place [
102].
The salt marsh vegetation base elevation profile that we created for study area 2 (
Figure 8) and utilized within our RGB
D and
RGND classifications did not fully follow the same elevation order of plant species as the base elevation profile created for study area 1 (
Figure 5) or that of salt marshes study within the nearby Great Bay Estuary region of New Hampshire, approximately 24 km (15 mi) up the Piscataqua River from our sampling locations [
61]. Although SpAl and SoSv were found at the extreme ends of the marsh profile as in study area 1, SaEu, SpAl-SF, SpPa, DiSp, and JuGe were ordered by mean base elevation differently from their counterparts in study area 1. We speculate that this is due to human-made changes in the elevation of the marsh caused by the creation of Rt. 1A, which contains the upper marsh border of this study area. These changes in the base elevation might have altered the freshwater inputs to the marsh, thus having effects on growing zones within the study area, but this speculation needs further study. However, alterations to fresh water inputs into coastal marsh lands have previously been shown to play a role in levels of plant stress and seed generation and growth [
103], factors that can alter plant cover. We also speculate that the Rt. 1A bridge adjacent to study area 2 may be the source of a tidal restriction that forces water to build up behind it during large ebb tides. This, in turn, may be altering the normal base elevations of growing zones within this area, but this speculation also needs further study. However, our current data show that SaEu, a plant that often can live along low-lying shallow salt pans, resided at a much higher base elevation relative to its neighboring vegetation types in study area 2 than in study area 1 (
Figure 8). Furthermore, the nearly double UAV SfM-derived DEM vertical RMS accuracy of 10.68 cm (4.2 in) in study area 2 vs. 4.60 cm (1.81 in) in study area 1 likely further confounded the study area 2
RGBD and
RGND classifications, resulting in their lower classification accuracies (
Table 5a and
Table 6a). We suspect that the differing vertical RMS results of the two study areas are due to study area 2 having a more complex landscape with more varying and steeper drop-offs at the water line and more deep holes and ditches over the landscape as compared to study area 1. The more complex ground features of study area 2, as captured from our nadir-acquired imagery, were likely harder for SfM to resolve into an accurate DEM than our less complex study area 1 ground features. Previous research shows that the capture of more complex landscapes can be better resolved, with the inclusion of both nadir and off-nadir-acquired imagery, into SfM processing [
104]. We also acknowledge that the use of an RTK positioning-enabled drone may also help to increase the RMS accuracies of the collection of future elevation layers [
105].
Despite variations in the ordering of species’ base elevations between study areas 1 and 2, they both support the influence that regular tidal flooding and the mean-high-tide (MHT) line may have on the break line between the low-marsh growing zone, dominated nearly exclusively by the species SpAl, and the high-marsh growing zone that contains the other species we studied within our research. Study area 2 has an SpAl base elevation of 1.27 m, which is 0.03 m lower than the 1.3 m MHT line recorded 4 km away at the Fort Point NOAA gauging station [
86]. Study area 1 has an SpAl base elevation of 1.12 m, which is 0.18 m lower than the 1.3 MHT line [
86] recorded 5 km away at the Fort Point NOAA gauging station [
86]. We speculate that the lower SpAl base elevation in study area 1 vs. study area 2 may be due to their differences in distance from the NOAA gauging station and the additional tidal damping effects that study area 1 may experience because it is 1 km deeper into the marsh than study area 2. However, further research also needs to be completed to test these speculations.
4.2.6. A Finer Discussion of Confusion Matrices by Acquisition Date
A review of the study area 1 and 2 confusion matrices by the acquisition date also revealed interesting findings (
Appendix A). Though UAs and PAs varied by date, in study area 1, in general, the lowest UAs and PAs were created by the 31 August classifications (
Table A1a,
Table A2a,
Table A3a and
Table A4a), and the highest were created by the 1 October classifications (
Table A1c,
Table A2c,
Table A3c and
Table A4c), with some slight variations created in the 17 September and 12 October classifications (
Table A1b,d,
Table A2b,d,
Table A3b,d and
Table A4b,d). In study area 2, in general, the lowest UAs and PAs were created by the 14 September (
Table A5a,
Table A6a,
Table A7a and
Table A8a) and October 14 (
Table A5c,
Table A6c,
Table A7c and
Table A8c) classifications, and the highest were created by the 30 September classifications (
Table A5b,
Table A6b,
Table A7b and
Table A8b). For instance, though the UAs and PAs of SaEu varied by composite type, they peaked in study area 1 within the 1 October classification (
Table A1c,
Table A2c,
Table A3c and
Table A4c) and within the 30 September classification for study area 2 (
Table A5b,
Table A6b,
Table A7b and
Table A8b). These peaks in accuracy for SaEu correspond with visual observations of when the plants’ spectral reflectance transitions in color from green to bright red within our study areas, displaying similar color characteristics as those described by Bertness (1992) [
36]. Additionally, though the UAs and PAs for SoSv were relatively poor for the RGB (
Table A1a–d and
Table A5a–c) and RGN (
Table A2a–d and
Table A6a–c) composites across all the dates, these accuracies increased within the RGB
D (
Table A3a–d and
Table A7a–c) and
RGND (
Table A4a–d and
Table A8a–c) classifications across all the dates. These findings were not unexpected, as the addition of the digital elevation model likely helped to better classify SoSv at its higher base elevation than other species in our study area. Furthermore, it is notable that the UAs and PAs for SpPa and DiSp peaked in the study area 1 (1 October) and study area 2 (30 September) RGND (
Table A1c,
Table A2c,
Table A3c,
Table A4c and
Table A8a–c) classifications. These findings correspond with in-field observations that revealed that SpPa gained a slight orange hue and DiSp gained a slight purple hue across the landscape around the beginning of October. This phenomenon was the most evident in larger homogeneous patches of the two species. These findings help to support that the spectral reflectance of the marsh species assessed within our study varies through late summer and early fall. These are in line with the in-field hyperspectral analysis findings of Gilmore et al. (2010) [
59] but vary somewhat from the findings of Nardin et al. (2021) [
67], which showed seasonal color variability within low-marsh species in the fall but persistent green foliage in the high-marsh species, SpPa (also known as
Sporobolus pumilus in their study), at the same time of the year in Maryland, USA. With this said, relatively high CCC percentages between our SpPa and DiSp classes for the 1 October (study area 1) and 30 September (study area 2) RGND composite (
Table A4c and
Table A8b) reveal the difficulty in accurately classifying these species, even at this time of the year, within our study areas. Although Artigas and Yang (2006) [
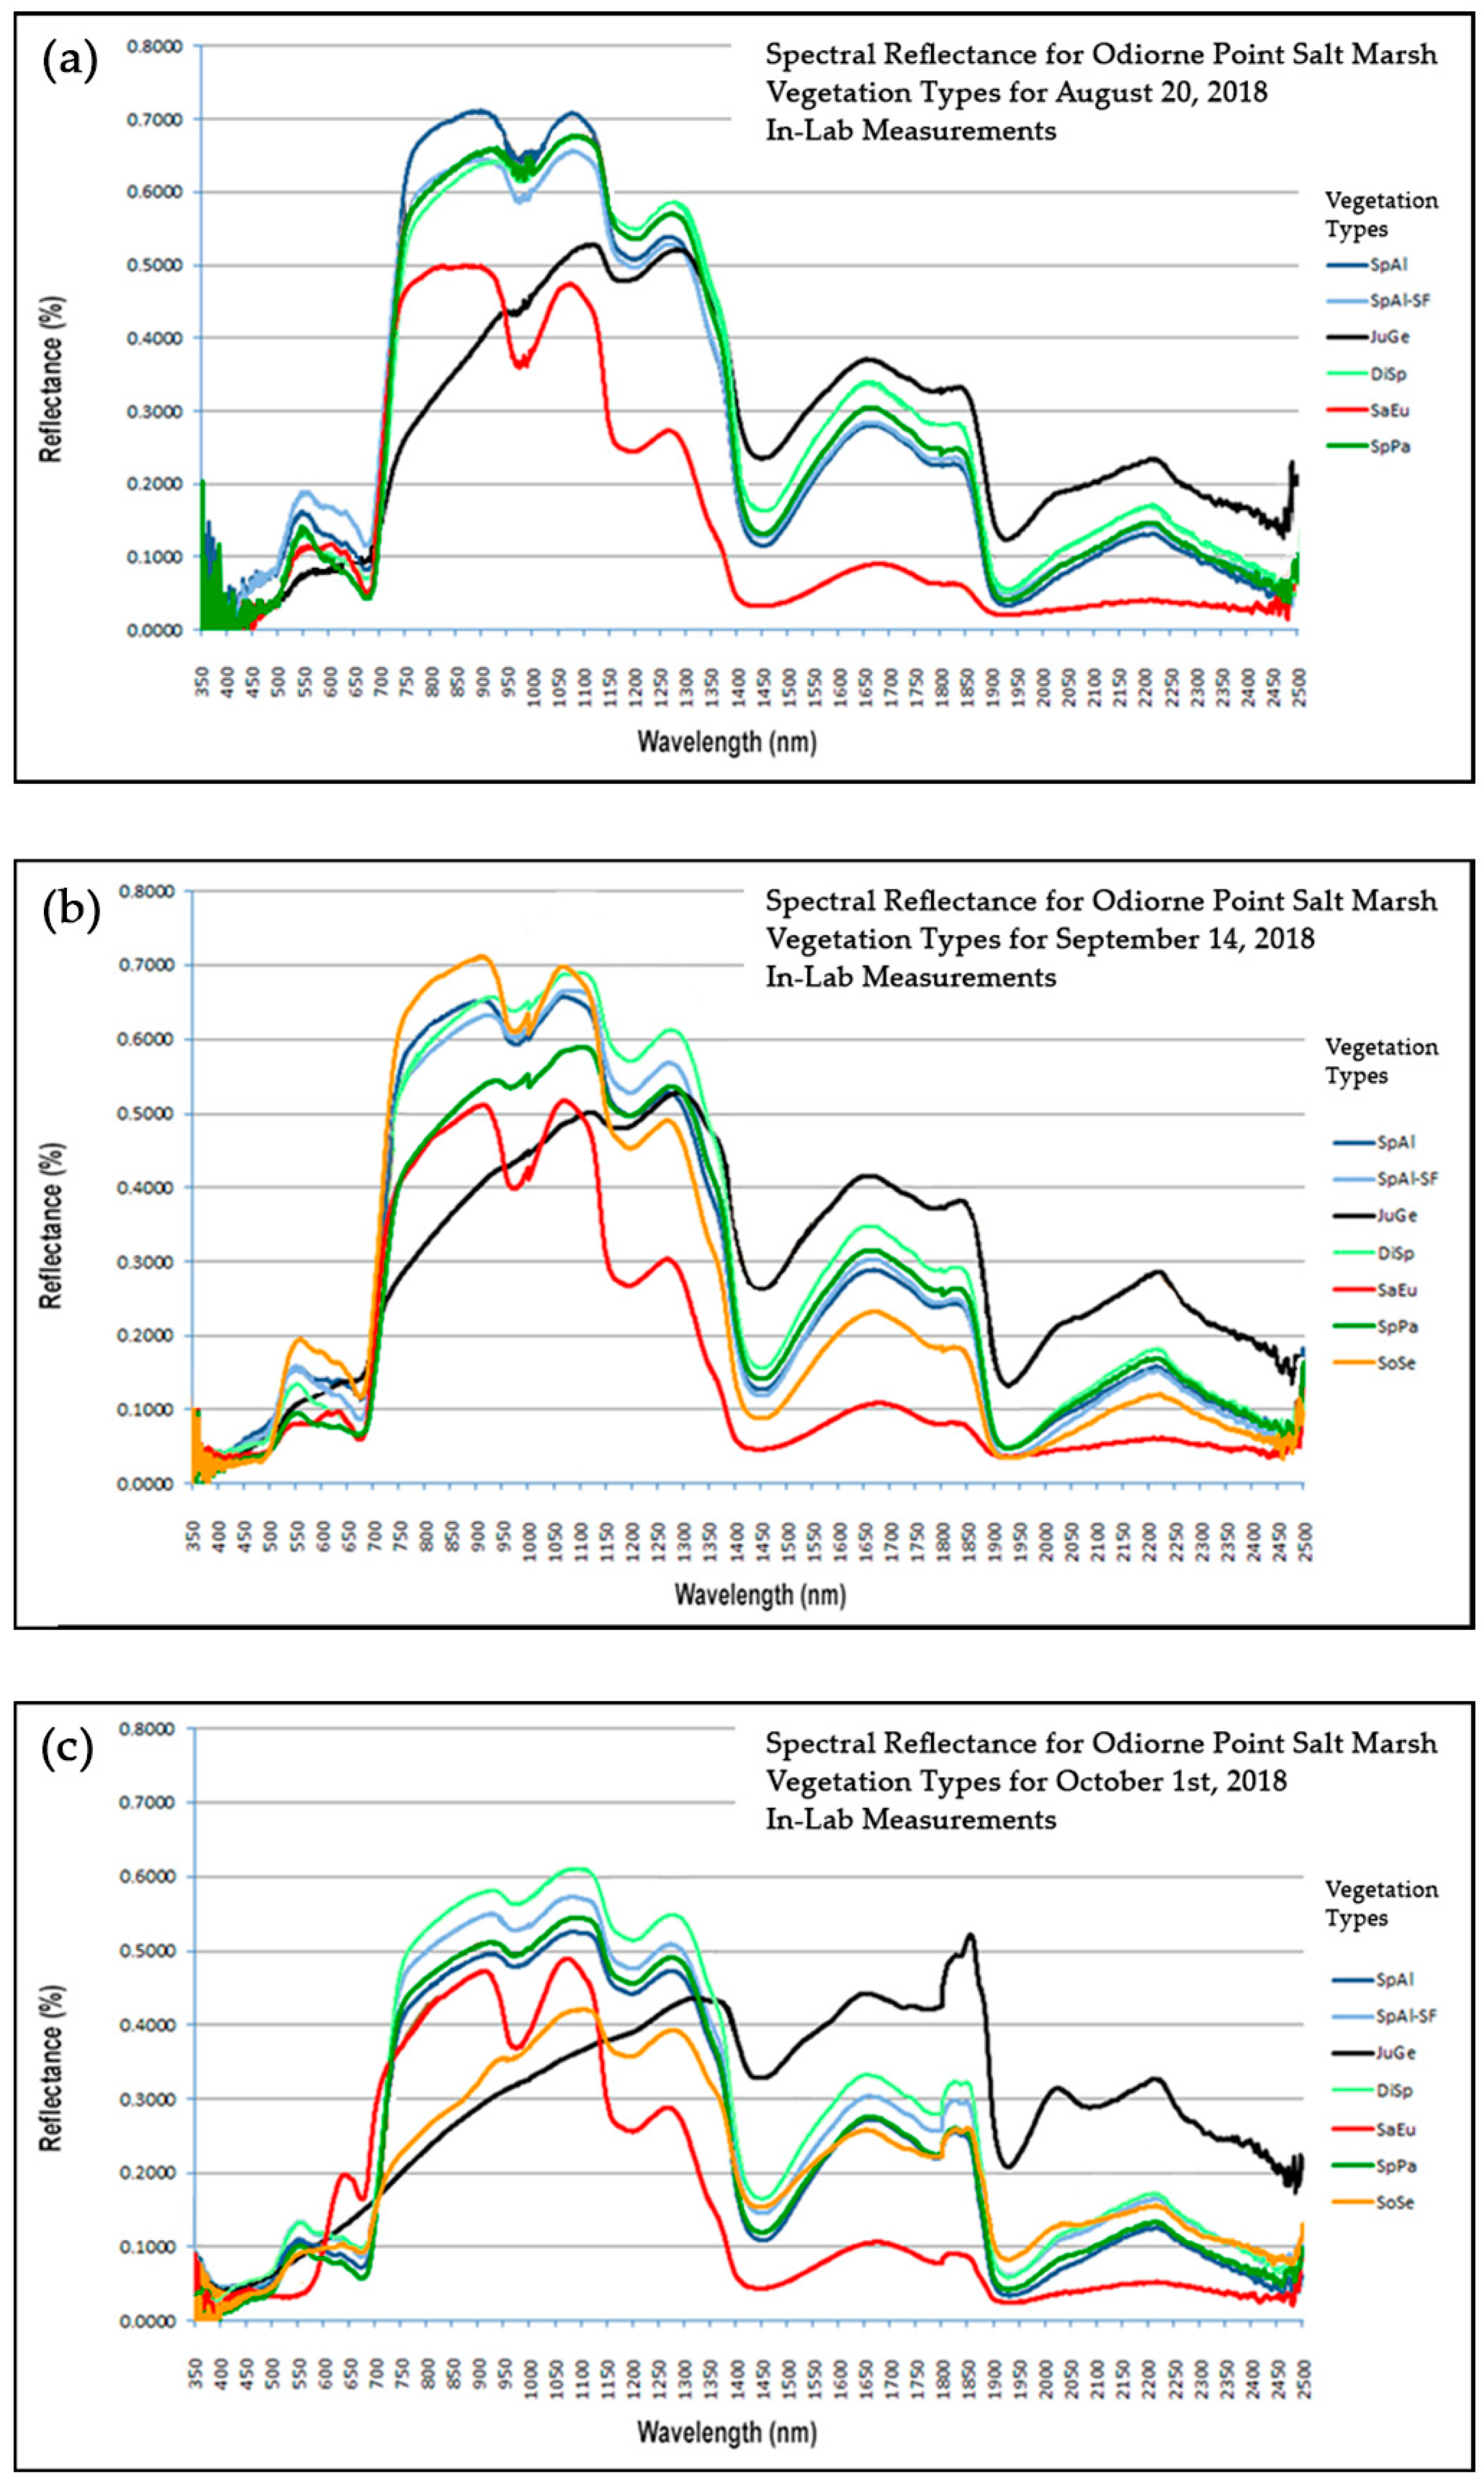
77] showed that hyperspectral lab measurements of SpPa and DiSp were more successfully discriminated with the use of near-infrared bands than blue and green bands, we believe that the interwoven co-habitation of these two species in parts of the study area probably confused the maximum likelihood classifier. The calculation of varying TAs, UAs, and PAs occurring across the time period of our study supports hypothesis 3 of this research that UAV-derived vegetation classification total accuracies within our study areas will vary over late summer and early fall. Closer assessments also show that there are variations in user, producer, and CCC accuracies between the classification dates. Furthermore, the variations in the separation of our species spectral curves over late summer and early fall (
Figure 2a–c) imply that our project’s classifier capability to render accurate classifications will vary as well, further providing support for hypothesis 3 of this research.
4.3. Methodological Limitations and Next Steps
Within this research, our methodologies utilized a low-cost consumer-grade DJI Phantom 4 Pro UAV equipped with a fixed DJI, red, green, and blue (RGB) camera and a low-cost MapIR, red, green, and near-infrared (RGN) Survey 3 camera for imagery capture. This equipment was used to stay within our project budget and assess the potential of these low-cost sensors for producing accurate classifications. However, this methodology did introduce limitations to our study. For instance, the DJI and MapIR cameras utilized different focal lengths and, thus, produced different pixel sizes. Additionally, although the DJI camera does not have published spectral ranges for its bands, it is possible that its red and green bands do not have the same spectral range as those of the same bands of the MapIR camera. These differences in the characteristics of the two cameras may have influenced the outcomes of our classifications and our accuracy assessments. Thus, they might be a commentary on the cameras’ effectiveness and not just the broad spectral bands they measured. However, with the MapIR camera composite classifications outperforming the DJI camera composite classifications, it is clear that classification accuracies can be significantly improved for only a $400 MapIR camera upgrade. More expensive alternatives to our two-camera approach may include multispectral sensors that capture blue, green, red, and near-infrared bands within the same camera, such as MicaSense cameras ranging from ~$5000 to $12,000. These cameras also provide a downwelling light sensor to compensate for changes in light conditions during a mission, a capacity we could not take advantage of within our study. Furthermore, although not used within our assessment, spectral indices, such as the normalized difference vegetation index (NDVI), could have been created from in situ bands for further testing. However, for this study, we looked to maintain band independence between the layers within our composites so that we could compare how the use of only the basic spectral bands affected composite classification accuracies. However, we do recognize that the assessment of such indices for salt marsh classification accuracies may be fruitful for future research.
Another limitation of our work is that we only utilized two small patch areas within a single salt marsh along the New Hampshire seacoast. This begs the question of how scalable our results are relative to the larger New Hampshire salt marsh system. Although our work only assessed seven dominant plant species within our study areas, our research has demonstrated the ability of our spectral band, elevation layer, and collection date combinations to distinguish specific species from one another. For instance, the use of a DEM layer allowed SpAl vs. SpAl-SF and SpAl vs. SoSv to be more easily distinguished from each other. The use of a NIR layer also allowed for better distinctions between high-marsh species, such as SpPa, DiSp, and JuGe, vs. the low-marsh species SpAl. As these species are prominent throughout many New Hampshire seacoast salt marshes, our research provides a strong foundation for the applicability of our results to other New Hampshire salt marshes. However, varying levels of spectral separability, due to the introduction and mixture of other species within other salt marshes, may alter salt marsh vegetation classification accuracies.
Additionally, although we did not compare object- versus pixel-based analysis and various vegetation class granularities within our research, we believe that these areas of study could be fruitful within our study area and warrant future investigations. Furthermore, because tidal and precipitation effects highly influence our study areas, future work is needed to better compensate for the varying effects of moisture within these landscapes.
