Abstract
To explore the degree of constraint by Global Navigation Satellite System (GNSS) and Interferometric Synthetic Aperture Radar (InSAR) data on the Maduo earthquake within a layered earth model structure and to gain an insight into the seismogenic mechanism and the seismic risk in the surrounding area, this study employs D-InSAR technology to acquire the InSAR co-seismic deformation field of the Maduo earthquake on 22 May 2021. Utilizing both GNSS and InSAR data, the inversions constrained by single and joint data are conducted and compared to determine the co-seismic slip model and fault plane stress distribution of the Maduo earthquake. Additionally, this paper calculates the Coulomb stress changes induced by 14 M ≥ 7 strong earthquakes, considering co-seismic effects, post-seismic viscoelastic relaxation, and inter-seismic tectonic stress loading, on 19 fault segments within the Bayan Har block research area (96°E~106°E, 29°N~36°N) since 1900. The findings are as follows: (1) The maximum line-of-sight (LOS) deformation was approximately 0.9 m. The joint inversion rupture was primarily located in the Dongcao Along Lake section (~98.6°E), aligning with previous research outcomes. (2) The cumulative Coulomb stress at the Maduo earthquake’s source location was −0.1333 MPa, while the inter-seismic stress loading amounted to 0.0745 MPa. The East Kunlun Fault, Maduo–Gande Fault, Ganzi–Yushu Fault, and Dari Fault C exhibited considerable stress loading, warranting attention due to heightened seismic risk. (3) Based on three different co-seismic slip models, the stress disturbance results caused by the Maduo earthquake to the surrounding area and fault did not differ significantly. After the earthquake, the seismogenic fault still has high seismic risk.
1. Introduction
According to the determination of the China Earthquake Networks Center (CENC), an MW7.4 earthquake struck Maduo County, Guoluo Prefecture, Qinghai Province, on 22 May 2021. The epicenter was located at coordinates (98.34°E, 34.59°N). The Maduo earthquake, occurring within the Bayan Har block, holds significant importance in comprehending the fault structure and characteristics within this block. Following the earthquake, various researchers employed different datasets to invert the co-seismic slip model of the Maduo earthquake. Previous studies primarily relied on a single data constraint or inversion under a uniform half-space earth model to determine the slip distribution of the fault plane, overlooking the consideration of crustal layered structure, which is crucial for accurate inversion. For instance, Wang et al. [1] and Wang et al. [2] utilized GNSS data to invert the co-seismic slip model under the assumption of a uniform half-space earth model. Hua et al. [3] employed InSAR data for the same purpose, also assuming a uniform half-space earth model. Yu et al. [4] and Wang et al. [5] jointly inverted the co-seismic slip distribution model of the 2021 Maduo earthquake using both GNSS and InSAR data under the uniform half-space earth model. In order to improve the accuracy of the inversion results, it is necessary to jointly invert the fault slip distribution of the Maduo earthquake based on GNSS and InSAR data in a layered half-space earth model.
The occurrence of earthquakes involves a process of stress accumulation and release, which can impact the risk associated with neighboring active faults [6]. When an earthquake occurs, it will change the stress state of the surrounding faults and then trigger or inhibit the potential seismic risk of the surrounding active faults. For example, Mildon et al. [7] evaluated the Coulomb stress transfer model and explored the stress disturbance of the L ‘Aquila 2009 earthquake on the surrounding faults. Sboras et al. [8] explored the source modeling and stress transfer scenarios of the 2020 Samos earthquake. Toda et al. [9] explored the rate/state Coulomb stress transfer model for the CSEP Japan seismicity forecast. Previous studies have primarily focused on calculating the stress disturbance of the 2021 Maduo earthquake in the surrounding area using a single fault slip model. For instance, Li et al. [10] and Liu et al. [11] used the co-seismic slip model provided by USGS to calculate the stress disturbance to the faults around the Maduo earthquake. Feng et al. [12] used the co-seismic slip model obtained by teleseismic body wave data inversion to calculate the stress loading and unloading of the co-seismic Maduo earthquake at a depth of 10 km around the fault. The co-seismic slip model of the Maduo earthquake obtained by InSAR data was used to calculate the stress disturbance to the faults around the Maduo earthquake by Hua et al. [3] and Yue et al. [13]. However, whether the fault slip model derived from different data sources can adequately explain the stress disturbance caused by the 2021 Maduo earthquake in the surrounding area remains a topic worthy of discussion.
The occurrence of earthquakes leads to adjustments in the regional stress field, encompassing changes in both co-seismic and post-seismic stress fields. When calculating the co-seismic stress field, it is commonly assumed that the crust behaves as a fully elastic medium. However, in reality, the lower crust and upper mantle exhibit viscoelastic behavior. Hence, it is essential to consider the stress field changes resulting from post-seismic viscoelastic relaxation [14,15,16]. Furthermore, the impact of inter-seismic long-term tectonic stress loading on fault stress cannot be disregarded [17,18,19]. The accumulation of negative dislocation equivalent to inter-seismic stress is a common approach for calculating inter-seismic tectonic stress. For strike-slip faults, it is believed that the deep deformation near the block boundary can be simplified as a combination of rigid block movement without strain accumulation and uniform reverse dislocation in the locked layer [20,21,22]. Assuming complete locking of the seismogenic layer, the long-term slip rate and time interval of the fault are used to represent the amount of negative dislocation, enabling the calculation of the stress field induced by inter-seismic tectonic loading using methods similar to those employed for co-seismic stress calculations [19,23]. By examining the influence of co-seismic effects, post-seismic viscoelastic relaxation, and inter-seismic long-term tectonic loading on the stress of strong earthquakes and faults, a more comprehensive analysis of the causes of strong earthquakes and the risk associated with faults can be conducted from a stress perspective.
To assess the influence of GNSS and InSAR data on the 2021 Maduo earthquake within a layered earth model structure and gain insight into the seismogenic mechanism and the vulnerability of the surrounding area, this study employs GNSS and InSAR data inversion to obtain the co-seismic slip model and fault plane stress distribution of the Maduo earthquake. Additionally, this study calculates the stress disturbance to the surrounding area based on the co-seismic slip model derived from different data sources. Furthermore, 14 strong earthquakes (M ≥ 7) in the Bayan Har block study area (96°E~106°E, 29°N~36°N) since 1900 are selected for analysis (Figure 1). Using a layered viscoelastic medium model, this study calculates the Coulomb stress evolution resulting from the co-seismic and post-seismic viscoelastic relaxation effects of these 14 historically strong earthquakes. Moreover, the study evaluates the Coulomb stress changes caused by inter-seismic tectonic stress loading for 19 fault segments, including the East Kunlun Fault Zone (F1–F6), Maduo–Gande Fault Zone (F7–F8), Dari Fault Zone (F9–F11), Qingshuihe Fault Zone (F12–F14), Ganzi–Yushu Fault Zone (F15–F16), and Kunlun Shankou–Jiangcuo Fault Zone (F17–F19). The cumulative Coulomb stress changes resulting from co-seismic, post-seismic, and inter-seismic effects on the Fault Zones are explored, providing valuable insights for assessing the future seismic risk in the area.
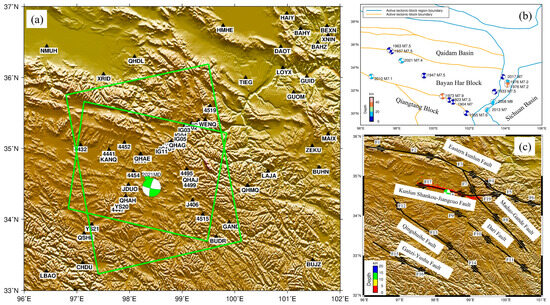
Figure 1.
Topographic map of the study region. (a) GNSS stations and InSAR data coverage area. (b) Strong earthquake distribution. (c) Distribution of faults around Maduo earthquake. The source ball represents the focal mechanism solution of strong earthquakes. The strong earthquakes are briefly represented by the year and magnitude of the earthquake, and the red point represents the distribution of aftershocks. The green solid line is the range of ascending and descending InSAR data. The black triangle is the distribution of GNSS stations. F1–F6: Eastern Kunlun Fault; F7–F8: Maduo–Gande Fault; F9–F11: Dari Fault; F12–F14: Qingshuihe Fault; F15–F16: Ganzi–Yushu Fault; F17-F19: Kunlun Shankou–Jiangcuo Fault.
2. Materials and Methods
2.1. Co-Seismic Slip Parameters of Historically Strong Earthquakes
In this paper, 14 strong earthquakes with magnitudes M ≥ 7, occurring within the Bayan Har block research area (96°E~106°E, 29°N~36°N) since 1900, have been selected. For historically strong earthquakes prior to the 2008 Wenchuan earthquake, due to limited observation data, fault structure and slip information have been obtained by referring to previous research findings [24,25,26,27,28]. In contrast, modern observation methods have been utilized to obtain detailed fault slip models for strong earthquakes occurring after the 2008 Wenchuan earthquake. These include the 2008 Wenchuan earthquake [29], the 2010 Yushu earthquake [30], the 2013 Lushan earthquake [31], and the 2017 Jiuzhaigou earthquake [32]. The focal mechanism solution for the 2021 Maduo earthquake is based on the China Earthquake Network Center, with a strike angle of 102°, dip angle of 81°, and rake angle of −11°. Specific parameters are provided in Table 1.

Table 1.
Slip parameters of strong earthquake fault. Lon: Longitude; Lat: Latitude; Dep: Depth; M: Magnitude; L: Length; W: Width.
2.2. Fault Parameter
The Maduo earthquake, a significant seismic event, occurred within the Bayan Har block. Wang et al. [33] were the first to determine that the seismogenic fault responsible for the earthquake was the Kunlun Shankou–Jiangcuo Fault Zone through precise aftershock sequence positioning. Subsequent geological emergency investigations and analysis of fault motion characteristics confirmed that the 2021 Maduo earthquake was located in the Kunlun Shankou–Jiangcuo Fault Zone, with the rupture section identified as the Jiangcuo section [34,35,36]. Consequently, this study focuses on faults situated near the 2021 Maduo earthquake within the Bayan Har block. These include the East Kunlun Fault Zone [37], the Maduo–Gande Fault Zone [38], the Dari Fault Zone [37,39], the Qingshuihe Fault Zone [40], the Ganzi–Yushu Fault Zone [41], and the Kunlun Shankou–Jiangcuo Fault Zone [37]. Specific parameters are provided in Table 2.

Table 2.
Fault parameters. Lon: Longitude. Lat: Latitude. Strike: Fault strike angle. Dip: Fault dip angle. Rake: Fault slip angle.
2.3. Inversion Data
Contemporary geodetic techniques such as Global Navigation Satellite System (GNSS) and Interferometric Synthetic Aperture Radar (InSAR) are the most direct and effective tools for observing ground displacement [42,43,44,45,46]. This paper obtained ascending and descending orbit data of the Maduo earthquake on 22 May 2021 using the Sentinel-1 IW mode. The time baseline between observations is 6 days, with the pre-seismic observation date on 20 May 2021 and the post-seismic observation date on 26 May 2021. The ascending and descending orbit data before the earthquake were acquired from Sentinel-1A IW mode, while the data after the earthquake were obtained from Sentinel-1B IW mode. The SAR image interference pairs have vertical baselines of 52 (ascending orbit) and 117 (descending orbit) (Table 3). D-InSAR processing was performed on the pre-seismic and post-seismic SAR data using GAMMA (20200728) software [47], with Shuttle Radar Topography Mission (SRTM) 90 m data used for fitting. After phase unwrapping, geocoding, and uniform sampling, a total of 1641 data points (ascending) and 1585 data points (descending) were obtained to constrain the co-seismic slip distribution of the fault plane. The maximum LOS deformation was approximately 0.9 m.

Table 3.
Parameters of Sentinel-1 SAR images. Track: Track number of SAR data. Master image: The time of the master image. Slave image: The time of the slave image. Vertical baseline: The vertical baseline of SAR image interference pair. Time baseline: The time interval of SAR images.
Within a week of the earthquake, Xiong et al. [48] promptly responded and used GAMIT/GLOBK 10.6 software to process GNSS data, resulting in co-seismic deformation measurements from 81 GNSS stations. The GPS data are processed into co-seismic deformations with software GAMIT/GLOBK 10.6 following three steps: (1) The loosely constrained daily solutions, including station coordinates, satellite orbits, and zenith tropospheric delays, are estimated using phase observations. The satellite and antenna phase-center correction model under the ITRF2014 framework is used in this procedure. (2) The loosely constrained daily solutions are combined with the solutions of the global IGS tracking stations (released by Scripps Orbital and Position Analysis Center, http://sopac.ucsd.edu/, accessed on 26 August 2023), and then the solutions are fixed to the ITRF2014 framework by coordinate similarity transformation. (3) We estimate the co-seismic displacements along with tectonic velocities using a Bayesian approach. The analysis revealed a maximum westward displacement of about 1.2 m observed at 4454 stations north of the fault line and a maximum eastward displacement of 0.7 m observed at 2836 stations south of the fault line.
2.4. Crustal Structure Model
To enhance the accuracy of inverting underground fault slip parameters, this paper employs the layered viscoelastic medium model proposed by Yue et al. [13]. Additionally, this study further utilizes the results from the USTClitho1.0 unified seismic velocity model for the mainland China lithosphere to establish stratification. This approach enables the acquisition of high-resolution three-dimensional structural models for seismic P-wave velocity (VP) and S-wave velocity (VS). The specific details are presented in Table 4.

Table 4.
Crustal structure model. Depth: Crustal depth. VP: P-wave velocities. VS: S-wave velocities. ρ: Crustal density parameters.
Considering the wide range of stress calculation and other factors, this paper selects the following crustal structure parameters in order to improve the accuracy of stress calculation. In this paper, the layered viscoelastic dislocation model is utilized. Based on several existing artificial profiles that traverse the Bayan Har block and the central and eastern regions of the adjacent area, the crustal strata above 68 km in the Bayan Har block are divided into six layers based on wave velocity [24]. The VP wave velocity ranges from 4.8 km/s to 6.85 km/s. Below 68 km, a single layer is considered, with density values referenced from Cheng et al. [49]. The viscosity coefficient for the Bayan Har block is determined based on Zhang et al. [50] and Shi and Cao [51]. The viscosity coefficient for the rock layer at a depth of 20–50 km in the crust is 6.30 × 10¹⁹ Pa·s. The viscosity coefficient for the rock layer at a depth of 50–68 km is 1.0 × 10¹⁸ Pa·s. The average viscosity coefficient below 68 km is 1.0 × 10¹⁸ Pa·s. The crustal rock layer above 20 km is partially considered an elastomer, and the Maxwell model is employed for calculations. The specific details are provided in Table 5.

Table 5.
Crustal model parameters. Depth: Crustal depth. VP: P-wave velocities. VS: S-wave velocities. ρ: Crustal density parameters. η: represents viscosity coefficient.
2.5. Method of Co-Seismic Slip Distribution Inversion
In this paper, the SDM (Steepest Descend Method) inversion algorithm is employed for the calculation of inversions [52]. This algorithm transforms the inversion equation into a minimum value problem by constructing a least squares parameter solution problem with constraints. To achieve a higher resolution of the slip distribution on the fault plane, the fault plane is discretized into multiple blocks. The selection of the optimal smoothing factor is performed using the L-shaped curve method [53,54].
In the inversion of co-seismic slip distribution, there is a linear relationship between surface co-seismic displacement and fault slip, as shown in Formula (1).
In the formula, d represents the surface deformation data, G represents the Green’s function matrix, m is the sliding parameter, and ε is the random observation error.
where α is the smoothing factor, G is Green function, d is the deformation observation value, m is the slip parameter, T is Laplace second-order smoothing matrix, and P1 and P2 are the internal observation weight matrix of actual observation data and virtual observation data. The smoothing factor α is generally determined by the compromise curve between the fitting residual and the smoothness . The compromise point is generally near the maximum curvature point of the L curve. Through experiments, the more suitable point is selected.
In this paper, we utilize the layered half-space dislocation model (Table 4) to analyze the co-seismic deformation field data from GNSS and InSAR as constraints. The geometric parameters of the co-seismic slip model, which were published by the InSAR research group at the Institute of Geology, China Earthquake Administration, are used for the inversion calculation. At present, there are different methods for determining the weight, and there is no uniqueness [55]. For example, these methods include empirical weighting [56], minimum model residual weighting [57], observation data error weighting [58], etc. Tu et al. [59] used the method of determining the final weight according to the order of magnitude when determining the weight of GNSS and InSAR data and finally achieved ideal results. In this paper, there are only 81 GNSS observation data, which are two orders of magnitude different from InSAR observation data. In order to give full play to the advantages of different data, we determine the weight according to the order of magnitude of the two data. The final weight is GNSS:InSAR = 100:1.
2.6. Method of Stress Calculation
In this paper, when calculating the change of Coulomb stress, it is necessary to determine the geometric parameters and slip of the seismogenic fault. The Coulomb stress is calculated according to the receiving fault parameters. The variation of Coulomb stress (Formula (4)) is calculated mainly based on the concept of Coulomb fracture stress (Formula (3)).
Among them, CFS is Coulomb stress, τ is shear stress, is positive stress, tension is positive, compression is negative, μ is rock friction coefficient, and P is fluid pore pressure.
The expression of the variation of static Coulomb stress is
Among them, ΔCFS is the change of Coulomb stress, is the change of shear stress, is the change of normal stress, and is the effective friction coefficient. Different studies have different values for the friction coefficient, and the commonly used value is 0.4 [60].
In this paper, an effective friction coefficient of 0.4 is chosen. The PSGRN/PSCMP code [61] is utilized to calculate the co-seismic and post-seismic Coulomb stress changes, considering a layered viscoelastic crustal structure (Table 5). For strike-slip earthquakes, it is assumed that the deep deformation near the block boundary can be simplified as a combination of rigid block motion without strain accumulation and uniform dislocation in the opposite direction within the locked layer, known as the “Negative Dislocation Theory”. The seismogenic layer is assumed to be completely locked. The inter-seismic stress accumulation is calculated based on the long-term slip rate of the fault segment and the duration of tectonic activity, utilizing the co-seismic Coulomb stress change [19]. In this study, the fault locking depth is set to 20 km. Since the seismic source in the Bayan Har block is primarily located at depths of 5–15 km, the calculated depth refers to the average depth of earthquakes in the study area, which is assumed to be 10 km.
3. Results
3.1. Co-Seismic Slip Distribution Inversion Calculation
The optimal smoothing factor is determined based on the compromise curve between model roughness and relative fitting residual (Table 6). Ultimately, the slip distribution of the Maduo earthquake fault is obtained using the layered half-space medium model (Figure 2). The results indicate a two-way rupture in the co-seismic slip model obtained through the inversion of different data sets. The rupture is primarily concentrated above 20 km, with a larger slip observed on the east side compared to the west side, consistent with existing research [2,3,12]. Figure 3 displays the distribution of stress changes calculated using GNSS, InSAR, and GNSS + InSAR data, respectively. The regions of significant stress change along the strike correspond to the extensive area of underground dislocation fracture. The variation of stress along the dip is divided into different regions, but the amplitude of variation is much smaller than that along the strike, indicating that the 2021 Maduo earthquake is primarily characterized by strike-slip faults. The distribution of normal stress variation reveals a stress enhancement area in the eastern corner of the fault.

Table 6.
Comparison of slip model results obtained by using different data inversion based on the same Fault plane.
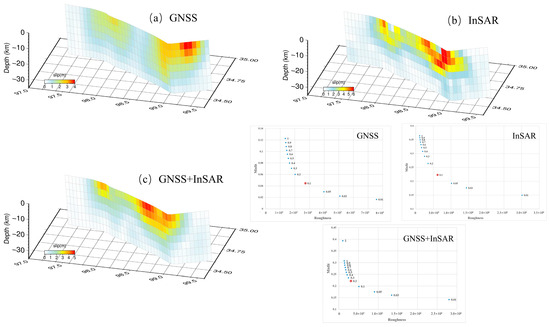
Figure 2.
Co-seismic slip distribution and tradeoff curve. The red points in the tradeoff curve represent the selected smoothing factor. (a) GNSS constrained inversion; (b) InSAR constrained inversion; (c) GNSS + InSAR constrained inversion.
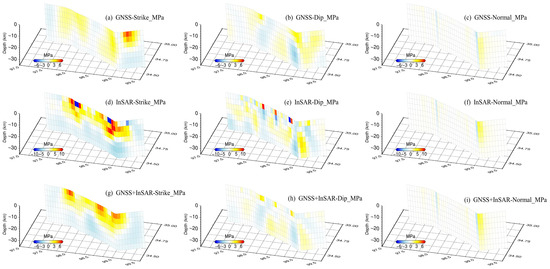
Figure 3.
Distribution of stress variation on seismic Fault plane (GNSS, InSAR, and GNSS + InSAR). Strike_MPa is the shear stress along the strike direction. Dip_MPa is the shear stress along the dip direction. Normal_MPa is the normal stress in the normal direction.
The model value and the residual distribution of InSAR co-seismic deformation obtained through separate inversion based on InSAR data are presented in Figure 4. The simulated values exhibit good agreement with the observed values. The Root Mean Square Error (RMSE) between the observed value and the model value for the ascending orbit is 4.26 cm, while the RMSE for the descending orbit is 4.76 cm. The co-seismic deformation model values and residuals of InSAR data obtained through the joint inversion of GNSS and InSAR data are shown in Figure 5. The RMSE between the observed and model values for the ascending orbit is 7.68 cm, and the RMSE for the descending orbit is 6.60 cm. In the corner area of the eastern section of the fault and some areas of the western section, relatively large residual errors are observed, which could be attributed to factors such as post-seismic afterslip information and aftershocks present in the data. The observed and model values of GNSS horizontal co-seismic displacement are depicted in Figure 6. Figure 6a illustrates the comparison between the observed and simulated values obtained solely through GNSS data inversion. The overall fitting is good, and the inversion results better reflect the geodetic observation data. The RMSE is 1.23 cm. Figure 6b displays the comparison between GNSS observations and simulated values during the joint inversion of GNSS + InSAR data, with an RMSE of 2.44 cm.
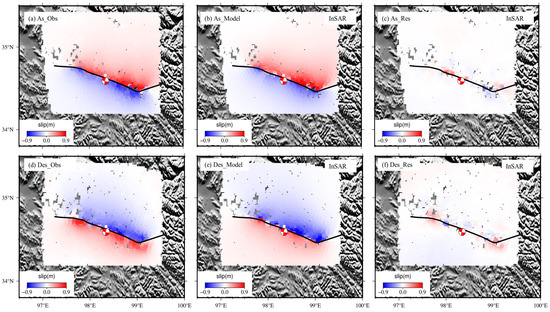
Figure 4.
Inversion of ascending and descending orbit fitting by InSAR data. (a–f) represent the observation values, model values, and residuals of InSAR ascending orbit and InSAR descending orbit.
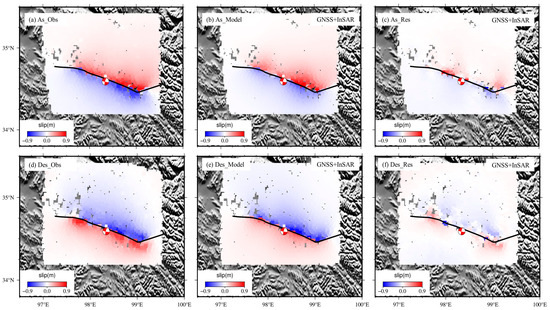
Figure 5.
GNSS + InSAR data joint inversion of InSAR ascending and descending orbit fitting. (a–f) represent the observation values, model values, and residuals of InSAR ascending orbit and InSAR descending orbit.
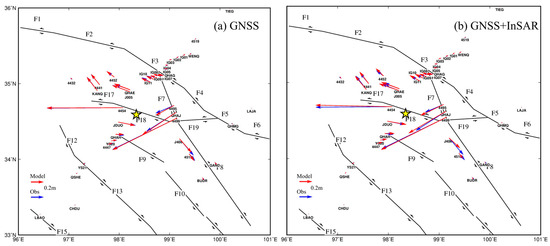
Figure 6.
GNSS co-seismic displacement observation and model values. The yellow star represents the source location of the Maduo earthquake. Blue arrow represents the observed value. Red arrow represents the model value. (a) Comparison of observation and model values of GNSS data inversion. (b) Comparison of GNSS observation and model values in GNSS + InSAR data joint inversion.
The fault slip model obtained from different data sources exhibits variations in the rupture area and magnitude. The slip model constrained by GNSS data reveals a maximum slip of 3.98 m, with the rupture primarily located in the Changma section (~99.2°E). In contrast, the slip model constrained by InSAR data exhibits a maximum slip of 6.00 m, predominantly occurring in the Dongcao Along Lake section. The joint inversion of GNSS and InSAR data results in a slip model with a maximum slip of 4.79 m, mainly concentrated in the Dongcao Along Lake section (~98.6°E).
3.2. Stress Calculation
3.2.1. Co-Seismic Coulomb Stress
In order to investigate the stress loading and unloading effects of historically strong earthquakes on the 2021 Maduo earthquake and the surrounding Fault Zones, this paper calculates the Coulomb stress changes on the 2021 Maduo earthquake and the F1–F19 fault segments (receiving fault) caused by 14 historically strong earthquakes (seismogenic fault) based on the co-seismic dislocation model provided in Table 1. As depicted in Figure 7, the source location of the 2021 Maduo earthquake experienced stress unloading, with a stress unloading value of −0.1391 MPa. Figure 7c illustrates that since the 1937 Huashixia M7.5 earthquake, the 1947 Darinan M7.7 earthquake, and the 1963 Dulan M7.5 earthquake are closer in proximity to the 2021 Maduo earthquake and have larger magnitudes, the co-seismic stress unloading values of these historically strong earthquakes at the source location of the Maduo earthquake are −0.0520 MPa, −0.0155 MPa, and −0.0679 MPa, respectively. Moreover, Figure 7b demonstrates that the historically strong earthquakes predominantly induce stress loading in the S1–S4 regional Fault Zones and the western end of the F12 Fault Zone (Qingshuihe Fault A), while the remaining regional Fault Zones primarily experience stress unloading.

Figure 7.
Accumulative Coulomb stress changes caused by co-seismic dislocations of historically strong earthquakes. The calculated depth is 10 km, and the red focal sphere represents the focal mechanism solution of the receiving fault, and the blue source sphere represents the focal mechanism solution of the seismogenic fault. Red circles represent the stress loading region. (a) Coulomb stress changes on the 2021 Maduo earthquake fault plane associated with the co-seismic dislocations of all previous strong earthquakes. (b) Coulomb stress change of Fault Zones associated with the co-seismic dislocations of all previous strong earthquakes. (c) The cumulative Coulomb stress change at the source location of the 2021 Maduo earthquake associated with the co-seismic dislocations of all previous strong earthquakes.
3.2.2. Post-Seismic Coulomb Stress
The change in Coulomb stress resulting from viscoelastic relaxation after strong earthquakes is depicted in Figure 8. This figure illustrates the Coulomb stress variation on the 2021 Maduo earthquake and the F1–F19 fault sections caused by the viscoelastic relaxation effect following historically strong earthquakes. For instance, the Coulomb stress change on the 2021 Maduo earthquake and the F1–F19 Fault Zones induced by the viscoelastic relaxation effect over the past 117 years after the 1904 Daofu M7 earthquake is calculated. The results reveal a stress-loading effect at the source location of the 2021 Maduo earthquake, with a stress unloading value of −0.0687 MPa. Figure 8c demonstrates that the viscoelastic relaxation effect following the 1963 Dulan M7.5 earthquake and the 1973 Luhuo M7.9 earthquake leads to stress unloading values of −0.0440 MPa and −0.0267 MPa, respectively, at the source location of the Maduo earthquake. The S1–S3 regional Fault Zones and F4 (Middle segment C of East Kunlun Fault) exhibit a stress unloading state, while the remaining Fault Zones primarily experience stress loading. Notably, the stress loading on S1–S3, F8 (Maduo–Gande Fault B), F10 (Dari Fault B), and F11 (Dari Fault C) exceeds 0.1 MPa.

Figure 8.
Accumulative Coulomb stress changes of the 2021 Maduo earthquake and the F1–F19 fault segments caused by post-seismic viscoelastic relaxation of historically strong earthquakes. The calculated depth is 10 km, and the red focal sphere represents the focal mechanism solution of the receiving fault, and the blue source sphere represents the focal mechanism solution of the seismogenic fault. Blue circles represent the stress unloading region. (a) Coulomb stress changes on the 2021 Maduo earthquake fault plane associated with the post-seismic viscoelastic relaxation of all previous strong earthquakes. (b) Coulomb stress changes on the Fault Zones associated with the post-seismic viscoelastic relaxation of all previous strong earthquakes. (c) Cumulative Coulomb stress change at the source location of the 2021 Maduo earthquake caused by the post-seismic viscoelastic relaxation of all previous strong earthquakes.
The Coulomb stress changes resulting from the co-seismic and post-seismic viscoelastic relaxation effects of historically strong earthquakes on the 2021 Maduo earthquake and the F1–F19 fault segments are presented in Figure 9. The stress at the source location of the 2021 Maduo earthquake is observed to be in a stress unloading state, with a stress unloading value of −0.2078 MPa. Specifically, the stress unloading values at the source location of the Maduo earthquake for the 1937 Huashixia M7.5 earthquake, the 1947 Darinan M7.7 earthquake, the 1963 Dulan M7.5 earthquake, and the 1973 Luhuo M7.9 earthquake (co-seismic + post-seismic) are −0.0559 MPa, −0.0105 MPa, −0.1119 MPa, and −0.0311 MPa, respectively. The stress accumulation in the F1 (western section of East Kunlun Fault) and F7 (Maduo–Gande Fault A) Fault Zones exceeds 0.1 MPa, indicating a high seismic risk in these areas.

Figure 9.
Cumulative Coulomb stress changes of the 2021 Maduo earthquake and the F1–F19 fault segments caused by historically strong earthquakes (co-seismic + post-seismic). The calculated depth is 10 km. The red focal sphere represents the focal mechanism solution of the receiving fault, and the blue source sphere represents the focal mechanism solution of the seismogenic fault. (a) Coulomb stress changes on the 2021 Maduo earthquake fault plane associated with all previous strong earthquakes. (b) Coulomb stress changes on the Fault Zones associated with all previous strong earthquakes. (c) Cumulative Coulomb stress changes at the source location of the 2021 Maduo earthquake caused by historically strong earthquakes.
3.2.3. Inter-Seismic Coulomb Stress
The Coulomb stress change between earthquakes is calculated using the “Negative Dislocation Theory”. The long-term inter-seismic tectonic loading of the F1–F19 fault segments from 1900 to 2021 is evaluated, and the results are depicted in Figure 10. The stress loading is observed at the source location of the 2021 Maduo earthquake, with a stress loading value of 0.0745 MPa. Overall, the long-term tectonic action has resulted in stress loading on the Fault Zones, indicating that the F1–F19 fault segments are generally under stress loading, with only some sections experiencing stress unloading. Over the course of 121 years, significant stress loading is observed on the East Kunlun Fault, Kunlun Shankou–Jiangcuo Fault, Maduo–Gande Fault, and Ganzi–Yushu Fault, significantly increasing the seismic risk of these fault sections. It is important to note that the long-term tectonic action does not alter the loading and unloading characteristics of the corresponding fault segments over time [19]. Therefore, considering the long-term inter-seismic tectonic loading would result in even higher stress loading for the 2021 Maduo earthquake and the F1–F19 fault segments compared to the current calculation.
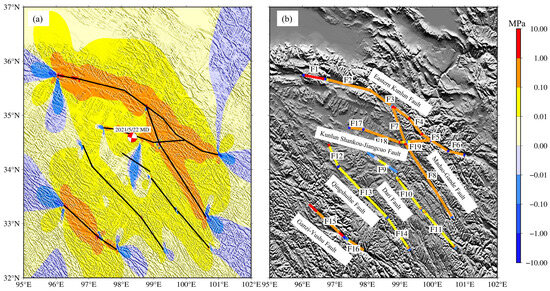
Figure 10.
Accumulative Coulomb stress change of the 2021 Maduo earthquake and the Fault Zone caused by F1–F19 fault segments since 1900. The calculated depth is 10 km, and the red focal sphere represents the focal mechanism solution of the receiving fault. (a) Coulomb stress changes on the fault plane of the 2021 Maduo earthquake; (b) Coulomb stress change of Fault Zones.
3.2.4. Change of Cumulative Coulomb Stress
This paper investigates the co-seismic and post-seismic viscoelastic relaxation effects of 14 strong earthquakes with magnitudes M ≥ 7 in the Bayan Har block study area (96°E~106°E, 29°N~36°N) since 1900. Additionally, it examines the cumulative Coulomb stress changes resulting from inter-seismic tectonic stress loading in the F1–F19 fault segments. As depicted in Figure 11, the findings reveal that the source location of the 2021 Maduo earthquake experiences stress unloading under the influence of co-seismic, post-seismic, and inter-seismic effects, with a cumulative Coulomb stress of −0.1333 MPa. Conversely, inter-seismic tectonic stress loading generates stress loading at the source location of the 2021 Maduo earthquake, with a cumulative stress loading reaching 0.0745 MPa, surpassing the theoretical trigger threshold of 0.01 MPa. Notably, the western section of the East Kunlun Fault (F1) and the middle and eastern sections of the East Kunlun Fault (F3-F6), the Maduo–Gande Fault (F7, F8), the Ganzi–Yushu Fault (F15, F16), and the Dari Fault C (F11) exhibit a significant state of stress loading.
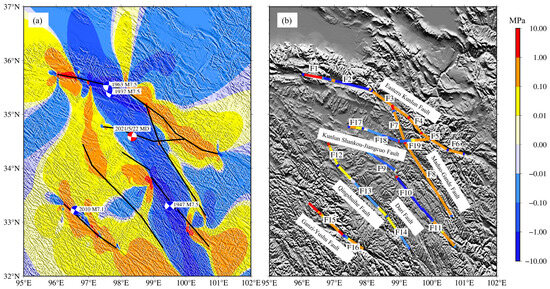
Figure 11.
Cumulative Coulomb stress changes of the 2021 Maduo earthquake and the F1–F19 fault segments from 1900 to 2021 (co-seismic + post-seismic + inter-seismic). The calculated depth is 10 km. The red focal sphere represents the focal mechanism solution of the receiving fault, and the blue source sphere represents the focal mechanism solution of the seismogenic fault. (a) Cumulative Coulomb stress changes on the fault plane of the 2021 Maduo earthquake. (b) Cumulative Coulomb stress changes in the Fault Zones.
3.2.5. Impact of the 2021 Maduo Earthquake
To assess the stress disturbance caused by different slip models on surrounding faults and regions, this paper calculates the stress disturbance when considering the 2021 Maduo earthquake and the F1–F19 fault segments as the receiving faults, based on various co-seismic slip models obtained from different data sources. The results demonstrate that the co-seismic stress disturbances calculated by different slip models exhibit similar spatial distributions (Figure 12). Notably, two distinct areas of Coulomb stress loading are observed at the western and eastern ends of the seismogenic Fault Zone. Therefore, although different slip models may differ in the detailed distribution of fault plane slip, the main characteristics of slip distribution remain consistent, and the stress distribution does not vary significantly. In the fault section of F18 (Kunlun Shankou–Jiangcuo Fault B), the stress values calculated by the co-seismic slip model inverted by GNSS primarily indicate stress unloading, while the other two models show prominent stress loading. F19 (Kunlun Shankou–Jiangcuo Fault C), F15 (Ganzi–Yushu Fault A), F16 (Ganzi–Yushu Fault B), F12 (Qingshuihe Fault A), F13 (Qingshuihe Fault B), F9 (Dari Fault A), F8, F7 (Maduo–Gande Fault), F6 (East section B of East Kunlun Fault), and F4 (middle segment C of East Kunlun Fault) exhibit stress loading in either the entire region or specific parts of the region.
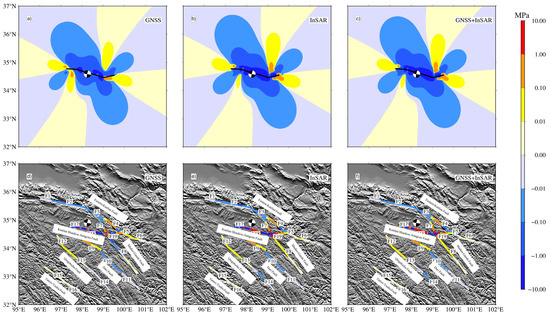
Figure 12.
Co-seismic stress disturbance of different models to surrounding areas and Faults. The calculated depth is 10 km. The beach ball represents the focal mechanism solution of the Maduo earthquake. (a–c) Different models stress disturbance of the surrounding area, and the 2021 Maduo earthquake is the receiving fault; (d–f) Co-seismic Coulomb stress changes caused by different models in surrounding Fault Zones.
4. Discussion
Previous studies have indicated that, based on field geological investigations, the rupture area can be divided into sections such as Changmahe Township, Dongcao Along Lake, Huanghe Township, and the southern section of Eling Lake [34,35]. Yu et al. [4] reported that the maximum slip was observed in the Dongcao Along Lake section, measuring 4.4 m. Xiong et al. [48] utilized GNSS and InSAR data inversion, identifying the maximum slip in the Dongcao Along Lake section (~98.7°E) at 4.79 m. He et al. [62] employed InSAR and waveform data inversion, obtaining a maximum slip of 4.3 m in the Dongcao Along Lake section (~98.6°E). In this paper, the joint inversion of GNSS and InSAR data is generally consistent with existing research. However, due to the distribution and quantity of GNSS co-seismic observation data, the maximum slip and its distribution on the fault surface may deviate from previous studies. The inversion of InSAR data may incorporate some aftershock information and fault plane construction, resulting in larger magnitudes and distributions of maximum slip. Therefore, this paper asserts that the joint inversion of GNSS and InSAR data enables the utilization of the strengths of both data sources, leading to a better reflection of the slip characteristics of the fault surface in the Maduo earthquake.
The source location of the 2021 Maduo earthquake experiences stress unloading due to the combined effects of co-seismic, post-seismic, and inter-seismic processes, resulting in a cumulative Coulomb stress reduction of −0.1333 MPa. Among these factors, inter-seismic tectonic stress loading contributes to stress accumulation at the source location of the Maduo earthquake, with a cumulative stress loading of 0.0745 MPa, surpassing the theoretical trigger threshold of 0.01 MPa. This suggests that the 2021 Maduo earthquake may have been triggered by long-term inter-seismic tectonic loading. The overall reduction in Coulomb stress at the Maduo earthquake location is primarily influenced by the co-seismic and post-seismic Coulomb stress changes resulting from historically strong earthquakes, including the 1937 Huashixia M7.5 earthquake, the 1947 Darinan M7.7 earthquake, the 1963 Dulan M7.5 earthquake, and the 1973 Luhuo M7.9 earthquake. The impact of these earthquake events is more pronounced in the near field. It is important to note that the selected research scope and limited time range do not account for the influence of other seismic events, active faults, and the timescale of inter-seismic tectonic activity. In addition, some strong earthquakes do not have accurate fault slip information due to the lack of observation data. Therefore, it is important to adopt a more refined fault slip model.
The stress disturbance of the surrounding area and faults caused by the co-seismic Maduo earthquake are calculated using three different co-seismic slip models obtained from different data sources. The results indicate that the three slip models yield similar outcomes. Notably, two distinct areas of Coulomb stress loading are observed at the western and eastern ends of the seismogenic Fault Zone [11,13]. The Coulomb stress calculations conducted by Liu et al. [11] and Feng et al. [12] indicate that the eastern section of the East Kunlun Fault, the Ganzi–Yushu Fault, and the middle section of the Maduo–Gande Fault experience stress loading. These findings align with the results obtained in this study.
5. Conclusions
The following conclusions have been drawn:
- Based on D-InSAR technology, the InSAR co-seismic deformation field of the Maduo MW7.4 earthquake on 22 May 2021 is obtained using European Space Agency (ESA) ascending and descending SAR data. The maximum LOS deformation is approximately 0.9 m. The maximum slips obtained through independent and joint inversions of GNSS, InSAR, and GNSS + InSAR are measured at 3.98 m, 6.00 m, and 4.79 m, corresponding to inversion moment magnitudes of MW7.47, MW7.54, and MW7.47, respectively. The joint inversion of GNSS and InSAR data results in a slip model with a maximum slip of 4.79 m, mainly concentrated in the Dongcao Along Lake section (~98.6°E). The joint inversion can effectively leverage the advantages of different data sources and accurately reflect the slip characteristics of the Maduo earthquake fault surface [63,64].
- The cumulative Coulomb stress at the Maduo earthquake’s source location is −0.1333 MPa, while the inter-seismic cumulative stress loading at the same location amounted to 0.0745 MPa. Considering the historically strong earthquakes and long-term inter-seismic tectonic loading, the western section of the East Kunlun Fault (F1), the Middle and Eastern sections of the East Kunlun Fault (F3–F6), the Maduo–Gande Fault (F7, F8), the Ganzi–Yushu Fault (F15, F16), and the Dari Fault C (F11) are under significant stress loading, indicating a noteworthy seismic risk. The middle segment A of the East Kunlun Fault (F2), Dari Fault B (F10), Dari Fault A (F9), Qingshuihe Fault B (F13), Kunlun Shankou–Jiangcuo Fault B (F18) showed a stress unloading state, which slowed down the occurrence of earthquakes. In particular, the middle segment A of East Kunlun Fault (F2) and Dari Fault B (F10) show a strong stress unloading state, which effectively reduces the risk of earthquake.
- In the fault section of F18 (Kunlun Shankou–Jiangcuo Fault B), the stress values calculated by the co-seismic slip model inverted by GNSS primarily indicate stress unloading, while the other two models show prominent stress loading. Because the co-seismic slip model of Maduo earthquake based on GNSS data inversion in this paper is compared with the other two models, the maximum slip is more inclined to the eastern fault area, and the maximum slip is smaller, resulting in the stress state of the F18 (Kunlun Shankou–Jiangcuo Fault B) fault section is different from that of the other two models. F19 (Kunlun Shankou–Jiangcuo Fault C), F15 (Ganzi–Yushu Fault A), F16 (Ganzi–Yushu Fault B), F12 (Qingshuihe Fault A), F13 (Qingshuihe Fault B), F9 (Dari Fault A), F8, F7 (Maduo–Gande Fault), F6 (East section B of East Kunlun Fault), and F4 (Middle segment C of East Kunlun Fault) exhibit stress loading in either the entire region or specific parts of the region.
Author Contributions
Conceptualization, K.X.; methodology, K.X.; software, S.W.; validation, K.X., S.W., and T.W.; formal analysis, S.W.; investigation, S.W.; resources, K.X.; data curation, T.W.; writing—original draft preparation, S.W.; writing—review and editing, S.W.; visualization, K.X.; supervision, K.X.; project administration, K.X.; funding acquisition, K.X. All authors have read and agreed to the published version of the manuscript.
Funding
This research was funded by the National Natural Science Foundation of China (41774041, Xu).
Data Availability Statement
All the data used in this research are available upon request by e-mail to the corresponding author.
Conflicts of Interest
The authors declare no conflict of interest.
References
- Wang, D.J.; Wang, D.Z.; Zhao, B.; Li, Y.; Zhao, L.J.; Wang, Y.B.; Nie, Z.S.; Qiao, X.J.; Wang, Q. 2021 Qinghai Madoi MW7.4 earthquake coseismic deformation field and fault-slip distribution using GNSS observations. Chin. J. Geophys. 2022, 65, 537–551. (In Chinese) [Google Scholar] [CrossRef]
- Wang, Y.B.; Li, Y.; Cai, Y.; Jiang, L.J.; Shi, H.B.; Jiang, Z.S.; Gan, W.J. Coseismic displacement and slip distribution of the 2021 May 22, MS7.4 Madoi earthquake derived from GNSS observations. Chin. J. Geophys. 2022, 65, 523–536. (In Chinese) [Google Scholar] [CrossRef]
- Hua, J.; Zhao, D.Z.; Shan, X.J.; Qu, C.Y.; Zhang, Y.F.; Gong, W.Y.; Wang, Z.J.; Li, C.L.; Li, Y.C.; Zhao, L.; et al. Coseismic deformation field, slip distribution and Coulomb stress disturbance of the 2021 MW7.3 Maduo earthquake using sentinel-1 InSAR observations. Seismol. Geol. 2021, 43, 677–691. [Google Scholar]
- Yu, P.F.; Xiong, W.; Chen, W.; Qiao, X.J.; Wang, D.J.; Liu, G.; Zhao, B.; Nie, Z.S.; Li, Y.; Zhao, L.J.; et al. Slip model of the 2021 MS7.4 Madoi earthquake constrained by GNSS and InSAR coseismic deformation. Chin. J. Geophys. 2022, 65, 509–522. (In Chinese) [Google Scholar] [CrossRef]
- Wang, S.W.; Ji, L.Y.; Zhu, L.Y.; Liu, C.J. Co-seismic Deformation Field and Fault Slip Distribution of 2021 Maduo MW7.4 Earthquake in Qinghai, China Based on InSAR Technology. J. Earth Sci. Environ. 2022, 44, 1016–1026. [Google Scholar] [CrossRef]
- Shan, X.J.; Qu, C.Y.; Gong, W.Y.; Zhao, D.Z.; Zhang, Y.F.; Zhang, G.H.; Song, X.-G.; Liu, Y.-H.; Zhang, G.-F.; Zhang, G.F. Coseismic deformation field of the Jiuzhaigou MS7.0 earthquake from Sentinel-1A InSAR data and fault slip inversion. Chin. J. Geophys. 2017, 60, 4527–4536. [Google Scholar] [CrossRef]
- Mildon, Z.K.; Toda, S.; Faure Walker, J.P.; Roberts, G.P. Evaluating models of Coulomb stress transfer: Is variable fault geometry important? Geophys. Res. Lett. 2016, 43, 12407–12414. [Google Scholar] [CrossRef]
- Sboras, S.; Lazos, I.; Bitharis, S.; Pikridas, C.; Galanakis, D.; Fotiou, A.; Chatzipetros, A.; Pavlides, S. Source modelling and stress transfer scenarios of the October 30, 2020 Samos earthquake: Seismotectonic implications. Turk. J. Earth Sci. 2021, 30, 699–717. [Google Scholar] [CrossRef]
- Toda, S.; Enescu, B. Rate/state Coulomb stress transfer model for the CSEP Japan seismicity forecast. Earth Planets Space 2011, 63, 171–185. [Google Scholar] [CrossRef]
- Li, Y.J.; Huang, L.Y.; Ding, R.; Yang, S.X.; Liu, L.; Zhang, S.M.; Liu, H.Q. Coulomb stress changes associated with the M7. 3 Maduo earthquake and implications for seismic hazards. Nat. Hazards Res. 2021, 1, 95–101. [Google Scholar] [CrossRef]
- Liu, B.Y.; Xie, M.Y.; Shi, B.P. Effect of Qinghai Madoi MS7.4 earthquake on Coulomb stress and earthquake probability increment of adjacent faults. Chin. J. Geophys. 2022, 65, 563–579. (In Chinese) [Google Scholar] [CrossRef]
- Feng, Y.S.; Xiong, X.; Shan, B.; Liu, C.L. Coulomb stress changes due to the 2021 MS7.4 Maduo Earthquake and expected seismicity rate changes in the surroundings. Sci. China Earth Sci. 2022, 65, 675–686. [Google Scholar] [CrossRef]
- Yue, C.; Qu, C.Y.; Niu, A.F.; Zhao, D.; Zhao, J.; Yu, H.; Wang, Y. Analysis of Stress Influence of Qinghai Maduo MS7. 4 Earthquake on Surrounding Faults. Seismol. Geol. 2021, 43, 1041–1059. [Google Scholar]
- Smith, B.R.; Sandwell, D.T. A model of the earthquake cycle along the San Andreas Fault System for the past 1000 years. J. Geophys. Res. 2006, 111, B01405. [Google Scholar] [CrossRef]
- Freed, A.M.; Ali, S.T.; Bürgmann, R. Evolution of stress in Southern California for the past 200 years from coseismic, postseismic and interseismic stress changes. Geophys. J. Int. 2007, 169, 1164–1179. [Google Scholar] [CrossRef]
- Tabrez, A.S.; Freed, A.M.; Calais, E.; Manaker, D.M.; McCann, W.R. Coulomb stress evolution in Northeastern Caribbean over the past 250 years due to coseismic, postseismic and interseismic deformation. Geophys. J. Int. 2008, 174, 904–918. [Google Scholar] [CrossRef]
- Scholz, C.H. Earthquakes and friction laws. Nature 1998, 391, 37–42. [Google Scholar] [CrossRef]
- Nalbant, S.S.; McCloskey, J.; Steacy, S.; Barka, A.A. Stress accumulation and increased seismic risk in eastern Turkey. Earth Planet. Sci. Lett. 2002, 195, 291–298. [Google Scholar] [CrossRef]
- Xu, J.; Shao, Z.G.; Ma, H.S.; Zhang, L.P. Evolution of Coulomb stress and stress interaction among strong earthquakes along the Xianshuihe fault zone. Chin. J. Geophys. 2013, 56, 1146–1158. (In Chinese) [Google Scholar] [CrossRef]
- Matsu’ura, M.; Jackson, D.D.; Cheng, A. Dislocation model for aseismic crustal deformation at Hollister, California. J. Geophys. Res. Solid Earth 1986, 91, 12661–12674. [Google Scholar] [CrossRef]
- Savage, J.C.; Prescott, W.H. Asthenosphere readjustment and the earthquake cycle. J. Geophys. Res. Solid Earth 1978, 83, 3369–3376. [Google Scholar] [CrossRef]
- Nur, A.; Mavko, G. Postseismic viscoelastic rebound. Science 1974, 183, 204–206. [Google Scholar] [CrossRef]
- Yin, F.L.; Jiang, C.S.; Han, L.B.; Zhang, H.; Zhang, B. Seismic hazard assessment for the Red River fault: Insight from Coulomb stress evolution. Chin. J. Geophys. 2018, 61, 183–198. (In Chinese) [Google Scholar] [CrossRef]
- Zhou, C.J. The Stress Field Changes Near the Boundary Fault Zones in the Bayanhar Block and Their Effect on the Large Earthquake; Chinese Academy of Geological Science: Beijing, China, 2014. [Google Scholar]
- Wen, X.; Ma, S.; Xu, X.; He, Y. Historical pattern and behavior of earthquake ruptures along the eastern boundary of the Sichuan-Yunnan faulted-block, southwestern China. Phys. Earth Planet. Inter. 2008, 168, 16–36. [Google Scholar] [CrossRef]
- Wells, D.L.; Coppersmith, K.J. New empirical relationships among magnitude, rupture length, rupture width, rupture area, and surface displacement. Bull. Seismol. Soc. Am. 1994, 84, 974–1002. [Google Scholar]
- Peter, M.; Deng, Q.D. Faulting associated with large earthquakes and the average rate of deformation in central and eastern Asia. J. Geophys. Res. Solid Earth 1984, 89, 6203–6227. [Google Scholar] [CrossRef]
- Molnar, P.; Chen, W.-P. Focal depths and fault plane solutions of earthquakes under the Tibetan Plateau. J. Geophys. Res. 1983, 88, 1180. [Google Scholar] [CrossRef]
- Fielding, E.J.; Sladen, A.; Li, Z.; Avouac, J.P.; Bürgmann, R.; Ryder, I. Kinematic fault slip evolution source models of the 2008 M7.9 Wenchuan earthquake in China from SAR interferometry, GPS and teleseismic analysis and implications for Longmen Shan tectonics. Geophys. J. Int. 2013, 194, 1138–1166. [Google Scholar] [CrossRef]
- Meng, G.J.; Su, X.N.; Xu, W.Z.; Ren, J.W.; Yang, Y.L.; Shestakov, N.V. Postseismic deformation associated with the 2010 Yushu, Qinghai MS7.1 earthquake by GPS observations. Chin. J. Geophys. 2016, 59, 4570–4583. (In Chinese) [Google Scholar] [CrossRef]
- Jiang, Z.S.; Wang, M.; Wang, Y.Z.; Wu, Y.Q.; Che, S.; Shen, Z.K.; Li, Q. GPS constrained coseismic source and slip distribution of the 2013 Mw6.6 Lushan, China, earthquake and its tectonic implications. Geophys. Res. Lett. 2014, 41, 407–413. [Google Scholar] [CrossRef]
- Xiong, W.; Wang, D.J.; Yu, P.F.; Nie, Z.S.; Liu, G.; Chen, W.; Qiao, X.J.; Tan, K.; Xu, C.J. Coulomb stress impact on 2017 Jiuzhaigou MW6.5 earthquake induced by historical earthquakes and Regional Seismic Hazard. Prog. Geophys. 2019, 34, 19–26. [Google Scholar] [CrossRef]
- Wang, W.L.; Fang, L.H.; Wu, J.P.; Tu, H.W.; Chen, L.Y.; Lai, G.J.; Zhang, L. Aftershock sequence relocation of the 2021 MS7.4 Maduo Earthquake, Qinghai, China. Sci. China Earth Sci. 2021, 64, 1371–1380. [Google Scholar] [CrossRef]
- Li, Z.M.; Li, W.Q.; Li, T.; Xu, Y.R.; Su, P.; Guo, P.; Sun, H.Y.; Ha, G.H.; Chen, G.H.; Yuan, Z.D.; et al. Seismogenic fault and coseismic surface deformation of the Maduo MS7.4 earthquake in Qinghai, China: A quick report. Seismol. Geol. 2021, 43, 722–737. [Google Scholar]
- Pan, J.W.; Bai, M.K.; Li, C.; Liu, F.; Li, H.; Liu, D.; Marie-Luce, C.; Ww, K.G.; Wang, P.; Lu, H.J.; et al. Coseismic surface rupture and seismogenic structure of the 2021-05-22 Maduo (Qinghai) M S 7.4 earthquake. Acta Geol. Sin. 2021, 95, 1655–1670. [Google Scholar]
- Zhu, Y.G.; Diao, F.Q.; Fu, Y.C.; Liu, C.L.; Xiong, X. Slip rate of the seismogenic fault of the 2021 Maduo earthquake in western China inferred from GPS observations. Sci. China Earth Sci. 2021, 64, 1363–1370. [Google Scholar] [CrossRef]
- Diao, F.Q.; Xiong, X.; Wang, R.J.; Walter, T.R.; Wang, Y.B.; Wang, K. Slip rate variation along the Kunlun Fault (Tibet): Results from new GPS observations and a viscoelastic earthquake-cycle deformation model. Geophys. Res. Lett. 2019, 46, 2524–2533. [Google Scholar] [CrossRef]
- Xiong, R.W. Study on the Activity of Maduo-Gande Fault. Institute of Earthquake Forecasting; China Earthquake Administration: Beijing, China, 2010.
- Liang, M.J.; Yang, Y.; Du, F.; Gong, Y.; Sun, W.; Zhao, M.; He, Q. Late quaternary activity of the central segment of the Dari fault and restudy of the surface rupture zone of the 1947 M7 3/4 Dari earthquake, Qinghai province. Seismol. Geol. 2020, 42, 703–714. [Google Scholar]
- Wu, Z.H.; Zhou, C.; Feng, H.; Zhang, K.; Li, J.; Ye, P.S.; Li, Y.H.; Tian, T.T. Active faults and earthquake around Yushu in eastern Tibetan Plateau. Geol. Bull. China 2014, 33, 419–469. [Google Scholar]
- Wu, J.W.; Huang, X.M.; Xie, F.R. Late Quaternary slip rate of the Garzê-Yushu fault zone (Dangjiang Segment). Chin. J. Geophys. 2017, 60, 3872–3888. (In Chinese) [Google Scholar] [CrossRef]
- Xu, K.K.; Gan, W.J.; Wu, J.C.; Hou, Z. A robust method for 3-D surface displacement fields combining GNSS and single-orbit InSAR measurements with directional constraint from elasticity model. GPS Solut. 2022, 26, 46. [Google Scholar] [CrossRef]
- Xu, K.K.; Liu, J.; Liu, X.F.; Liu, J.P.; Zhao, F.L. Multiscale crustal deformation around the southeastern margin of the Tibetan Plateau from GNSS observations. Geophys. J. Int. 2020, 223, 1188–1209. [Google Scholar] [CrossRef]
- Xu, K.K.; Sun, W.W.; Wu, J.C. A New Method for Constructing 3-D Crustal Deformation Field from Single InSAR-LOS Data. IEEE Geosci. Remote Sens. Lett. 2020, 19, 1–5. [Google Scholar] [CrossRef]
- Xu, K.K.; Gan, W.J.; Wu, J.C. Pre-seismic deformation detected from regional GNSS observation network: A case study of the 2013 Lushan, eastern Tibetan Plateau (China), Ms 7.0 earthquake. J. Asian Earth Sci. 2019, 180, 103859. [Google Scholar] [CrossRef]
- Xu, K.K.; He, R.; Li, K.Z.; Ren, A.K.; Shao, Z.H. Secular crustal deformation characteristics prior to the 2011 Tohoku-Oki earthquake detected from GNSS array, 2003–2011. Adv. Space Res. 2022, 69, 1116–1129. [Google Scholar] [CrossRef]
- Werner, C.; Wegmüller, U.; Strozzi, T.; Wiesmann, A. Gamma SAR and interferometric processing software. In Proceedings of the Ers-Envisat Symposium, Gothenburg, Sweden, 16–20 October 2000; Volume 1620, p. 1620. [Google Scholar]
- Xiong, W.; Chen, W.; Wang, D.Z.; Wen, Y.M.; Nie, Z.S.; Liu, G.; Wang, D.; Yu, P.; Qiao, X.; Zhao, B. Coseismic slip and early afterslip of the 2021 Mw 7.4 Maduo, China earthquake constrained by GPS and InSAR data. Tectonophysics 2022, 840, 229558. [Google Scholar] [CrossRef]
- Cheng, J.; Liu, J.; Gan, W.J.; Yu, H.Z. Coulomb stress interaction among strong earthquakes around the Bayan Har block since the Manyi earthquake in 1997. Chin. J. Geophys. 2001, 54, 1997–2010. (In Chinese) [Google Scholar] [CrossRef]
- Zhang, C.J.; Cao, J.L.; Shi, Y.L. Studying the viscosity of lower crust of Qinghai-Tibet Plateau according to post-seismic deformation. Sci. China Ser. D Earth Sci. 2009, 52, 411–419. [Google Scholar] [CrossRef]
- Shi, Y.L.; Cao, J.L. Effective viscosity of China continental lithosphere. Earth Sci. Front. 2008, 15, 82–95. [Google Scholar] [CrossRef]
- Wang, R.J.; Diao, F.Q.; Hoechner, A. SDM-A geodetic inversion code incorporating with layered crust structure and curved fault geometry. EGU Gen. Assem. Conf. Abstr. 2013, 15, 2411. [Google Scholar]
- Wang, L.Y.; Zhao, X. Determination of smoothing factor for the co-seismic slip distribution inversion. Acta Geod. Et Cartogr. Sin. 2018, 47, 1571. [Google Scholar] [CrossRef]
- Wang, X.Y.; Xu, K.K.; Liu, X.Q.; Zhang, M.S.; Wang, S.P. Coseismic deformation and stress triggering of the 2021 MS6. 4 Yangbi earthquake inverted from integrating GNSS and InSAR displacement fields. Adv. Space Res. 2023, 72, 458–470. [Google Scholar] [CrossRef]
- Sun, L.X.; Wang, L.Y.; Xu, G.Y.; Wu, Q.W. A New Method of Variational Bayesian Slip Distribution Inversion. J. Geod. 2023, 97, 10. [Google Scholar] [CrossRef]
- Feng, G.C.; Hetland, E.A.; Ding, X.L.; Li, Z.W.; Zhang, L. Coseismic fault slip of the 2008 Mw 7.9 Wenchuan earthquake estimated from InSAR and GPS measurements. Geophys. Res. Lett. 2010, 37, L01302. [Google Scholar] [CrossRef]
- Shen, W.H.; Li, Y.S.; Jiao, Q.S.; Xie, Q.C.; Zhang, J.F. Joint inversion of strong motion and InSAR/GPS data for fault slip distribution of the Jiuzhaigou 7.0 earthquake and its application in seismology. Chin. J. Geophys. 2019, 62, 115–129. (In Chinese) [Google Scholar] [CrossRef]
- He, P.; Wen, Y.; Li, S.; Ding, K.; Li, Z.; Xu, C. Present-day orogenic processes in the western Kalpin nappe explored by interseismic GNSS measurements and coseismic InSAR observations of the 2020 MW6.1 Kalpin event. Geophys. J. Int. 2021, 226, 928–940. [Google Scholar] [CrossRef]
- Tu, H.W.; Wang, R.J.; Diao, F.Q.; Zhang, Y.; Wan, Y.G.; Jin, M.P. Slip model of the 2001 Kunlun mountain MS8. 1 earthquake by SDM: Joint inversion from GPS and InSAR data. Chin. J. Geophys. 2016, 59, 404–413. [Google Scholar] [CrossRef]
- King, G.C.; Stein, R.S.; Lin, J. Static stress changes and the triggering of earthquakes. Bull. Seismol. Soc. Am. 1994, 84, 935–953. [Google Scholar]
- Wang, R.J.; Lorenzo-Martín, F.; Roth, F. PSGRN/PSCMP—A new code for calculating co- and post-seismic deformation, geoid and gravity changes based on the viscoelastic-gravitational dislocation theory. Comput. Geosci. 2006, 32, 527–541. [Google Scholar] [CrossRef]
- He, K.F.; Wen, Y.M.; Xu, C.J.; Zhao, Y.W. Fault geometry and slip distribution of the 2021 MW 7.4 Maduo, China, earthquake inferred from InSAR measurements and relocated aftershocks. Seismol. Soc. Am. 2022, 93, 8–20. [Google Scholar] [CrossRef]
- Zheng, A.; Yu, X.W.; Qian, J.Q.; Liu, X.G.; Zhang, W.B.; Chen, X.F.; Xu, W.B. Cascading rupture process of the 2021 Maduo, China earthquake revealed by the joint inversion of seismic and geodetic data. Tectonophysics 2023, 849, 229732. [Google Scholar] [CrossRef]
- Jin, Z.Y.; Fialko, Y.; Yang, H.F.; Li, Y. Transient deformation excited by the 2021 M7. 4 Maduo (China) earthquake: Evidence of a deep shear zone. J. Geophys. Res. Solid Earth 2023, 128, e2023JB026643. [Google Scholar] [CrossRef]
Disclaimer/Publisher’s Note: The statements, opinions and data contained in all publications are solely those of the individual author(s) and contributor(s) and not of MDPI and/or the editor(s). MDPI and/or the editor(s) disclaim responsibility for any injury to people or property resulting from any ideas, methods, instructions or products referred to in the content. |
© 2023 by the authors. Licensee MDPI, Basel, Switzerland. This article is an open access article distributed under the terms and conditions of the Creative Commons Attribution (CC BY) license (https://creativecommons.org/licenses/by/4.0/).