
A Novel Shipyard Production State Monitoring Method Based on Satellite Remote Sensing Images


Abstract
:
1. Introduction
2. Data
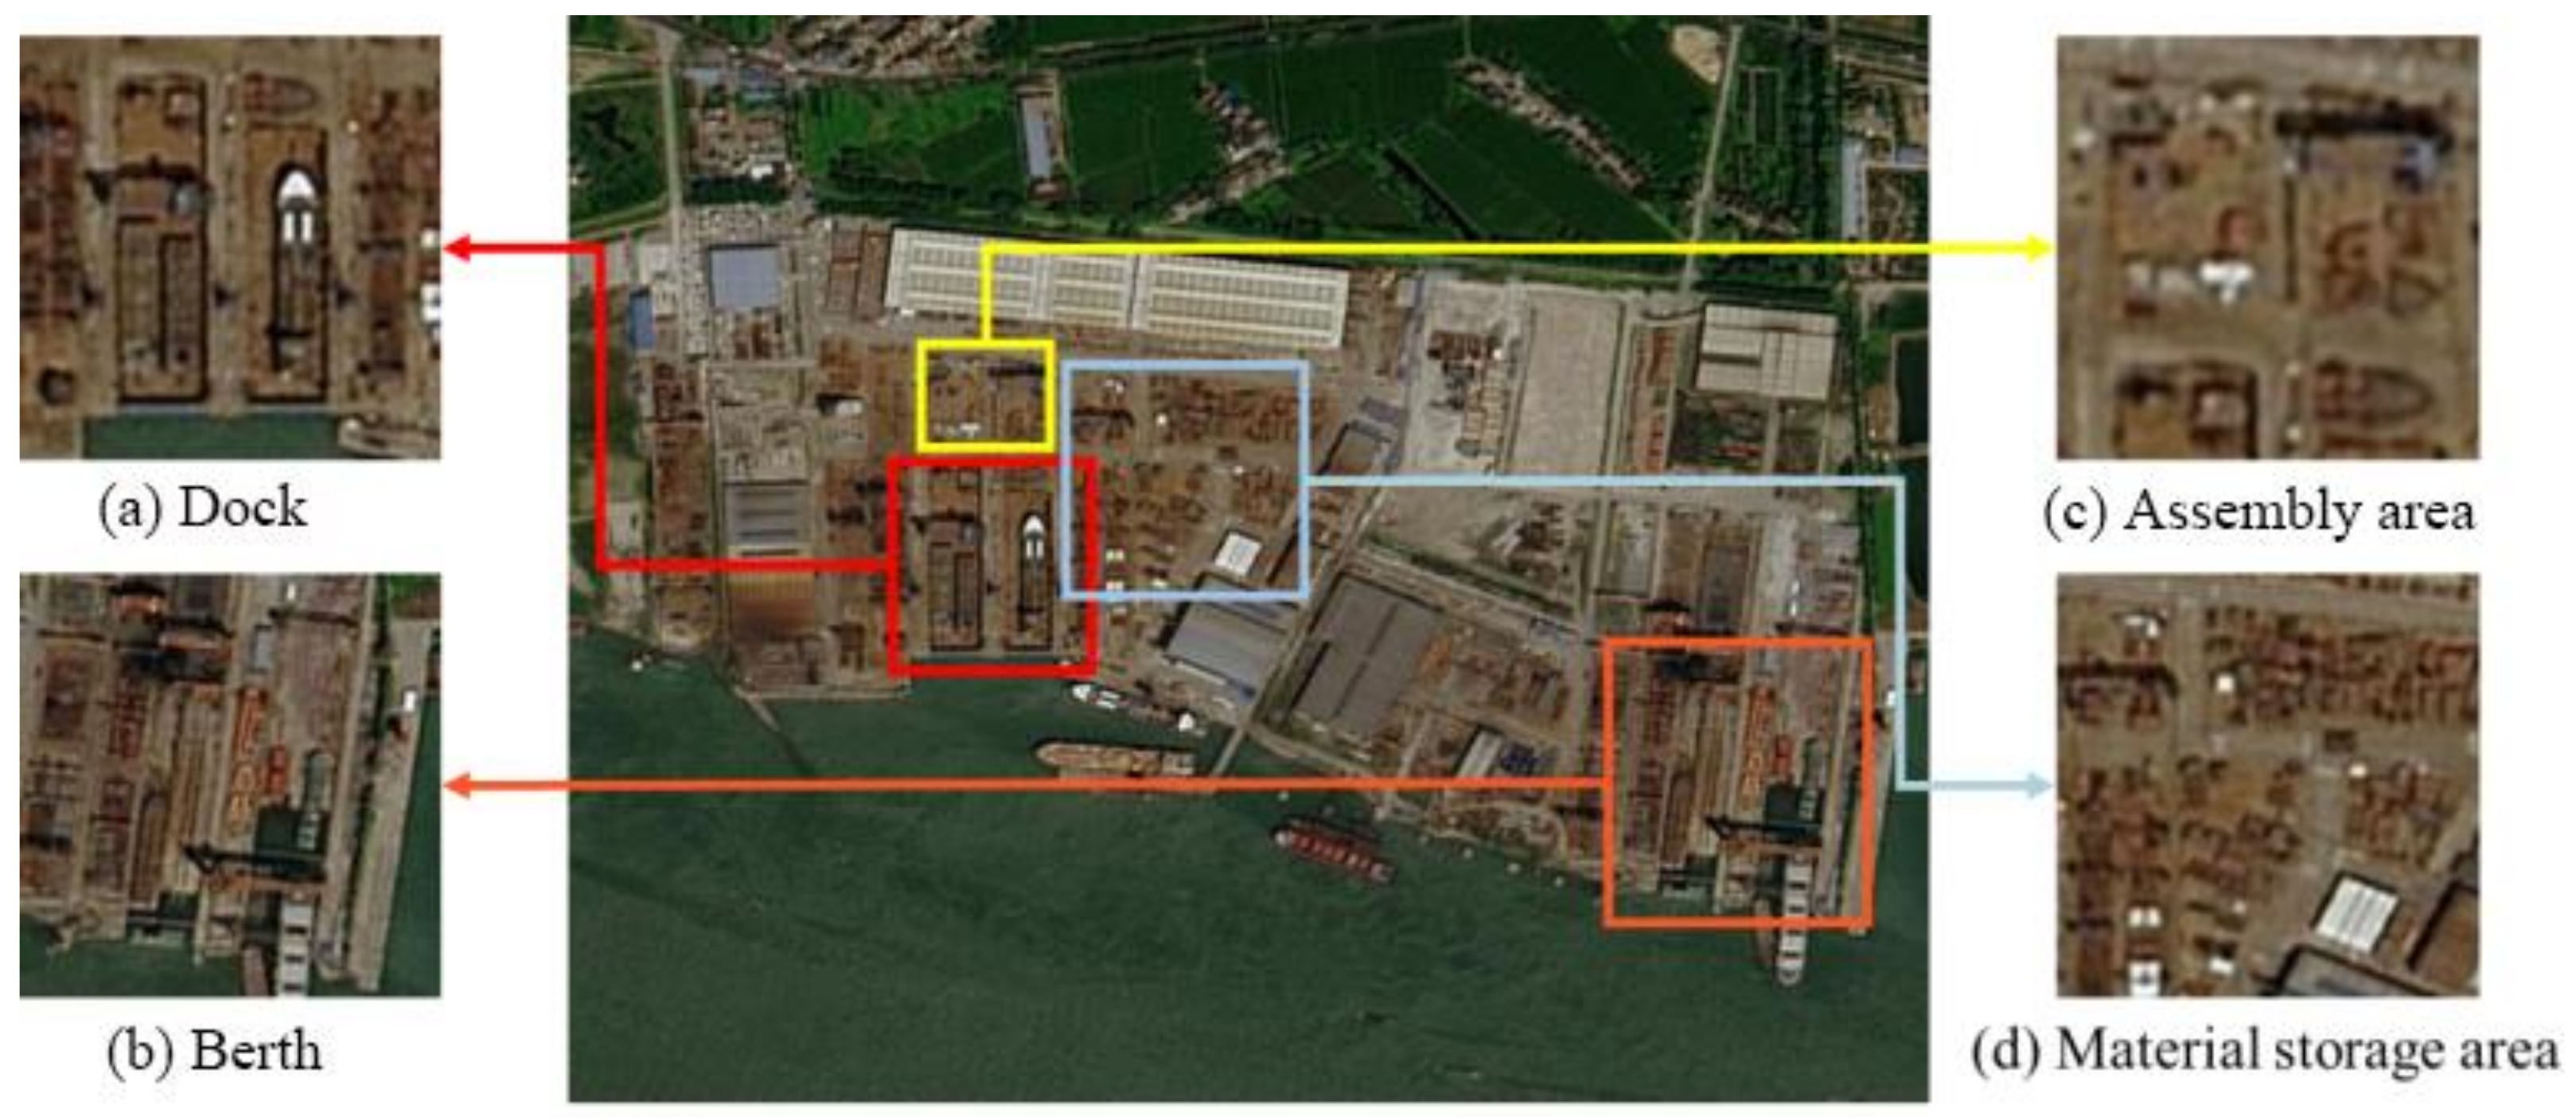
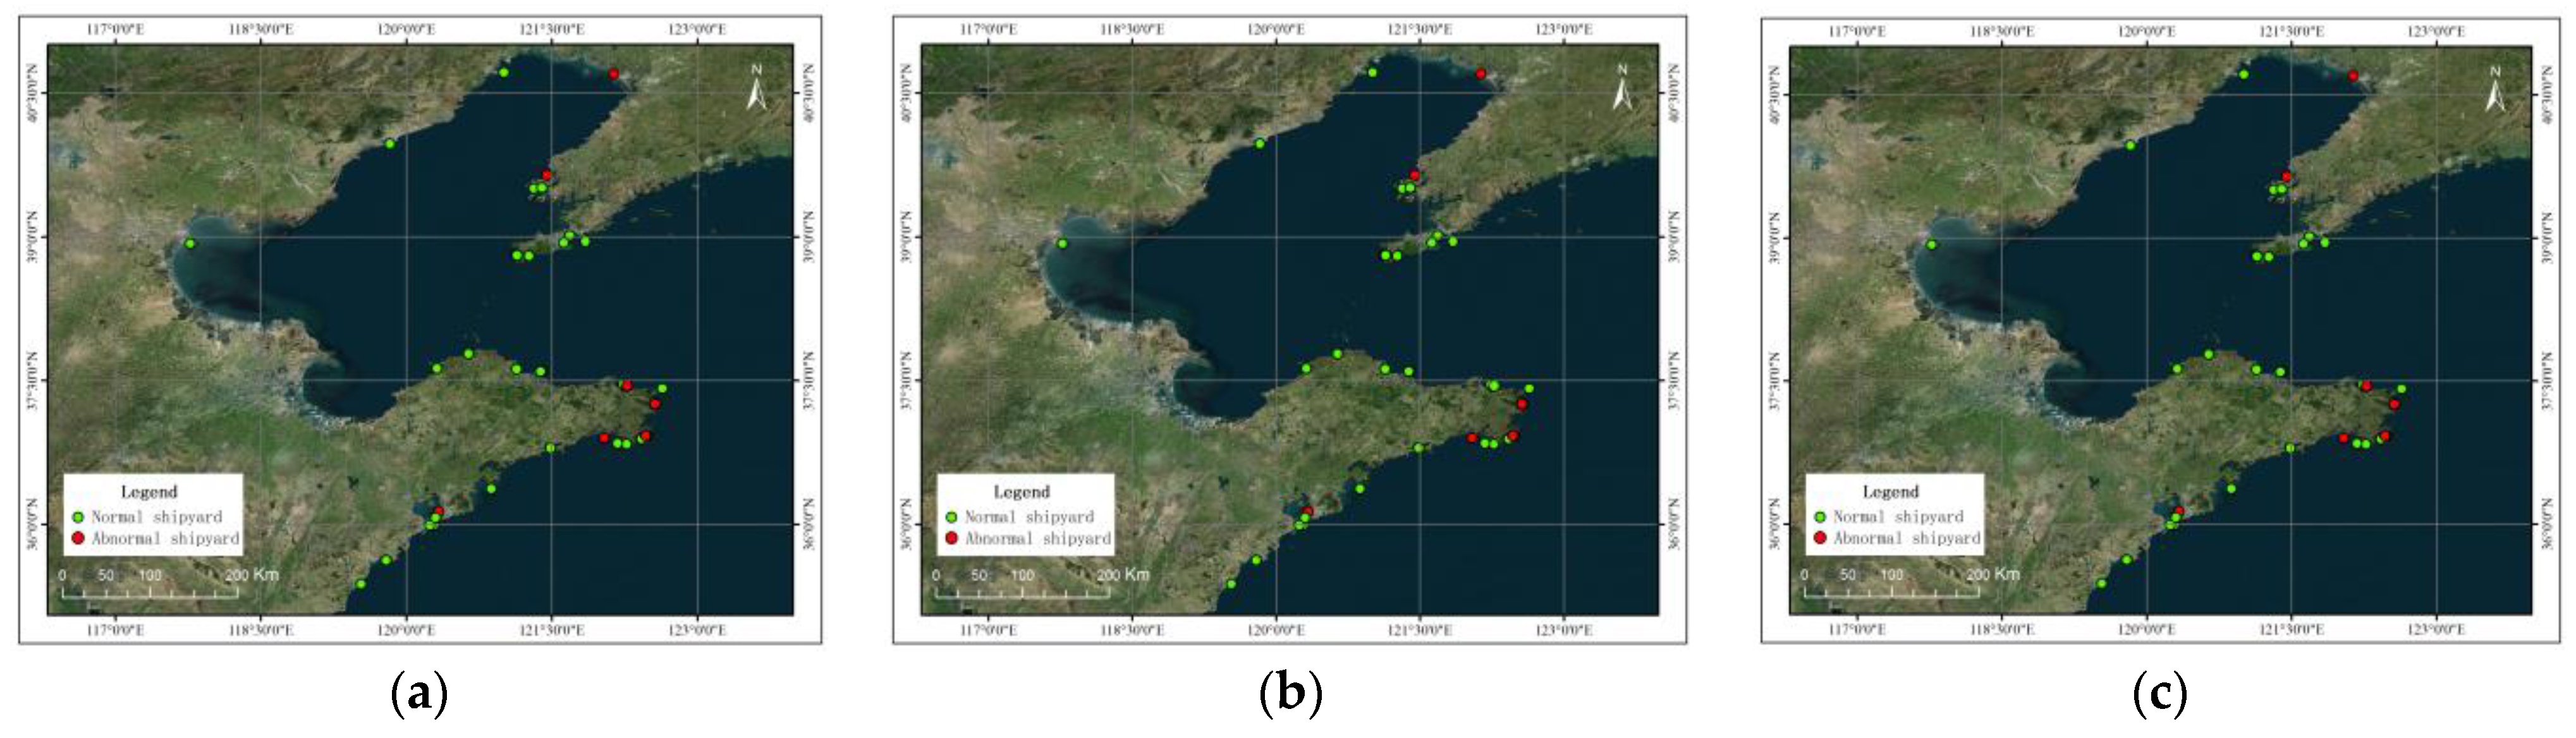
2.1. Experimental Area and Data
2.2. Characteristics of Shipyards in Different Production States
2.3. Optical Sample Datasets
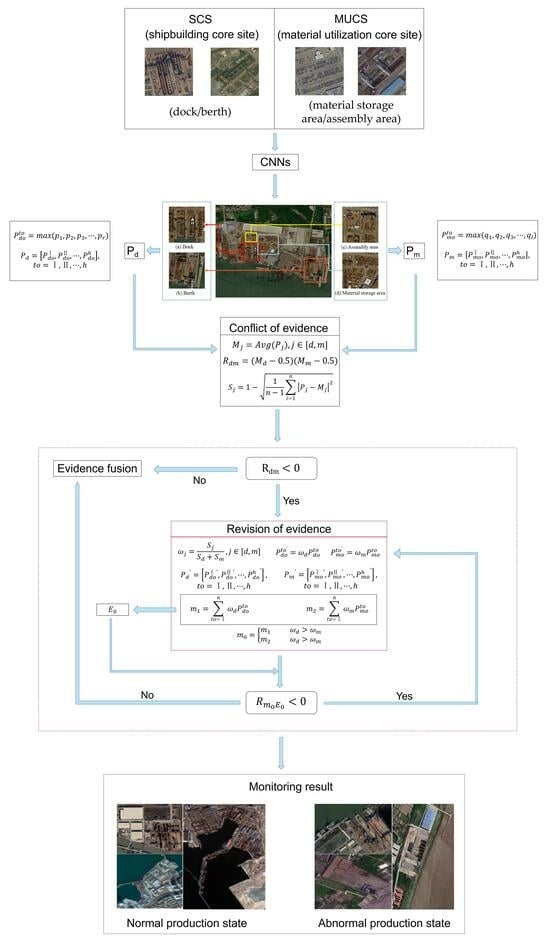
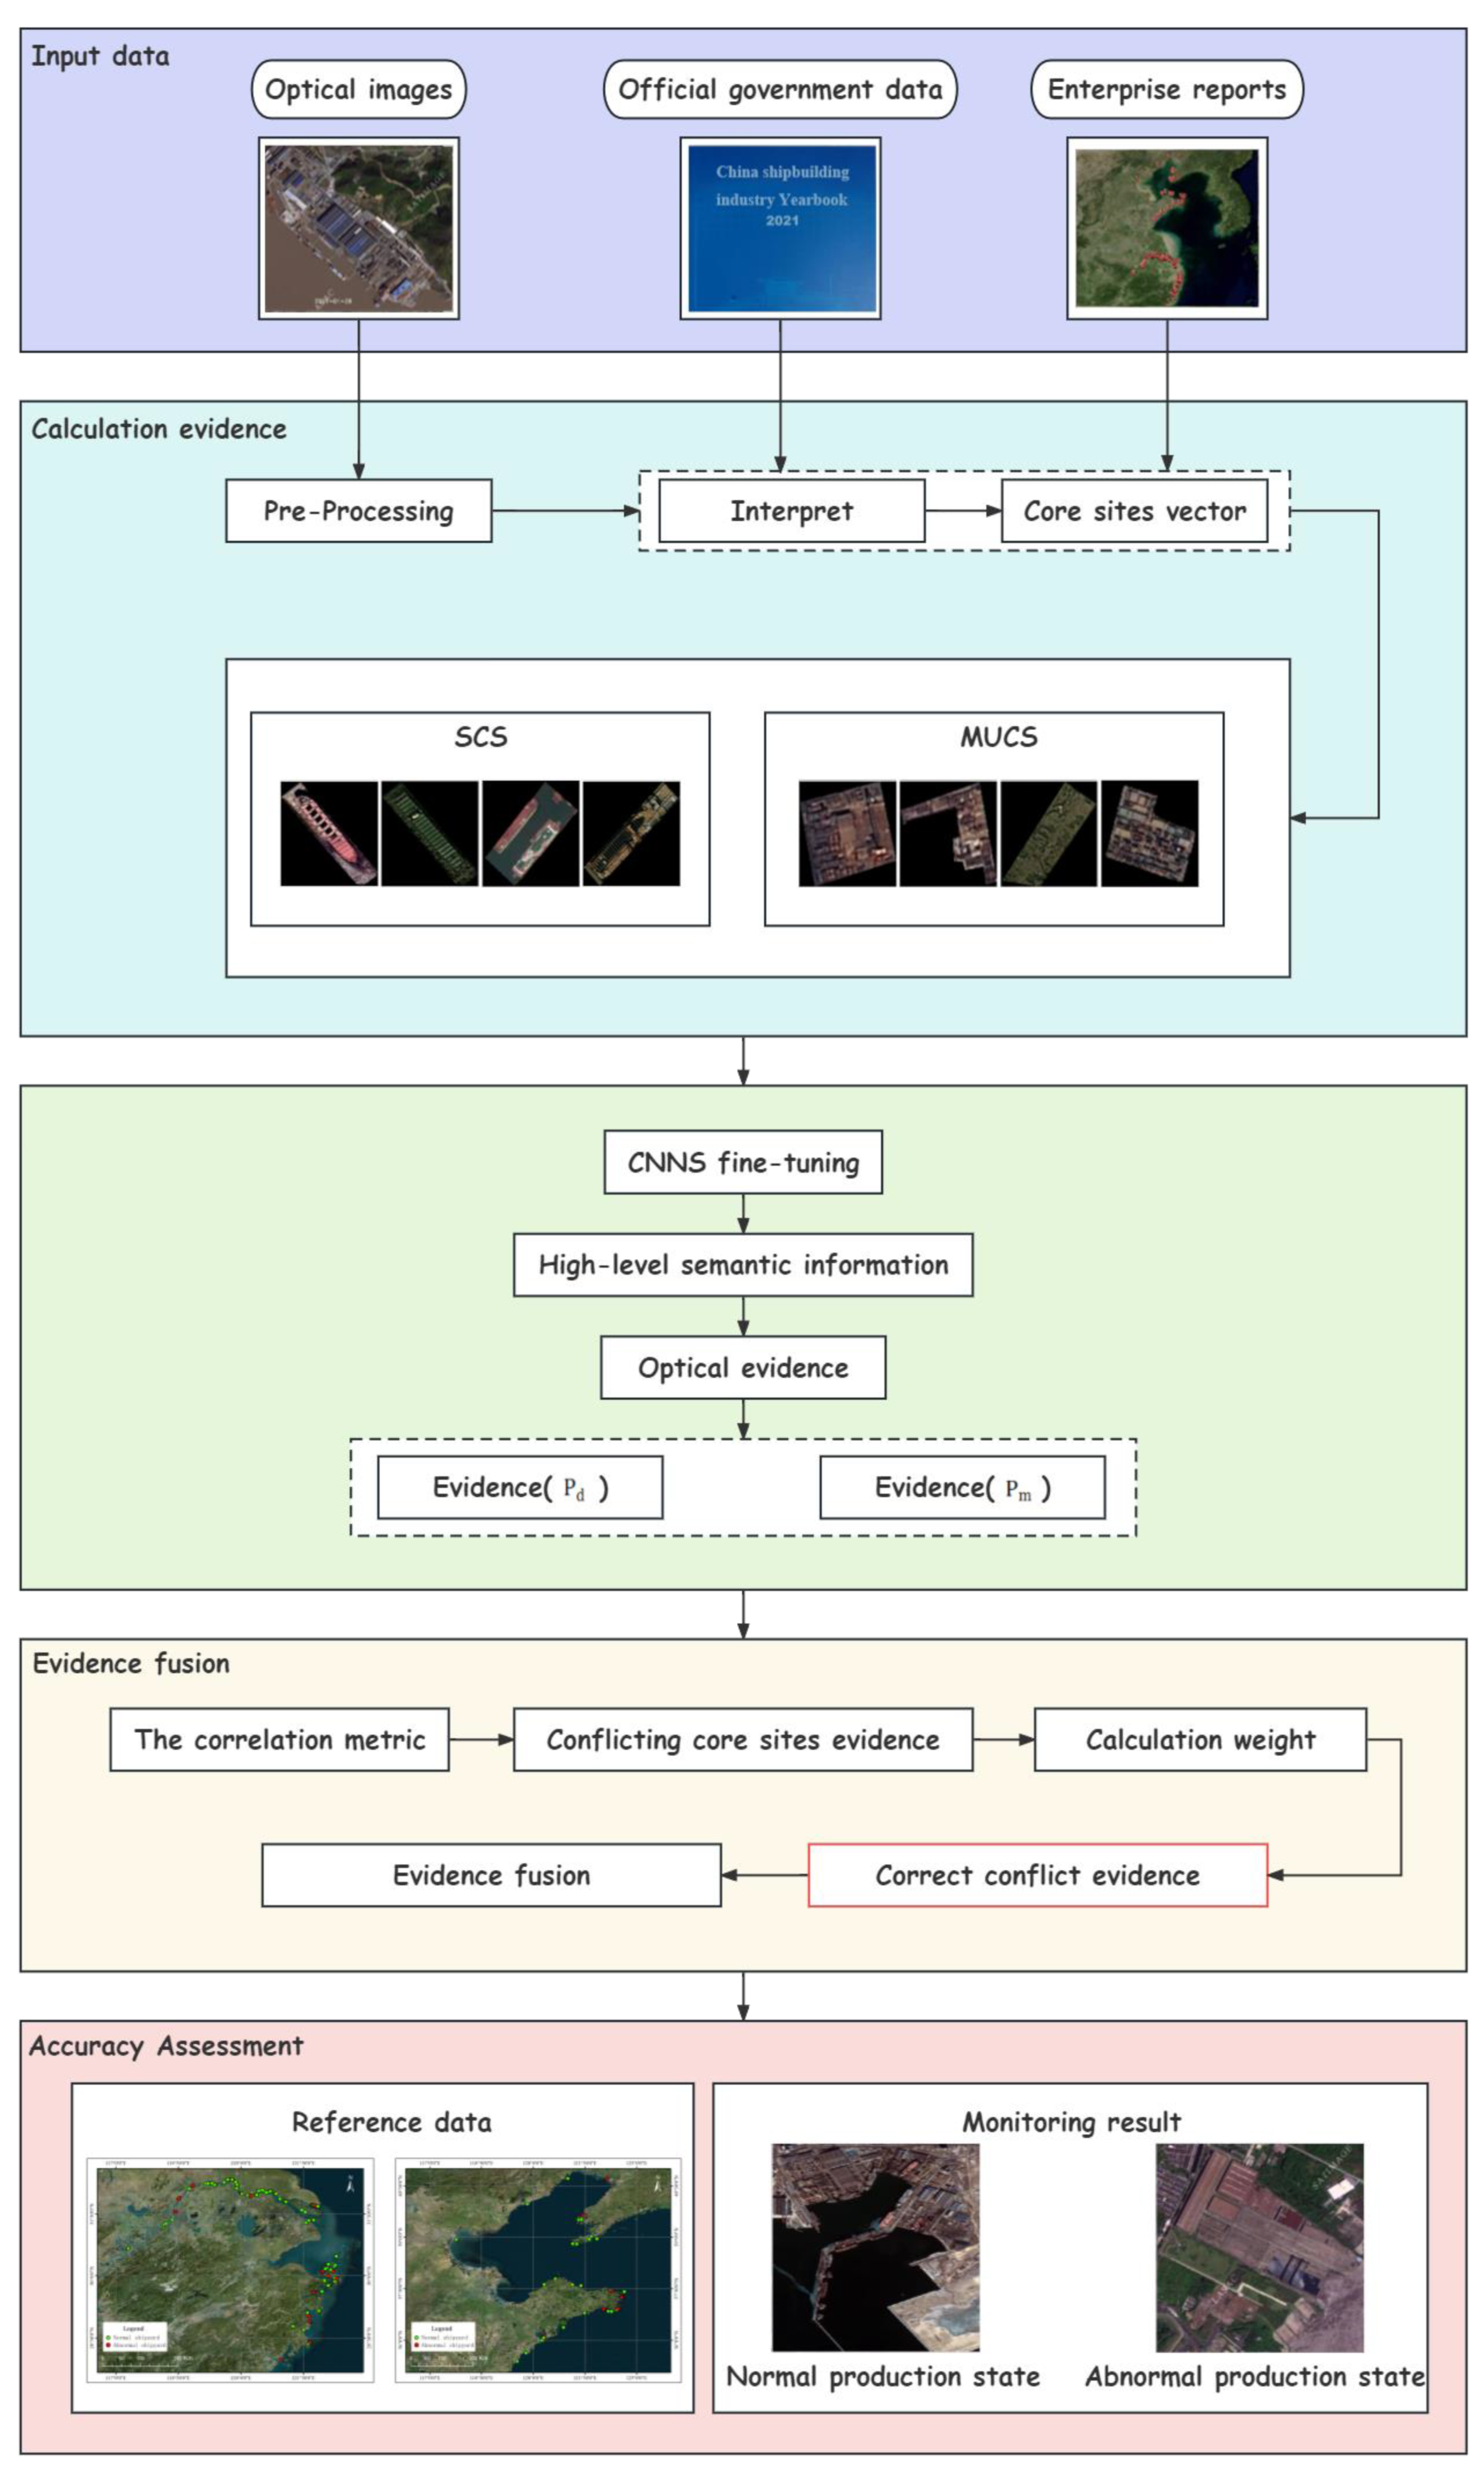
3. Methods
3.1. Neural Network
3.2. Optical Evidence
3.3. Decision-Level Fusion
3.3.1. DS Evidence Fusion Basic Theory
3.3.2. Evidence Analysis
- (1)
- Due to the different core sites used at different stages of the shipbuilding, there may be conflicting evidence from the two core sites at the imaging moment.
- (2)
- Conflict evidence may also be caused by changes in the shipbuilding stage when the sensor continuously observes the same core site.
3.3.3. Evidence Fusion
- (1)
- Calculating the correlation of evidence between two core sites, the SCS and the MUCS. If the , the SCS and MUCS indicate evidence conflict. The similarity metric is calculated and the weight of all evidence is calculated by the similarity metric (in formula (11)).
- (2)
- In Formula (12) and (13), the conflict evidence is corrected by weight. The greater the degree of similarity of evidence is, the stronger is the credibility and the greater the weight. The modified evidence is substituted into Formula (5) for evidence fusion, and the first evidence fusion result is obtained. The definition of m0 is shown in Formula (13).
- (3)
- The greater the similarity of evidence is, the stronger the credibility is, the greater the weight is, and the more biased the evidence fusion result is for the evidence with greater weight. Therefore, the correlation metric between the corrected evidence with a larger weight and the fusion result is calculated. If , it indicates that there is still a conflict. Otherwise, the conflict problem has been solved and the fusion result is the output.
- (4)
- Considering that the fusion result is closer to the expected output, if the weight of evidence is re-determined according to the fusion result; that is, the iterative idea is introduced to correct the fusion result. The ith (i 1) iteration process is to calculate the correlation metric and the similarity metric of the modified evidence and the i-1th evidence fusion result . if , the new evidence weight is calculated by the similarity metric, and the conflict evidence is corrected according to the weight to obtain the ith fusion result . The convergence condition of the iteration is to end the iteration and output when ; otherwise, we continue the iteration until the condition is satisfied.
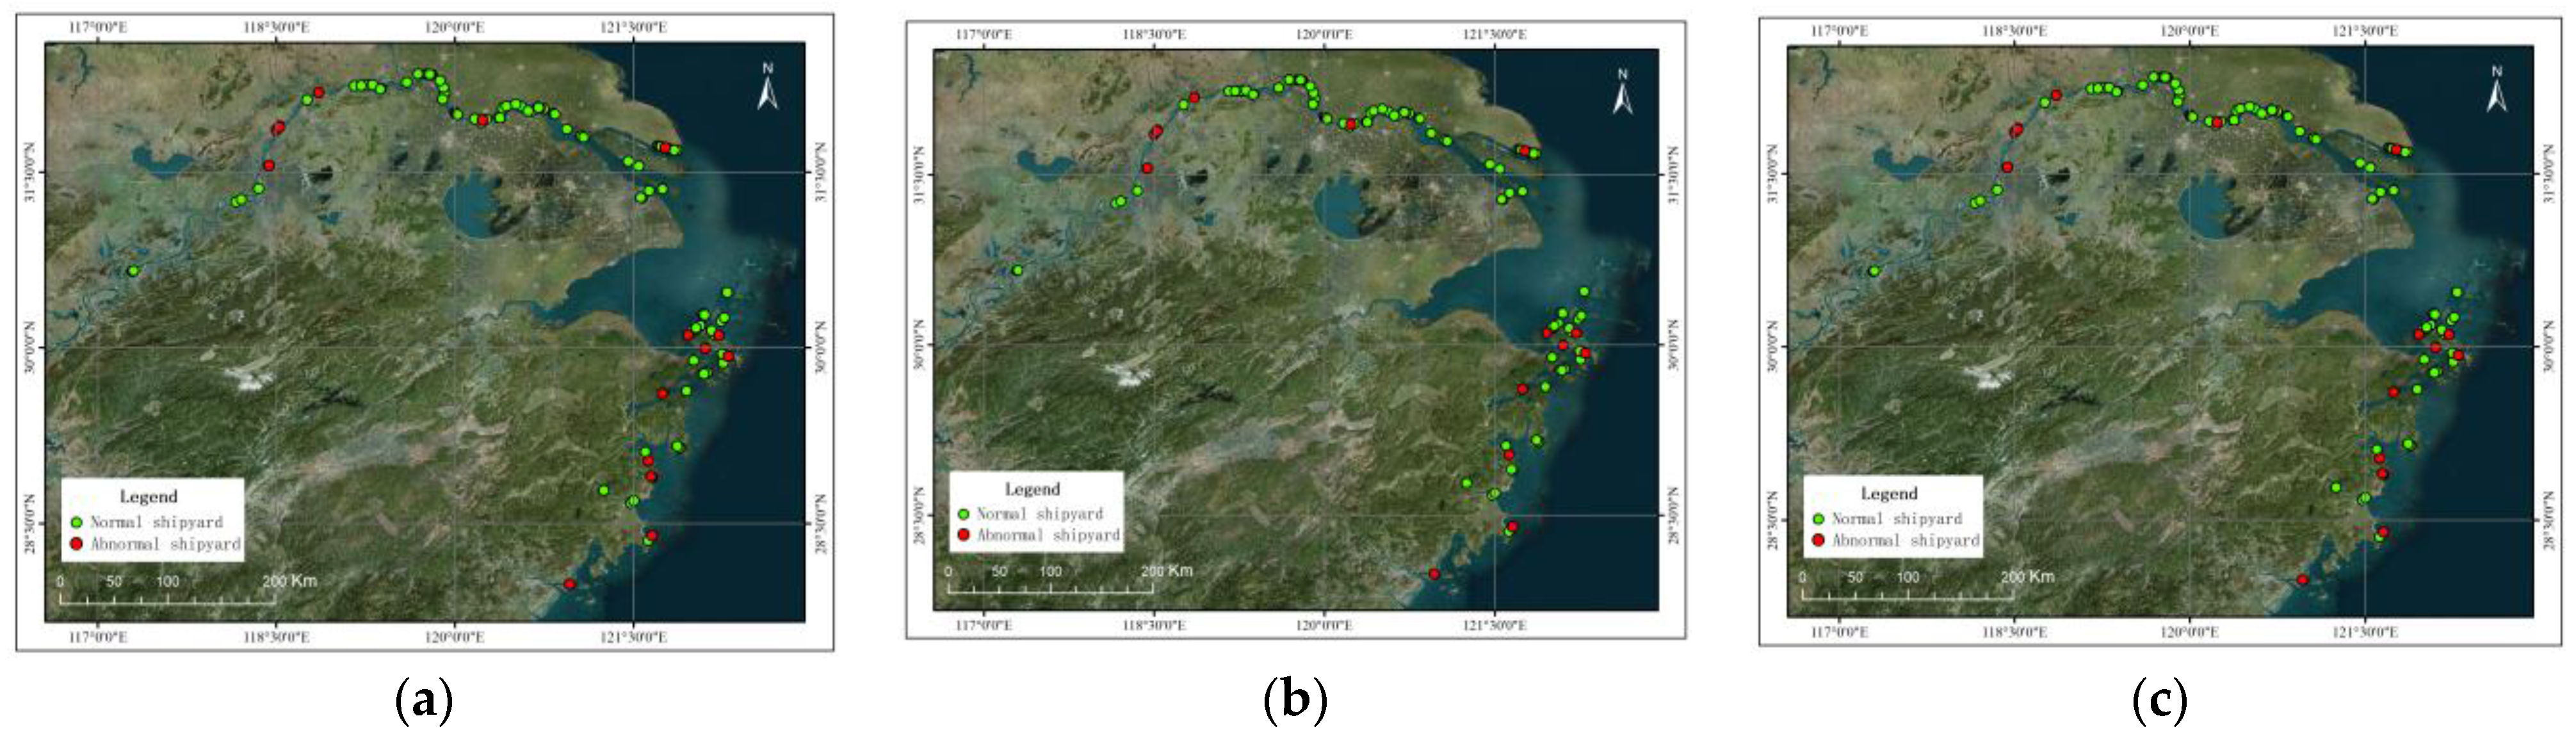
3.4. Accuracy Evaluation
4. Results
4.1. Presentation of Results
4.2. Evaluation Results
4.3. Discussion
- (1)
- The method in this paper needs to identify the shipyard and extract the core sites before monitoring, and the workload is large. There are few studies on the extraction of special scenes in shipyards and the automatic extraction of internal core sites. Subsequently, the comprehensive identification of the shipyard scene and state attributes can be carried out.
- (2)
- The method in this paper has a weak detection ability for the quarterly production state of small/micro shipyards. For the reason of misdetection, it can be improved from two directions. Firstly, we can increase the training samples of core sites of small/micro enterprises to improve the reliability of optical evidence; Secondly, more time-phase optical images can be used to monitor the production state of shipyards in the future to further improve the monitoring accuracy.
5. Conclusions
Author Contributions
Funding
Data Availability Statement
Conflicts of Interest
References
- Jia, Z. Influencing Factors and Optimization of Ship Energy Efficiency under the Background of Climate Change. IOP Conf. Ser. Earth Environ. Sci. 2021, 647, 012178. [Google Scholar] [CrossRef]
- Liu, J.; Wang, Y.; Yan, S.; Zhao, F.; Li, Y.; Dang, L.; Liu, X.; Shao, Y.; Peng, B. Underground Coal Fire Detection and Monitoring Based on Landsat-8 and Sentinel-1 Data Sets in Miquan Fire Area, XinJiang. Remote Sens. 2021, 13, 1141. [Google Scholar] [CrossRef]
- Yang, Z.; Wei, J.; Deng, J.; Gao, Y.; Zhao, S.; He, Z. Mapping Outburst Floods Using a Collaborative Learning Method Based on Temporally Dense Optical and SAR Data: A Case Study with the Baige Landslide Dam on the Jinsha River, Tibet. Remote Sens. 2021, 13, 2205. [Google Scholar] [CrossRef]
- Absalon, D.; Matysik, M.; Woźnica, A.; Janczewska, N. Detection of Changes in the Hydrobiological Parameters of the Oder River during the Ecological Disaster in July 2022 Based on Multi-Parameter Probe Tests and Remote Sensing Methods. Ecol. Indic. 2023, 148, 110103. [Google Scholar] [CrossRef]
- Qian, L.; Chen, S.; Jiang, H.; Dai, X.; Jia, K. Quantitative Monitoring of Sugarcane Typhoon Disaster Based on Multi-Source Remote Sensing Data. In Proceedings of the 2022 3rd International Conference on Geology, Mapping and Remote Sensing (ICGMRS), Zhoushan, China, 22–24 April 2022; pp. 926–930. [Google Scholar]
- Zhang, W.; Dong, Y. Research on Flood Remote Sensing Monitoring Based on Multi-Source Remote Sensing Data. In Proceedings of the 2022 3rd International Conference on Geology, Mapping and Remote Sensing (ICGMRS), Zhoushan, China, 22–24 April 2022; pp. 646–649. [Google Scholar]
- Lin, Q.; Ci, T.; Wang, L.; Mondal, S.K.; Yin, H.; Wang, Y. Transfer Learning for Improving Seismic Building Damage Assessment. Remote Sens. 2022, 14, 201. [Google Scholar] [CrossRef]
- Som-ard, J.; Atzberger, C.; Izquierdo-Verdiguier, E.; Vuolo, F.; Immitzer, M. Remote Sensing Applications in Sugarcane Cultivation: A Review. Remote Sens. 2021, 13, 4040. [Google Scholar] [CrossRef]
- Das, K.; Twarakavi, N.; Khiripet, N.; Chattanrassamee, P.; Kijkullert, C. A Machine Learning Framework for Mapping Soil Nutrients with Multi-Source Data Fusion. In Proceedings of the 2021 IEEE International Geoscience and Remote Sensing Symposium IGARSS, Brussels, Belgium, 11–16 July 2021; pp. 3705–3708. [Google Scholar]
- Jin, X.; Wan, J.; Hu, W.; Song, Y.; Lu, B. Retrieval of Green Tide Concentration and Interannual Variation Analysis in Yellow Sea Based on Multi-Source Remote Sensing Monitoring. In Proceedings of the Global Oceans 2020: Singapore—U.S. Gulf Coast, Biloxi, MS, USA, 5–30 October 2020; pp. 1–5. [Google Scholar]
- Behkamal, B.; Entezami, A.; De Michele, C.; Arslan, A.N. Elimination of Thermal Effects from Limited Structural Displacements Based on Remote Sensing by Machine Learning Techniques. Remote Sens. 2023, 15, 3095. [Google Scholar] [CrossRef]
- Blondeau-Patissier, D.; Schroeder, T.; Suresh, G.; Li, Z.; Diakogiannis, F.I.; Irving, P.; Witte, C.; Steven, A.D.L. Detection of Marine Oil-like Features in Sentinel-1 SAR Images by Supplementary Use of Deep Learning and Empirical Methods: Performance Assessment for the Great Barrier Reef Marine Park. Mar. Pollut. Bull. 2023, 188, 114598. [Google Scholar] [CrossRef] [PubMed]
- Bui, D.H.; Mucsi, L. From Land Cover Map to Land Use Map: A Combined Pixel-Based and Object-Based Approach Using Multi-Temporal Landsat Data, a Random Forest Classifier, and Decision Rules. Remote Sens. 2021, 13, 1700. [Google Scholar] [CrossRef]
- Grybas, H.; Congalton, R.G. A Comparison of Multi-Temporal RGB and Multispectral UAS Imagery for Tree Species Classification in Heterogeneous New Hampshire Forests. Remote Sens. 2021, 13, 2631. [Google Scholar] [CrossRef]
- Abir, F.A.; Saha, R. Assessment of Land Surface Temperature and Land Cover Variability during Winter: A Spatio-Temporal Analysis of Pabna Municipality in Bangladesh. Environ. Chall. 2021, 4, 100167. [Google Scholar] [CrossRef]
- Koko, F.; Yue, W.; Abubakar, G.; Hamed, R.; Alabsi, A. Analyzing Urban Growth and Land Cover Change Scenario in Lagos, Nigeria Using Multi-Temporal Remote Sensing Data and GIS to Mitigate Flooding. Geomat. Nat. Hazards Risk 2021, 12, 631–652. [Google Scholar] [CrossRef]
- Ru, L.; Du, B.; Wu, C. Multi-Temporal Scene Classification and Scene Change Detection with Correlation Based Fusion. IEEE Trans. Image Process. 2021, 30, 1382–1394. [Google Scholar] [CrossRef] [PubMed]
- Xu, J.; Yang, J.; Xiong, X.; Li, H.; Huang, J.; Ting, K.C.; Ying, Y.; Lin, T. Towards Interpreting Multi-Temporal Deep Learning Models in Crop Mapping. Remote Sens. Environ. 2021, 264, 112599. [Google Scholar] [CrossRef]
- Zhu, Y.; Geiß, C.; So, E. Image Super-Resolution with Dense-Sampling Residual Channel-Spatial Attention Networks for Multi-Temporal Remote Sensing Image Classification. Int. J. Appl. Earth Obs. Geoinf. 2021, 104, 102543. [Google Scholar] [CrossRef]
- Tasci, B.; Acharya, M.R.; Baygin, M.; Dogan, S.; Tuncer, T.; Belhaouari, S.B. InCR: Inception and Concatenation Residual Block-Based Deep Learning Network for Damaged Building Detection Using Remote Sensing Images. Int. J. Appl. Earth Obs. Geoinf. 2023, 123, 103483. [Google Scholar] [CrossRef]
- Kalita, I.; Roy, M. Inception Time DCNN for Land Cover Classification by Analyzing Multi-Temporal Remotely Sensed Images. In Proceedings of the IGARSS 2022–2022 IEEE International Geoscience and Remote Sensing Symposium, Kuala Lumpur, Malaysia, 17–22 July 2022; pp. 5736–5739. [Google Scholar]
- Aeberli, A.; Johansen, K.; Robson, A.; Lamb, D.W.; Phinn, S. Detection of Banana Plants Using Multi-Temporal Multispectral UAV Imagery. Remote Sens. 2021, 13, 2123. [Google Scholar] [CrossRef]
- Gill, J.; Faisal, K.; Shaker, A.; Yan, W.Y. Detection of Waste Dumping Locations in Landfill Using Multi-Temporal Landsat Thermal Images. Waste Manag. Res. 2019, 37, 386–393. [Google Scholar] [CrossRef]
- Wei, X.; Fu, X.; Yun, Y.; Lv, X. Multiscale and Multitemporal Road Detection from High Resolution SAR Images Using Attention Mechanism. Remote Sens. 2021, 13, 3149. [Google Scholar] [CrossRef]
- Xia, Z.G.; Motagh, M.; Li, T.; Roessner, S. The June 2020 Aniangzhai landslide in Sichuan Province, Southwest China: Slope instability analysis from radar and optical satellite remote sensing data. Landslides 2022, 19, 313–329. [Google Scholar] [CrossRef]
- Refice, A.; D’Addabbo, A.; Lovergine, F.P.; Bovenga, F.; Nutricato, R.; Nitti, D.O. Improving Flood Monitoring Through Advanced Modeling of Sentinel-1 Multi-Temporal Stacks. In Proceedings of the IGARSS 2022–2022 IEEE International Geoscience and Remote Sensing Symposium, Kuala Lumpur, Malaysia, 17–22 July 2022; pp. 5881–5884. [Google Scholar]
- Mehravar, S.; Razavi-Termeh, S.V.; Moghimi, A.; Ranjgar, B.; Foroughnia, F.; Amani, M. Flood Susceptibility Mapping Using Multi-Temporal SAR Imagery and Novel Integration of Nature-Inspired Algorithms into Support Vector Regression. J. Hydrol. 2023, 617, 129100. [Google Scholar] [CrossRef]
- Zhao, Y.; Qu, Z.; Zhang, Y.; Ao, Y.; Han, L.; Kang, S.; Sun, Y. Effects of Human Activity Intensity on Habitat Quality Based on Nighttime Light Remote Sensing: A Case Study of Northern Shaanxi, China. Sci. Total Environ. 2022, 851, 158037. [Google Scholar] [CrossRef]
- Price, N.; Atkinson, P.M. Global GDP Prediction with Night-Lights and Transfer Learning. IEEE J. Sel. Top. Appl. Earth Obs. Remote Sens. 2022, 15, 7128–7138. [Google Scholar] [CrossRef]
- Li, J.; Sun, Q.; Zhang, P.; Sun, D.; Wen, L.; Li, X. A Study of Auxiliary Monitoring in Iron and Steel Plant Based on Multi-Temporal Thermal Infrared Remote Sensing. Remote Sens. Nat. Resour. 2019, 31, 220–228. [Google Scholar]
- Sun, S.; Li, L.; Zhao, W.; Wang, L.; Qiu, Y.; Jiang, L.; Zhang, L. Industrail Pollution Emissions Based on Thermal Anomaly Remote Sensing Monitoring: A Case Study of Southern Hebei Urban Agglomerations, China. China Environ. Sci. 2019, 39, 3120–3129. [Google Scholar]
- Tao, J.; Fan, M.; Gu, J.; Chen, L. Satallite Observations of Return-to-Work over China during the Period of COVID-19. Natl. Remote Sens. Bull. 2020, 24, 824–836. [Google Scholar] [CrossRef]
- Li, J.; Zou, Q.; Luo, S.; Huang, Y.; Wang, J.; Lu, Y. The Temporal and Spatial Analysis of County Poverty Prevention in Ningxia Based on Night Light Remote Sensing Data. In Proceedings of the 2022 4th International Academic Exchange Conference on Science and Technology Innovation (IAECST), Guangzhou, China, 9–11 December 2022; pp. 699–706. [Google Scholar]
- He, T.; Song, H.; Chen, W. Recognizing the Transformation Characteristics of Resource-Based Cities Using Night-Time Light Remote Sensing Data: Evidence from 126 Cities in China. Resour. Policy 2023, 85, 104013. [Google Scholar] [CrossRef]
- Guo, N.; Jiang, M.; Gao, L.; Tang, Y.; Han, J.; Chen, X. CRABR-Net: A Contextual Relational Attention-Based Recognition Network for Remote Sensing Scene Objective. Sensors 2023, 23, 7514. [Google Scholar] [CrossRef]
- Li, R.; Wei, P.; Liu, X.; Li, C.; Ni, J.; Zhao, W.; Zhao, L.; Hou, K. Cutting Tool Wear State Recognition Based on a Channel-Space Attention Mechanism. J. Manuf. Syst. 2023, 69, 135–149. [Google Scholar] [CrossRef]
- Gui, Q.; Wang, G.; Wang, L.; Cheng, J.; Fang, H. Road Surface State Recognition Using Deep Convolution Network on the Low-Power-Consumption Embedded Device. Microprocess. Microsyst. 2023, 96, 104740. [Google Scholar] [CrossRef]
- Ruichao, S.; Xiaodong, C.; Liming, L.; Qianwen, Z. Fastener State Detection Based on Foreground Segmentation. Railw. Stand. Des. 2021, 65, 28–34. [Google Scholar]
- Ciocca, G.; Micali, G.; Napoletano, P. State Recognition of Food Images Using Deep Features. IEEE Access 2020, 8, 32003–32017. [Google Scholar] [CrossRef]
- Tu, Y.; Song, Y.; Li, B.; Zhu, Q.; Cui, S.; Zhu, H. A Deformable Spatial Attention Mechanism-Based Method and a Benchmark for Dock Detection. IEEE J. Sel. Top. Appl. Earth Obs. Remote Sens. 2023, 16, 3730–3741. [Google Scholar] [CrossRef]
- Manzoor, K.; Majeed, F.; Siddique, A.; Meraj, T.; Rauf, H.T.; El-Meligy, M.A.; Sharaf, M.; Elgawad, A.E.E.A. A Lightweight Approach for Skin Lesion Detection Through Optimal Features Fusion. Comput. Mater. Contin. 2022, 70, 1617–1630. [Google Scholar] [CrossRef]
- Eldem, H.; Ülker, E.; Işıklı, O.Y. Alexnet Architecture Variations with Transfer Learning for Classification of Wound Images. Eng. Sci. Technol. Int. J. 2023, 45, 101490. [Google Scholar] [CrossRef]
- Win Lwin, L.Y.; Htwe, A.N. Image Classification for Rice Leaf Disease Using AlexNet Model. In Proceedings of the 2023 IEEE Conference on Computer Applications (ICCA), Yangon, Myanmar, 27–28 February 2023; pp. 124–129. [Google Scholar]
- Deng, P.; Huang, H.; Xu, K. A Deep Neural Network Combined with Context Features for Remote Sensing Scene Classification. IEEE Geosci. Remote Sens. Lett. 2022, 19, 1–5. [Google Scholar] [CrossRef]
- Yang, Y.; Li, Z.; Zhang, J. Fire Detection of Satellite Remote Sensing Images Based on VGG Ensemble Classifier. In Proceedings of the 2021 IEEE Conference on Telecommunications, Optics and Computer Science (TOCS), Shenyang, China, 10–11 December 2021; pp. 31–36. [Google Scholar]
- Andreasen, D.; Edmund, J.M.; Zografos, V.; Menze, B.H.; Van Leemput, K. Computed Tomography Synthesis from Magnetic Resonance Images in the Pelvis Using Multiple Random Forests and Auto-Context Features. In Proceedings of the SPIE Medical Imaging, San Diego, CA, USA, 27 February–3 March 2016; Volume 9784, p. 978417. [Google Scholar]
- Liu, X.; Zhou, Y.; Zhao, J.; Yao, R.; Liu, B.; Ma, D.; Zheng, Y. Multiobjective ResNet Pruning by Means of EMOAs for Remote Sensing Scene Classification. Neurocomputing 2020, 381, 298–305. [Google Scholar] [CrossRef]
- Yu, D.; Guo, H.; Xu, Q.; Lu, J.; Zhao, C.; Lin, Y. Hierarchical Attention and Bilinear Fusion for Remote Sensing Image Scene Classification. IEEE J. Sel. Top. Appl. Earth Obs. Remote Sens. 2020, 13, 6372–6383. [Google Scholar] [CrossRef]
- Zhang, Y.; Chan, S.; Park, V.Y.; Chang, K.-T.; Mehta, S.; Kim, M.J.; Combs, F.J.; Chang, P.; Chow, D.; Parajuli, R.; et al. Automatic Detection and Segmentation of Breast Cancer on MRI Using Mask R-CNN Trained on Non–Fat-Sat Images and Tested on Fat-Sat Images. Acad. Radiol. 2022, 29, S135–S144. [Google Scholar] [CrossRef]
- Natya, S.; Manu, C.; Anand, A. Deep Transfer Learning with RESNET for Remote Sensing Scene Classification. In Proceedings of the 2022 IEEE International Conference on Data Science and Information System (ICDSIS), Hassan, India, 29–30 July 2022; pp. 1–6. [Google Scholar]
- Cheng, L.; Wang, L.; Feng, R.; Tian, S. A Deep Learning-Based Framework for Urban Active Population Mapping from Remote Sensing Imagery. In Proceedings of the IGARSS 2022–2022 IEEE International Geoscience and Remote Sensing Symposium, Kuala Lumpur, Malaysia, 17–22 July 2022; pp. 7799–7802. [Google Scholar]
- Alanazi, S.A. Melanoma Identification Through X-Ray Modality Using Inception-v3 Based Convolutional Neural Network. Comput. Mater. Amp; Contin. 2022, 72, 37–55. [Google Scholar] [CrossRef]
- Yang, M.; Wang, H.; Hu, K.; Yin, G.; Wei, Z. IA-Net: An Inception–Attention-Module-Based Network for Classifying Underwater Images from Others. IEEE J. Ocean. Eng. 2022, 47, 704–717. [Google Scholar] [CrossRef]
- Aslan, M.F.; Sabanci, K.; Durdu, A.; Unlersen, M.F. COVID-19 Diagnosis Using State-of-the-Art CNN Architecture Features and Bayesian Optimization. Comput. Biol. Med. 2022, 142, 105244. [Google Scholar] [CrossRef] [PubMed]
- Wu, B.; Wang, C.; Huang, W.; Huang, D.; Peng, H. Recognition of Student Classroom Behaviors Based on Moving Target Detection. Trait. Du Signal 2021, 38, 215–220. [Google Scholar] [CrossRef]
- Guédon, A.C.; Meij, S.E.; Osman, K.N.; Kloosterman, H.A.; van Stralen, K.J.; Grimbergen, M.C.; Eijsbouts, Q.A.; van den Dobbelsteen, J.J.; Twinanda, A.P. Twinanda Deep Learning for Surgical Phase Recognition Using Endoscopic Videos. Surg. Endosc. 2020, 35, 6150–6157. [Google Scholar] [CrossRef]
- Choudhary, G.; Sethi, D. From Conventional Approach to Machine Learning and Deep Learning Approach: An Experimental and Comprehensive Review of Image Fusion Techniques. Arch. Comput. Methods Eng. 2023, 30, 1267–1304. [Google Scholar] [CrossRef]
- Benediktsson, J.A.; Kanellopoulos, I. Classification of Multisource and Hyperspectral Data Based on Decision Fusion. IEEE Trans. Geosci. Remote Sens. 1999, 37, 1367–1377. [Google Scholar] [CrossRef]
- Gunatilaka, A.H.; Baertlein, B.A. Feature-Level and Decision-Level Fusion of Noncoincidently Sampled Sensors for Land Mine Detection. IEEE Trans. Pattern Anal. Mach. Intell. 2001, 23, 577–589. [Google Scholar] [CrossRef]
- Jimenez, L.O.; Morales-Morell, A.; Creus, A. Classification of Hyperdimensional Data Based on Feature and Decision Fusion Approaches Using Projection Pursuit, Majority Voting, and Neural Networks. IEEE Trans. Geosci. Remote Sens. 1999, 37, 1360–1366. [Google Scholar] [CrossRef]
- Jeon, B.; Landgrebe, D.A. Landgrebe Decision Fusion Approach for Multitemporal Classification. IEEE Trans. Geosci. Remote Sens. 1999, 37, 1227–1233. [Google Scholar] [CrossRef]
- Wang, A.; Jiang, J.; Zhang, H. Multi-Sensor Image Decision Level Fusion Detection Algorithm Based on D-S Evidence Theory. In Proceedings of the 2014 Fourth International Conference on Instrumentation and Measurement, Computer, Communication and Control, Harbin, China, 18–20 September 2014; pp. 620–623. [Google Scholar]
- Petrakos, M.; Benediktsson, J.A.; Kanellopoulos, I. The Effect of Classifier Agreement on the Accuracy of the Combined Classifier in Decision Level Fusion. IEEE Trans. Geosci. Remote Sens. 2001, 39, 2539–2546. [Google Scholar] [CrossRef]
- Prabhakar, S.; Jain, A.K. Decision-Level Fusion in Fingerprint Verification. Pattern Recognit. 2002, 35, 861–874. [Google Scholar] [CrossRef]
- Zhao, Y.; Yin, Y. Dongmei Fu Decision-Level Fusion of Infrared and Visible Images for Face Recognition. In Proceedings of the 2008 Chinese Control and Decision Conference, Yantai, China, 2–4 July 2 2008; pp. 2411–2414. [Google Scholar]
- Seal, A.; Bhattacharjee, D.; Nasipuri, M.; Gonzalo-Martin, C.; Menasalvas, E. À-Trous Wavelet Transform-Based Hybrid Image Fusion for Face Recognition Using Region Classifiers. Expert Syst. 2018, 35, e12307. [Google Scholar] [CrossRef]
- Yager, R.; Liu, L. Classic Works of the Dempster-Shafer Theory of Belief Functions; Springer: Berlin/Heidelberg, Germany, 2008; Volume 219, ISBN 978-3-540-25381-5. [Google Scholar]
- Rota, G.-C. 222 pp Deterministic and Stochastic Optimal Control, W.H. Fleming, R.W. Rishel, Springer (1975). Adv. Math. 1977, 24, 341. [Google Scholar] [CrossRef]
- Hermessi, H.; Mourali, O.; Zagrouba, E. Multimodal Medical Image Fusion Review: Theoretical Background and Recent Advances. Signal Process. 2021, 183, 108036. [Google Scholar] [CrossRef]
- Ding, B.; Wen, G.; Huang, X.; Ma, C.; Yang, X. Target Recognition in Synthetic Aperture Radar Images via Matching of Attributed Scattering Centers. IEEE J. Sel. Top. Appl. Earth Obs. Remote Sens. 2017, 10, 3334–3347. [Google Scholar] [CrossRef]
- Feng, H.C. Land-Cover Classification of High-Resolution Remote Sensing Image Based on Multi-Classifier Fusion and the Improved Dempster-Shafer Evidence Theory. J. Appl. Remote Sens. 2021, 15, 014506. [Google Scholar] [CrossRef]
- Haouas, F.; Solaiman, B.; Ben Dhiaf, Z.; Hamouda, A.; Bsaies, K. Multi-Temporal Image Change Mining Based on Evidential Conflict Reasoning. ISPRS J. Photogramm. Remote Sens. 2019, 151, 59–75. [Google Scholar] [CrossRef]
- Wang, Z.; Fang, Z.; Wu, Y.; Liang, J.; Song, X. Multi-Source Evidence Data Fusion Approach to Detect Daily Distribution and Coverage of Ulva Prolifera in the Yellow Sea, China. IEEE Access 2019, 7, 115214–115228. [Google Scholar] [CrossRef]
- Zhou, Y.; Song, Y.; Cui, S.; Zhu, H.; Sun, J.; Qin, W. A Novel Change Detection Framework in Urban Area Using Multilevel Matching Feature and Automatic Sample Extraction Strategy. IEEE J. Sel. Top. Appl. Earth Obs. Remote Sens. 2021, 14, 3967–3987. [Google Scholar] [CrossRef]
- Szegedy, C.; Vanhoucke, V.; Ioffe, S.; Shlens, J.; Wojna, Z. Rethinking the Inception architecture for computer vision. In Proceedings of the 2016 IEEE Conference on Computer Vision and Pattern Recognition (CVPR), Las Vegas, NV, USA, 27–30 June 2016; pp. 2818–2826. [Google Scholar]
- He, K.M.; Zhang, X.Y.; Ren, S.Q.; Sun, J. Deep residual learning for image recognition. In Proceedings of the 2016 IEEE Conference on Computer Vision and Pattern Recognition (CVPR), Las Vegas, NV, USA, 27–30 June 2016; pp. 770–778. [Google Scholar]
- Deng, J.; Dong, W.; Socher, R.; Li, L.J.; Li, K.; Li, F.F. ImageNet: A large-scale hierarchical image database. In Proceedings of the CVPR: 2009 IEEE Conference on Computer Vision and Pattern Recognition, Miami, FL, USA, 20–25 June 2009; Volumes 1–4; pp. 248–255. [Google Scholar]
- Yager, R.R. On the Dempster-Shafer Framework and New Combination Rules. Inf. Sci. 1987, 41, 93–137. [Google Scholar] [CrossRef]


| Satellite | Sensors | Level | Revisit Cycle/Day | Spatial Resolution/m |
|---|---|---|---|---|
| ZY-3 | Optical | True Color Image Products | 5 | 2.1 |
| GF-1 | Optical | Level-1A | 4 | 2 |
| Google Earth | Optical | True Color Image Products | / | 2 |
| Yangtze River Delta | Time/Month | Jan | Feb | Mar | Apr | May | Jun |
| Time/Quarter | I | II | |||||
| Optical (ZY-3) | ⚪ | ⚪ | |||||
| Bohai Rim | Time/Month | Jan | Feb | Mar | Apr | May | Jun |
| Time/Quarter | I | II | |||||
| Optical (GF-1) | ⚪ | ⚪ | |||||
| Core Site | The Normal Production State | The Abnormal Production State |
|---|---|---|
| ZY-3 Optical Image | ZY-3 Optical Image | |
| SCS (dock/berth)  | 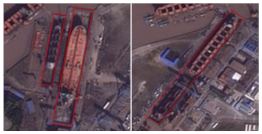 | 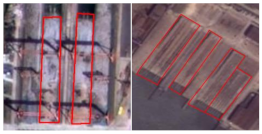 |
| MUCS (material storage area/assembly area)  |  | 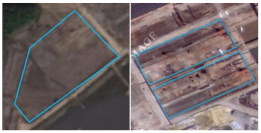 |
| Core Sites | Production State | Amount | Sample Example |
|---|---|---|---|
| SCS | Normal | 1548 | 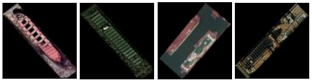 |
| Abnormal | 1548 |  | |
| MUCS | Normal | 444 | 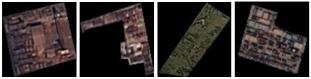 |
| Abnormal | 444 | 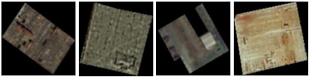 |
| Sample Datasets Ratio (Training: Validation) | Training Optimizer | Momentum Factor | Batch Size | Epoch | Initial Learning Rate |
|---|---|---|---|---|---|
| 8:2 | SGDM | 0.9 | 64 | 100 | 0.001 |
| Shipyard | Images | True State | ||||
|---|---|---|---|---|---|---|
| i | 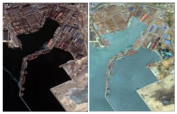 | 0.99 | 0.99 | 0.99 | 0.99 | Normal |
| ii | 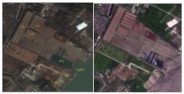 | 0.01 | 0.02 | 0.01 | 0.01 | Abnormal |
| iii | 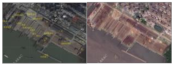 | 0.14 | 0.02 | 0.90 | 0.92 | Normal |
| iv |  | 0.99 | 0.99 | 0.01 | 0.06 | Normal |
| v | 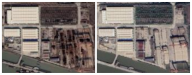 | 0.75 | 0.04 | 0.99 | 0.93 | Normal |
| vi | 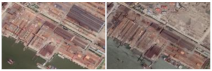 | 0.04 | 0.16 | 0.82 | 0.85 | Normal |
| Shipyard | Yager | DS Evidence Fusion | Improved DS Evidence Fusion | True State | |||||
|---|---|---|---|---|---|---|---|---|---|
| iii | 0.14 | 0.02 | 0.90 | 0.92 | -- | 0.13 | 0.47 | 0.58 | Normal |
| vi | 0.04 | 0.16 | 0.82 | 0.85 | -- | 0.14 | 0.36 | 0.88 | Normal |
| Area | CNN | Period | Accuracy | Precision | FA | Recall | MA | F1-Score |
|---|---|---|---|---|---|---|---|---|
| Yangtze River Delta | Inception v3 | The 1st half-year | 99.11% | 100.00% | 0.00% | 94.12% | 5.88% | 96.97% |
| ResNet101 | The 1st half-year | 100.00% | 100.00% | 0.00% | 100.00% | 0.00% | 100.00% | |
| Bohai Rim | Inception v3 | The 1st half-year | 97.67% | 87.50% | 12.50% | 100.00% | 0.00% | 93.33% |
| ResNet101 | The 1st half-year | 95.35% | 85.71% | 14.29% | 85.71% | 14.29% | 85.71% |
| Area | Fusion Method | CNN | Periods | Accuracy | Precision | FA | Recall | MA | F1-Score |
|---|---|---|---|---|---|---|---|---|---|
| Yangtze River Delta | Traditional DS evidence fusion | Inception v3 | The 1st half-year | 98.21% | 89.47% | 10.53% | 100.00% | 0.00% | 94.44% |
| ResNet101 | The 1st half year | 97.32% | 85.00% | 15.00% | 100.00% | 0.00% | 91.89% | ||
| Voting | Inception v3 | The 1st half-year | 90.18% | 60.71% | 39.29% | 100.00% | 0.00% | 75.56% | |
| ResNet101 | The 1st half-year | 91.94% | 65.38% | 34.62% | 100.00% | 0.00% | 75.56% | ||
| Yager | Inception v3 | The 1st half-year | 89.29% | 58.62% | 41.38% | 100.00% | 0.00% | 73.91% | |
| ResNet101 | The 1st half-year | 88.39% | 56.67% | 43.33% | 100.00% | 0.00% | 72.34% | ||
| Bohai Rim | Traditional DS evidence fusion | Inception v3 | The 1st half-year | 97.67% | 87.50% | 12.50% | 100.00% | 0.00% | 93.33% |
| ResNet101 | The 1st half-year | 97.67% | 87.50% | 12.50% | 100.00% | 0.00% | 93.33% | ||
| Voting | Inception v3 | The 1st half-year | 88.37% | 58.33% | 41.67% | 100.00% | 0.00% | 73.68% | |
| ResNet101 | The 1st half-year | 90.70% | 63.64% | 36.36% | 100.00% | 0.00% | 77.78% | ||
| Yager | Inception v3 | The 1st half-year | 86.05% | 53.85% | 46.15% | 100.00% | 0.00% | 70.00% | |
| ResNet101 | The 1st half-year | 86.05% | 53.85% | 46.15% | 100.00% | 0.00% | 70.00% |
| Shipyard | Images | True State |
|---|---|---|
| vii | 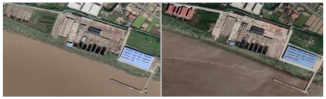 | Abnormal |
| viii | 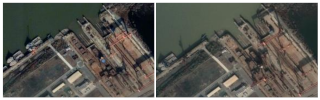 | Abnormal |
| ix |  | Abnormal |
Disclaimer/Publisher’s Note: The statements, opinions and data contained in all publications are solely those of the individual author(s) and contributor(s) and not of MDPI and/or the editor(s). MDPI and/or the editor(s) disclaim responsibility for any injury to people or property resulting from any ideas, methods, instructions or products referred to in the content. |
© 2023 by the authors. Licensee MDPI, Basel, Switzerland. This article is an open access article distributed under the terms and conditions of the Creative Commons Attribution (CC BY) license (https://creativecommons.org/licenses/by/4.0/).
Share and Cite
Qin, W.; Song, Y.; Zhu, H.; Yu, X.; Tu, Y. A Novel Shipyard Production State Monitoring Method Based on Satellite Remote Sensing Images. Remote Sens. 2023, 15, 4958. https://doi.org/10.3390/rs15204958
Qin W, Song Y, Zhu H, Yu X, Tu Y. A Novel Shipyard Production State Monitoring Method Based on Satellite Remote Sensing Images. Remote Sensing. 2023; 15(20):4958. https://doi.org/10.3390/rs15204958
Chicago/Turabian StyleQin, Wanrou, Yan Song, Haitian Zhu, Xinli Yu, and Yuhong Tu. 2023. "A Novel Shipyard Production State Monitoring Method Based on Satellite Remote Sensing Images" Remote Sensing 15, no. 20: 4958. https://doi.org/10.3390/rs15204958
APA StyleQin, W., Song, Y., Zhu, H., Yu, X., & Tu, Y. (2023). A Novel Shipyard Production State Monitoring Method Based on Satellite Remote Sensing Images. Remote Sensing, 15(20), 4958. https://doi.org/10.3390/rs15204958