Abstract
Desert oases are vital for maintaining the ecological balance in arid regions’ inland river basins. However, fine-grained assessments of water stress in desert oasis ecosystems are limited. In our study, we aimed to evaluate the water stress in desert oasis ecosystems in the middle reaches of the Keriya River Basin, with a specific focus on their ecological functions and optimizing water resource management. We hypothesized that evapotranspiration has significant effects on ecological water consumption. First, we estimated the actual evapotranspiration (ET) and potential evapotranspiration (PET) based on the SEBS (surface energy balance system) model and remote sensing downscaling model. Then, the ecological water requirement (EWR) and ecological water stress (EWS) index were constructed to evaluate the ecological water resource utilization. Finally, we explored the influencing factors and proposed coping strategies. It was found that regions with higher ET values were mainly concentrated along the Keriya River and its adjacent farmland areas, while the lower values were observed in bare land or grassland areas. The total EWR exhibited the sequence of grassland > cropland > forest, while the EWR per unit area followed the opposite order. The grassland’s EWS showed a distinct seasonal response, with severe, moderate, and mild water shortages and water plenitude corresponding to spring, summer, autumn, and winter, respectively. In contrast, the land use types with the lowest EWS were water areas that remained in a state of water plentitude grade (0.08–0.20) throughout the year. Temperature and vegetation index were identified as the primary influencing factors. Overall, this study provides a reliable method for evaluating the EWR and EWS values of basin scale vegetation, which can serve as a scientific basis for formulating water resource management and regulation policies in the region.
1. Introduction
Water supply and utilization in inland river basins is critical to maintaining ecosystem health and stability in arid and semi-arid regions [1]. However, global climate change and human activities have intensified water shortages and overexploitation in desert oases, further threatening human society’s security [2,3]. Therefore, effective water resource management is a fundamental prerequisite for protecting the basin’s ecological environment and promoting sustainable socio-economic development. The spatial quantification of ecological water requirement (EWR) is indispensable to achieving the precise regulation of water resources [4]. EWR refers to the total water demand necessary to maintain basin water balance and ensure the ecosystem’s basic functions [5]. Based on the watershed ecosystem’s composition, EWR can be divided into river, vegetation, wetland, and urban ecological water requirement [6]. The vegetation ecosystem plays a crucial role in controlling soil erosion and balancing the watershed ecosystem [7]. Accurately assessing vegetation ecological water requirement in ecologically fragile arid and semi-arid areas is vital to better maintaining stable biodiversity in desert oasis ecosystems.
Several approaches are used for calculating vegetation EWR, including the area quota method, phreatic evaporation method, water balance method, biomass method, Penman–Monteith method, and remote sensing method [8,9,10]. The area quota method is suitable for plants sharing similar underlying surface and climatic conditions and is commonly used to calculate water requirement for artificial vegetation [11]. The phreatic evaporation method is prevalent in arid and semi-arid areas with little precipitation, where vegetation growth heavily relies on groundwater. However, obtaining sufficiently accurate groundwater level data is often challenging. The water balance method focuses mainly on hydrological process changes and does not consider the physiological characteristics of vegetation, limiting its applicability [12]. The biomass method and the Penman–Monteith method comprehensively consider vegetation and soil influences but may not accurately capture the spatial characteristics of the study area based solely on field observation stations [13]. Remote sensing satellite imagery provides high-resolution reflectance data and land cover information, enabling researchers to conduct observations at a regional scale. Studies have established that it is very feasible to use satellite remote sensing to estimate vegetation EWR at the basin scale, and this technique offers the advantages of low cost, high efficiency, and accurate spatial quantification [13,14,15].
Evapotranspiration (ET) is the main component of ecological water consumption in dry land vegetation ecosystems [16]. It serves as a key factor in estimating vegetation EWR. In recent years, scientists have integrated remote sensing technology and energy balance models to generate cost-effective and high-precision maps of ET and EWR [17,18]. The SEBS model is widely recognized as a valuable tool in remote sensing technology, possessing extensive applications in terrestrial ecological research, drought monitoring, and water resource management [19,20]. The SEBS model enables the large-scale and multi-temporal monitoring and analysis of evapotranspiration. It overcomes the limitations and potential errors that may arise when traditional methods (such as Penman–Monteith) are scaled up from station to regional level applications, particularly in areas with significant spatial heterogeneity [21]. Moreover, the SEBS model fully incorporates the influence of climate, vegetation, soil, and other factors on surface evapotranspiration. The input parameters and model structure can be modified according to the study area’s characteristics, further improving the accuracy and applicability of evapotranspiration inversion [22].
ET and EWR, respectively, analyze the water resource utilization of ecosystems from a single perspective of ecosystem water consumption and water demand. They also need to be combined with other parameters, such as ecological pressure caused by water supply–demand imbalance, to reflect the risks of water scarcity [23]. Water stress is defined as the inability of water resources to meet human or ecological demands for fresh water due to water supply and consumption issues [24]. Severe pressure on water resources may cause various ecological and environmental issues, such as water drying and shrinking, water pollution, and vegetation withering [25]. Early researchers in this field used drought indices, including the standardized precipitation index (SPI) and the standardized precipitation evapotranspiration index (SPEI), to characterize water resource availability [26]. Subsequently, the water stress index integrated various water resource balance factors, including drought, to more comprehensively reflect water supply and demand in a region. The measurement standard of water resource risk has further transformed from a single availability index into a utilization–availability index [25,27]. However, most studies on water resource stress focus on the stress caused by “blue water” (visible flowing water, such as surface water and groundwater) [28,29]. The stress assessment on “green water” (the water returned to the atmosphere through vegetation transpiration and soil evaporation), which is closely related to ecology, is rarely studied. The assessment of ecological water stress plays a significant role in water resource allocation in watersheds and the ecological restoration of vegetation in oasis areas, particularly in arid and semi-arid regions where the imbalance between water supply and demand is prominent [30].
The Keriya River, spanning 438 km through the arid region of Northwest China, is a significant river in southern Xinjiang. Originating from the northern foot of the Kunlun Mountains, the Keriya flows from south to north deep into the Taklimakan Desert, developing the Yutian oasis in its middle reaches and the Daliyaboyi oasis in its lower reaches. This creates a typical oasis–desert ecosystem. Serving as a vital link between the upstream and downstream regions, the middle reaches hold direct implications for the overall ecological water security of the entire river basin. Moreover, the middle reaches are home to major residential areas and cultivated lands within the basin, consequently exerting a significant influence on human activities [31]. Through previous research, it has been demonstrated that there has been a continuous expansion of cultivated land (over 6%) and a notable degradation of grassland (over 16%) in the middle reaches over the past two decades, leading to considerable strain on the corresponding ecosystem’s water usage [32]. Furthermore, the acquisition of data in the oasis region of the middle reaches also boasts distinct advantages over that of the lower reaches. As such, this study focuses on the oasis in the middle reaches of the Keriya River Basin. Using Landsat 8-9 OLI/TIRS and MOD16A2 remote sensing data, as well as model simulations, we constructed a monitoring system for evaluating EWR and EWS of desert oasis in the years 2021 and 2022, from which time the most recent data are available.
The main objectives of this research were as follows: (i) accurately identify the spatiotemporal characteristics of actual and potential evapotranspiration in the middle reaches of the Keriya River Basin; (ii) quantitatively assess the ecological water requirement and ecological water stress of the oasis; (iii) analyze the impact of climate conditions and geographical environment on evapotranspiration, water requirement, and water stress. This study presents a valuable approach and case for monitoring the EWR and EWS of desert oases, offering essential response strategies for water resource management. It is anticipated that this monitoring system can be widely applied to assess water resource conditions in desert oases in other nations or regions, thereby facilitating the rational utilization of water resources and fostering sustainable social and economic development in arid areas.
2. Materials and Methods
2.1. Study Area
This study focused on the artificial oasis in the middle reaches of the Keriya River Basin (Figure 1), located between 36°37′50″–37°14′22″N and 80°41′39″–82°0′03″E. This area is endowed with a temperate continental arid climate, with an average temperature of 11.2 °C and annual precipitation of 50.3 mm. The annual evaporation is 1962.0 mm. The dominant soil types are meadow soil and brown desert soil, while the primary vegetation types include Populus euphratica, Tamarix ramosissima, alhagi, dogbane herb, karelinia caspica, and Phragmites australis. The primary crop types cultivated in the region are cotton, maize, wheat, rice, and grapes.
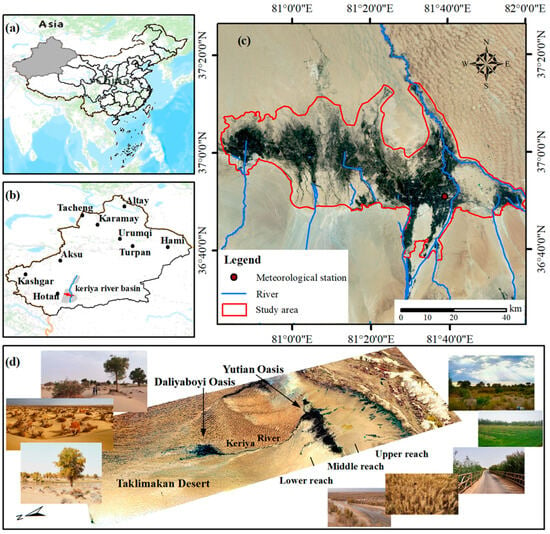
Figure 1.
Location and geography of the study area. (a) The location of Xinjiang in China; (b) the location of the Keriya River Basin and the study area in Xinjiang (the area of the Keriya River Basin is represented by the gray area, the range of the study area is represented by the red area, the blue line represents Keriya River, and the black solid dots indicate the surrounding cities); (c) the location of Yutian meteorological station and the distribution of river systems in the middle reaches of the river basin; (d) Landsat 8 OLI image, indicating the upper, middle, and lower reaches of the river basin, as well as the location of Yutian oasis and Daliyaboyi oasis in the basin.
2.2. Data
The Landsat 8-9 OLI/TIRS C2 L2 remote sensing data used in this study were obtained from the USGS website (https://earthexplorer.usgs.gov/) (accessed on 17 February 2023). Landsat Collection 2 Level-2 is a high-quality data product generated through the correction and cleaning of Level-1 data. Surface reflectance data products were generated based on the land surface reflectance code (LaSRC), and the accuracy of radiation correction was improved using MODIS auxiliary climate data. Potential evapotranspiration (PET) data were extracted from the MOD16A2 dataset provided by NASA Earth Observing System Data and Information Center (EOSDIS) (https://ladsweb.modaps.eosdis.nasa.gov) (accessed on 17 February 2023). ModISTool and ENVI 5.6 software were utilized for preprocessing work, including format conversion, band extraction, projection conversion, and cropping. Table 1 provides details on the selection and acquisition sources of remote sensing images.

Table 1.
Descriptions of the acquisition sources of the remote sensing images.
The daily meteorological data for the period 2021–2022 were obtained from the Urumqi Meteorological Bureau, including the daily average temperature, maximum temperature, minimum temperature, air pressure, wind speed, relative humidity, and sunshine hours on the day of satellite transit. The ASTER GDEM elevation data with a spatial resolution of 30 m, covering five scenes in the study area, were obtained from the Chinese Geospatial Data Cloud (http://www.gscloud.cn/) (accessed on 1 March 2023). Land use/land cover (LULC) data with a spatial resolution of 10 m were acquired from Sentinel-2 Land Cover Explorer (https://livingatlas.arcgis.com/landcoverexplorer) (accessed on 1 March 2023), which is an online land cover classification tool supported by ESRI that uses machine learning and artificial intelligence algorithms to classify multi-band remote sensing images.
2.3. Methods
This study evaluated the water resource use efficiency and water stress in the study area using Landsat 8-9 OLI/TIRS and MOD16A2 remote sensing images and meteorological data. First, actual evapotranspiration was estimated based on the SEBS model. Then, high-resolution potential evapotranspiration (PET) was obtained by downscaling using the MOD16A2 data product. Finally, vegetation EWR and EWS were calculated and analyzed based on actual and potential evapotranspiration. Figure 2 presents an illustrative framework to enhance our interpretation of this working system.
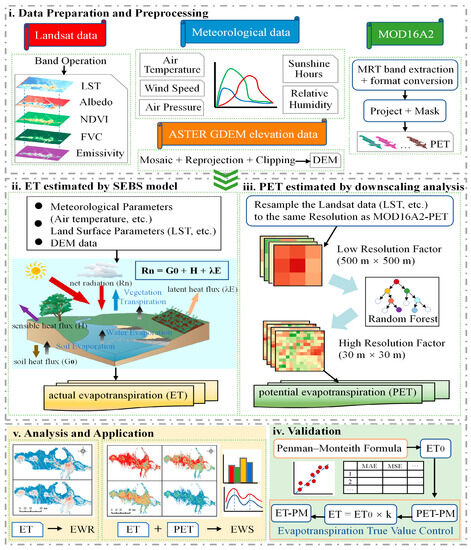
Figure 2.
An illustrative framework for the working system of this study.
2.3.1. The SBES Model
The SEBS model uses the surface information provided by remote sensing satellite data, combined with meteorological data to estimate the surface flux. The energy balance equation contains different components involved in the surface energy exchange, including net radiation, sensible heat flux, latent heat flux, and soil heat flux. Using the principle of constant evaporation ratio, the SEBS model estimates daily evaporation from instantaneous evaporation measured during satellite transits. The surface energy balance equation can be expressed as:
where is the surface net radiation (W·m−2); is the soil heat flux (W·m−2); H is the sensible heat flux (W·m−2); λE is the latent heat flux (W·m−2); E is the actual evapotranspiration (mm); λ is the vaporization latent heat coefficient of water (2.49 × 10⁶ W·m−2·mm−1).
The surface net radiation, , represents the balance between incoming and outgoing radiation at the Earth’s surface. It reflects the net income and expenditure of shortwave (solar) radiation and longwave (thermal) radiation. The calculation of surface net radiation can be expressed using the following formula:
where α is the surface albedo, calculated according to the method applicable to Landsat-8 OLI data [33]; is the downward solar short-wave radiation (W·m−2); is the downward atmospheric long-wave radiation (W·m−2); σ is the Stefan–Bolzmann constant (5.678 × 10⁻⁸ W·m−2·K−4); ε is the surface emissivity; is the surface temperature (K).
The soil heat flux, , quantifies the heat exchange that occurs between the soil and vegetation. It represents the amount of heat transferred through conduction within the soil layer. The calculation of soil heat flux can be expressed using the following formula:
where and are empirical coefficients that represent the ratio of soil heat flux to net radiation. The value is 0.05 in the area covered by complete vegetation () and 0.315 in the area covered by bare soil (), and the area between the two is interpolated using the vegetation coverage ().
Sensible heat flux H represents the heat exchange per unit time between the land surface and the surrounding air. This value is calculated using the atmospheric surface layer (ASL) and the atmospheric boundary layer (ABL) via the application of stability correction functions such as BAS and MOS. Multiple iterative calculations are often required to obtain an accurate estimation of sensible heat flux. This iterative process ensures that the estimate of sensible heat flux aligns with the observed data and provides a more reliable understanding of land–atmosphere heat exchange. The specific formula is:
where k is the von Karman constant; u and are wind speed and friction, respectively (m·s−1); z is the reference altitude (m); and are stability correction functions for thermodynamic and kinetic transport; and are the surface heat transfer roughness length and dynamic roughness length (m); is the zero plane displacement height (m); L is the Obukhov length (m); and are the potential temperatures at the surface and reference height (K); ρ is the air density (kg·m−3); is the specific heat for air (J·kg−1·K−1); is the potential temperature near the surface (°C); g is the acceleration of gravity (9.8 m·s−2).
To determine the evaporation coefficient, the SEBS model analyzes the ratio of latent to sensible heat of pixels in an image under extremely dry and humid conditions. Sensible heat flux becomes the dominant form of heat transport under extremely dry surface conditions. When soil moisture is insufficient to support evaporation, the latent heat flux of thermal energy associated with evaporation approaches zero. On the other hand, sensible heat flux is minimized in extremely wet surface environments. This means that less heat is transferred directly between the land surface and the air. Instead, most of the available energy is used for latent heat flux, which explains the intense evaporation of soil water. The expression for calculating the evaporation fraction () from the relative evaporation fraction () is estimated as:
where is the sensible heat flux under extremely dry surface environment (W·m−2); and are latent heat flux and sensible heat flux under an extremely humid surface environment (W·m−2). Assuming that the evaporation ratio does not change within a day, the daily evapotranspiration can be calculated as follows:
where is the actual evapotranspiration (mm·d−1); is the water density (kg·m−3).
2.3.2. Downscaling Analysis of PET
In order to match the SEBS ET data, this study employed a downscaling method based on the random forest algorithm to spatially downscale the PET data. The basic principle of this method is to establish a regression model using the coarse-resolution MOD16A2 PET data and surface feature factors that are correlated with the PET process at the same scale. Based on the hypothesis that the spatial scale relationship remains constant, it is assumed that the regression model constructed at the low-resolution scale is still applicable at the high-resolution scale [34]. By inputting the high-resolution feature parameter data into the established downscaling model, the high-resolution PET results can be obtained. The downscaling model can be represented as:
where represents the target data; (normalized difference vegetation index), (land surface temperature), (land surface emissivity), (broad-band surface reflectance), (fractional vegetation cover), and are downscaling factors related to PET that are closely associated with water and energy exchange. The regression function uses the random forest algorithm, which is an ensemble learning algorithm that enhances prediction accuracy by combining the predictions of multiple decision trees. It can be represented as:
where is the prediction result of the random forest model; is the i-th predictor; n is the total number of predictors.
In this study, we utilized MAE (mean absolute error), RMSE (root mean square error), and R2 (coefficient of determination) as evaluation metrics to assess the regression accuracy of the PET downscaling model. Furthermore, the accuracy of the model was verified using the Penman–Monteith equation. The specific expressions are as follows:
where is the actual values of PET, and is the predicted values of PET; i denotes the i-th sample, and n is the total number of samples. The Penman–Monteith equation is as follows:
where is the reference crop evapotranspiration (mm·d−1); is the net surface radiation (MJ·m−2·d−1); is the soil heat flux (MJ·m−2·d−1); γ is the psychrometric constant (kPa·°C−1); represents the average temperature (°C); represents the slope of the saturation vapor pressure curve at temperature T (kPa·°C−1); and represent the saturation vapor pressure and actual vapor pressure, respectively (kPa); represents the wind speed at a height of 2 m above the ground (m·s−1).
2.3.3. Calculation of Vegetation EWR
Evapotranspiration is the primary physiological process through which plants in arid areas consume water. It can account for up to 90% of the total ecological water demand during the growth period [35]. In this study, the extension of the area quota method, known as the evapotranspiration method, is employed to determine and calculate the ecological water requirement of local vegetation. This value is calculated as follows:
where represents the area of the i-th vegetation type (m2); represents the evapotranspiration corresponding to the i-th vegetation type (mm) (which was retrieved by SEBS model in this study); is the vegetation ecological water requirement (m3).
2.3.4. Calculation of EWS
The actual evapotranspiration and potential evapotranspiration obtained from the SEBS model and the MOD16A2 dataset are used to calculate ecological water stress (EWS). The calculation process is as follows:
where EWS is the ecological water stress (a dimensionless value that represents the utilization and stress of the local ecological water resources). The greater the EWS value, the greater the risk of ecological water shortage will be. According to the common quartile method in statistics, the evaluation criteria of EWS are shown in Table 2. ET is the actual evapotranspiration (mm·d−1) and can be obtained from the SEBS model; PET is the potential evapotranspiration (mm·d−1) and can be obtained by downscaling analysis of MOD16A2 data.

Table 2.
Water shortage severity classification based on EWS.
3. Results
3.1. Verification of the Rationality of the Results
Evapotranspiration has ceased to be a fixed observation item of the local meteorological observatory in the study area since 2020. Considering the lack of measured data, we selected the evapotranspiration calculated by the Penman–Monteith formula suggested by the Food and Agriculture Organization of the United Nations (FAO) as the true value. It should be noted that the reference crop evapotranspiration (ET0) calculated using the Penman–Monteith formula represents the potential evapotranspiration under ideal conditions such as extensive land, vigorous growth, sufficient fertility, and no pests and diseases. In other words, ET0 is equivalent to PET. The downscaled simulation of PET and ET0 data showed a close approximation to the 1:1 line, with the R2 value exceeding 0.86 (Figure 3c,d). The random forest regression model for PET in this study also showed good accuracy (Table 3). Furthermore, there was a strong agreement between the PET derived from the Landsat data and the original MOD16A2 PET (Figure 3e,f), with the R2 value ranging from 0.91 to 0.92, the MAE ranging from 0.72 to 1.16 mm, and the RMSE ranging from 0.89 to 1.46 mm.
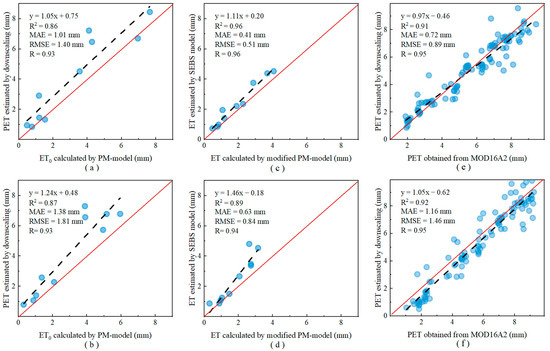
Figure 3.
Reliability assessment of ET and PET analog values (the red line represents the 1:1 line, and the dotted line represents the fitting line). (a,b): Difference between downscaled PET and PM ET0 in 2021 and 2022; (c,d): difference between SEBS ET and modified-PM ET in 2021 and 2022; (e,f): difference between downscaled PET and MOD16A2 PET in 2021 and 2022.

Table 3.
Description of random forest regression fitting accuracy.
Actual evapotranspiration is influenced by various factors, including climatic conditions, plant type, growth cycle, and soil moisture status [13]. In order to evaluate the ET simulated by the SEBS model more accurately, a correction was applied using the crop coefficient mentioned in the related research [36]. This allowed us to estimate the actual evapotranspiration value from ET0. As shown in Figure 3a,b, the ET values simulated by the SEBS model in this study closely aligned with the ET calculated using the modified Penman–Monteith formula, with an R2 value exceeding 0.89. However, there was still a slight overestimation, as indicated by the trend line lying above the 1:1 line. The MAE for 2021 and 2022 was 0.41 mm and 0.63 mm, respectively, while the RMSE was 0.51 mm and 0.84 mm, respectively. Therefore, the SEBS model demonstrated good performance in simulating evapotranspiration in the oasis area located in the middle reaches of the Keriya River.
In general, the simulated values of ET and PET closely followed the trend of the actual values, with only a small discrepancy between them. The R2 values indicated a high level of agreement between the simulated and real values. By utilizing the Penman–Monteith formula as an intermediary, the two distinct datasets employed in this study, namely SEBS ET and downscaled PET, exhibited good comparability. As a result, they can be reliably utilized for the estimation of EWR and EWS in this research.
3.2. Spatiotemporal Characteristics of Evapotranspiation (ET and PET)
Figure 4 and Figure 5 display the temporal and spatial distribution characteristics of daily ET in the middle reaches of the Keriya River Basin. In 2021, the daily ET values ranged from 0 to 9.336 mm throughout the middle reaches, with an average of 1.21 mm/d. In 2022, the daily ET varied between 0 and 8.347 mm, with an average of 1.34 mm/d. The ET values in 2022 were slightly higher than those observed in 2021, although the ET values in 2021 exhibited greater fluctuations. Furthermore, it was evident that the vegetation growth season (spanning from April to October) corresponded to a relatively high period of ET and PET. The differences in ET and PET between the two years mainly occurred during the growing season, with minimal variation observed during the nongrowing season. Apart from a slight dip in ET values in April 2021, the trend of ET and PET throughout the year remained relatively stable. ET generally exhibited a gradual increase from January to July, peaked in August, and then displayed a clear downward trend, reaching its lowest point in December. PET started to rise rapidly in February, reached its maximum in July, and then declined until January of the following year.
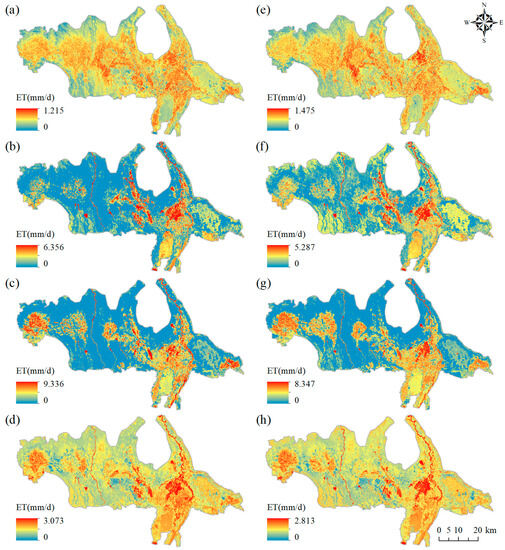
Figure 4.
Spatiotemporal distribution of daily ET in the middle reaches of the Keriya River Basin. The maps show April (spring), July (summer), October (autumn), and January (winter): (a) 4 January 2021; (b) 10 April 2021; (c) 15 July 2021; (d) 19 October 2021; (e) 15 Jane 2022; (f) 5 April 2022; (g) 18 July 2022; (h) 22 October 2022.
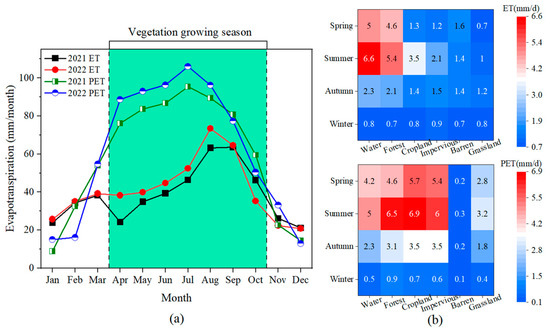
Figure 5.
Statistics of evapotranspiration from 2021 to 2022. (a) The annual variation trend of ET and PET; (b) the seasonal response of ET and PET under different land use types.
The distribution pattern of ET was basically consistent with the current land use status (Figure 6). The distribution of high ET values in the middle reaches of the Keriya River Basin was primarily concentrated in areas that were in close proximity to both sides of the river, areas with cultivated land, and areas with vegetation cover adjacent to farmland. In contrast, the location of low ET values varied with different seasons. During spring and summer, they were commonly observed in grassland areas within the study area, while in winter they appeared on the bare land at the edges of the oasis. As for autumn, the low ET values can be found in both bare land and grassland areas, with less distinct boundaries between them. Furthermore, both ET and PET showed obvious seasonal differences. Evapotranspiration during summer was significantly higher than in other seasons, followed by spring and autumn, while winter represented the period with the lowest evapotranspiration. Among different land cover types, the water and forest displayed the most pronounced seasonal differences in ET, with winter values only amounting to 1/8 of those observed in summer. PET showed noticeable seasonal variations in water, forest, cropland, and impervious areas, exhibiting differences of up to 10 times between winter and summer. Only barren land maintained a relatively stable low value for both ET and PET throughout the year, with minor distinctions.
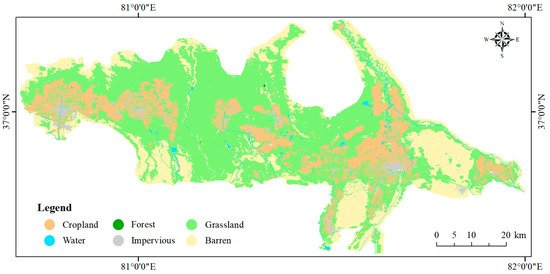
Figure 6.
Land use map of the oasis in the middle reaches of the Keriya River Basin.
3.3. Spatiotemporal Characteristics of Vegetation EWR
The EWR of vegetation in the middle reaches of the Keriya River Basin was estimated using the ET data after inversion by the SEBS model. The results are summarized in Table 4. In 2021, the EWR of vegetation was 10.445 × 10⁸ m3, and it increased to 10.995 × 10⁸ m3 in 2022, which was a growth of 0.55 × 10⁸ m3. When comparing the total EWR of each vegetation type, we found that the overall requirement was mainly influenced by the size of the vegetation area. Taking 2021 as an example, the order of total ecological water requirement from high to low was: grassland (6.328 × 10⁸ m3) > cropland (4.123 × 10⁸ m3) > forest (0.004 × 10⁸ m3). If we consider the vegetation water requirement capacity per unit area, the average EWR followed an opposite pattern compared with the total EWR: forest (1.067 × 10³ m3) > cropland (0.642 × 10³ m3) > grassland (0.327 × 10³ m3). This trend is also evident in Figure 7. During the growing season, the water requirement per unit area for forest was significantly higher than for cropland and grassland. Additionally, an interesting observation was that the EWR of grassland exhibited a bimodal distribution. The first peak occurred February-March, while the second peak was observed August–September.

Table 4.
Ecological water requirement of vegetation in the study area.
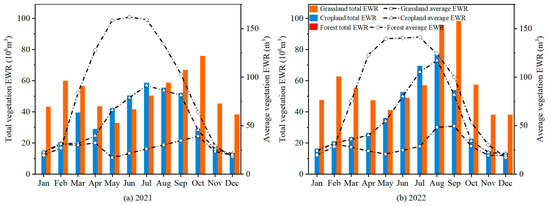
Figure 7.
Vegetation EWR statistics 2021–2022.
Figure 8 illustrates the spatial distribution of annual-scale vegetation EWR in the study area. Generally, there was a south-to-north and east-to-west gradient, with higher values in the southern and eastern regions and lower values in the northern and western regions. The areas with higher vegetation EWR were predominantly located in the wet riverbank regions that had greater vegetation coverage, with these areas generally exceeding 900 m3. On the other hand, remote areas with poor water conditions exhibited sparse vegetation and significantly lower EWR values, most of which were below 150 m3. Cropland was mainly concentrated in the central region, accounting for 18% of the total study area, with relatively high EWR values. At the same time, there were also some discrete low-value areas of EWR, most of which were impervious surfaces and unused land.
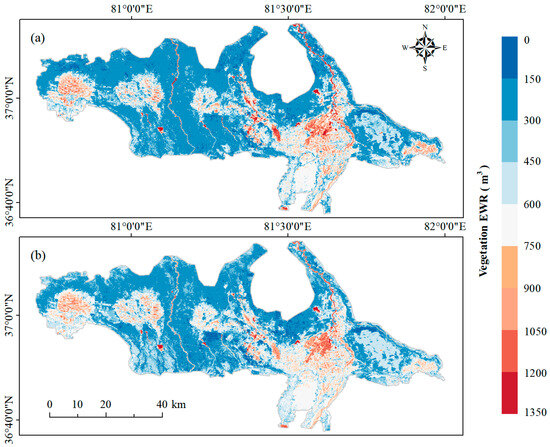
Figure 8.
Spatial distribution of vegetation ecological water requirement. (a) 2021; (b) 2022.
3.4. Spatiotemporal Characteristics of EWS
The ecological water stress in the study area was calculated based on the basis of the SEBS model’s simulated actual ET and the downscaled MOD16A2 data product’s PET. The EWS was evaluated for six land use types: grasslands, barren land, impervious surfaces, croplands, forests, and water. The results are shown in Figure 9. Overall, the EWS in the middle reaches of the Keriya River Basin was expected to be lower in 2022 compared with 2021. The maximum and minimum EWS values were observed for grasslands (0.87 in 2021 and 0.75 in 2022) and barren land (0.048 in 2021 and 0.035 in 2022), respectively.
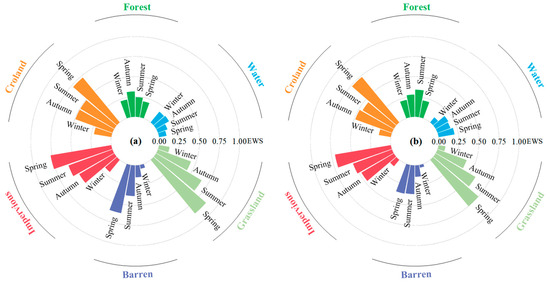
Figure 9.
Ecological water stress for various land use. (a) 2021; (b) 2022.
The seasonal changes in EWS for cropland, grassland, barren land, and impervious surfaces followed the pattern of spring > summer > autumn > winter. Among these, grasslands had the highest EWS and exhibited severe water shortage, moderate water shortage, mild water shortage, and water plentitude conditions in the four seasons of spring, summer, autumn, and winter, respectively. The EWS of barren land showed significant changes in spring (from 2021 to 2022), transitioning from displaying a moderate water shortage (0.61) to a mild water shortage (0.36). In contrast, forests and bodies of water did not show regular seasonal differences. For instance, the EWS of forests was highest in autumn 2021 and highest in summer 2022. The overall EWS in water areas was the lowest compared with other land use types, but the water resources remained plentiful throughout all seasons.
Observing Figure 10, it can be found that the spatial distribution of EWS in the same season in the two years remained essentially identical. EWS was consistently higher in spring compared with other seasons, with most of the middle reaches experiencing moderate-to-severe water shortages. In summer, when temperatures rose and both ET and PET were high, there was significant spatial variation in ecological water stress. The water system of the Keriya River Basin is primarily located in the low-EWS zone. Moving farther away from the riverbank, vegetation became sparser, and EWS gradually increased. In autumn, a large area experienced moderate water shortage, with a few discrete areas of severe water shortage in the middle. Winter, characterized by cold weather and dormant vegetation, had the lowest EWS, with most areas experiencing water plentitude conditions. The ecological water stress in winter 2021 was slightly higher than in 2022, as indicated by a larger distribution area of mild water shortage.
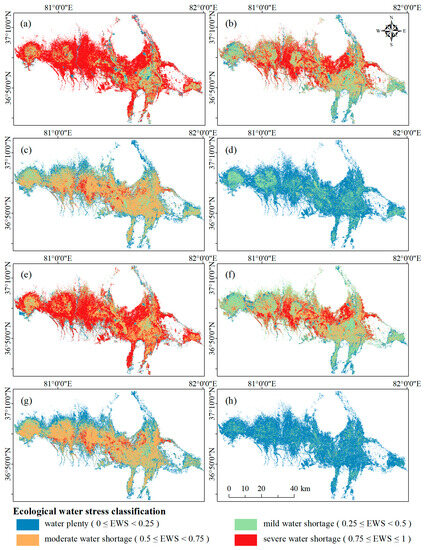
Figure 10.
Schematic diagram of spatial distribution of water stress in each season: (a) spring 2021; (b) summer 2021; (c) autumn 2021; (d) winter 2021; (e) apring 2022; (f) summer 2022; (g) autumn 2022; (h) winter 2022.
4. Discussion
4.1. Comprehensive Effects of Vegetation and Water on ET, EWR, and EWS
The spatiotemporal dynamics of evapotranspiration are constrained by the characteristics of vegetation and the availability of water [37]. This study reveals that plants exhibit the highest levels of activity during their growth period when transpiration consumes a significant amount of water. Additionally, the spatial pattern of evapotranspiration closely aligns with the distribution of vegetation, with higher levels of evapotranspiration observed in the wet riverbank areas compared with the edges of oases. This is because various vegetation characteristics, such as vegetation type, growth status, coverage, root depth, and stomatal aperture, can affect the balance between vegetation transpiration and soil evaporation [38]. Another study indicates that the impact of vegetation greening on evapotranspiration is more pronounced in arid and semi-arid regions than in warm and humid coastal areas [39]. This demonstrates that moisture and vegetation statuses have interdependent effects on evapotranspiration. Lush vegetation typically possesses a sufficient leaf surface area that enhances transpiration rates while reducing soil water loss through evaporation. Conversely, limited water supply restricts the plant’s ability to absorb water through its roots, thereby hindering its capacity to undergo proper evapotranspiration.
In this study, the annual variation in evapotranspiration and ecological water requirement basically conforms to the phenological law of oasis crops. Unlike other previous studies, we observed that evapotranspiration experienced a “slump” phenomenon in April 2021. This phenomenon may be attributed to high air pressure and relative humidity on the day when the satellite imagery was acquired in April. Additionally, artificial irrigation activities and changes in crop planting structure could have contributed to abnormal phenological periods. The total ecological water requirement (EWR) of grassland was significantly higher compared with that of cultivated land and woodland, showing a “double peak” trend with small peaks in early spring and early autumn. This can be explained by the fact that grassland was the dominant land use type in the study area, covering 50.2% of the total area. Some perennial short-lived herbaceous plants in the grassland completed their life cycle rapidly during the early spring warming period, while others germinated again in autumn. On the other hand, there were few dense forests in the study area, resulting in a relatively low total water consumption by the forest ecosystem. However, due to the well-developed root systems of trees, they had a strong capacity for water absorption. As a result, the ecological water requirement per unit area of forest land was relatively high.
Vegetation’s ecological water requirement and water resource stress exhibit seasonal variations that can be attributed to factors such as water availability, temperature, and the growth status of vegetation. During seasons with favorable water conditions, vegetation tends to experience more robust growth due to the ample water supply. The expansion of oasis agriculture further contributes to increased regional water consumption and vegetation evapotranspiration, thereby intensifying the pressure on water resources [40]. During the transitional periods between wet and dry seasons, such as spring and autumn, soil moisture is prone to drying out and evaporating. However, crops are in a critical growth phase during these periods, and a substantial amount of water is required to support their development and ensure a successful harvest. Consequently, the ecological water stress is relatively high during these times. Winter poses unique challenges as extreme cold and snowfall can result in frozen soil moisture or insufficiently stored moisture for crop growth. Most plants enter a dormant state during this period. Crops such as winter wheat have the potential to rely more on river water reserves.
4.2. Analysis of Driving Factors on ET, EWR, and EWS
In this study, vegetation’s EWR and EWS were estimated based on evapotranspiration (ET and PET). Therefore, the factors that drove evapotranspiration also influenced EWR and EWS. To analyze the correlation between meteorological parameters and land surface parameters with evapotranspiration, Pearson correlation analysis was conducted (Table 5). Evapotranspiration is highly sensitive to climate change as it is influenced by various meteorological parameters. Air temperature and sunshine hours, as weather-related factors, affect the rate of water vapor diffusion and the conversion of surface net radiation to evapotranspiration. These two factors exhibit a significant positive correlation with evapotranspiration and are considered to be the most influential factors. Previous studies indicate that the trend of global warming may lead to an increased requirement for evapotranspiration from terrestrial ecosystems [38,40]. However, there are some studies that contradict this view and propose the “evaporation paradox”, suggesting that evapotranspiration may decrease with continued global temperature rise [41,42].

Table 5.
The Pearson correlation coefficient (r) between evapotranspiration and different driving factors.
Air pressure in this study showed a significant negative correlation with evapotranspiration (r = −0.751, p < 0.01). There are two possible explanations for this observation. On the one hand, higher air pressure requires more heat for vegetation transpiration and soil evaporation [43]. On the other hand, leaf stomatal conductance suppresses the transpiration rate as air pressure increases and CO2 concentration decreases [44]. Additionally, relative humidity exhibited a negative correlation with evapotranspiration, which is consistent with findings from related studies [38,45]. Relative humidity has a negative impact on evapotranspiration in drier regions with low wind flow humidity. Although the correlation between wind speed and evapotranspiration is relatively low, it can still play a significant role in the evapotranspiration process when combined or balanced with other meteorological variables such as air temperature [46].
The influence of the geographical environment on evapotranspiration is determined by surface heat transfer and vegetation characteristics. LST, emissivity, and NDVI exhibit extremely high positive correlations in areas with high vegetation coverage, such as forests (Figure 11). Conversely, these parameters show lower or even negative correlations in sparse areas or those without vegetation areas, an observation that aligns with previous research findings [10,47]. This can be explained by the fact that vegetation transpiration consumes more solar radiation and water compared with soil evaporation in humid areas [39]. In contrast, sandy areas or Gobi surfaces tend to heat up quickly due to lack of vegetation, leading to the rapid evaporation of water stored in capillary pores and crevices in the soil. However, the available water supply for evaporation is often insufficient. Albedo, which characterizes the surface reflection properties, is primarily influenced by surface type and cover [48]. In this study, albedo did not show significant correlations when compared to other surface parameters. This lack of significant correlation may be attributed to the uncertainties arising from the nonuniform and highly heterogeneous characteristics of the underlying surface in the study area.
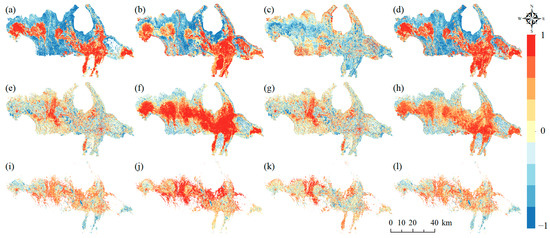
Figure 11.
Spatial distribution of correlation coefficient of surface parameters in the middle reaches of the Keriya River Basin. (a): Emis and ET; (b): LST and ET; (c): Albedo and ET; (d): NDVI and ET; (e) Emis and PET; (f): LST and PET; (g): Albedo and PET; (h): NDVI and PET; (i): Emis and EWS; (j): LST and EWS; (k): Albedo and EWS; (l): NDVI and EWS.
4.3. Suggestions for Water Resource Regulation
Desert oases are vital ecosystems that face unique challenges in managing water resources due to their limited availability and fragile nature [14]. The EWR and EWS indices constructed in this study are useful tools for identifying areas under high water stress. They can guide decision-making processes, prioritize interventions, allocate water resources effectively, and develop adaptive water management strategies. Based on the research findings, the following suggestions are proposed for water resource regulation in the Keriya River Basin:
- Delineate water ecological protection zones and protect the ecological pattern of vegetation. The results of the study showed that grasslands closer to the river experience lower water stress, while those farther away endure higher water stress, particularly in spring. Therefore, it is necessary to designate grassland areas with high vulnerability as no-grazing areas and implement protection rather than restoration for areas with severe water shortages [49]. Additionally, controlling the expansion of cultivated land and the encroachment of deserts is essential to preserve grassland ecological spaces. Delineate the red line for grassland protection and return farmland to grassland in due course. Furthermore, promoting salt and desertification prevention, such as shelterbelt construction to minimize wind erosion and sand flow into oases, is important for preserving water and soil quality within the watershed and ensuring sustainable water resources.
- Optimize the agriculture, forestry, and animal husbandry structure of the basin while promoting water-saving irrigation technology. The ecological water requirement in the Keriya River Basin follows the order of grassland > cropland > forest land. Therefore, it is necessary to limit the scale of arable land and breeding activities while encouraging the development of forestry, orchards, and other planting industries. Planting perennial pastures also can enhance the ecological carrying capacity of animal husbandry [50]. To alleviate water pressure, the adoption of high-efficiency water-saving irrigation technologies such as sprinkler irrigation and drip irrigation should be promoted. Conservation tillage practices such as using crop straw or plastic film to cover farmland during fallow periods can prevent water loss [49].
- Adjust water use strategies and optimize water distribution plans. Tailored water resource management and allocation strategies should be formulated based on the spatiotemporal variations of water scarcity observed in desert oases. For example, measures should be taken to protect the ecological environment of rivers, prevent excessive production and domestic water use from compromising ecological water availability, and guarantee sufficient river water capacity. When allocating irrigation water, more emphasis should be placed on ecological benefits, while the remaining water can be allocated for socio-economic development. Strengthening the linkages between surface water and groundwater is necessary, with priority given to fulfilling ecological water demand during critical vegetation growth periods. In cases of acute water shortages, measures such as reservoir adjustments and inter-regional water transfers should be considered.
4.4. Strengths and Limitations of This Study
This study developed an ecological water assessment system that considers evapotranspiration data, providing an effective way to monitor ecosystem water resources. Previous studies have often focused on a single aspect, such as water supply or demand, which fails to capture the complex dynamics of water scarcity adequately [51]. In this study, we have developed indicators, namely the ecological water requirement (EWR) and the ecological water stress (EWS) index, to assess water scarcity in desert oases. These indicators distinguish themselves from traditional physical water stress assessment indicators by placing a particular emphasis on the ecological perspective of water resources.
Traditional water stress assessment indicators, such as water resource utilization rate, water poverty index, and per capita water consumption, are commonly utilized in regions abundant in water resources [29,51]. They primarily emphasize the water scarcity resulting from high human demands. In contrast, our indicator focuses more on natural or artificial ecosystems whose main ecological water consumption is vegetation transpiration and soil evaporation. This approach offers a more accurate understanding of the balance between freshwater demand and supply within an ecosystem, enabling us to identify areas at risk of water stress. This is crucial for maintaining the ecological health and biodiversity of water-limited regions. This study also has significant data acquisition and processing advantages. By using satellite remote sensing technology, geographic information systems, and model simulations, we can obtain high-resolution spatial information on evapotranspiration and water requirement and stress. This approach provides a more accurate and timely assessment than traditional methods that rely only on field measurements or statistical extrapolation [14].
By demonstrating the effectiveness of our method in desert oases, we believe it can be applied to similar arid regions facing water scarcity challenges, such as West African Sahara Desert oases, Middle East Arabian Peninsula oases, and Xinjiang Tarim Basin oases [49]. This study also has wide application potential in the fields of water ecological protection zoning, land use planning, climate change impact assessment, water resources’ management and monitoring, and global ecosystem management [52,53,54]. For example, quantitative analysis of water ecological stress can assist in delineating the boundaries of ecological protection areas, prioritizing the conservation of hotspots and vulnerable regions. By analyzing the EWR and EWS of different land use types (such as urban areas, agricultural areas, and natural habitats), it can also guide regional planning and equitably allocate water resources to ensure rational use in various sectors. Inputting historical and forecasted meteorological data can assess the impact of climate change on water resources and help policymakers adopt adaptive strategies to mitigate the impact of climate change on water availability.
The findings of this study on desert oasis water resource management can serve as a valuable reference for similar regions globally. With appropriate adjustment and improvement, the method can be applied to promote ecological protection and sustainable development worldwide. However, there are challenges when applying this method in other research settings, such as data collection and model validation issues. The SEBS and downscaling model used in this study rely on data-driven factors, but high-quality imagery and meteorological observation data may not be available in some regions. Model parameter variability, such as landscape heterogeneity and roughness parameterization, may also lead to uncertainty in results [21]. Additionally, factors such as climate change and human activities such as irrigation can add uncertainty to evapotranspiration and water resource stress [55]. Hence, users need to consider the applicability of the method to the local environment of their study area.
5. Conclusions
This study evaluates the vegetation’s EWR and EWS in the oases in the middle reaches of the Keriya River Basin using ET and PET. This provides valuable insights for formulating water resource management and regulation policies in desert oases. The SEBS model demonstrates good accuracy in simulating ET, and the downscaling analysis of MOD16A2-PET data through random forest shows good agreement with the original data products.
The annual variation trends of ET and PET remain relatively stable, with their peak periods corresponding to the vegetation growth season. ET is highest in August and lowest in December, whereas PET reaches its maximum value in July and minimum in January. Different vegetation types have varying levels of ecological water requirement. The total EWR of each vegetation type, ranging from high to low, is as follows: grassland > cropland > forest. Conversely, the EWR per unit area shows the opposite law to the total EWR. The ecological water stress in the study area varies noticeably with seasons. Grassland exhibits the greatest ecological water stress, and the four seasons of spring, summer, autumn, and winter correspond to four levels of EWS: water plentitude, mild water shortage, moderate water shortage, and severe water shortage. The water area experiences the least water stress, with all seasons categorized as water plentitude in such zones.
Constrained by vegetation characteristics and water supply, both ET and PET, as well as EWR and EWS, exhibit significant temporal and spatial differences. Areas with higher vegetation coverage and better water conditions display stronger evapotranspiration and EWR, while experiencing lower EWS. Both climatic conditions and surface environment can influence evapotranspiration, which consequently affects EWR and EWS. Air temperature and LST have the most significant effects on evapotranspiration (r > 0.9, p < 0.01). Sunshine hours, emissivity, and NDVI are all significantly and positively correlated with evapotranspiration, while air pressure exhibits a significant negative correlation. Human activities can also introduce interference and impact the accuracy of assessing EWR and EWS. Therefore, future research should focus on conducting more accurate assessments of ecological water requirement and water stress at the basin scale in a way that takes into account these various factors.
Author Contributions
Conceptualization, R.W., G.L., and A.Z.; methodology, R.W., G.Y., and G.L.; software, R.W. and G.Y.; validation, R.W., D.H., and X.H.; formal analysis, A.Z.; investigation, R.W., D.H., and A.Z.; resources, X.H. and G.L.; data curation, R.W. and D.H.; writing—original draft preparation, R.W.; writing—review and editing, R.W., G.L., X.H., A.Z., G.Y., and D.H.; visualization, R.W.; supervision, X.H.; project administration, G.L.; funding acquisition, G.L. All authors have read and agreed to the published version of the manuscript.
Funding
This research was funded by the Xinjiang Uygur Autonomous Region Water Resources Department Water Resources Planning Research Institute Project (NO. 2020.B-003) and the National Nature Science Foundation of China (NO. 41975115).
Data Availability Statement
Not applicable.
Acknowledgments
We would like to express our appreciation to the Urumqi Meteorological Bureau for their generous collaboration in sharing their data with us. We also thank Zhoukang Li and Jinbao Li from the laboratory for their comments on the revision of the paper.
Conflicts of Interest
The authors declare no conflict of interest.
References
- Yuan, G.F.; Zhu, X.C.; Tang, X.Z.; Du, T.; Yi, X.B. A Species-Specific and spatially-Explicit Model for Estimating Vegetation Water Requirements in Desert Riparian Forest Zones. Water Resour. Manag. 2016, 30, 3915–3933. [Google Scholar] [CrossRef]
- Yu, J.; Yu, S.; Zhang, H.; Wang, Z.; Zhou, C.; Chen, X. Determination of ecological flow thresholds for rainfall-recharging rivers based on multiple hydrological methods. Front. Environ. Sci. 2023, 11, 255. [Google Scholar] [CrossRef]
- Wang, N.; Guo, Y.; Wei, X.; Zhou, M.; Wang, H.; Bai, Y. UAV-based remote sensing using visible and multispectral indices for the estimation of vegetation cover in an oasis of a desert. Ecol. Indic. 2022, 141, 109155. [Google Scholar] [CrossRef]
- Liu, K.; Cao, W.; Zhao, D.; Liu, S.; Liu, J. Assessment of ecological water scarcity in China. Environ. Res. Lett. 2022, 17, 104056. [Google Scholar] [CrossRef]
- Xiang, M.; Zhang, S.; Ruan, Q.; Tang, C.; Zhao, Y. Definition and calculation of hierarchical ecological water requirement in areas with substantial human activity-A case study of the Beijing-Tianjin-Hebei region. Ecol. Indic. 2022, 138, 108740. [Google Scholar] [CrossRef]
- Cui, Y.; Zhang, Q.; Chen, X.; Jiang, T. Advances in the theories and calculation methods of ecological water requirement. J. Lake Sci. 2010, 22, 465–480. [Google Scholar]
- Han, Y.; Xia, F.; Huang, H.; Mu, W.; Jia, D. Impact of the Grain for Green Project on water resources and ecological water stress in the Yanhe River Basin. PLoS ONE 2022, 17, e0259611. [Google Scholar] [CrossRef]
- Huang, F.; Ochoa, C.G.; Chen, X. Assessing environmental water requirement for groundwater-dependent vegetation in arid inland basins by combining the copula joint distribution function and the dual objective optimization: An application to the Turpan Basin, China. Sci. Total Environ. 2021, 799, 149323. [Google Scholar] [CrossRef]
- Pan, Q.; Zhang, C.; Guo, S.; Sun, H.; Du, J.; Guo, P. An interval multi-objective fuzzy-interval credibility-constrained nonlinear programming model for balancing agricultural and ecological water management. J. Contam. Hydrol. 2022, 245, 103958. [Google Scholar] [CrossRef]
- Zhao, W.; Chang, X.; He, Z.; Zhang, Z. Study on vegetation ecological water requirement in Ejina Oasis. Sci. China Ser. D Earth Sci 2007, 50, 121–129. [Google Scholar] [CrossRef]
- Yang, Y.; Xu, C.; Luo, Y.; Yang, Q.; Chen, L. Estimation of Ecological Water Requirement for the Natural Vegetation in the Kongque River Basin based on Vegetation Evapotranspiration. J. Irrig. Drain. Eng. 2020, 39, 106–115. [Google Scholar]
- Ling, H.; Guo, B.; Xu, H.; Fu, J. Configuration of water resources for a typical river basin in an arid region of China based on the ecological water requirements (EWRs) of desert riparian vegetation. Glob. Planet. Chang. 2014, 122, 292–304. [Google Scholar] [CrossRef]
- Chi, D.; Wang, H.; Li, X.; Liu, H.; Li, X. Estimation of the ecological water requirement for natural vegetation in the Ergune River basin in Northeastern China from 2001 to 2014. Ecol. Indic. 2018, 92, 141–150. [Google Scholar] [CrossRef]
- Hao, X.; Zhao, Z.; Fan, X.; Zhang, J.; Zhang, S. Evaluation method of ecological water demand threshold of natural vegetation in arid-region inland river basin based on satellite data. Ecol. Indic. 2023, 146, 109811. [Google Scholar] [CrossRef]
- Zhang, A.; Hao, T.; Zhou, H.; Ma, Z.; Cui, S. Analysis on characteristics of Baiyang River Basin and water requirement of ecological vegetation in Xinjiang. Acta Ecol. Sin. 2021, 41, 1921–1930. [Google Scholar]
- Zhang, R.; Ma, J.; Seki, K.; Wang, D.; Wang, L. Comparison of water consumption for the conversion of croplands to orchards in dryland ecosystems. Soil Sci. Soc. Am. J. 2022, 86, 946–963. [Google Scholar] [CrossRef]
- Fan, Y.; Guo, Y.; Lu, G.; Chen, L.; Zhang, X.; He, X.; Yang, J. Vegetation Ecological Water Requirement of Ebinur Lake Watershed. J. Desert Res. 2018, 38, 865–871. [Google Scholar]
- Gao, G.; Shen, Q.; Zhang, Y.; Pan, N.; Ma, Y.; Jiang, X.; Fu, B. Determining spatio-temporal variations of ecological water consumption by natural oases for sustainable water resources allocation in a hyper-arid endorheic basin. J. Clean. Prod. 2018, 185, 1–13. [Google Scholar] [CrossRef]
- Su, Z. The Surface Energy Balance System (SEBS) for estimation of turbulent heat fluxes. Hydrol. Earth Syst. Sci. 2002, 6, 85–99. [Google Scholar] [CrossRef]
- Jin, X.; Guo, R.; Xia, W. Distribution of Actual Evapotranspiration over Qaidam Basin, an Arid Area in China. Remote Sens. 2013, 5, 6976–6996. [Google Scholar] [CrossRef]
- Su, H.B.; McCabe, M.F.; Wood, E.F.; Su, Z.; Prueger, J.H. Modeling evapotranspiration during SMACEX: Comparing two approaches for local- and regional-scale prediction. J. Hydrol. 2005, 6, 910–922. [Google Scholar] [CrossRef]
- Ma, Y.; Liu, S.; Song, L.; Xu, Z.; Liu, Y.; Xu, T.; Zhu, Z. Estimation of daily evapotranspiration and irrigation water efficiency at a Landsat-like scale for an arid irrigation area using multi-source remote sensing data. Remote Sens. Environ. 2018, 216, 715–734. [Google Scholar] [CrossRef]
- Cai, J.; Zhao, D.; Varis, O.; Wang, Y. Match words with deeds: Curbing water risk with the Sustainable Development Goal 6 index. J. Clean. Prod. 2021, 318, 128509. [Google Scholar] [CrossRef]
- Skrimizea, E.; Parra, C. Social-ecological dynamics and water stress in tourist islands: The case of Rhodes, Greece. J. Sustain. Tour. 2019, 27, 1438–1456. [Google Scholar] [CrossRef]
- Liu, X.; Tang, Q.; Liu, W.; Veldkamp, T.I.E.; Boulange, J.; Liu, J.; Wada, Y.; Huang, Z.; Yang, H. A Spatially Explicit Assessment of Growing Water Stress in China from the Past to the Future. Earth’s Future 2019, 7, 1027–1043. [Google Scholar] [CrossRef]
- Fang, W.; Huang, S.; Huang, Q.; Huang, G.; Wang, H.; Leng, G.; Wang, L.; Guo, Y. Probabilistic assessment of remote sensing-based terrestrial vegetation vulnerability to drought stress of the Loess Plateau in China. Remote Sens. Environ. 2019, 232, 111290. [Google Scholar] [CrossRef]
- Alvarez-Garreton, C.; Boisier, J.P.; Billi, M.; Lefort, I.; Marinao, R.; Barria, P. Protecting environmental flows to achieve long-term water security. J. Environ. Manag. 2023, 328, 116914. [Google Scholar] [CrossRef]
- Cao, X.; Wu, M.; Guo, X.; Zheng, Y.; Gong, Y.; Wu, N.; Wang, W. Assessing water scarcity in agricultural production system based on the generalized water resources and water footprint framework. Sci. Total Environ. 2017, 609, 587–597. [Google Scholar]
- Wang, D.; Hubacek, K.; Shan, Y.; Gerbens-Leenes, W.; Liu, J. A Review of Water Stress and Water Footprint Accounting. Water 2021, 13, 201. [Google Scholar] [CrossRef]
- Jahangir, M.H.; Arast, M. Remote sensing products for predicting actual evapotranspiration and water stress footprints under different land cover. J. Clean. Prod. 2020, 266, 121818. [Google Scholar] [CrossRef]
- Zhang, W.; Li, D.; Shi, Q.; Guo, Y.; Bi Lali·Yi, M.; Li, H. Analysis of Temporal and Spatial Changes in Vegetation Phenology and Its Influencing Factors in Keriya River Basin. Bull. Soil Conserv. 2020, 40, 291–298+309. [Google Scholar]
- Zubaida, M.; Xia, J.; Polat·Muhtar; Zhang, R. Land use and landscape pattern changes in the middle reaches of the Keriya River. Acta Ecol. Sin. 2019, 39, 2322–2330. [Google Scholar]
- Wang, Z.; Erb, A.M.; Schaaf, C.B.; Sun, Q.; Liu, Y.; Yang, Y.; Shuai, Y.; Casey, K.A.; Roman, M.O. Early spring post-fire snow albedo dynamics in high latitude boreal forests using Landsat-8 OLI data. Remote Sens. Environ. 2016, 185, 71–83. [Google Scholar] [CrossRef] [PubMed]
- Agam, N.; Kustas, W.P.; Anderson, M.C.; Li, F.; Neale, C.M.U. A vegetation index based technique for spatial sharpening of thermal imagery. Remote Sens. Environ. 2007, 107, 545–558. [Google Scholar] [CrossRef]
- Qiao, C.; Sun, R.; Xu, Z.; Zhang, L.; Liu, L.; Hao, L.; Jiang, G. A Study of Shelterbelt Transpiration and Cropland Evapotranspiration in an Irrigated Area in the Middle Reaches of the Heihe River in Northwestern China. IEEE Geosci. Remote Sens. Lett. 2015, 12, 369–373. [Google Scholar] [CrossRef]
- Hou, X.; Fan, J.; Zhang, F.; Hu, W.; Yan, F.; Xiao, C.; Li, Y.; Cheng, H. Determining water use and crop coefficients of drip-irrigated cotton in south Xinjiang of China under various irrigation amounts. Ind. Crops Prod. 2022, 176, 114376. [Google Scholar] [CrossRef]
- Hao, X.; Chen, Y.; Xu, C.; Li, W. Impacts of climate change and human activities on the surface runoff in the Tarim River basin over the last fifty years. Water Resour. Manag. 2008, 22, 1159–1171. [Google Scholar] [CrossRef]
- Yang, L.S.; Feng, Q.; Zhu, M.; Wang, L.M.; Alizadeh, M.R.; Adamowski, J.F.; Wen, X.H.; Yin, Z.L. Variation in actual evapotranspiration and its ties to climate change and vegetation dynamics in northwest China. J. Hydrol. 2022, 607, 127533. [Google Scholar] [CrossRef]
- Zhang, D.; Liu, X.; Zhang, L.; Zhang, Q.; Gan, R.; Li, X. Attribution of Evapotranspiration Changes in Humid Regions of China from 1982 to 2016. J. Geophys. Res. Atmos. 2020, 125, e2020JD032404. [Google Scholar] [CrossRef]
- Shen, Y.-J.; Shen, Y.; Guo, Y.; Zhang, Y.; Pei, H.; Brenning, A. Review of historical and projected future climatic and hydrological changes in mountainous semiarid Xinjiang (northwestern China), central Asia. Catena 2020, 187, 104343. [Google Scholar] [CrossRef]
- Talaee, P.H.; Some’e, B.S.; Ardakani, S.S. Time trend and change point of reference evapotranspiration over Iran. Theor. Appl. Clim. 2014, 116, 639–647. [Google Scholar] [CrossRef]
- Fan, J.; Wu, L.; Zhang, F.; Xiang, Y.; Zheng, J. Climate change effects on reference crop evapotranspiration across different climatic zones of China during 1956–2015. J. Hydrol. 2016, 542, 923–937. [Google Scholar] [CrossRef]
- Wang, L.; Li, M.; Wang, J.; Li, X.; Wang, L. An analytical reductionist framework to separate the effects of climate change and human activities on variation in water use efficiency. Sci. Total Environ. 2020, 727, 138306. [Google Scholar] [CrossRef] [PubMed]
- Hu, S.; Mo, X. Attribution of Long-Term Evapotranspiration Trends in the Mekong River Basin with a Remote Sensing-Based Process Model. Remote Sens. 2021, 13, 303. [Google Scholar] [CrossRef]
- Hu, G.; Jia, L. Monitoring of Evapotranspiration in a Semi-Arid Inland River Basin by Combining Microwave and Optical Remote Sensing Observations. Remote Sens. 2015, 7, 3056–3087. [Google Scholar] [CrossRef]
- Donohue, R.J.; McVicar, T.R.; Roderick, M.L. Assessing the ability of potential evaporation formulations to capture the dynamics in evaporative demand within a changing climate. J. Hydrol. 2010, 386, 186–197. [Google Scholar] [CrossRef]
- Li, X.; Lu, L.; Yang, W.; Cheng, G. Estimation of evapotranspiration in an arid region by remote sensing-A case study in the middle reaches of the Heihe River Basin. Int. J. Appl. Earth Obs. Geoinf. 2012, 17, 85–93. [Google Scholar] [CrossRef]
- Liang, S.L. Narrowband to broadband conversions of land surface albedo I Algorithms. Remote Sens. Environ. 2001, 76, 213–238. [Google Scholar] [CrossRef]
- Zhu, Y.H.; Chen, Y.N.; Ren, L.L.; Lu, H.S.; Zhao, W.Z.; Yuan, F.; Xu, M. Ecosystem restoration and conservation in the arid inland river basins of Northwest China: Problems and strategies. Ecol. Eng. 2016, 94, 629–637. [Google Scholar] [CrossRef]
- Alejandro Distel, R. Grazing ecology and the conservation of the Caldenal rangelands, Argentina. J. Arid Environ. 2016, 134, 49–55. [Google Scholar] [CrossRef]
- Schyns, J.F.; Hoekstra, A.Y.; Booij, M.J. Review and classification of indicators of green water availability and scarcity. Hydrol. Earth Syst. Sci. 2015, 19, 4581–4608. [Google Scholar] [CrossRef]
- Wang, J.; Wu, Y.; Hu, Z.; Zhang, J. Remote Sensing of Watershed: Towards a New Research Paradigm. Remote Sens. 2023, 15, 2569. [Google Scholar] [CrossRef]
- Dong, Q.; Wang, W.; Shao, Q.; Xing, W.; Ding, Y.; Fu, J. The response of reference evapotranspiration to climate change in Xinjiang, China: Historical changes, driving forces, and future projections. Int. J. Climatol. 2020, 40, 235–254. [Google Scholar] [CrossRef]
- Wang, J.; Zhen, J.; Hu, W.; Chen, S.; Lizaga, I.; Zeraatpisheh, M.; Yang, X. Remote sensing of soil degradation: Progress and perspective. Int. Soil Water Conserv. Res. 2023, 11, 429–454. [Google Scholar] [CrossRef]
- Pace, G.; Gutierrez-Canovas, C.; Henriques, R.; Boeing, F.; Cassio, F.; Pascoal, C. Remote sensing depicts riparian vegetation responses to water stress in a humid Atlantic region. Sci. Total Environ. 2021, 772, 145526. [Google Scholar] [CrossRef] [PubMed]
Disclaimer/Publisher’s Note: The statements, opinions and data contained in all publications are solely those of the individual author(s) and contributor(s) and not of MDPI and/or the editor(s). MDPI and/or the editor(s) disclaim responsibility for any injury to people or property resulting from any ideas, methods, instructions or products referred to in the content. |
© 2023 by the authors. Licensee MDPI, Basel, Switzerland. This article is an open access article distributed under the terms and conditions of the Creative Commons Attribution (CC BY) license (https://creativecommons.org/licenses/by/4.0/).