Article

The Susceptibility of Wetland Areas in the Yangtze River Basin to Temperature and Vegetation Changes

1
School of Earth Sciences, Hubei Key Laboratory of Critical Zone Evolution, China University of Geosciences, Wuhan 430074, China
2
College of Urban and Environmental Sciences, Hubei Normal University, Huangshi 435002, China
*
Author to whom correspondence should be addressed.
Remote Sens. 2023, 15(18), 4534; https://doi.org/10.3390/rs15184534
Submission received: 1 August 2023 / Revised: 2 September 2023 / Accepted: 9 September 2023 / Published: 14 September 2023

Abstract

:
Wetlands serve a critical function in water storage and ecological diversity maintenance. However, human activities have resulted in wetland loss in the middle and lower reaches of the Yangtze River Basin (MLYRB), while the wetland distribution in this area shows great discrepancy in previous estimates. It is, therefore, imperative to estimate the distribution of potential wetlands at present and project their variation under future climate change scenarios. In this study, we simulate the wetland distribution in the MLYRB at 15″ resolution using 5 machine learning methods with 19 predicting factors of topographic index, vegetation index, climate data, hydrological data, and soil type data. A 5-fold cross-validation with observed permanent wetlands shows that the reconstructions from Adaptive Boosting tree (AdaBoost) algorithm have the highest accuracy of 97.5%. The potential wetland area in the MLYRB is approximately ~1.25 × 10⁵ km2, accounting for 15.66% of the study region. Direct human activities have led to the loss of nearly half of the potential wetlands. Furthermore, sensitivity experiments with the well-trained models are performed to quantify the response of the total wetland area to each influencing factor. Results indicate vulnerability of wetland areas to increases in leaf area index (LAI), coldest season temperature, warmest season temperature, and solar radiation. By the 2100s, the potential wetland area is expected to decrease by 40.5% and 50.6% under the intermediate and very high emissions scenarios, respectively. The changes in LAI and the coldest season temperature will contribute to 50% and 40% of this loss of potential wetlands, respectively. Wetland loss may further undermine biodiversity, such as waterfowl, and fail to provide functions such as flood protection, and water supply. This work reveals the spatial pattern of potential wetland areas and their sensitivity to climate changes, stressing the need for effective strategies to mitigate wetland loss at specific regions in the MLYRB.

1. Introduction

Wetlands serve multiple functions, including regulating runoff, improving water quality, and protecting biodiversity [1], which are well-known as the “kidneys of the earth” [2]. Meanwhile, wetlands are significant sources of methane emissions [3]. Wetlands cover 1.2 billion hectares worldwide, but they are declining rapidly (Ramsar Convention Bureau, 2001). The net loss of global wetland area is 21% since 1700 [4]. Human activities have been an important cause of wetland loss worldwide [5]. Global natural wetlands decreased by 30% between 1970 and 2008 [6,7,8]. Regionally, intensified agricultural development transformed wild marsh landscape into an agricultural landscape. For example, 90% of the marsh has disappeared in the last 30 years over the Three Rivers Plain [9]. The potential wetland is defined as the spatial distribution of wetlands that would exist if there were no direct human activities on earth [10]. Therefore, to better protect natural wetlands, it is essential to explore the potential distribution of wetlands under typical climate, and the disturbance from human land use.
In order to better understand the impact of human activities on wetlands, we have selected the highly populated areas in the middle and lower reaches of the Yangtze River Basin (MLYRB) as our study area. The Yangtze River is the longest river in China (the third longest in the world), with a length of 6.3 × 10³ km [11]. The MLYRB is the largest complex wetland ecosystem and one of the most abundant wetland resources in China [12]. Meanwhile, the MLYRB is one of the most developed areas in East China [13]. From 2000 to 2010, the range of human activity in the Yangtze River Basin (YRB) increased dramatically; this is mainly distributed in the major cities (i.e., Nanjing, Hangzhou, Wuhan, Nanchang, etc.) and the core parts of other cities [14]. Due to rapid economic development and high population density, the MLYRB is an ideal area to study wetland changes with anthropogenic and non-anthropogenic factors. As a result, the wetlands in the MLYRB are facing severe damages [15]. The riparian wetlands showed a decreasing trend over the past century, with a total reduction of 396.23 km2 in the YRB [16]. According to available statistics by forestry department, the area of wetlands in the middle reaches of the Yangtze River Basin (MYRB) has decreased by 70% when 2000s compared with the 1950s [17]. The area of Dongting Lake decreased by 2433 km2 and the area of Jianghan Plain Lake decreased by 4368 km2 between 1930 and 2000 [18]. Meanwhile, the total value of the wetland ecosystem services in MLYRB was 1.62 × 10¹¹ USD/yr−1,and flood control was the most valuable ecosystem service, followed by water supply and habitat biodiversity services [12]. The Yangtze lakes are among the best for wintering waterbirds and many are protected for their biodiversity [19]. Wetlands have great ecological service value in the MLYRB.
There are currently three main methods for counting wetland areas: remote sensing monitoring, model simulation, and the site monitoring [20]. Remote sensing images have been widely used in extracting wetland areas [21,22,23,24,25]. However, the remote sensing images present the distribution of wetlands under the high-intensity human activities. Therefore, it is still difficult to quantitatively unveil the impact of wetlands on climate by this method. As such, simulation has an advantage in quantitative research. For example, Makkeasorn et al. [26] applied a machine learning algorithm to monitor the seasonal variation of riparian zone with an overall accuracy of 82.9%. Medjani et al. [21] adopted four machine learning methods (support vector machine, maximum likelihood, Neural Networks, and spectral angle mapper) to identify saline-alkali wetlands in arid desert environment, with the accuracy of 91%. However, due to the complexity of wetland formation, global wetland mapping usually has potential biases in reproducing regional wetland distributions. In particular, there are notable disparities in the wetland areas derived from various methods within the MLYRB. Using the method of Precipitation Topographic Wetness Index (PTWI), Hu et al. [10] reconstructed the distribution of wetlands around the world (Figure 1a). In their research, the area of wetlands in the MLYRB was ~1.1 × 10⁵ km2, accounting for only 13.8% of this region. In contrast, Tootchi et al. [26] reconstructed global wetlands through compositing a multi-wetland map, which presents the wetland area of ~3.0 × 10⁵ km2 in the MLYRB, accounting for 37.2% of this region (Figure 1b). Wetland area in the MLYRB from Tootchi et al. [26] is almost three times the estimates from Hu et al. [10], denoting a huge discrepancy between different datasets. Therefore, there is a need to focus on the distribution and change of wetlands and their response to future climate.
In order to better simulate wetland distributions, it is necessary to consider all important predictors and influencing factors. Theoretically, there are many different factors (biotic and abiotic) that influence the formation of wetlands, including climate, soil, water, animals, plants, and microorganisms. Climate change has been identified as a major threat to wetlands [27,28]. It can influence wetland ecosystem by increasing temperature and also by changing hydrological patterns [29]. A warmer climate may promote evapotranspiration and then cause a water level drawdown [30]. Soil texture greatly influences soil properties such as water holding capacity and water availability [31]. Simultaneously, variations in soil water content can exert influence on plant transpiration, especially in scenarios where the soil water content experiences a subsequent reduction [32]. Furthermore, it is noteworthy that vegetation plays a pivotal role in mitigating runoff and modifying soil moisture levels through transpiration processes, consequently exerting an influence on the distribution patterns of wetland ecosystems [33]. Therefore, it is necessary to simulate the wetland distributions in the MLYRB by considering environmental variables such as soil texture and plant cover. In addition, uncovering the magnitudes of the contributions of different factors to wetland areas and quantifying the degrees of influence can provide a scientific basis for future wetland conservation, offering valuable insights for protecting wetlands.
This study aims to explore the variations of potential wetland areas in the MLYRB due to direct anthropogenic land use and climate change, calculate the sensitivity of wetland distributions to climate factors, and predict the future wetland distribution. Potential wetlands can be a response to climate impacts apart from direct human influences. First, we developed a predictive model for potential wetlands establishment using machine learning methods combined with multiple predicting variables. Then, the sensitivity of wetland distributions to climate factors was quantified with a well-trained wetland distribution model. Finally, climate drivers under different “Shared Socioeconomic Pathways (SSPs)” are used to predict the future evolutions of wetland patterns.

2. Materials and Method
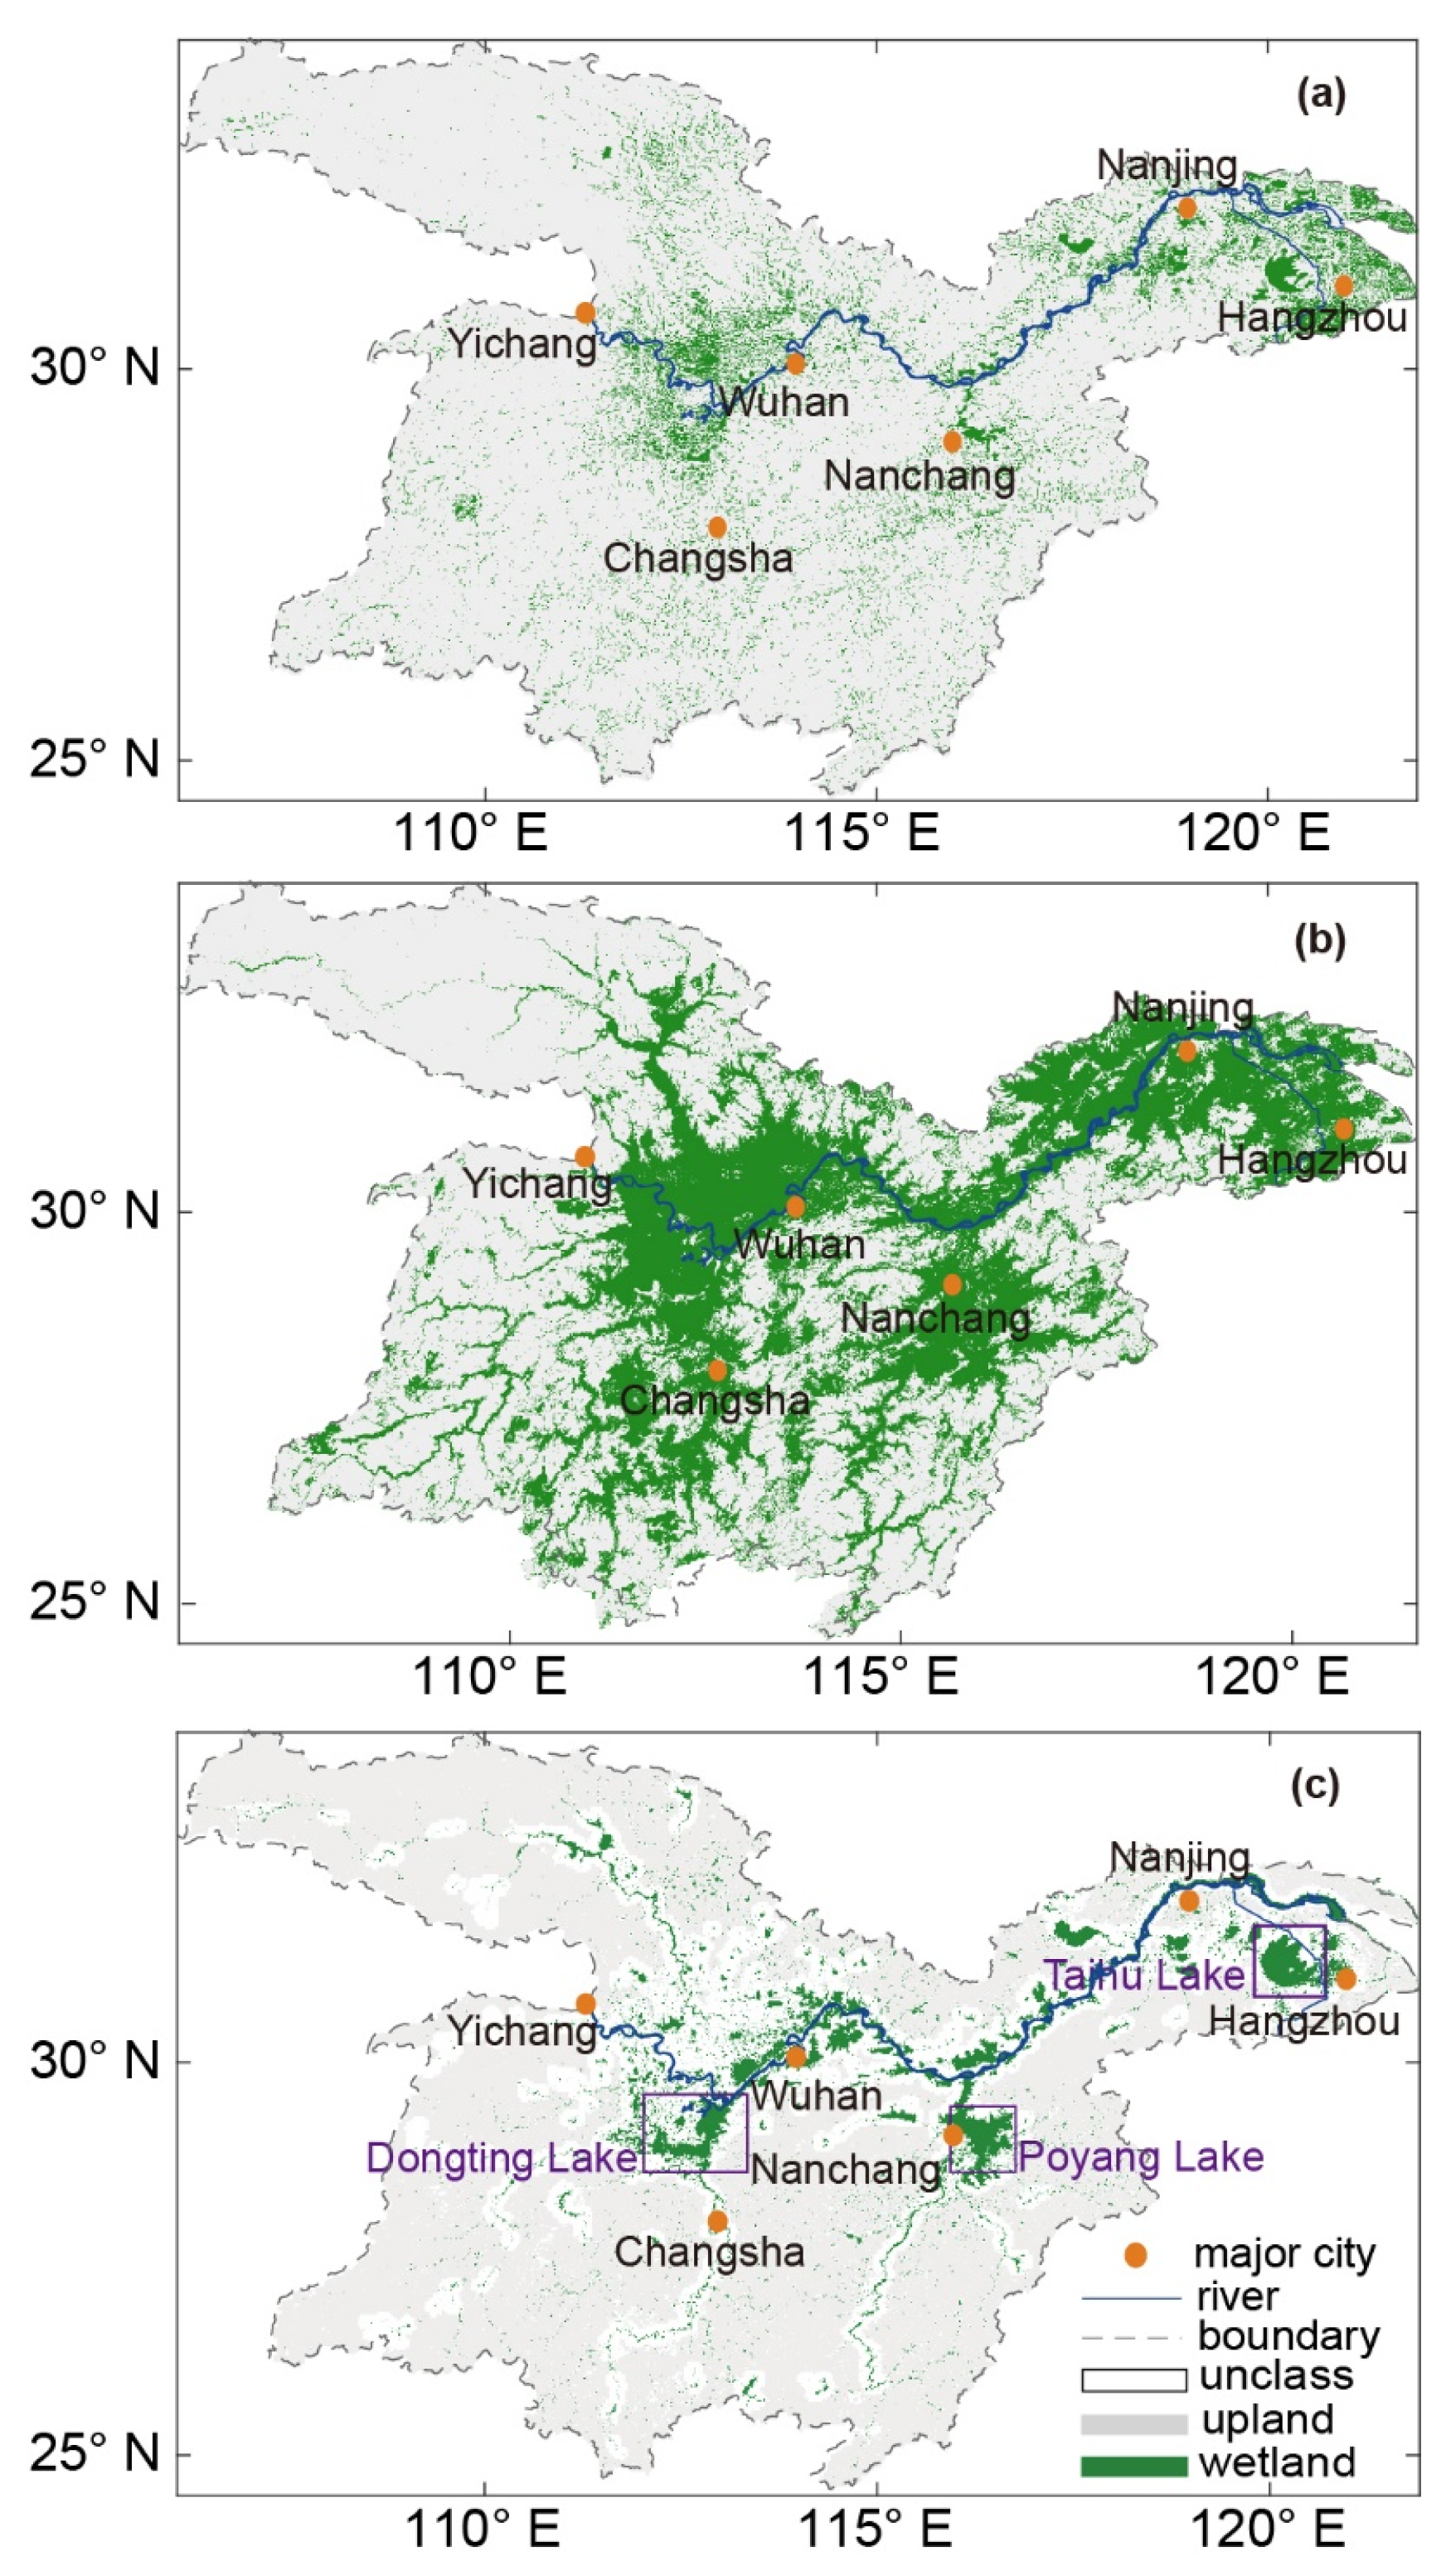
2.1. Study Area

The MLYRB (105°30′–122°30′E, 23°45′–34°15′N, Figure 2) is located along the foreland tectonic belt of the Dabie Mountain Orogen and includes all the sub-basins from the Three Gorges to the Yangtze Estuary [34]. It covers an area of approximately ~8 × 10⁵ km2. In this study, the MLYRB is divided into 30 sub-basins following National Earth System Science Data Center, National Science and Technology Infrastructure of China (http://www.geodata.cn, accessed on 20 September 2022).

2.2. Materials

2.2.1. Land Cover Products

The potential wetland is defined as the spatial distribution of wetlands that would exist if there were no direct human activities on earth, including Ramsar definition of wetlands and water bodies. In this paper, the human impact refers to direct land use while climate effects include indirect human impact from anthropogenic climate change. The upland in this paper refers to all land cover types apart from potential wetlands. Potential wetland products by previous researchers show diverse spatial distributions due to disparate classification methods. Using multiple datasets, typically more than five, in wetland mapping research can enhance accuracy compared to relying on a single dataset. [35,36]. In detail, we collected 13 remote sensing products of land cover, and assigned the location of permanent wetlands when at least two products having wetlands in the same grid. The intersection of non-wetland parts was taken, and the blank part was the most difference of remote sensing interpretation. Then, a 10-km buffer zone around the permanent wetlands was assigned as unclassed land cover (Figure 1c). The selected remote sensing interpretation products are shown in Table 1. All products were resampling to a unified resolution of 15″.

2.2.2. Climatic Scenarios and Environmental Predictors

Present and future climate data were downloaded from WorldClim version 2.1, which is a set of global climate layers with a spatial resolution of 1 km. Global cross-validation shows that this dataset generally has high agreements with observations [37]. Future scenarios were downscaled Global Climate Model (GCM) data of 2040s (2021–2040), 2060s (2041–2060), 2080s (2061–2080), and 2100s (2081–2100) from Coupled Model Intercomparison Project (CMIP6) for two SSPs: the SSP2–4.5 and the SSP5–8.5. SSP2–4.5 is considered as a “moderate” scenario, in which global and national institutions work toward but make slow progress in achieving sustainable development goals. SSP5–8.5 is referred to as an “extreme” scenario, in which fossil fuel resources are being exploited all over the world [38].
Topographic wetness index (TI) is a physical index of the influence of regional topography on runoff direction and accumulation [39]. The index is a function of slope and upstream contribution area. The index helps identify rainfall and runoff patterns, potential areas of increased soil water content, and areas of stagnant water. TI quantifies the control of topography over basic hydrological processes. The TI is widely used to indicate spatial distribution of wetness conditions [40,41,42,43]. TI is calculated as follows:
T I = ln α tan β
where α is the local uphill catchment area draining through the grid cell and tan β is the steepest outward slope of each grid cell. The TI data was derived from high-resolution global data [44].
The amount of surface or groundwater inputs that can impact on wetland distributions [45]. In this paper we use Euclidean distance to calculate surface drainage distance. The Euclidean distance (Euclidean metric) is a frequently employed measure of distance that represents the actual distance between two points in an m-dimensional space or the natural length of a vector (i.e., the distance from that point to the origin). The Euclidean distance in two- and three-dimensional space is the actual distance between two points [46]. Euclidean distance is calculated as follows:
ρ = x 2 x 1 2 + y 2 y 1 2
where ρ is the Euclidean distance between point (x2, y2) and point (x1, y1).
Meanwhile, climate conditions are important variables predicting wetland distributions [47,48]. In addition, soil and vegetation can influence the wetland distributions from the substrate and surface, respectively [49,50,51]. Wind speed and solar radiation are primary meteorological variables governing the evaporative process [52]. Consequently, we selected 19 variables (Table 2) including 5 topographic variables (TI, soil clay content), 1 vegetational variable (leaf area index, LAI), 1 hydrologic variable (distance to water bodies), and 12 climate variables. The spatial resolution of climatic variables is 15″. The soil data were selected from the global soil dataset [53] and the LAI data were selected from the global LAI dataset [54].

2.3. Methods

Figure 3 presents the main steps of the workflow for mapping potential wetlands in this study. Specifically, we first collected and calculated multi-source datasets (Table 1 and Table 2). Then, we used the five machine learning algorithms to train potential wetland models. Meanwhile, we assessed the model’s reliability using a five-fold cross-validation. Then the optimal model was used to quantify the sensitivity of environmental variables and to predict the future distribution of wetlands.

2.3.1. Wetland Distribution Modeling

We designed three stepwise experiments: the first group included climate and topographic data, the second group added soil data in, and the third group further included vegetation data on the second group’s foundation. Ultimately, we selected a total of 19 variables as environmental factors. Five machine learning algorithms were trained and validated with the present reference wetland map (Figure 1c) and the 19 predicting variables. The pixel of permanent wetland and upland were chosen for training the models. Consequently, there are 3 × 106 pixels for training or validating.
The Adaptive Boosting tree (AdaBoost) algorithm is a type of ensemble learning based on decision trees that aims to improve the accuracy of predictions by training a series of weak learners [55]. The essential idea is to construct a progression of classifiers with the goal that the later classifier will concentrate more on the misclassified tuples of the last round. An ensemble of classifiers with high precision will be created since classifiers in the ensemble supplement one another [56]. The model algorithm is easy to comprehend, and it does not experience overfitting. The main steps of the AdaBoost algorithm are as follows:
  • The weak classifier trains a model and assigns weights w to each variable I proportional to the probability associated with the classification of each variable in the model.
  • The weighted sum of the classification rate E is expressed by
    E = e r r o r i     w i / w i
    where errori is the calculated error for each case i and wi is the weight for assigned by the classifier for each case.
  • The weight of each case is updated, proportional to the error of each case if the case was classified incorrectly, otherwise the weight is unchanged.
Random Forest (RF) is an ensemble learning method consisting of multiple decision trees [57,58]. K-Nearest Neighbors (KNN) algorithm is an instance-based learning method used for classification and regression [59,60]. Artificial Neural Networks (ANNs) algorithm is a class of machine learning algorithms inspired by the structure and function of the human brain [61]. The Bayesian Classification (NB) Algorithm is a statistical classification method based on Bayes’ Theorem [62,63].

2.3.2. Accuracy Assessment

Cross-validation is commonly used to evaluate models on validation data. It divides the original data into K groups (k-fold), takes each subset data as a validation set, and the rest of the K−1 subset data as the training set [64]. The current study employs the methodology of 5-fold cross-validation, a commonly used approach for estimating the performance of machine learning models. The training dataset is randomly partitioned into 5 mutually exclusive subsets, with 4 subsets used for training without duplication, and the remaining subset reserved as the validation set. During each iteration, the model is trained on the training set and then used to make predictions on the validation set. The performance of the model is then evaluated by comparing the predicted results with the corresponding truth data using the Mean Squared Error (MSE) metric. The final cross-validation error estimate is obtained by aggregating and averaging the MSE values over the 5 iterations.
Meanwhile, we selected another independent validation dataset from Chinese Ecosystem assessment and ecological security pattern database (www.ecosystem.csdb.cn, accessed on 1 August 2023) to verify the accuracy of our results. It is based on the classification of wetland distribution products according to the ‘Chinese Ecosystem’ standard. The types of wetlands in this dataset include marshes, inland rivers, outlet rivers, lakes, and permanent glaciers and snowfields.

2.3.3. Sensitivity Analysis

We explored the sensitivity of wetland areas in the MLYRB to some important predicting variables in a well-trained model. Considering the spatial heterogeneity of future climate change, the SSP5–8.5 scenario represents the climate conditions expected under extreme emissions scenarios. Therefore, the climate data associated with SSP5–8.5 may be considered as an upper limit for potential climate change. The differences in climate variables between the current and SSP5–8.5 scenarios were divided into ten equal parts on average. These adjusted variables were then used to generate a series of simulations of predicting potential wetland distributions. A resampling method was employed to calculate the proportion of wetland areas in each small area based on the climate variables and wetland distributions, ranging from 15″ to 0.05°. Within each area, the climate variables were taken as having a flat value. Linear regression was then executed on the resampled results to examine the impact of various variables on wetland distributions.

3. Results

3.1. Wetland Simulation

We mapped the distribution of potential wetlands in the MLYRB at present at 15″ spatial resolution (Figure 4). Wetlands in the MLYRB are mainly located near rivers and lakes in the middle of the basin. Human-induced wetland losses are determined by calculating the difference between simulated potential wetland areas and actual wetland areas (Figure 5). Spatially, wetland losses are mainly concentrated around central Dongting Lake. More than 40% of potential wetland losses have been detected in all wetland models. In particularly, potential wetland losses calculated by the Bayesian classification algorithm can reach up to ~70%, which is consisted with the results of Xu et al. [17]. The apparent differences in the distribution of wetlands can be attributed to variations in algorithms. RF and AdaBoost algorithms are both tree integration algorithms. In this study, the number of trees is localized to 30 and the number of branching nodes is set to 20 based on the out-of-bag error. As such, there is a very small difference in the graph presented, which is also due to the difference between the two algorithms. The RF algorithm combines the output of multiple decision trees to obtain a single result, similar to parallel processing, whereas the AdaBoost algorithm redistributes the weights of each tree in each round, giving higher weights to misclassified conditions. The KNN algorithm is used to classify the k closest values to the target according to the majority principle, and k is 100 in this study. ANNs set 10 layers and iterations less than 50. The NB algorithm maintains default parameters and therefore differs significantly from other algorithms.
The 5-fold cross-validation shows that the AdaBoost algorithm and KNN algorithm achieve the best accuracy (97.5%) among the five algorithms (Table 3). However, the KNN algorithm independent validation accuracy is significantly lower than AdaBoost. Therefore, the AdaBoost model is used for further analyses. With five methods, we simulate the wetland area distributions. Because there is minimal difference in the accuracy of the machine learning models as mentioned in Table 3, when three or more models classify the same location as wetlands, we consider that location to be categorized as wetlands. We find the wetland covers an area of ~1.25 × 10⁵ km2, accounting for 15.66%.
The losses of wetlands in 30 sub-basins have been identified using the AdaBoost algorithm. Wetland losses vary widely between different sub-basins, ranging from 0.1% to 25% (Figure 6). Eight sub-watersheds potential wetland losses of more than 10% (Table 4), mainly in the central Yangtze River riverside and the eastern estuary area in the MLYRB, covering the three lakes of Dongting Lake, Poyang Lake, and Taihu Lake. In particular, the Dongting Lake region and the Yichang-Wuhan section of the Yangtze River are most affected, with wetland losses exceeding 20%. Specifically, the Yichang to Wuhan left bank has the highest percentage of wetland loss, reaching a quarter of the total wetland areas in the region.

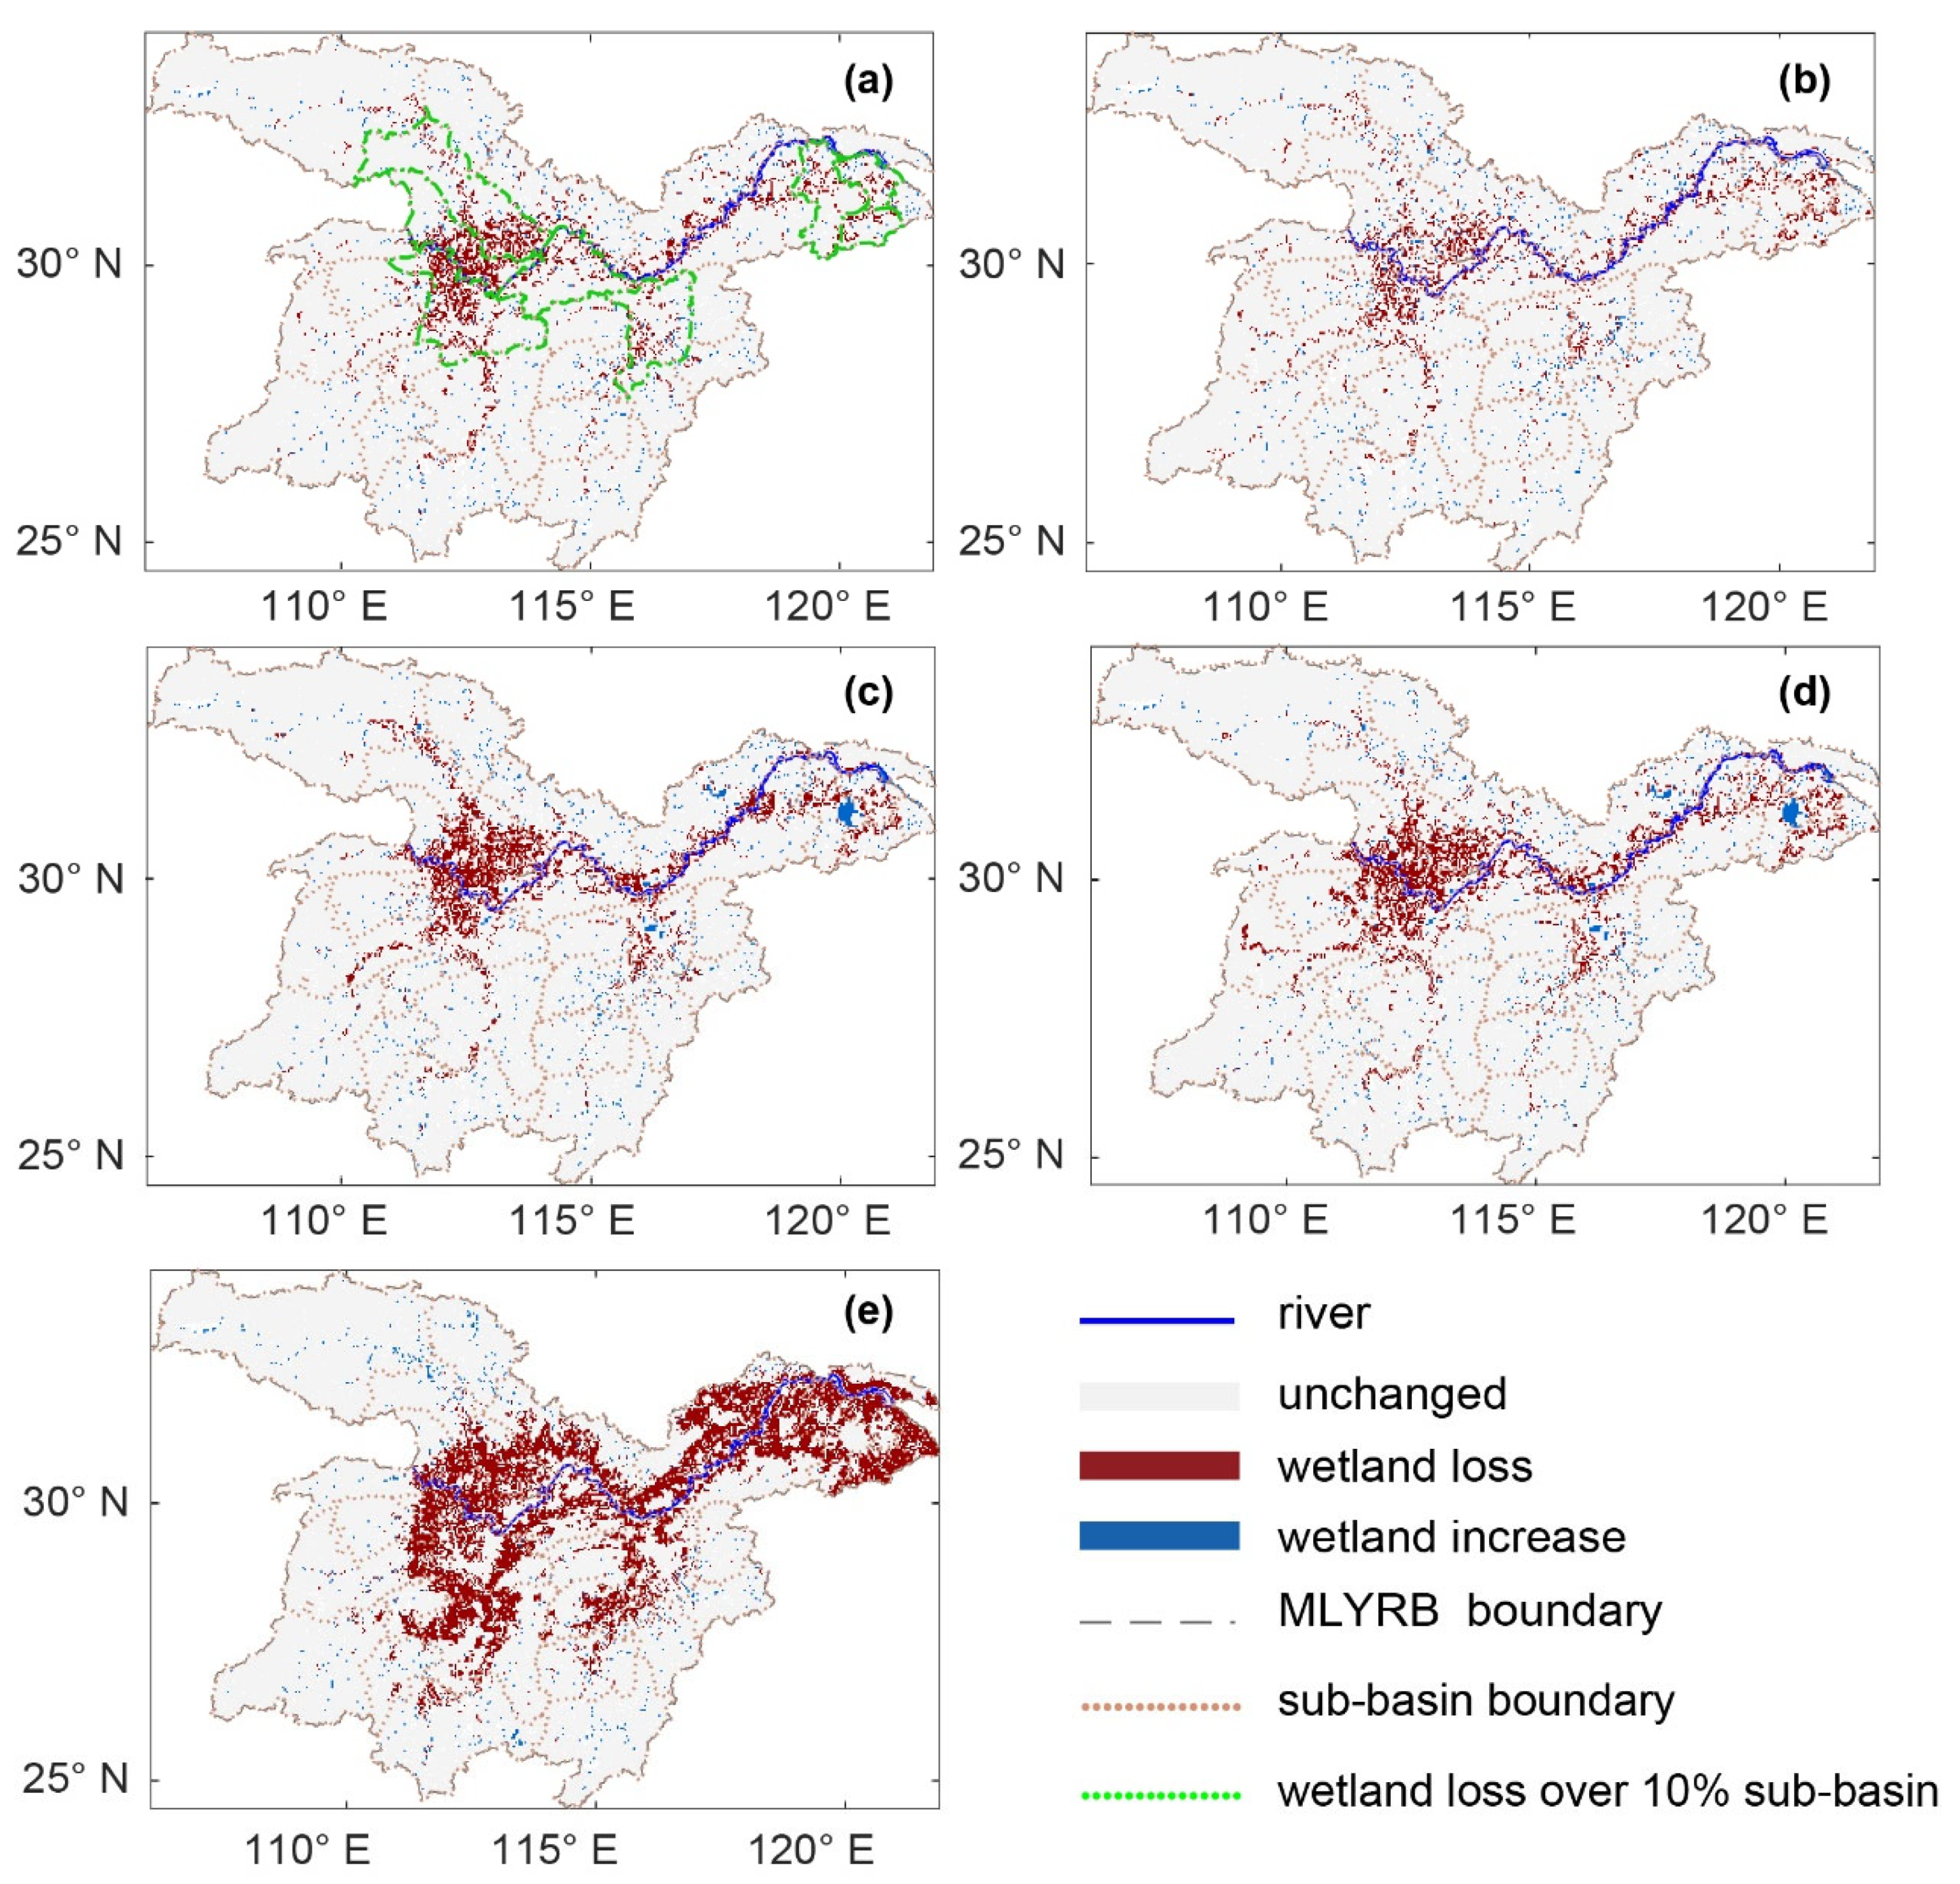
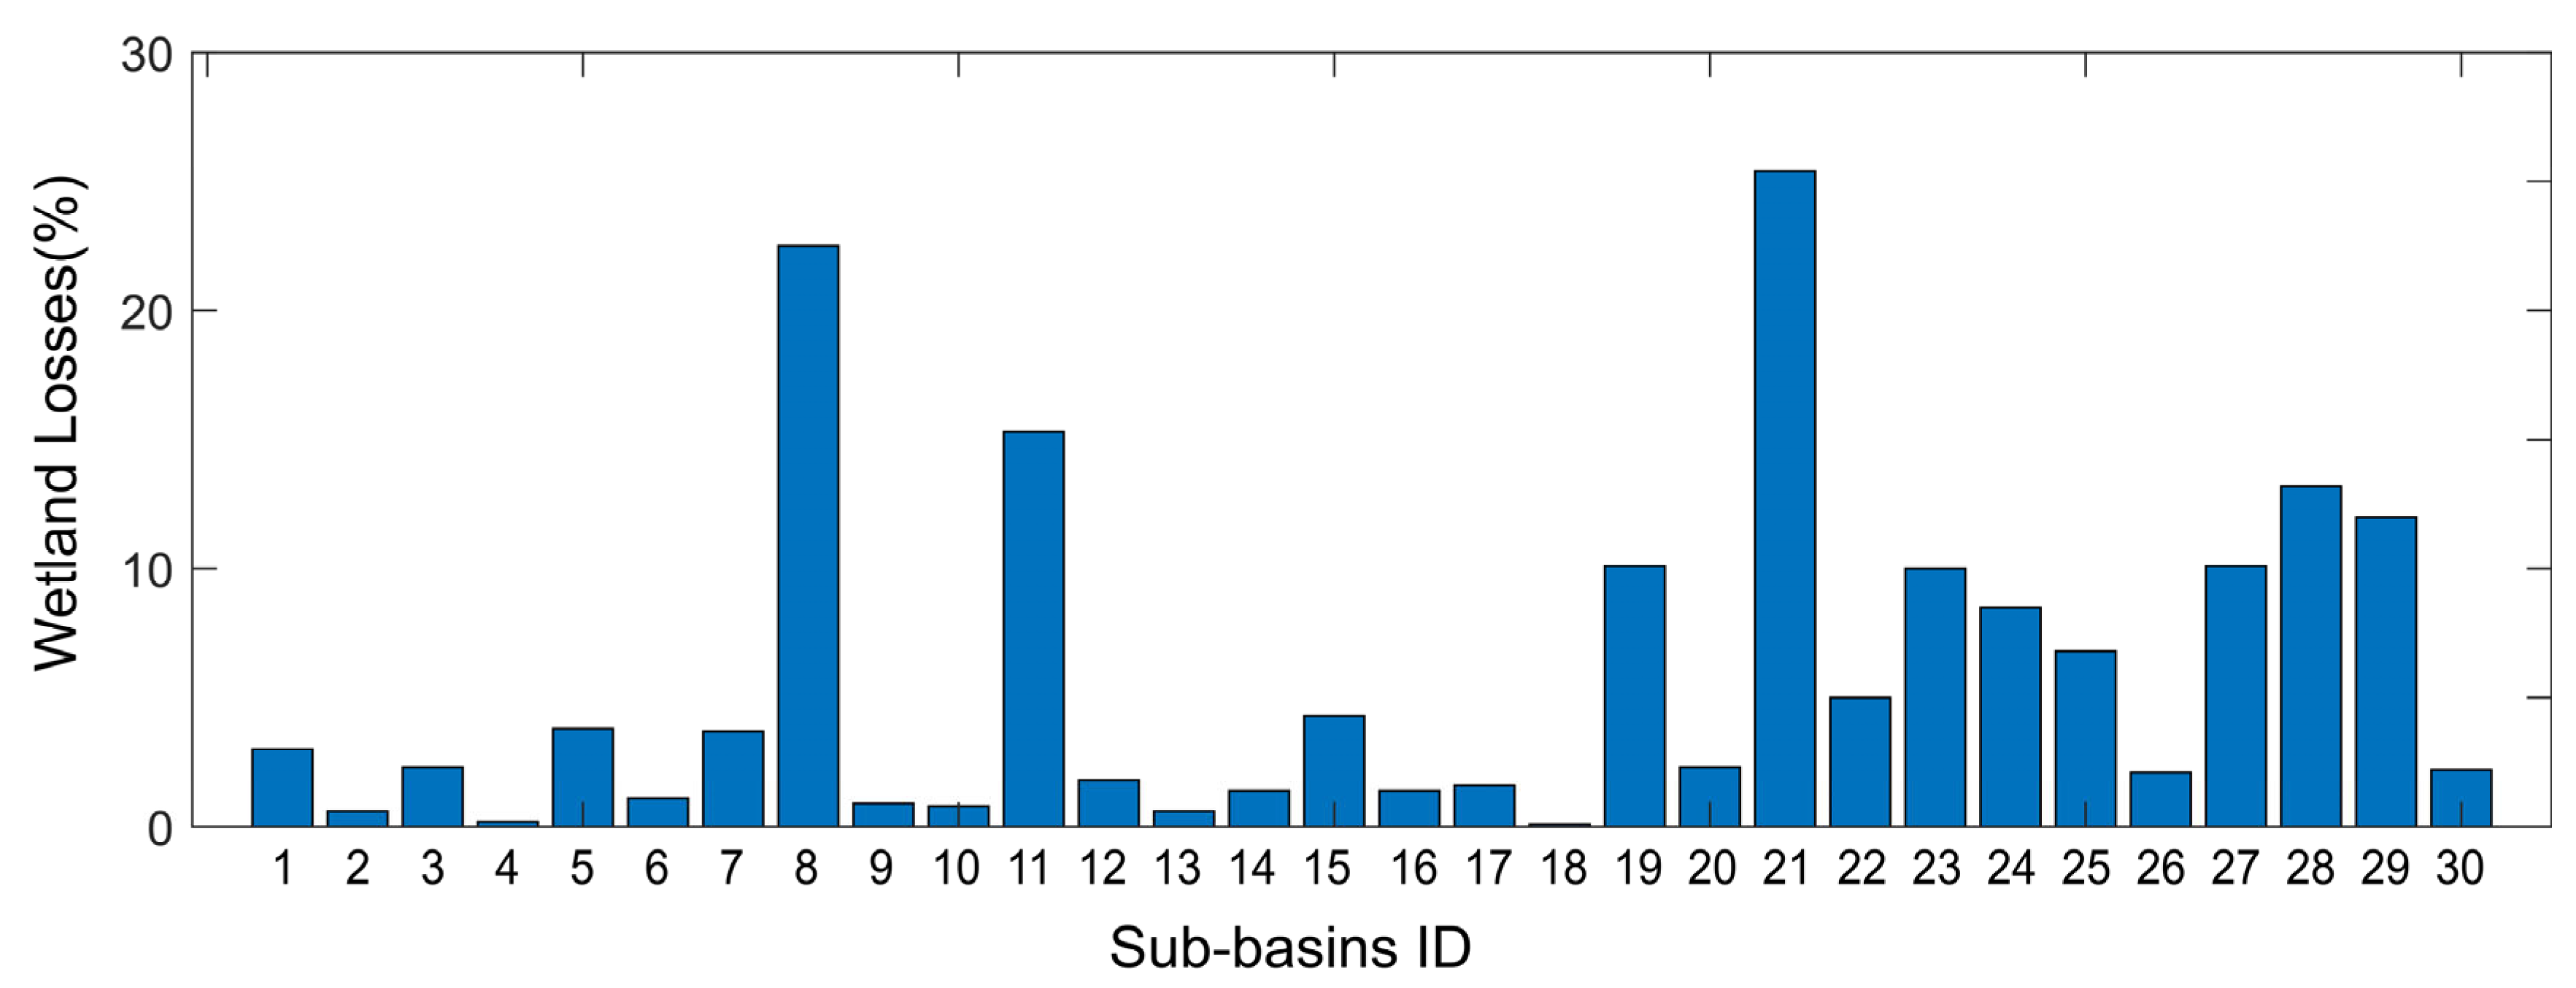
3.2. Future Changes of Potential Wetland

The AdaBoost algorithm, as the best model among examined methods, has been used to analyze future wetland distributions and their sensitivity to environmental factors. The area changes of wetlands showed a significant downward trend (Figure 7a), and the wetland loss under a high-emission scenario is more rapid. Compared with the 2000s, wetlands cover 8.9% of the entire MLYRB under the SSP2–4.5 emission scenario, while the wetland proportion is reduced to only 7.4% under the SSP5–8.5 emission scenario. Potential wetland losses are 40.6% and 50.6%, respectively. The proportion of potential wetlands will decrease by 1.2% by the end of this century under the SSP2–4.5 scenario for the whole MLYRB (Figure 7b). However, wetland areas will increase slightly in MYRB. Under the SSP5–8.5 scenario, the decreasing area is twice larger than the decrease in the SSP2–4.5 scenario. The proportion of wetlands will decrease by 2.4% for the whole MLYRB. The regions with a reduction in wetlands are mainly concentrated near Dongting Lake and Poyang Lake, especially in very high-emission scenarios.

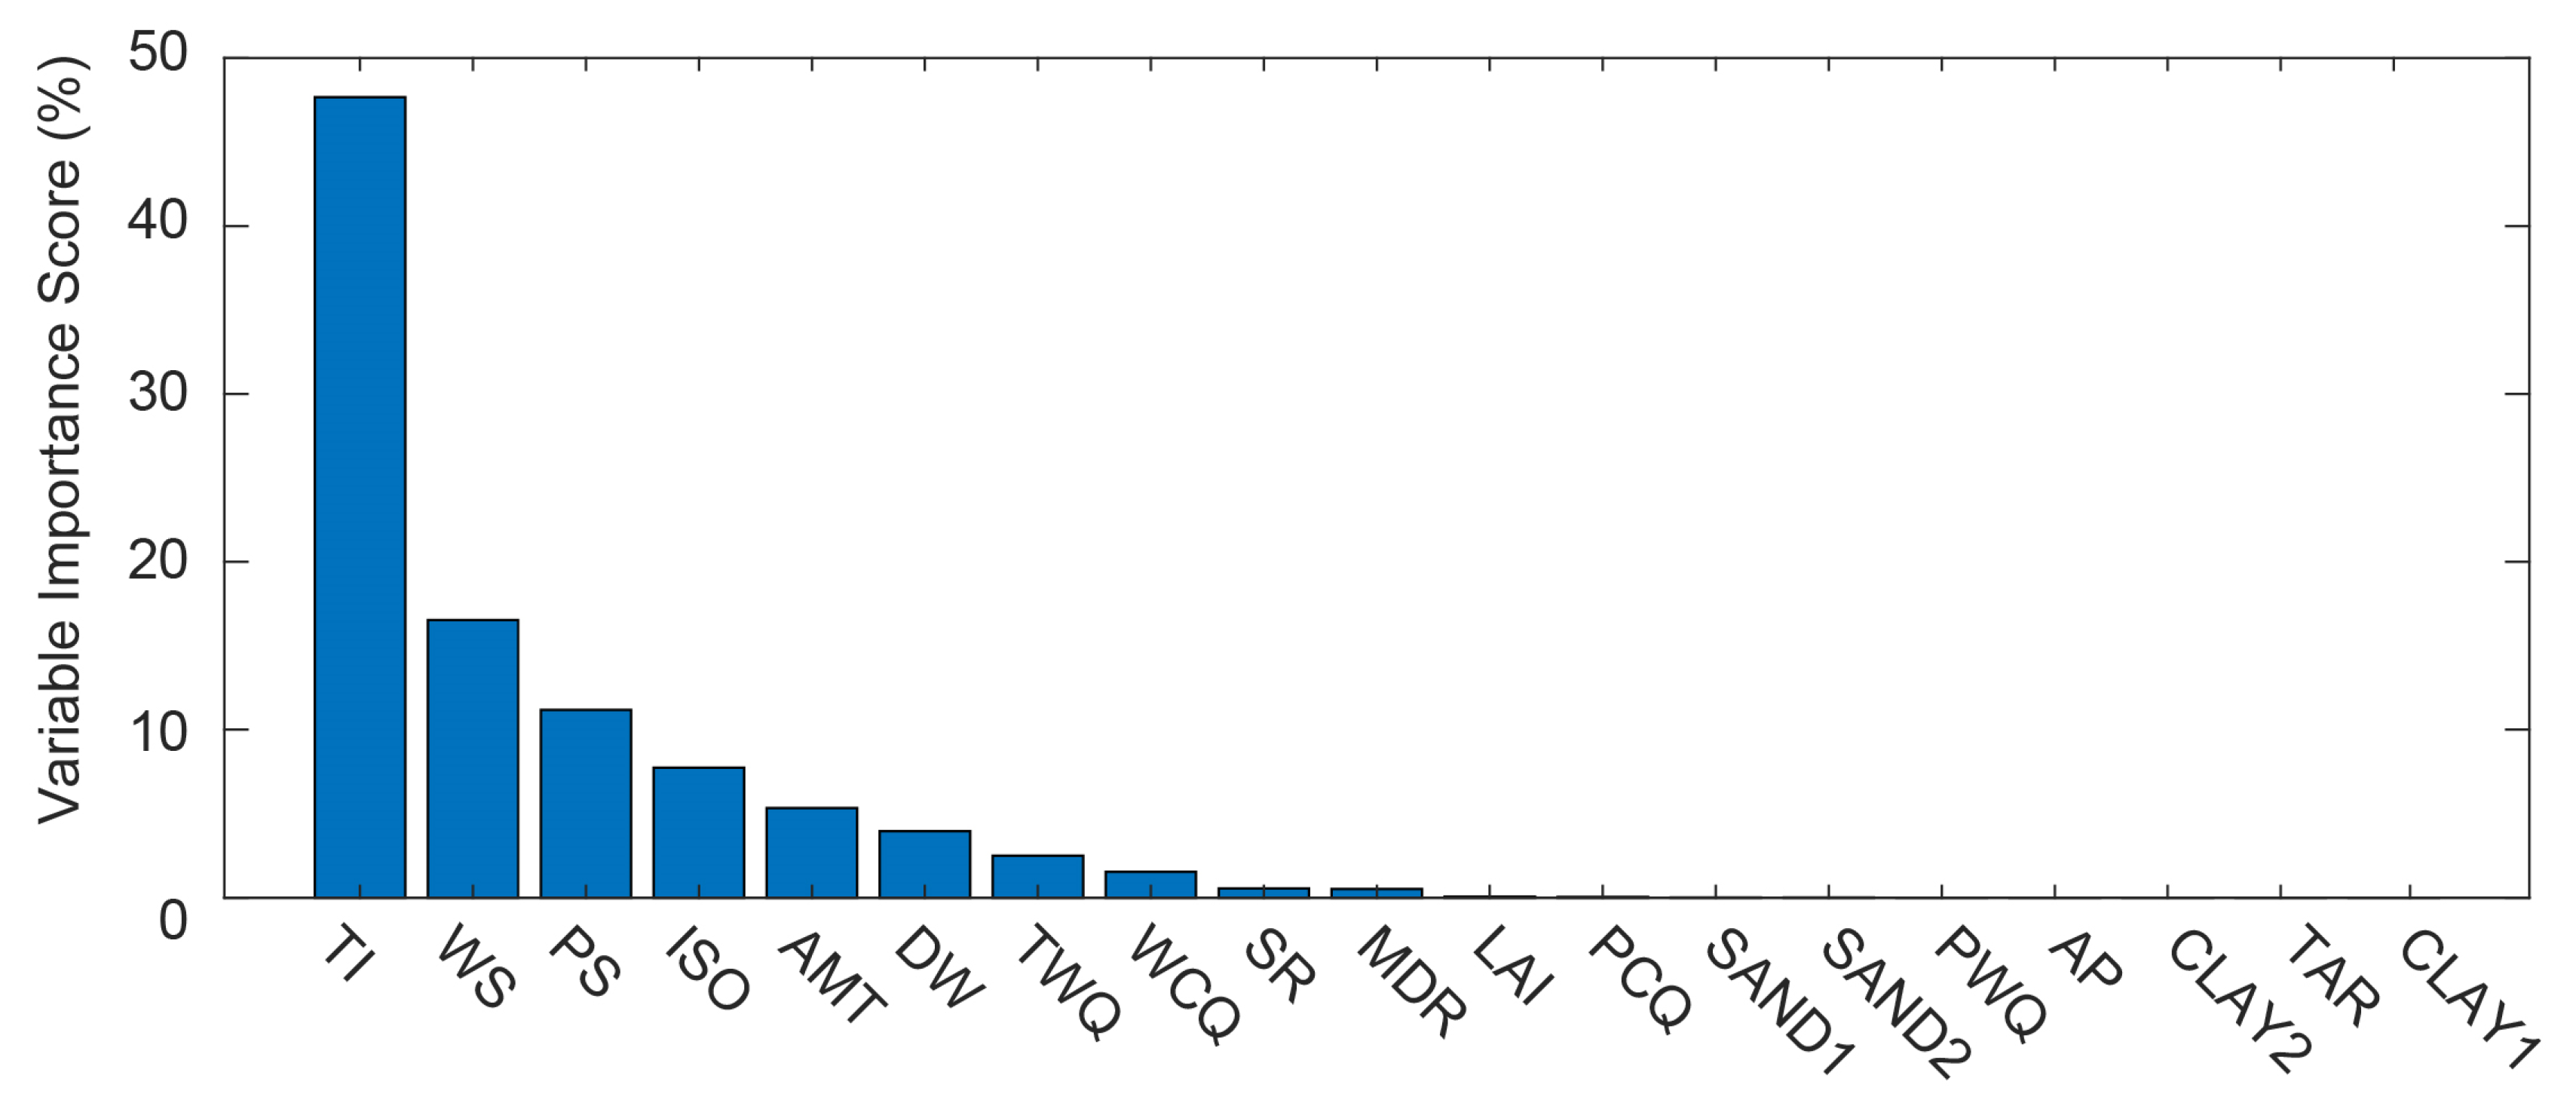
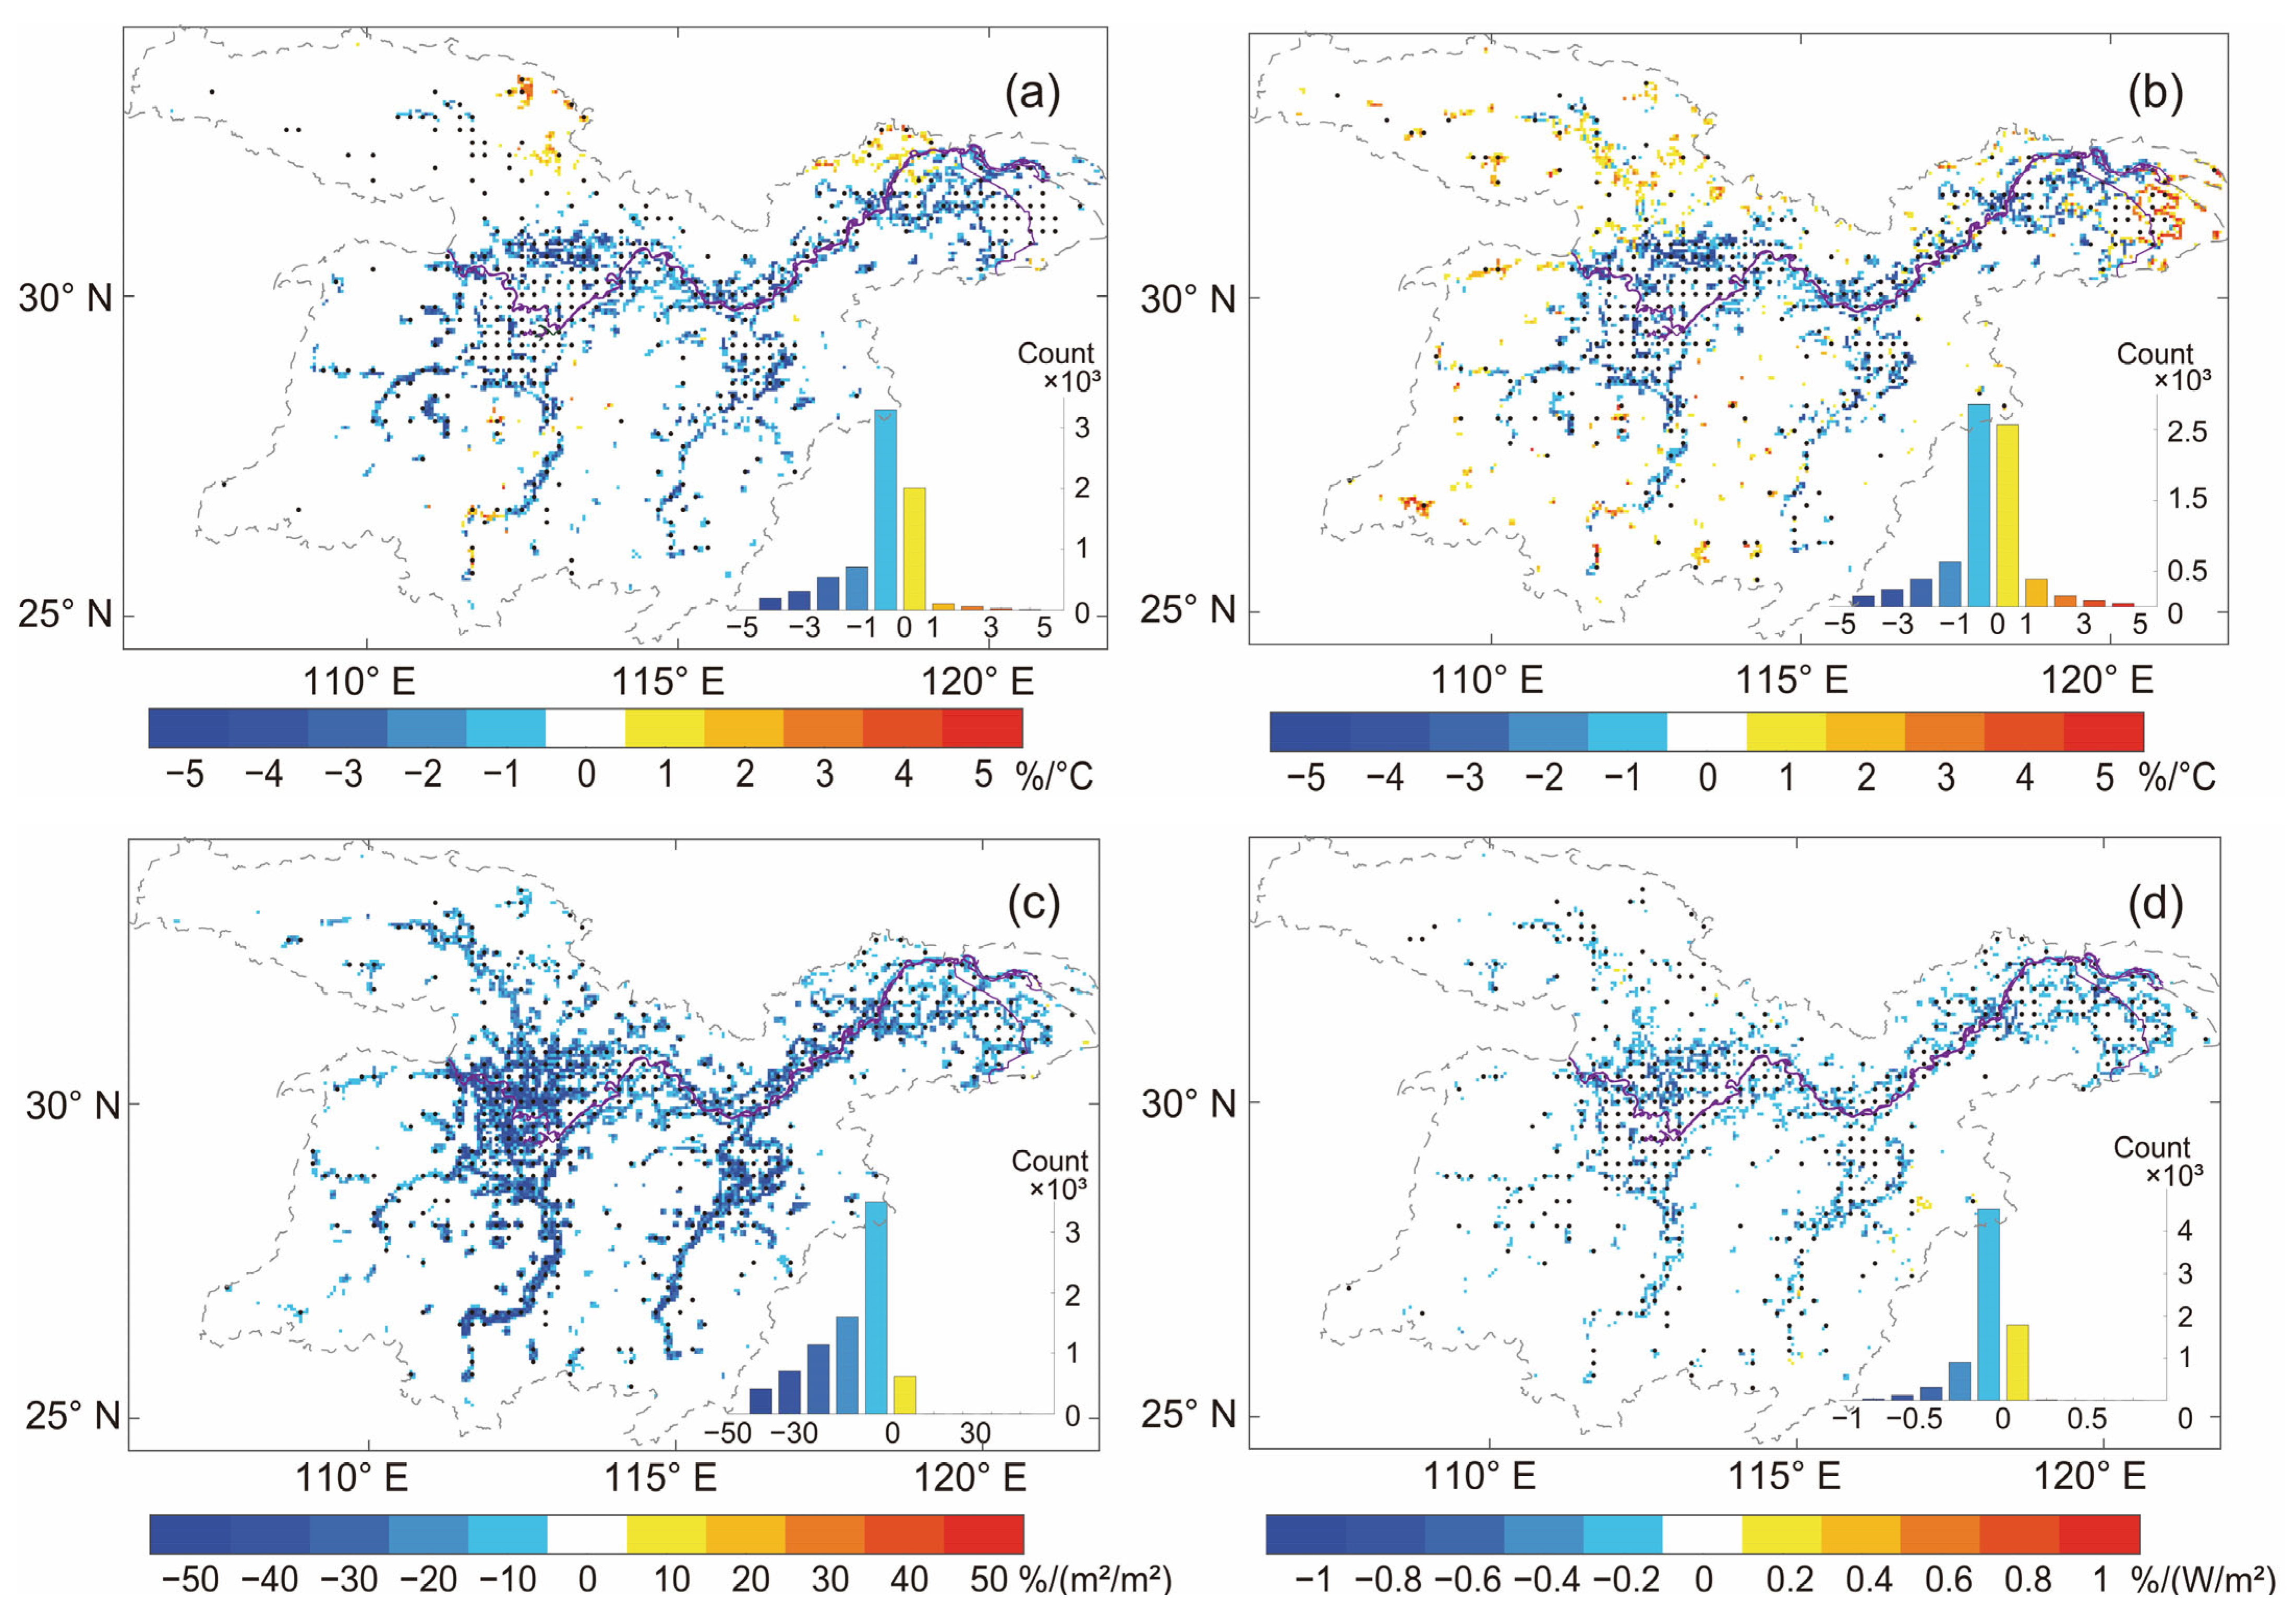
3.3. Environmental Variables Sensitivity

Natural or human-induced factors that directly or indirectly cause a change in an ecosystem are referred to as drivers [65]. It is meaningful to quantify the impact of various factors on wetlands. Since soil, topography, and other factors change little on the centennial scale, their changes have limited impact on wetland changes, hence we hypothesized that these factors are constant in this study. The importance of all variables has been ranked in the wetland simulation model. Hence, the top 10 ranked variables were selected to perform sensitivity analysis (Figure 8). We used the 2080–2100 climate variable in the extreme emission scenario as the boundary for ten simulations. The linear fitting between the change of wetland distributions and the change of a single climate variable is carried out.
As illustrated in Figure 9, wetland distributions are negatively correlated with temperature indicators. A significant negative correlation exists between the extent of wetland areas and the coldest season temperature, with a correlation coefficient as high as −17.5% per degree Celsius. These correlations are primarily found in the central and southern parts of the study area. This implies that for every one-degree Celsius increase, the wetland areas in the most sensitive regions can decrease by 17.5%. Additionally, the area of some wetlands will increase under higher temperatures. This part is mainly distributed in the northern part of the basin. The sensitivity of wetland areas to the coldest season temperature in the entire YRB ranges from −22%~8%/°C. We choose the median as a proxy, which means when the coldest season temperature increases by 1 °C, wetland areas decrease by 0.8% in the MLYRB. The negative correlation between wetlands and the warmest season temperature is mainly distributed in the central and southern parts of the MLYRB. There is a noteworthy negative correlation between the extent of wetland areas and the warmest season temperature with a correlation coefficient of −14.9% per degree Celsius, which is mainly distributed in the MYRB The sensitivity of the warmest season temperature to wetland areas in the entire YRB ranges from −21~9%/°C. Compared with the two temperature factors, we could infer that change of wetland areas is more sensitive to the coldest temperature, especially in the northwest region of MLYRB.
There is a negative correlation between LAI and wetlands. The negative grids are distributed throughout the watershed, especially in the western and southern regions. The sensitivity of wetland areas to LAI in the entire YRB ranges from −71~7%/(m2/m2), while the median is −3.6%/(m2/m2). As such, we can infer that for every 1 unit increase in LAI, the wetland areas decrease by 3.6% in MLYRB.
Wetland distributions are negatively correlated with solar radiation (Figure 9d). The proportion of patches negatively correlated is 19.4%/(W/m2) of the MLYRB. On the other hand, there is a little positive correlation in the east of MLYRB. The sensitivity of solar radiation to wetland areas in the entire YRB is −2~1%/(W/m2). We choose the median as a proxy, which means for every 1 W/m2 increase in solar radiation, the wetland areas decrease by 0.03%.

4. Discussion

4.1. Model Performance and Influencing Factors

In this study, a model has been trained to simulate the distribution of potential wetlands in the MLYRB region, which accounted for approximately 15% of the total area. The results of this study are generally consistent with those of Hu et al. [10], whose results found that wetlands covered approximately 13.8% of the MLYRB region. Our results showed a significant discrepancy from those of Tootchi et al. [26], whose wetland cover is 27% of the MLYRB. This discrepancy may come from the selection of different wetland simulation methods. The results of Tootchi et al. [26] are based on physical process of groundwater transport processes instead of relationship between wetlands and climate driving factors. Climate is the primary factor controlling the dynamics of wetland formation and material exchange [66]. The influence of climate change on wetlands is expressed primarily through changes in precipitation and temperature [67,68]. Adding temperature indicators for further detailed simulation can improve the accuracy of modeling potential wetlands [69]. A significant negative correlation has been observed between mean annual temperature and marsh area (r = −0.46, p < 0.01). Additionally, there is a significant positive correlation between annual precipitation and marsh area (r = 0.18, p < 0.05) [70].
To enhance the accuracy of our model, we employed a stepwise training process. Initially, we trained the model using topography, temperature, and precipitation data, which yielded a 5-fold cross-validation accuracy of 94.9%. As mentioned above, soil textures play complex roles in wetland distributions. On the one hand, organic matter-rich soil tends to convert into cropland due to anthropogenic activity, which in turn leads to significant changes in land cover type [71]. On the other hand, soil texture is one of the key factors affecting soil water holding capacity and soil water availability [31]. Thus, we subsequently incorporated soil texture, improving the 5-fold cross-validation accuracy to 95.3%. Moreover, large-scale afforestation may result in wetland losses due to increased evapotranspiration and decreased runoff and soil moisture [33,72,73]. Consequently, we included LAI as an indicator of vegetation changes, which further increased the model accuracy to 97.5%. As mentioned above, we not only consider topographic factors and hydrological conditions, but also add temperature, soil, and vegetation into the wetland simulation model, which conducts the more sensible results. Simulation of future wetland distributions by varying a single variable showed that LAI contributed most, followed by mean coldest quarter temperature, both of which could influence wetland areas by up to 90% relative to total wetland areas.

4.2. Future Wetland Change and Its Sensitivity

Anthropogenic global warming in the future can result in the loss of wetlands in this region. Under the high emission scenario, about 60% of the wetland areas in the Great Xing’an mountain region will be lost by 2100 [74]. In our results, the proportion of wetlands in the MLYRB will reduce by 50% by 2100 under the high-emissions scenario, which is comparable to the previous projection study in the Great Xing’an Mountain. Most wetland losses occurred in populated temperate watersheds such as the Yangtze River [4]. Substantial wetland losses across river basins can lead to degraded water quality [75]. As the potential wetland reduction has been mainly concentrated in the MYRB, we can infer that the reduction in potential wetland is caused by human activities. The largest reduction is in the Yangtze River section from Yichang to Wuhan, where a major hydrological project, the Three Gorges Dam, is located. After the completion of the Three Gorges Dam, sediments were trapped in the reservoir, leading to increased erosion of the riverbed in the middle and lower reaches due to the release of clear water, resulting in a decrease in riverbed elevation and a drop in water level in the MLYRB [76,77]. At the same time, the weakening of the river’s water supply on the lakes has resulted in the inflow of water from the lakes into the Yangtze, finally resulting in a decrease in wetland water level [78,79]. Thus, the wetland changes in the lakeside area are more complex and fragile than the centers.
Previous studies have found that wetland changes are negatively correlated with temperature changes using different methods [80,81]. Climate change, especially global warming, is expected to have an additional effect on evapotranspiration and evapotranspiration ratio through increases in radiation, temperature, and water vapor deficit [82]. In fact, temperature plays a complex role in our wetland distribution modelling results. Wetlands have different temperature sensitivity in different seasons. Statistically, there are 10% more grids exhibiting a negative correlation with temperature during the coldest season when compared to the warmest season and with a higher probability of achieving significance at 82.7% as mentioned in Table 5. On average, 0.8% of wetlands are lost when temperatures rise by 1 °C. For the most sensitive regions, the correlation can reach as low as −20%/°C in the lower Danjiangkou sub-basin. For the MLYRB, the western and northern areas are more effective than east and south because the terrain is more complicated. We infer that the distribution of wetlands has a suitable temperature interval. Exceeding the maximum temperature threshold will not be conducive to the development of wetlands. There is evidence that the temperature range for the development of wetlands. The previous statistical analysis using the hydrothermal conditions of the development of more than 5000 wetlands across the country showed that the national marsh wetlands are mainly distributed in the hydrothermal zone, with an average annual temperature of −7~15 °C [83]. Therefore, under future warming scenarios, the wetland areas will increase in the west and north of the MLYRB as the temperature rises to suitable range for wetland development.
The results indicate that in a significant majority of areas, approximately 96.5%, wetlands and LAI exhibit a notable negative correlation. We used LAI to represent vegetation. Vegetation affects hydrodynamics in two ways: (a) by adding resistance to flow through the water column (emergent plants) or a portion of it (submerged plants); (b) by shielding the water surface from wind shear stress and potentially removing wind as a controlling force when dense vegetation is present [84]. The extensive afforestation has also led to increased evapotranspiration and decreased runoff and soil moisture [85]. At the catchment scale, this decline in available water unavoidably diminishes the water supply to wetlands, thus posing a potential threat to the diverse ecosystem services they provide [33].
Meanwhile, wetland losses directly reduce habitats of fish, birds, and other wildlife and threaten ecosystem services, including water filtration and biodiversity [86]. The reduction in lake capacity results in a decrease in the water surface area and subsequently reduces the water storage capacity [87]. The wetland’s purification function is very significant. More than 1000 kg of nitrogen and 130 kg of phosphorus can be removed in every hectare of wetlands per year [88]. On the contrary, after wetlands are disrupted, water quality changes from II to IV due to human activities in MLYRB [89]. Inland wetlands in the world, including rivers and lakes, support about 15,000 species of fish [90], of which over half are threatened, endangered, or extinct in the wild [91]. A 50% decline in waterbird abundance and species richness and a 30% decline in functional diversity between 2005 and 2016 in the Yangtze floodplain [19].

5. Conclusions

We employed five machine learning algorithms to simulate potential wetland distributions with almost accuracy greater than 90%. Residual analysis revealed significant losses of potential wetland areas in Dongting Lake and the Yangtze River section from Yichang to Wuhan due to human activities. This means that wetlands could may recover by reducing anthropogenic disturbances. Sensitivity analysis indicated that LAI had the most significant impact on wetland development, meanwhile temperature had a negative effect. An increase of 1 °C in the coldest season temperature could result in 20% wetland losses at the northwest of the MLYRB. Thus, it is vital to slow down the rate of global warming to protect wetlands. On average, for each 1 (m2/m2) increase in LAI, wetland losses in MLYRB will decrease by 3.6%. However, in sensitive areas like Dongting Lake sub-basin, wetland losses can reach up to 50%. Therefore, the protection of wetlands requires special attention to vegetation growth. Our results also shed light on wetland management and conservation and declare the urgent need for effective arrangements for wetland protection. In the future, it is imperative that we concentrate our efforts on the Poyang Lake and Dongting Lake areas in order to mitigate human activities. Our modeling framework has proven its suitability in identifying potential wetland distributions. Our results also shed light on wetland management and conservation and declare the urgent need for effective arrangements for wetland protection. However, this research is concerned with the influence of climate change on wetlands and its sensitivity to climate change. More socioeconomic variables such as population density and scenarios remain to be considered in future research.

Author Contributions

Conceptualization, W.C.; methodology, W.C.; software, A.X.; validation, Z.M. and A.X.; formal analysis, Z.M.; investigation, Z.M.; resources, Z.M.; data curation, Z.M.; writing—original draft preparation, Z.M.; writing—review and editing, W.C., A.X. and R.Z.; visualization, Z.M.; supervision, W.C. and R.Z.; project administration, W.C.; funding acquisition, W.C. All authors have read and agreed to the published version of the manuscript.

Funding

This study was supported by the National Science Foundation of China (No. 42307556 and 42230208), the Natural Science Foundation of Hubei Province (No. 2023AFB024 and 2022CFC059), the China Postdoctoral Science Foundation (No. 2021M692976), and the Fundamental Research Funds for the Central Universities the China University of Geosciences (Wuhan) (No. CUG2106323).

Data Availability Statement

The used data in this study are all publicly available online. The simulated wetland distributions we produced are available from the corresponding author on reasonable request.

Acknowledgments

We thank the data support from National Earth System Science Data Center, National Science and Technology Infrastructure of China (http://www.geodata.cn, accessed on 1 April 2022), National Tibetan Plateau Data Center (http://data.tpdc.ac.cn, accessed on 1 April 2022).

Conflicts of Interest

The authors declare no conflict of interest.

References

  1. Yang, W.; Zhong, J.; Xia, Y.; Hu, Q.; Fang, C.; Cong, M.; Yao, B.; You, Q. A Comprehensive Multi-Metric Index for Health Assessment of the Poyang Lake Wetland. Remote Sens. 2023, 15, 4061. [Google Scholar] [CrossRef]
  2. Niu, Z.; Gong, P.; Cheng, X.; Guo, J.; Wang, L.; Huang, H.; Shen, S.; Wu, Y.; Wang, X.; Wang, X.; et al. Geographical characteristics of China’s wetlands derived from remotely sensed data. Sci. China Ser. D Earth Sci. 2009, 52, 723–738. [Google Scholar] [CrossRef]
  3. Peng, S.; Lin, X.; Thompson, R.L.; Xi, Y.; Liu, G.; Hauglustaine, D.; Lan, X.; Poulter, B.; Ramonet, M.; Saunois, M.; et al. Wetland emission and atmospheric sink changes explain methane growth in 2020. Nature 2022, 612, 477–482. [Google Scholar] [CrossRef] [PubMed]
  4. Fluet-Chouinard, E.; Stocker, B.D.; Zhang, Z.; Malhotra, A.; Melton, J.R.; Poulter, B.; Kaplan, J.O.; Goldewijk, K.K.; Siebert, S.; Minayeva, T.; et al. Extensive global wetland loss over the past three centuries. Nature 2023, 614, 281–286. [Google Scholar] [CrossRef] [PubMed]
  5. Mahdian, M.; Hosseinzadeh, M.; Siadatmousavi, S.M.; Chalipa, Z.; Delavar, M.; Guo, M.; Abolfathi, S.; Noori, R. Modelling impacts of climate change and anthropogenic activities on inflows and sediment loads of wetlands: Case study of the Anzali wetland. Sci. Rep. 2023, 13, 5399. [Google Scholar] [CrossRef]
  6. Davidson, N.C.; Finlayson, C.M. Extent, regional distribution and changes in area of different classes of wetland. Mar. Freshw. Res. 2018, 69, 1525–1533. [Google Scholar] [CrossRef]
  7. Dixon, M.J.R.; Loh, J.; Davidson, N.C.; Beltrame, C.; Freeman, R.; Walpole, M. Tracking global change in ecosystem area: The Wetland Extent Trends index. Biol. Conserv. 2016, 193, 27–35. [Google Scholar] [CrossRef]
  8. Niu, Z.; Zhang, H.; Wang, X.; Yao, W.; Zhou, D.; Zhao, K.; Zhao, H.; Li, N.; Huang, H.; Li, C.; et al. Mapping wetland changes in China between 1978 and 2008. Chin. Sci. Bull. 2012, 57, 2813–2823. [Google Scholar] [CrossRef]
  9. Luan, Z.; Zhou, D. Impacts of intensified agriculture developments on marsh wetlands. Sci. World J. 2013, 2013, 409–439. [Google Scholar] [CrossRef]
  10. Hu, S.; Niu, Z.; Chen, Y.; Li, L.; Zhang, H. Global wetlands: Potential distribution, wetland loss, and status. Sci. Total Environ. 2017, 586, 319–327. [Google Scholar] [CrossRef]
  11. Chen, Z.; Yu, L.; Gupta, A. The Yangtze River: An introduction. Geomorphology 2001, 41, 73–75. [Google Scholar] [CrossRef]
  12. Li, X.; Yu, X.; Jiang, L.; Li, W.; Liu, Y.; Hou, X. How important are the wetlands in the middle-lower Yangtze River region: An ecosystem service valuation approach. Ecosyst. Serv. 2014, 10, 54–60. [Google Scholar] [CrossRef]
  13. Huang, B.; Ouyang, Z.; Zheng, H.; Zhang, H.; Wang, X. Construction of an eco-island: A case study of Chongming Island, China. Ocean Coast. Manag. 2008, 51, 575–588. [Google Scholar] [CrossRef]
  14. Liu, Y.; Zhang, X.; Kong, X.; Wang, R.; Chen, L. Identifying the relationship between urban land expansion and human activities in the Yangtze River Economic Belt, China. Appl. Geogr. 2018, 94, 163–177. [Google Scholar] [CrossRef]
  15. Mao, D.; Wang, Z.; Wu, J.; Wu, B.; Zeng, Y.; Song, K.; Yi, K.; Luo, L. China’s wetlands loss to urban expansion. Land Degrad. Dev. 2018, 29, 2644–2657. [Google Scholar] [CrossRef]
  16. Chen, M.; Xu, X.; Wu, X.; Mi, C. Centennial-scale study on the spatial-temporal evolution of riparian wetlands in the Yangtze River of China. Int. J. Appl. Earth Obs. Geoinf. 2022, 113, 102874. [Google Scholar] [CrossRef]
  17. Xu, M.; Liu, D.; Ge, F.; Lin, N. Study on the Ecological Restoration and Protection Countermeasures in the Typical Ecological Fragile Zone of the Yangtze Economic Belt. Environ. Prot. 2017, 45, 50–53, (In Chinese with English Abstract). [Google Scholar] [CrossRef]
  18. Du, Y.; Xue, H.-p.; Wu, S.-j.; Ling, F.; Xiao, F.; Wei, X.-h. Lake area changes in the middle Yangtze region of China over the 20th century. J. Environ. Manag. 2011, 92, 1248–1255. [Google Scholar] [CrossRef]
  19. Jia, Q.; Wang, X.; Zhang, Y.; Cao, L.; Fox, A.D. Drivers of waterbird communities and their declines on Yangtze River floodplain lakes. Biol. Conserv. 2018, 218, 240–246. [Google Scholar] [CrossRef]
  20. Davidson, N.C. How much wetland has the world lost? Long-term and recent trends in global wetland area. Mar. Freshw. Res. 2014, 65, 934–941. [Google Scholar] [CrossRef]
  21. Medjani, F.; Aissani, B.; Labar, S.; Djidel, M.; Ducrot, D.; Masse, A.; Hamilton, C.M.-L. Identifying saline wetlands in an arid desert climate using Landsat remote sensing imagery. Application on Ouargla Basin, southeastern Algeria. Arab. J. Geosci. 2017, 10, 176. [Google Scholar] [CrossRef]
  22. Aslam, R.W.; Shu, H.; Yaseen, A.; Sajjad, A.; Abidin, S.Z.U. Identification of time-varying wetlands neglected in Pakistan through remote sensing techniques. Environ. Sci. Pollut. Res. 2023, 30, 74031–74044. [Google Scholar] [CrossRef] [PubMed]
  23. Amgoth, A.; Rani, H.; Kv, J. Exploring LULC changes in Pakhal Lake area, Telangana, India using QGIS MOLUSCE plugin. Spat. Inf. Res. 2023, 31, 429–438. [Google Scholar] [CrossRef]
  24. Amgoth, A.; Rani, H.; Kv, J. Monitoring of Dynamic Wetland Changes using NDVI and NDWI based Landsat Imagery. Remote Sens. Appl. Soc. Environ. 2021, 23, 100547. [Google Scholar] [CrossRef]
  25. Amgoth, A.; Rani, H.; Kv, J. Extraction of Water Surface Bodies for Pakhal Lake, India Using GEE; Springer: Singapore, 2022; pp. 433–448. [Google Scholar]
  26. Tootchi, A.; Jost, A.; Ducharne, A. Multi-source global wetland maps combining surface water imagery and groundwater constraints. Earth Syst. Sci. Data 2019, 11, 189–220. [Google Scholar] [CrossRef]
  27. Salimi, S.; Almuktar, S.; Scholz, M. Impact of climate change on wetland ecosystems: A critical review of experimental wetlands. J. Environ. Manag. 2021, 286, 112–160. [Google Scholar] [CrossRef]
  28. Chen, W.; Ciais, P.; Qiu, C.; Ducharne, A.; Zhu, D.; Peng, S.; Braconnot, P.; Huang, C. Wetlands of North Africa during the Mid-Holocene Were at Least Five Times the Area Today. Geophys. Res. Lett. 2021, 48, e2021GL094194. [Google Scholar] [CrossRef]
  29. Erwin, K.L. Wetlands and global climate change: The role of wetland restoration in a changing world. Wetl. Ecol. Manag. 2008, 17, 71–84. [Google Scholar] [CrossRef]
  30. Lafleur, P.M.; Moore, T.R.; Roulet, N.T.; Frolking, S. Ecosystem Respiration in a Cool Temperate Bog Depends on Peat Temperature But Not Water Table. Ecosystems 2005, 8, 619–629. [Google Scholar] [CrossRef]
  31. Zhang, Y.W.; Wang, K.B.; Wang, J.; Liu, C.; Shangguan, Z.P. Changes in soil water holding capacity and water availability following vegetation restoration on the Chinese Loess Plateau. Sci. Rep. 2021, 11, 9692. [Google Scholar] [CrossRef]
  32. Parmentier, F.J.W.; van der Molen, M.K.; de Jeu, R.A.M.; Hendriks, D.M.D.; Dolman, A.J. CO2 fluxes and evaporation on a peatland in the Netherlands appear not affected by water table fluctuations. Agric. For. Meteorol. 2009, 149, 1201–1208. [Google Scholar] [CrossRef]
  33. Xi, Y.; Peng, S.; Liu, G.; Ducharne, A.; Ciais, P.; Prigent, C.; Li, X.; Tang, X. Trade-off between tree planting and wetland conservation in China. Nat. Commun. 2022, 13, 1967. [Google Scholar] [CrossRef] [PubMed]
  34. Guan, B.-C.; Chen, S.-S.; Liu, X.; Gong, X.; Ge, G. Evolutionary hotspots in the middle and lower reaches of the Yangtze River Basin. Ecol. Inform. 2019, 52, 1–6. [Google Scholar] [CrossRef]
  35. Ma, K.; You, L.; Liu, J.; Zhang, M. A hybrid wetland map for China: A synergistic approach using census and spatially explicit datasets. PLoS ONE 2012, 7, e47814. [Google Scholar] [CrossRef] [PubMed]
  36. Ji, L.; Jiang, K.; Geng, X.; Tang, H.; Yu, K.; Zhao, Y. Improving Wetland Mapping by Using Multi-Source Data Sets. In Proceedings of the 2011 International Symposium on Image and Data Fusion, Yunnan, China, 9–11 August 2011; pp. 1–4. [Google Scholar]
  37. Fick, S.E.; Hijmans, R.J. WorldClim 2: New 1-km spatial resolution climate surfaces for global land areas. Int. J. Climatol. 2017, 37, 4302–4315. [Google Scholar] [CrossRef]
  38. Riahi, K.; van Vuuren, D.P.; Kriegler, E.; Edmonds, J.; O’Neill, B.C.; Fujimori, S.; Bauer, N.; Calvin, K.; Dellink, R.; Fricko, O.; et al. The Shared Socioeconomic Pathways and their energy, land use, and greenhouse gas emissions implications: An overview. Glob. Environ. Change 2017, 42, 153–168. [Google Scholar] [CrossRef]
  39. Beven, K.J.; Kirkby, M.J. A physically based, variable contributing area model of basin hydrology / Un modèle à base physique de zone d’appel variable de l’hydrologie du bassin versant. Hydrol. Sci. Bull. 1979, 24, 43–69. [Google Scholar] [CrossRef]
  40. Higginbottom, T.P.; Field, C.D.; Rosenburgh, A.E.; Wright, A.; Symeonakis, E.; Caporn, S.J.M. High-resolution wetness index mapping: A useful tool for regional scale wetland management. Ecol. Inform. 2018, 48, 89–96. [Google Scholar] [CrossRef]
  41. Lang, M.; McCarty, G.; Oesterling, R.; Yeo, I.-Y. Topographic Metrics for Improved Mapping of Forested Wetlands. Wetlands 2012, 33, 141–155. [Google Scholar] [CrossRef]
  42. Musolff, A.; Fleckenstein, J.H.; Opitz, M.; Büttner, O.; Kumar, R.; Tittel, J. Spatio-temporal controls of dissolved organic carbon stream water concentrations. J. Hydrol. 2018, 566, 205–215. [Google Scholar] [CrossRef]
  43. Raduła, M.W.; Szymura, T.H.; Szymura, M. Topographic wetness index explains soil moisture better than bioindication with Ellenberg’s indicator values. Ecol. Indic. 2018, 85, 172–179. [Google Scholar] [CrossRef]
  44. Marthews, T.R.; Dadson, S.J.; Lehner, B.; Abele, S.; Gedney, N. High-resolution global topographic index values for use in large-scale hydrological modelling. Hydrol. Earth Syst. Sci. 2015, 19, 91–104. [Google Scholar] [CrossRef]
  45. Richter, B.D.; Bartak, D.; Caldwell, P.; Davis, K.F.; Debaere, P.; Hoekstra, A.Y.; Li, T.; Marston, L.; McManamay, R.; Mekonnen, M.M. Water scarcity and fish imperilment driven by beef production. Nat. Sustain. 2020, 3, 319–328. [Google Scholar] [CrossRef]
  46. Heijden, F.V.D.; Duin, R.P.W.; Ridder, D.D.; Tax, D.M.J. Classification, Parameter Estimation and State Estimation; John Wiley & Sons: Hoboken, NJ, USA, 2005. [Google Scholar]
  47. Garris, H.W.; Mitchell, R.J.; Fraser, L.H.; Barrett, L.R. Forecasting climate change impacts on the distribution of wetland habitat in the Midwestern United states. Glob. Change Biol. 2015, 21, 766–776. [Google Scholar] [CrossRef] [PubMed]
  48. Borro, M.; Morandeira, N.; Salvia, M.; Minotti, P.; Perna, P.; Kandus, P. Mapping shallow lakes in a large South American floodplain: A frequency approach on multitemporal Landsat TM/ETM data. J. Hydrol. 2014, 512, 39–52. [Google Scholar] [CrossRef]
  49. Hamdan, M.A.; Asada, T.; Hassan, F.M.; Warner, B.G.; Douabul, A.; Al-Hilli, M.R.A.; Alwan, A.A. Vegetation Response to Re-flooding in the Mesopotamian Wetlands, Southern Iraq. Wetlands 2010, 30, 177–188. [Google Scholar] [CrossRef]
  50. Bojinski, S.; Verstraete, M.; Peterson, T.C.; Richter, C.; Simmons, A.; Zemp, M. The Concept of Essential Climate Variables in Support of Climate Research, Applications, and Policy. Bull. Am. Meteorol. Soc. 2014, 95, 1431–1443. [Google Scholar] [CrossRef]
  51. Nave, L.E.; Drevnick, P.E.; Heckman, K.A.; Hofmeister, K.L.; Veverica, T.J.; Swanston, C.W. Soil hydrology, physical and chemical properties and the distribution of carbon and mercury in a postglacial lake-plain wetland. Geoderma 2017, 305, 40–52. [Google Scholar] [CrossRef]
  52. McVicar, T.R.; Roderick, M.L.; Donohue, R.J.; Li, L.T.; Van Niel, T.G.; Thomas, A.; Grieser, J.; Jhajharia, D.; Himri, Y. Global review and synthesis of trends in observed terrestrial near-surface wind speeds: Implications for evaporation. J. Hydrol. 2012, 416, 182–205. [Google Scholar] [CrossRef]
  53. Shangguan, W.; Dai, Y.; Duan, Q.; Liu, B.; Yuan, H. A global soil data set for earth system modeling. J. Adv. Model Earth Syst. 2014, 6, 249–263. [Google Scholar] [CrossRef]
  54. Ma, H.; Liang, S. Development of the GLASS 250-m leaf area index product (version 6) from MODIS data using the bidirectional LSTM deep learning model. Remote Sens. Environ. 2022, 273, 112985. [Google Scholar] [CrossRef]
  55. Cao, Y.; Miao, Q.; Liu, J.; Gao, L. Advance and Prospects of AdaBoost Algorithm. Acta Autom. Sin. 2013, 39, 745–758. [Google Scholar] [CrossRef]
  56. Breiman, L. Random Forests. Mach. Learn. 2001, 45, 5–32. [Google Scholar] [CrossRef]
  57. Cutler, D.R.; Edwards Jr, T.C.; Beard, K.H.; Cutler, A.; Hess, K.T.; Gibson, J.; Lawler, J.J. Random forests for classification in ecology. Ecology 2007, 88, 2783–2792. [Google Scholar] [CrossRef] [PubMed]
  58. Cover, T.; Hart, P. Nearest neighbor pattern classification. IEEE Trans. Inf. Theory 1967, 13, 21–27. [Google Scholar] [CrossRef]
  59. Kubat, M. Similarities: Nearest-Neighbor Classifiers. In An Introduction to Machine Learning; Springer: Cham, Switzerland, 2017; pp. 43–64. [Google Scholar]
  60. Kubat, M. Artificial Neural Networks. In An Introduction to Machine Learning; Springer: Cham, Switzerland, 2017; pp. 91–111. [Google Scholar]
  61. Kubat, M. Probabilities: Bayesian Classifiers. In An Introduction to Machine Learning; Springer: Cham, Switzerland, 2017; pp. 19–41. [Google Scholar]
  62. Jordan, M.I.; Mitchell, T.M. Machine learning: Trends, perspectives, and prospects. Science 2015, 349, 255–260. [Google Scholar] [CrossRef]
  63. Freund, Y.; Schapire, R.E. A decision-theoretic generalization of on-line learning and an application to boosting. J. Comput. Syst. Sci. 1997, 55, 119–139. [Google Scholar] [CrossRef]
  64. Wong, T.-T.; Yeh, P.-Y. Reliable Accuracy Estimates from k-Fold Cross Validation. IEEE Trans. Knowl. Data Eng. 2020, 32, 1586–1594. [Google Scholar] [CrossRef]
  65. Nelson, G.C.; Bennett, E.; Berhe, A.A.; Cassman, K.; DeFries, R.; Dietz, T.; Dobermann, A.; Dobson, A.; Janetos, A.; Levy, M. Anthropogenic Drivers of Ecosystem Change: An Overview. Ecol. Soc. 2006, 11, 29. [Google Scholar] [CrossRef]
  66. Sutula, M.A.; Perez, B.C.; Reyes, E.; Childers, D.L.; Davis, S.; Day, J.W.; Rudnick, D.; Sklar, F. Factors affecting spatial and temporal variability in material exchange between the Southern Everglades wetlands and Florida Bay (USA). Estuar. Coast. Shelf Sci. 2003, 57, 757–781. [Google Scholar] [CrossRef]
  67. Dawson, T.P.; Berry, P.M.; Kampa, E. Climate change impacts on freshwater wetland habitats. J. Nat. Conserv. 2003, 11, 25–30. [Google Scholar] [CrossRef]
  68. Kong, W.; Sun, O.J.; Xu, W.; Chen, Y. Changes in vegetation and landscape patterns with altered river water-flow in arid West China. J. Arid Environ. 2009, 73, 306–313. [Google Scholar] [CrossRef]
  69. Xue, Z.; Zou, Y.; Zhang, Z.; Lyu, X.; Jiang, M.; Wu, H.; Liu, X.; Tong, S. Reconstruction and Future Prediction of the Distribution of Wetlands in China. Earth’s Future 2018, 6, 1508–1517. [Google Scholar] [CrossRef]
  70. Wang, Z.; Song, K.; Ma, W.; Ren, C.; Zhang, B.; Liu, D.; Chen, J.M.; Song, C. Loss and Fragmentation of Marshes in the Sanjiang Plain, Northeast China, 1954–2005. Wetlands 2011, 31, 945–954. [Google Scholar] [CrossRef]
  71. Song, K.; Wang, Z.; Li, L.; Tedesco, L.; Li, F.; Jin, C.; Du, J. Wetlands shrinkage, fragmentation and their links to agriculture in the Muleng-Xingkai Plain, China. J. Environ. Manag. 2012, 111, 120–132. [Google Scholar] [CrossRef]
  72. Liu, Y.; Xiao, J.; Ju, W.; Xu, K.; Zhou, Y.; Zhao, Y. Recent trends in vegetation greenness in China significantly altered annual evapotranspiration and water yield. Environ. Res. Lett. 2016, 11, 094010. [Google Scholar] [CrossRef]
  73. Yao, Y.; Wang, X.; Zeng, Z.; Liu, Y.; Peng, S.; Zhu, Z.; Piao, S. The Effect of Afforestation on Soil Moisture Content in Northeastern China. PLoS ONE 2016, 11, e0160776. [Google Scholar] [CrossRef]
  74. Liu, H.; Bu, R.; Liu, J.; Leng, W.; Hu, Y.; Yang, L.; Liu, H. Predicting the wetland distributions under climate warming in the Great Xing’an Mountains, northeastern China. Ecol. Res. 2011, 26, 605–613. [Google Scholar] [CrossRef]
  75. Xu, J.; Morris, P.J.; Liu, J.; Holden, J.J.N.S. Hotspots of peatland-derived potable water use identified by global analysis. Nat. Sustain. 2018, 1, 246–253. [Google Scholar] [CrossRef]
  76. Wang, J.; Sheng, Y.; Tong, T.S.D. Monitoring decadal lake dynamics across the Yangtze Basin downstream of Three Gorges Dam. Remote Sens. Environ. 2014, 152, 251–269. [Google Scholar] [CrossRef]
  77. Zhang, X.; Dong, Z.; Gupta, H.; Wu, G.; Li, D. Impact of the Three Gorges Dam on the Hydrology and Ecology of the Yangtze River. Water 2016, 8, 590. [Google Scholar] [CrossRef]
  78. Guo, H.; Hu, Q.; Zhang, Q.; Feng, S. Effects of the Three Gorges Dam on Yangtze River flow and river interaction with Poyang Lake, China: 2003–2008. J. Hydrol. 2012, 416–417, 19–27. [Google Scholar] [CrossRef]
  79. Xie, Y.-h.; Yue, T.; Xin-sheng, C.; Feng, L.; Zheng-miao, D. The impact of Three Gorges Dam on the downstream eco-hydrological environment and vegetation distribution of East Dongting Lake. Ecohydrology 2015, 8, 738–746. [Google Scholar] [CrossRef]
  80. Rebelo, L.M.; Finlayson, C.M.; Nagabhatla, N. Remote sensing and GIS for wetland inventory, mapping and change analysis. J. Environ. Manag. 2009, 90, 2144–2153. [Google Scholar] [CrossRef]
  81. Xiao, D.; Tian, B.; Tian, K.; Yang, Y. Landscape patterns and their changes in Sichuan Ruoergai Wetland National Nature Reserve. Acta Ecol. Sin. 2010, 30, 27–32. [Google Scholar] [CrossRef]
  82. Liu, Z.; Cheng, L.; Zhou, G.; Chen, X.; Lin, K.; Zhang, W.; Chen, X.; Zhou, P. Global Response of Evapotranspiration Ratio to Climate Conditions and Watershed Characteristics in a Changing Environment. J. Geophys. Res. Atmos. 2020, 125, e2020JD032371. [Google Scholar] [CrossRef]
  83. Lv, X.; Zou, Y.; Wang, Y. Climate Change Impacts and Risks Climate Change Impacts and Risks to Wetlands Study; Beijing Science Press: Beijing, China, 2018; p. 235. [Google Scholar]
  84. Paz, A.; Villanueva, A.; Camano Schettini, E. The Influence of Spatial Vegetation Distribution on Taim Wetland Hydrodynamics; IAHS-AISH Publication: Wallingford, UK, 2005. [Google Scholar]
  85. Li, Y.; Piao, S.; Li, L.Z.X.; Chen, A.; Wang, X.; Ciais, P.; Huang, L.; Lian, X.; Peng, S.; Zeng, Z.; et al. Divergent hydrological response to large-scale afforestation and vegetation greening in China. Sci. Adv. 2018, 4, eaar4182. [Google Scholar] [CrossRef]
  86. Lin, Q.; Yu, S. Losses of natural coastal wetlands by land conversion and ecological degradation in the urbanizing Chinese coast. Sci. Rep. 2018, 8, 15046. [Google Scholar] [CrossRef]
  87. Wong, C.P.; Jiang, B.; Bohn, T.J.; Lee, K.N.; Lettenmaier, D.P.; Ma, D.; Ouyang, Z. Lake and wetland ecosystem services measuring water storage and local climate regulation. Water Resour. Res. 2017, 53, 3197–3223. [Google Scholar] [CrossRef]
  88. Meng, W.; He, M.; Hu, B.; Mo, X.; Li, H.; Liu, B.; Wang, Z. Status of wetlands in China: A review of extent, degradation, issues and recommendations for improvement. Ocean Coast. Manag. 2017, 146, 50–59. [Google Scholar] [CrossRef]
  89. Ban, X.; Wu, Q.; Pan, B.; Du, Y.; Feng, Q. Application of Composite Water Quality Identification Index on the water quality evaluation in spatial and temporal variations: A case study in Honghu Lake, China. Environ. Monit. Assess. 2014, 186, 4237–4247. [Google Scholar] [CrossRef] [PubMed]
  90. Levêque, C.; Oberdorff, T.; PAUGy, D.; Stiassny, M.; Tedesco, P.A.J.F.a.d.a. Global diversity of fish (Pisces) in freshwater. Hydrobiologia 2008, 595, 545–567. [Google Scholar] [CrossRef]
  91. He, F.; Bremerich, V.; Zarfl, C.; Geldmann, J.; Langhans, S.D.; David, J.N.; Darwall, W.; Tockner, K.; Jähnig, S.C.J.D. Freshwater megafauna diversity: Patterns, status and threats. Divers. Distrib. 2018, 24, 1395–1404. [Google Scholar] [CrossRef]
Figure 1. Wetland distributions from high-resolution simulations and remote-sensing products. (a) Wetland distribution simulated using the Precipitation Topographic Wetness Index (PTWI) method by Hu et al. [10]. (b) Regularly flooded wetlands (RFW) map from Tootchi et al. [26]. (c) Permanent wetland distribution produced by compositing 13 remote sensing products of wetland distributions.
Remotesensing 15 04534 g001
Figure 2. Elevation map in the middle and lower reaches of the Yangtze River Basin (MLYRB) (The number corresponds to sub-basin ID).
Remotesensing 15 04534 g002
Figure 3. Overall flowchart of the proposed method for mapping potential wetlands.
Remotesensing 15 04534 g003
Figure 4. Simulated wetland distributions from five machine learning methods. (a) Adaptive Boosting tree (AdaBoost) Algorithm; (b) Random Forest (RF) Algorithm; (c) K-Nearest Neighbor (KNN) Algorithm; (d) Artificial Neural Networks (ANNs) Algorithm; (e) Bayesian classification (NB) Algorithm.
Remotesensing 15 04534 g004
Figure 5. Difference of wetland distributions between existing wetlands and potential wetlands. (a) AdaBoost Algorithm (green dashed lines represent sub-basins where the reduction in wetland area exceeds 10% of the total area in sub-basin); (b) RF Algorithm; (c) KNN Algorithm; (d) ANNs Algorithm; (e) NB Algorithm.
Remotesensing 15 04534 g005
Figure 6. Proportion of wetland losses for sub-basins (The name corresponding to the ID is shown in Figure 2).
Remotesensing 15 04534 g006
Figure 7. Changes in wetland areas under future emission scenarios. (a) Trend of future wetland proportions; (b) wetland distributions difference between 2100s and present under SSP2–4.5 scenario; (c) wetland distributions difference between 2100s and present under SSP5–8.5 scenario; (dg) wetland distributions in 2040s, 2060s, 2080s, 2100s under SSP2–4.5 scenario; (hk) same as (dg) but for SSP5–8.5 scenario. The blue lines represent the Yangtze River.
Remotesensing 15 04534 g007
Figure 8. The importance of different environmental factors in the AdaBoost model. (The abbreviations correspond to the full names in Table 2).
Remotesensing 15 04534 g008
Figure 9. Influence of climate on spatial distribution pattern of wetland areas (The black points denote the results reach 95% confidence intervals by F-test). Subgraphs show histogram of climate sensitivity. The sensitivity of wetland areas to changes in (a) The coldest season temperature, (b) The warmest season temperature, (c) Leaf area index, and (d) Solar radiation. The purple lines represent the Yangtze River.
Remotesensing 15 04534 g009
Table 1. Remote sensing products of wetland distribution maps.
Land Cover ProductionWetlands ClassesResolutionSource (Accessed on 1 April 2022)
GLASS 0.05° Land Cover Products in China (1982–2018)1, 20.05°http://www.geodata.cn/data/datadetails.html?dataguid=250075179225195
WESTDC1.03, 4, 5, 6, 7, 81 kmhttp://westdc.westgis.ac.cn
WESTDC2.03, 4, 5, 6, 7, 81 kmhttp://westdc.westgis.ac.cn
UMD lucc_1 km_China11 kmhttp://www.geodata.cn/data/datadetails.html?dataguid=7997731293180
China 1 km raster land use data (1990–2015)11 kmhttp://www.geodata.cn/data/datadetails.html?dataguid=9121507
MODIS lucc_1 km_China1, 91 kmhttp://www.geodata.cn/data/datadetails.html?dataguid=7997731293180
GLC2000 lucc_1 km_China4, 10, 11, 12, 131 kmhttp://www.geodata.cn/data/datadetails.html?dataguid=7997731293180
IGBPDIS lucc_1 km_China1, 91 kmhttp://www.geodata.cn/data/datadetails.html?dataguid=7997731293180
National land cover data1, 230 mhttps://data.casearth.cn/sdo/detail/5da578aa329b5613607cc96f
Global 30 m land cover V1.0 (2020)1, 230 mhttps://data.casearth.cn/sdo/detail/6123651428a58f70c2a51e49
Spatial extent of marshes and water bodies in China (2015)830 mhttps://data.casearth.cn/sdo/detail/6188d5be819aec0dc5853a4e
Global Lakes and Wetlands Database: Lakes and Wetlands Grid (Level 3)4, 12, 13, 14, 15, 16, 17, 18, 1930″https://www.worldwildlife.org/publications/global-lakes-and-wetlands-database-lakes-and-wetlands-grid-level-3
Global Land Cover by National Mapping Organizations (GLCNMO)1, 215″https://globalmaps.github.io/glcnmo.html
ID of the wetland type: 1—water bodies, 2—wetlands, 3—Channels, 4—lakes, 5—reservoirs, 6—pits, 7—beaches, 8—marshes, 9—Permanent wetlands, 10—Seaside wetlands, 11—meadow, 12—river, 13—swamp, 14—freshwater marsh, 15—floodplain, 16—coastal wetlands, 17—saline wetlands, 18—peatland, 19—intermittent wetlands.
Table 2. Environmental predicting variables for wetland models.
VariablesDescriptionAbbreviationUnit
V1Topographic wetness indexTI-
V2Euclidean distance to water bodiesDWm
V3Leaf area indexLAIm2/m2
V4Mean Annual wind speedWSm/s
V5Mean Annual solar radiationSRW/m2
V6Soil sand content (0–30 cm)SAND1%
V7Soil sand content (30–100 cm)SAND2%
V8Soil clay content (0–30 cm)CLAY1%
V9Soil clay content (30–100 cm)CLAY2%
V10Mean Annual TemperatureMAT°C
V11Mean Diurnal Range (Mean of monthly (max–min))MDR°C
V12IsothermalityISO%
V13Temperature Annual RangeTAR°C
V14Mean Temperature of Warmest QuarterTWQ°C
V15Mean Temperature of Coldest QuarterTCQ°C
V16Annual PrecipitationAPmm
V17Precipitation Seasonality (Coefficient of Variation)PS-
V18Precipitation of Warmest QuarterPWQmm
V19Precipitation of Coldest QuarterPCQmm
Table 3. Simulation results and accuracy of different models.
Algorithm NameFive-Fold Cross Validation AccuracyIndependent Verification AccuracyWetland ProportionWetland Losses Relative to Area of the Study RegionWetland Losses Relative to Area of the Simulated Potential Wetlands
Adaptive Boosting tree97.5%94%14.9%6.3%42.3%
Random Forest97.1%95%13.2%4.6%35.0%
K-Nearest Neighbor97.5%80%15.0%6.4%42.8%
Artificial Neural Networks97.4%81%16.1%7.5%46.6%
Bayesian Classification89.0%93%28.6%20.1%69.9%
Table 4. Proportion of wetland losses more than 5% in sub-watersheds.
NameProportion of Wetland Losses
Dongting Lake Area22.5%
Lower Danjiangkou15.3%
Poyang Lake Area10.1%
Yichang to Wuhan Left Bank25.4%
Wuhan to Hukou Left Bank5.0%
Chenglingji to Hukou Left Bank10.0%
Chao Lake Water System8.5%
Qingyi River and Shuiyang River6.8%
The Huxi Region10.1%
Wuyang Region13.2%
Hangjia Lake Region12.0%
Table 5. Statistical table of the grids that have passed the test of significance.
Variable NameThe Number of Grids That Passes the Significance Test (95%)The Proportion That Passes the Significance Test
TCQ622482.7%
TWQ565772.3%
LAI816496.5%
SR710092.3%
Disclaimer/Publisher’s Note: The statements, opinions and data contained in all publications are solely those of the individual author(s) and contributor(s) and not of MDPI and/or the editor(s). MDPI and/or the editor(s) disclaim responsibility for any injury to people or property resulting from any ideas, methods, instructions or products referred to in the content.

