
Integrated Assessments of Land Degradation in the Three-Rivers Headwater Region of China from 2000 to 2020


Abstract
:
1. Introduction
2. Materials and Methods
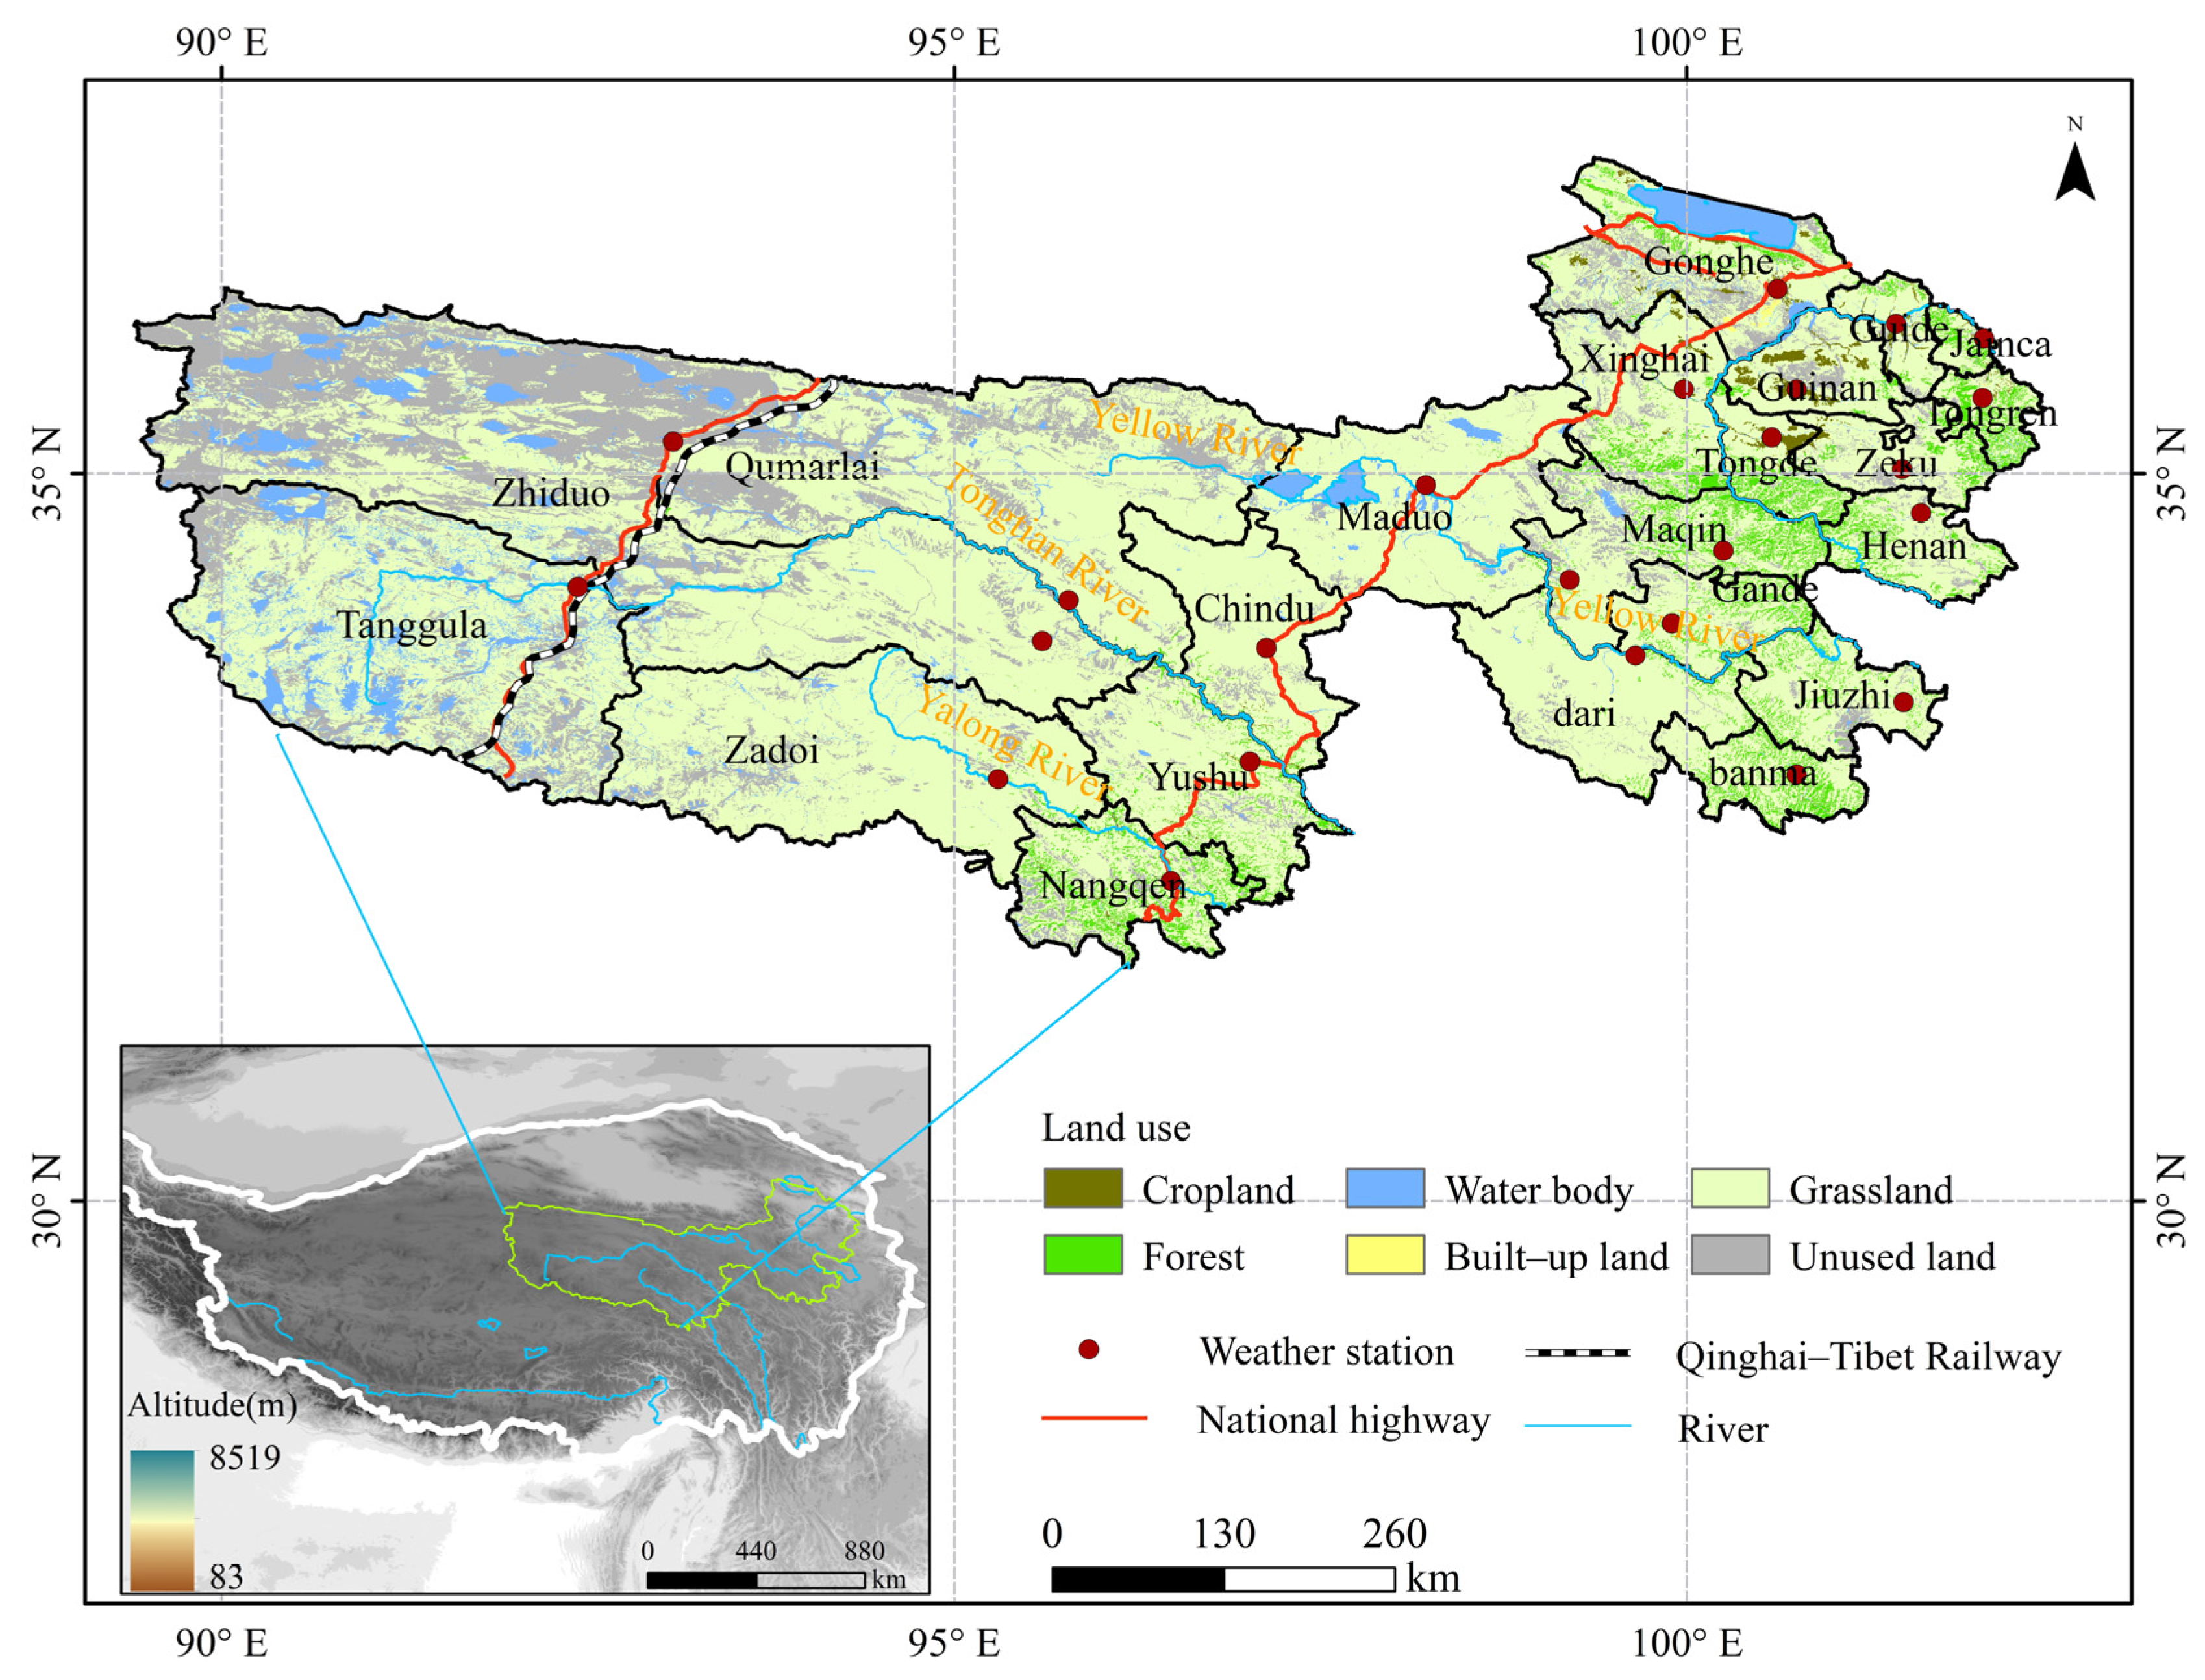
2.1. Study Area
2.2. Data
2.3. Methods
2.3.1. Land Degradation Intensity Classification and Overlay Analysis of Degradation Pathways
Land Degradation Intensity Classification
Overlay Analysis of Degradation Pathways
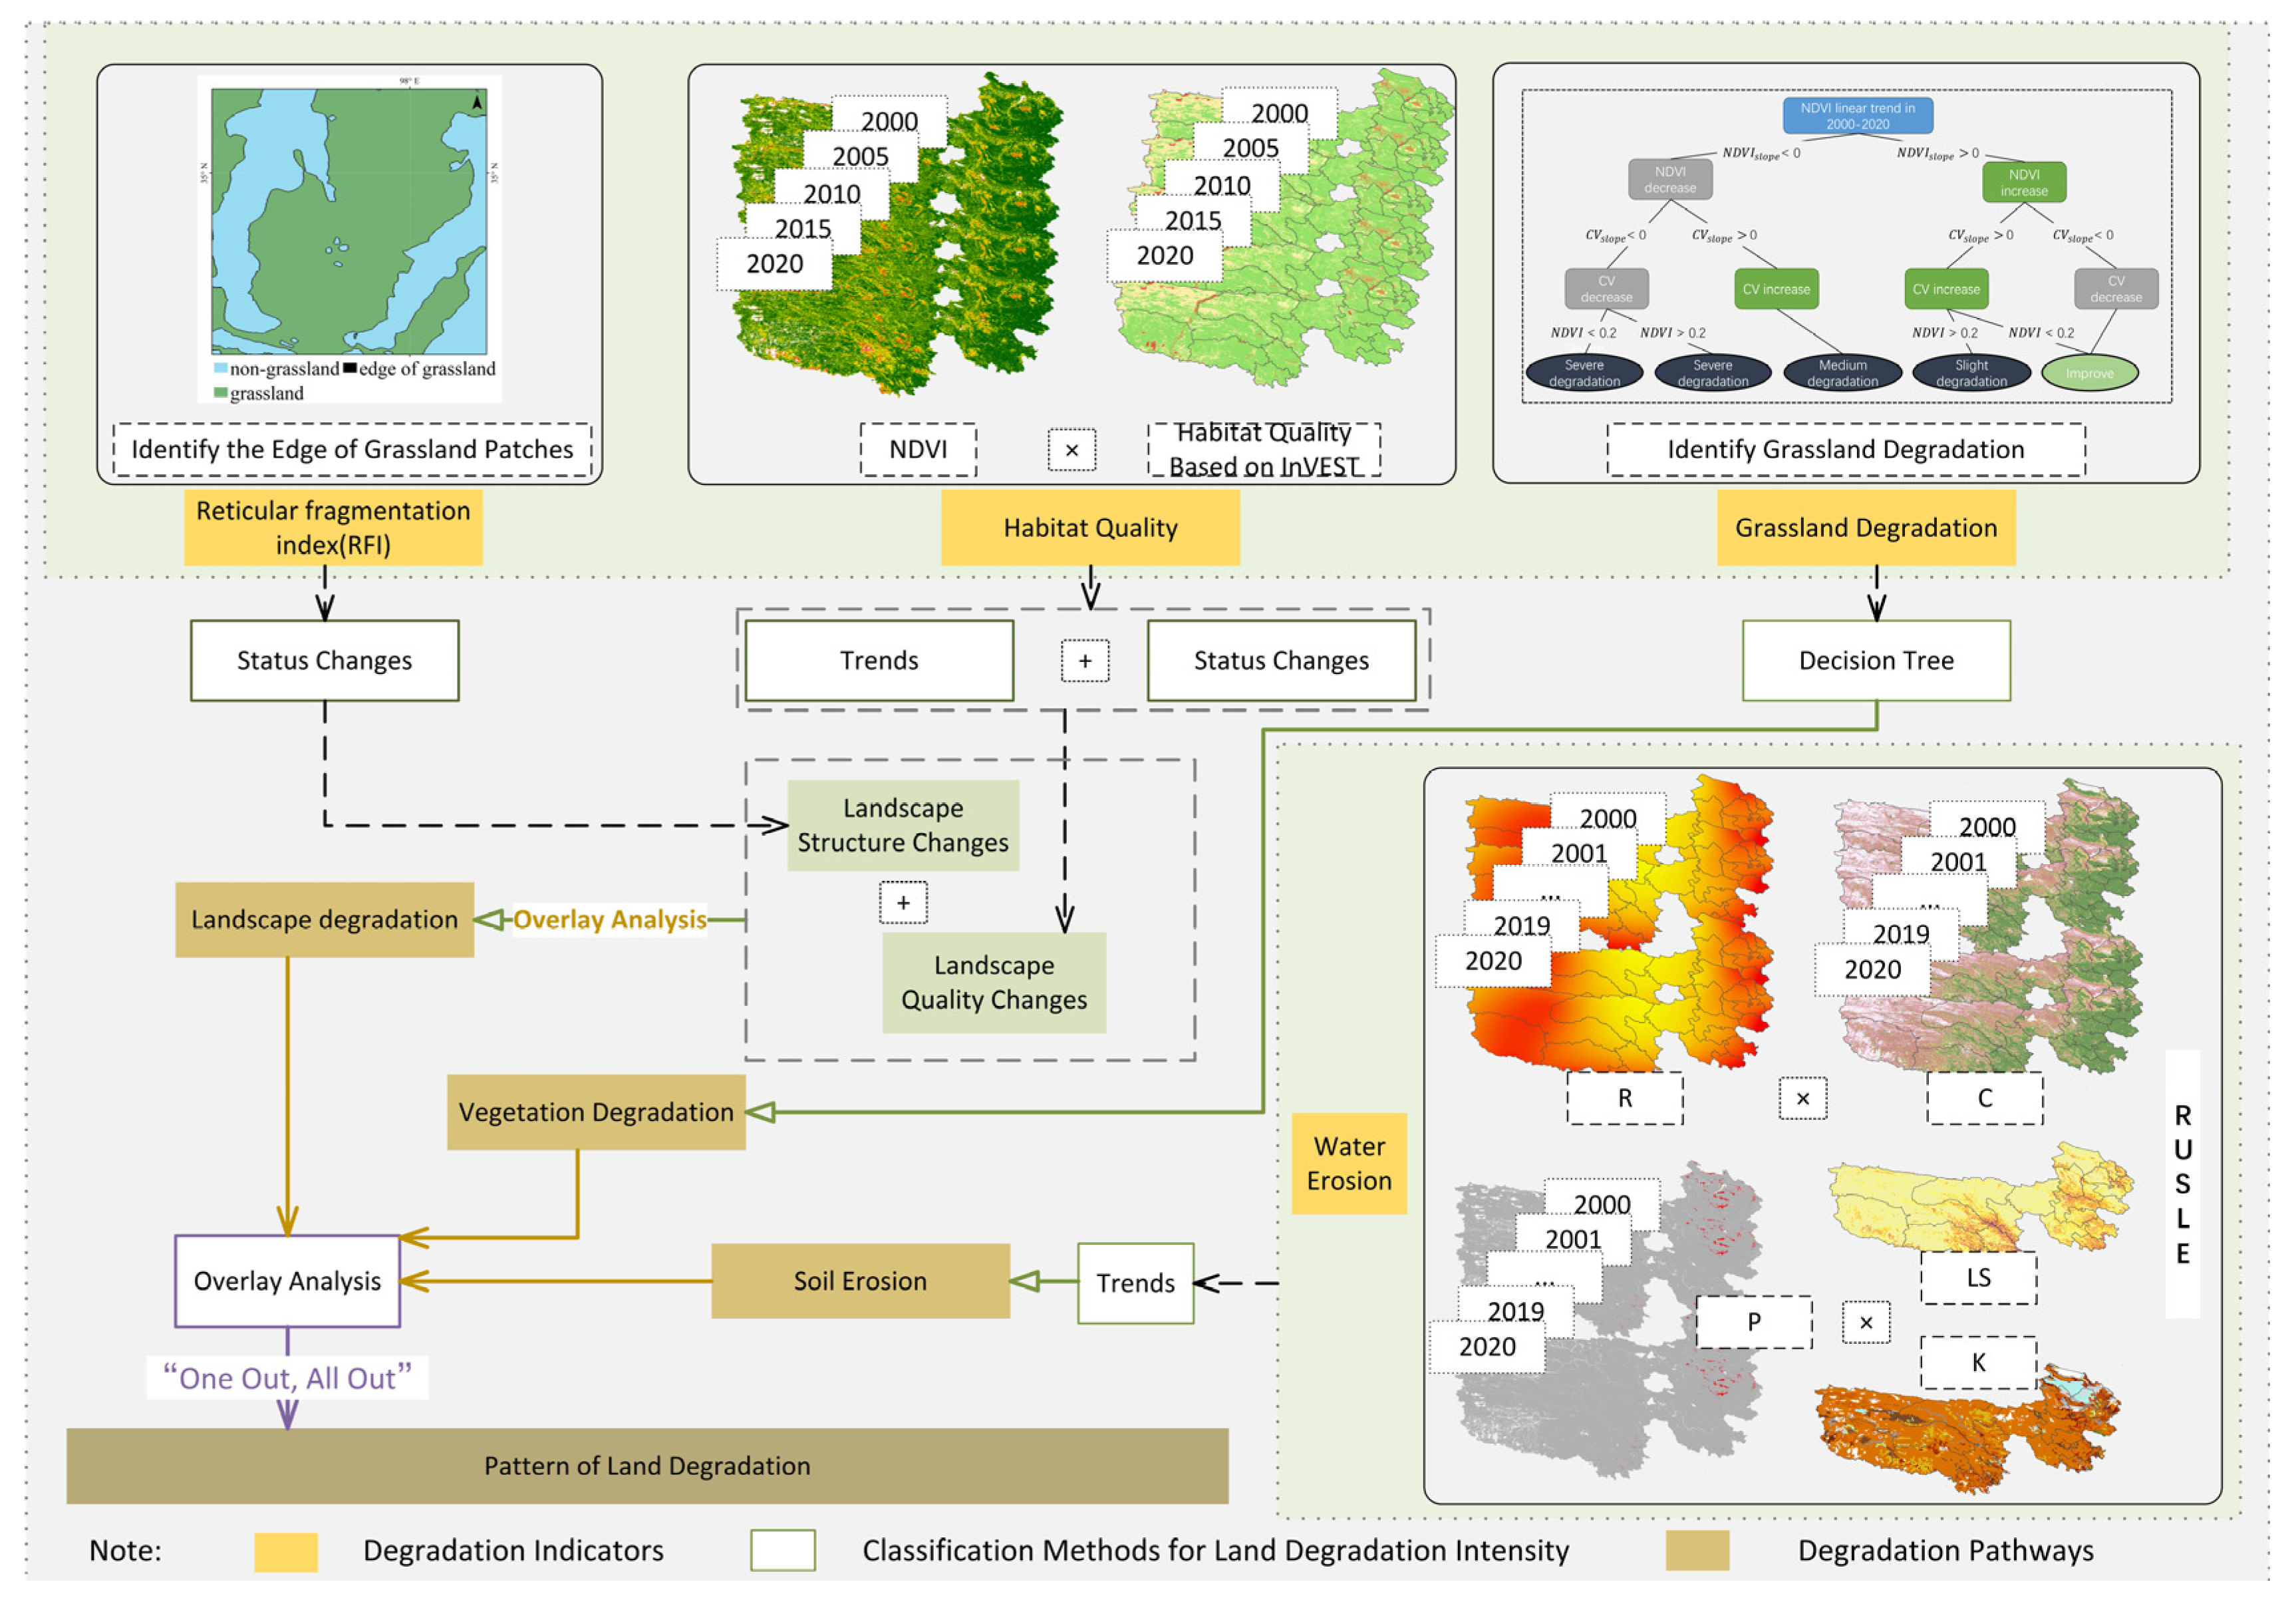
2.3.2. Landscape Structure and Quality Degradation
Fragmentation Index
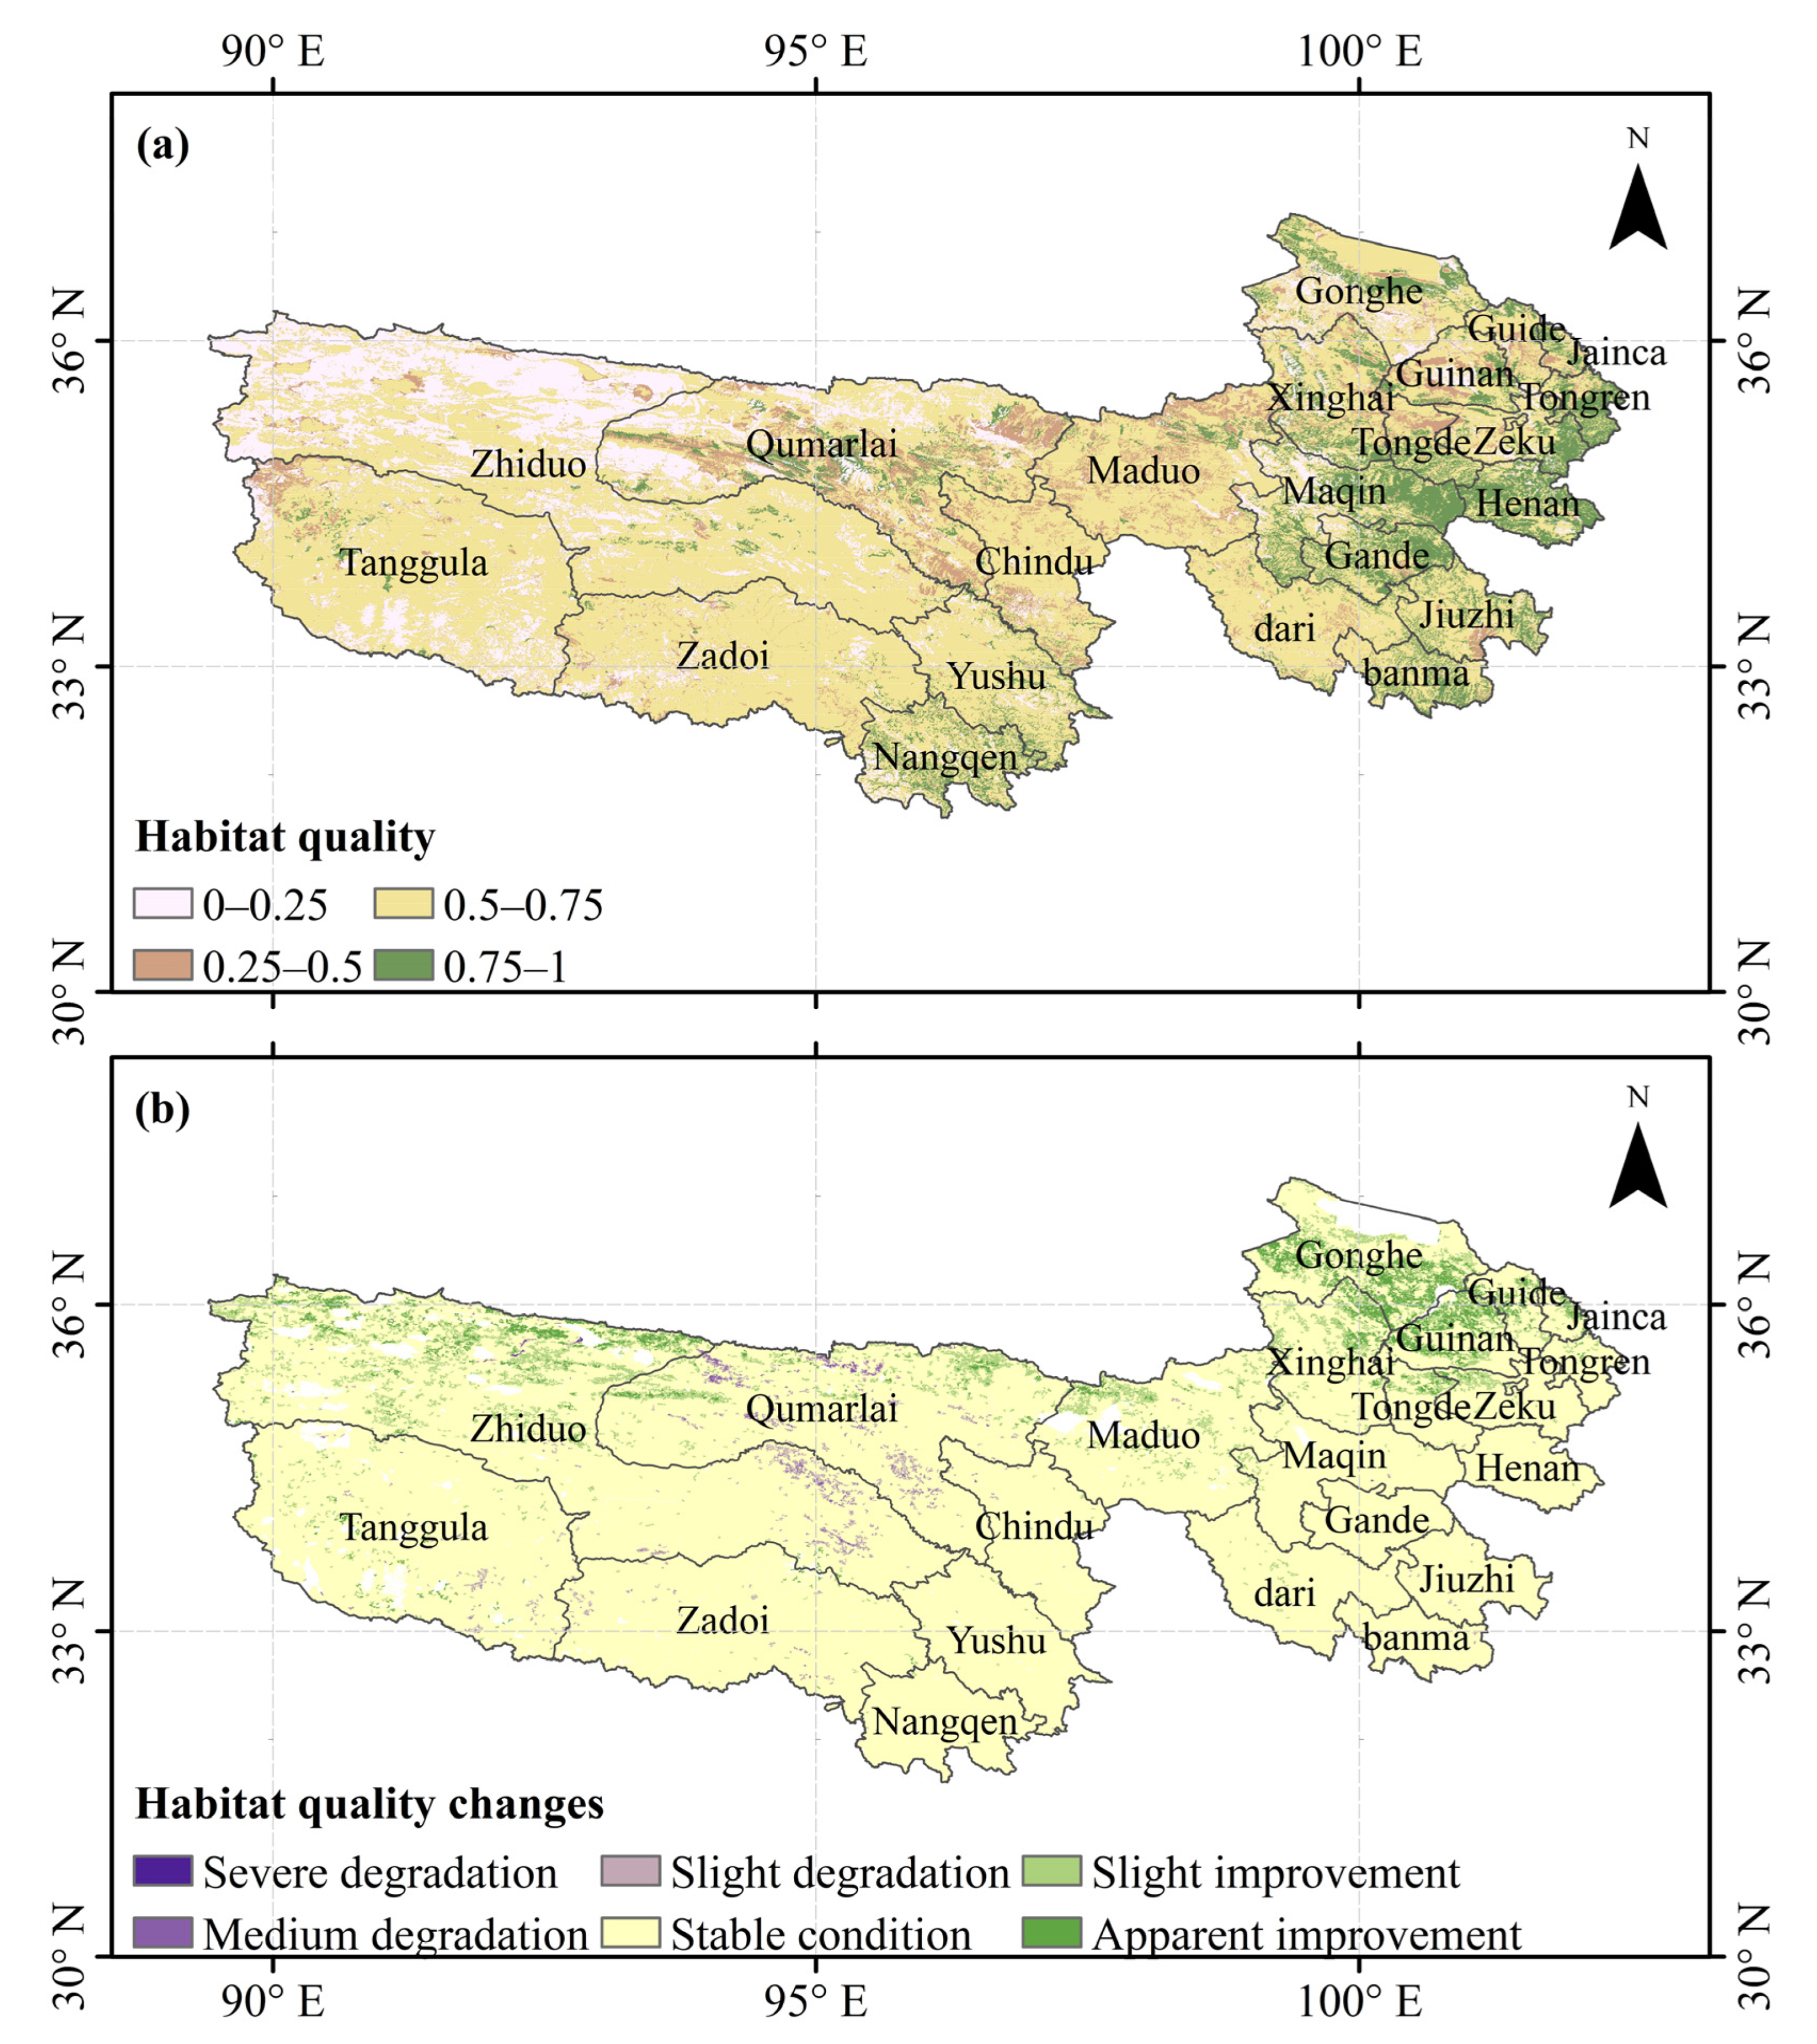
Habitat Quality
2.3.3. Grassland Degradation
2.3.4. Soil Water Erosion
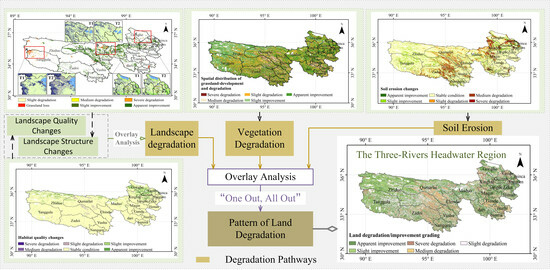
2.3.5. Total Research Approach
3. Results
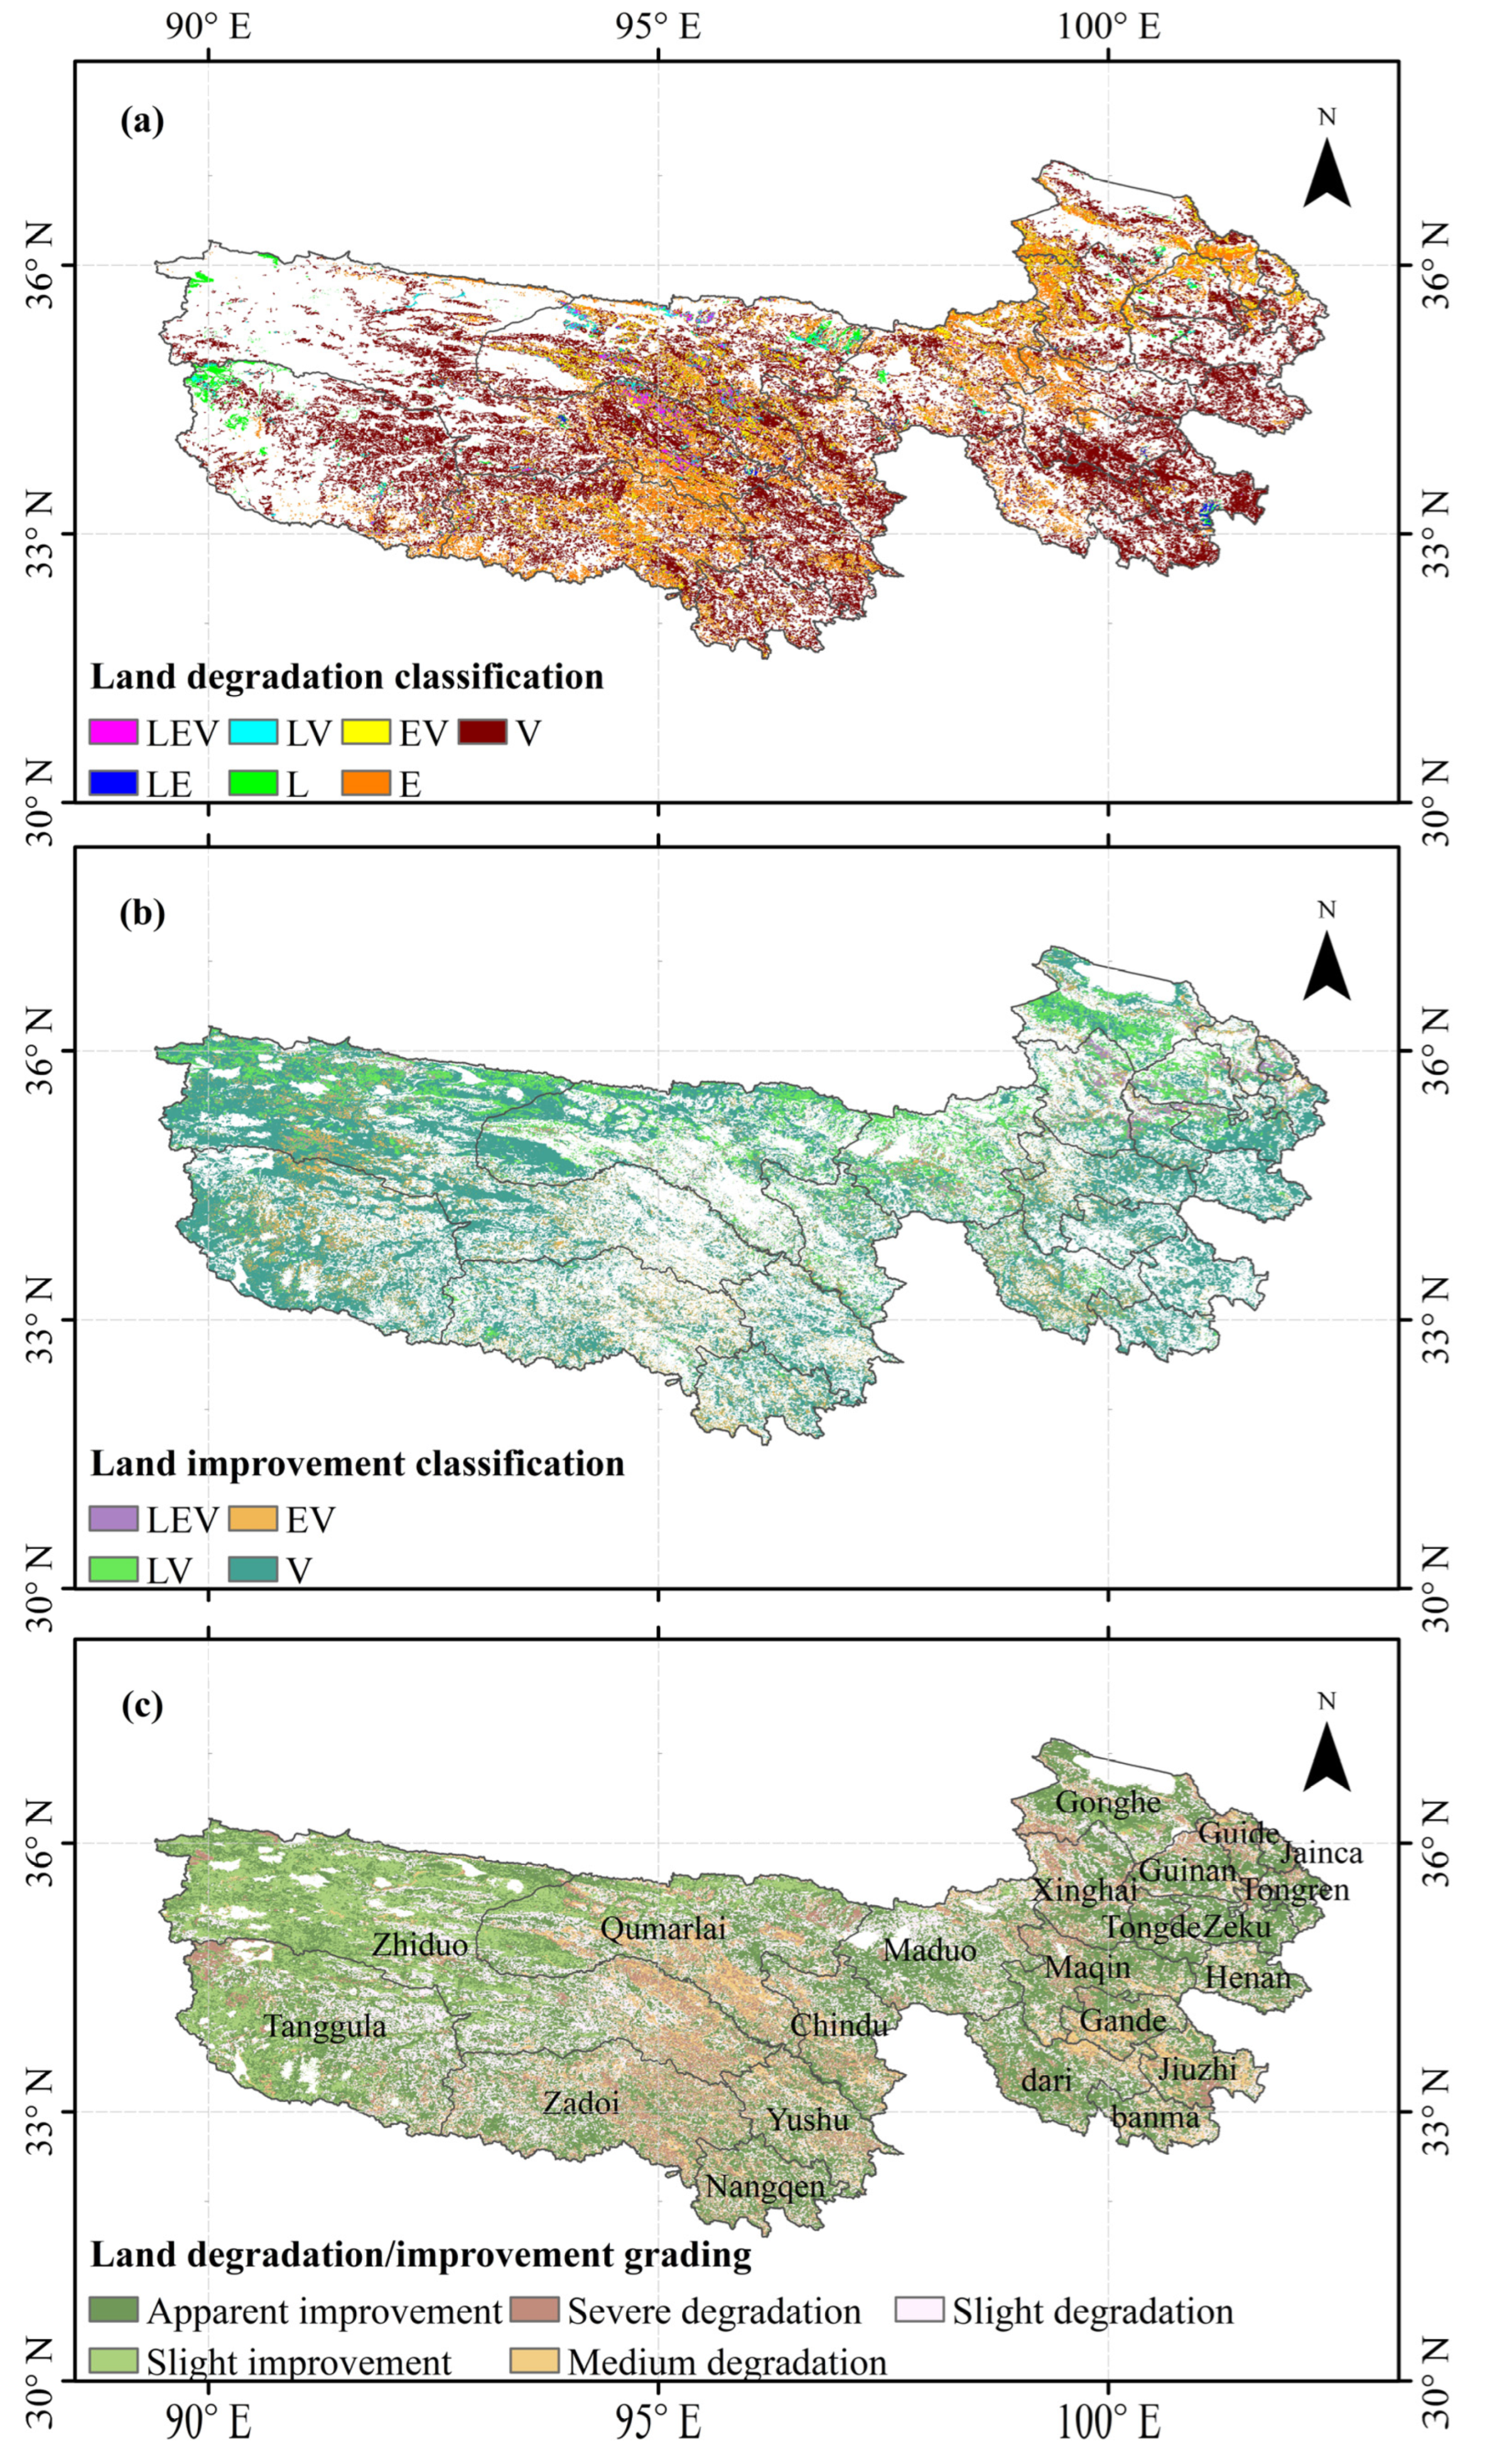
3.1. Superimposition of Three Degradation Pathways
3.2. Different Pathways of Land Degradation
3.2.1. Landscape Structure and Quality Degradation
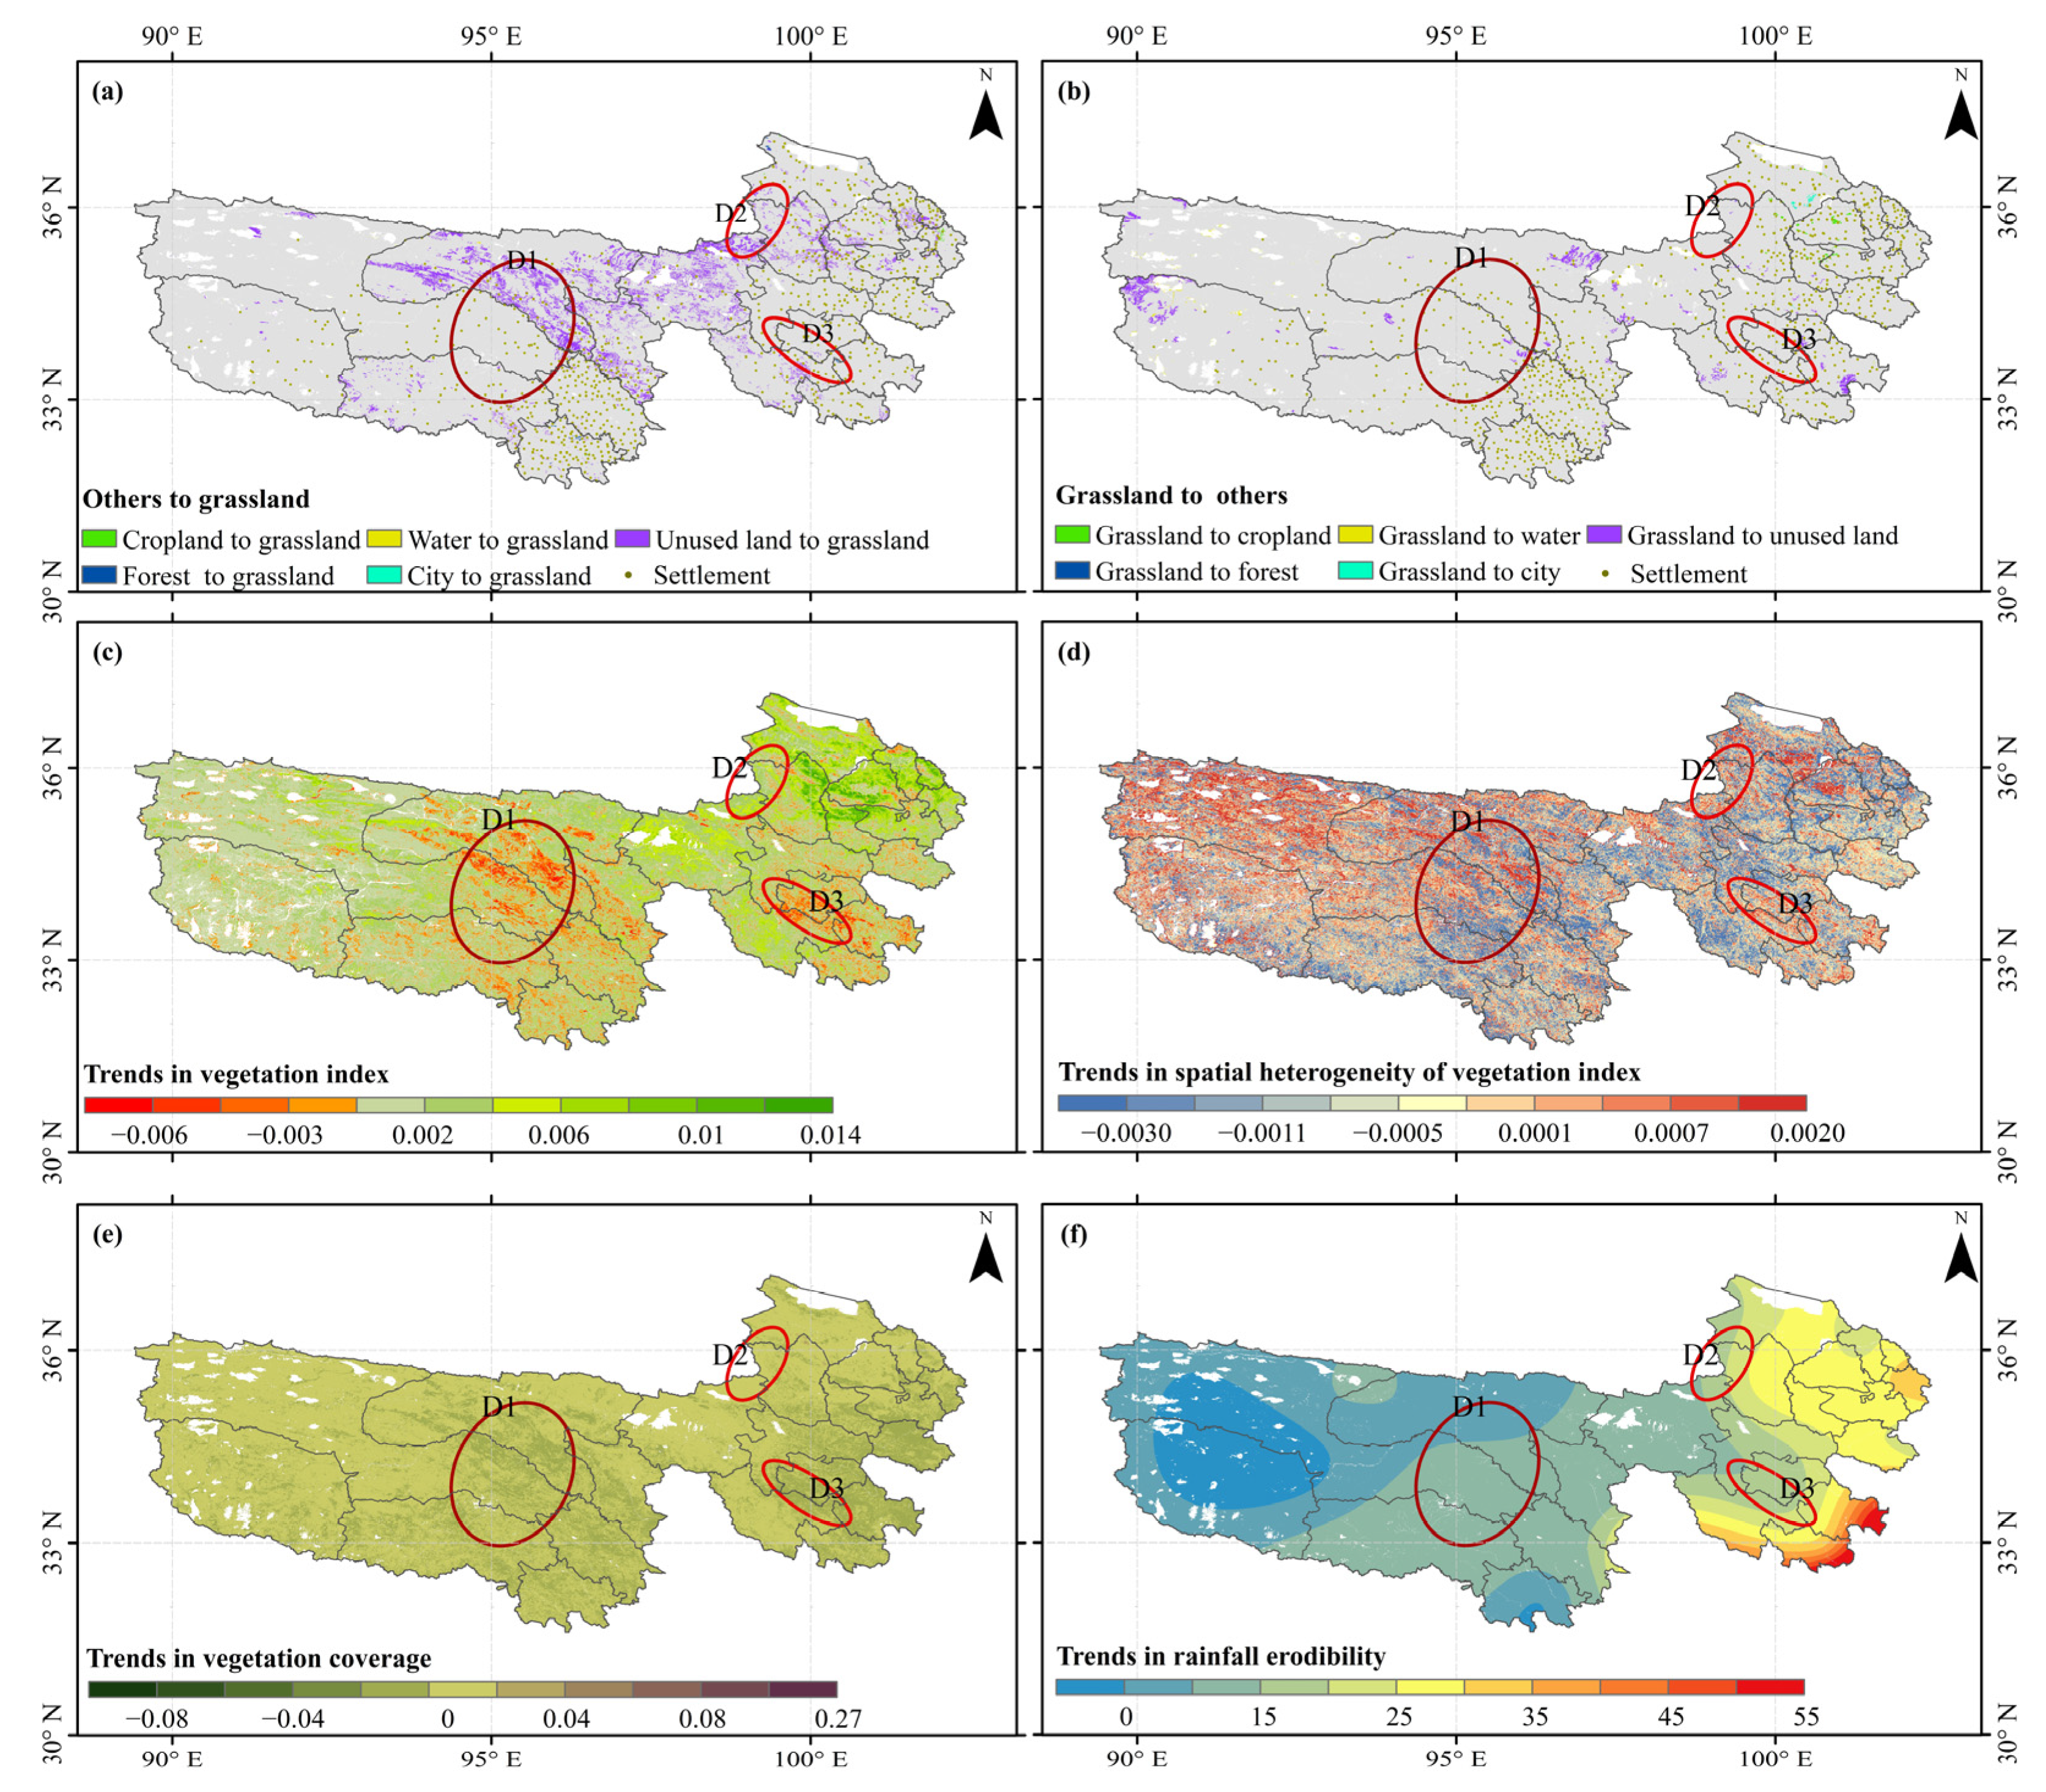
3.2.2. Vegetation Degradation
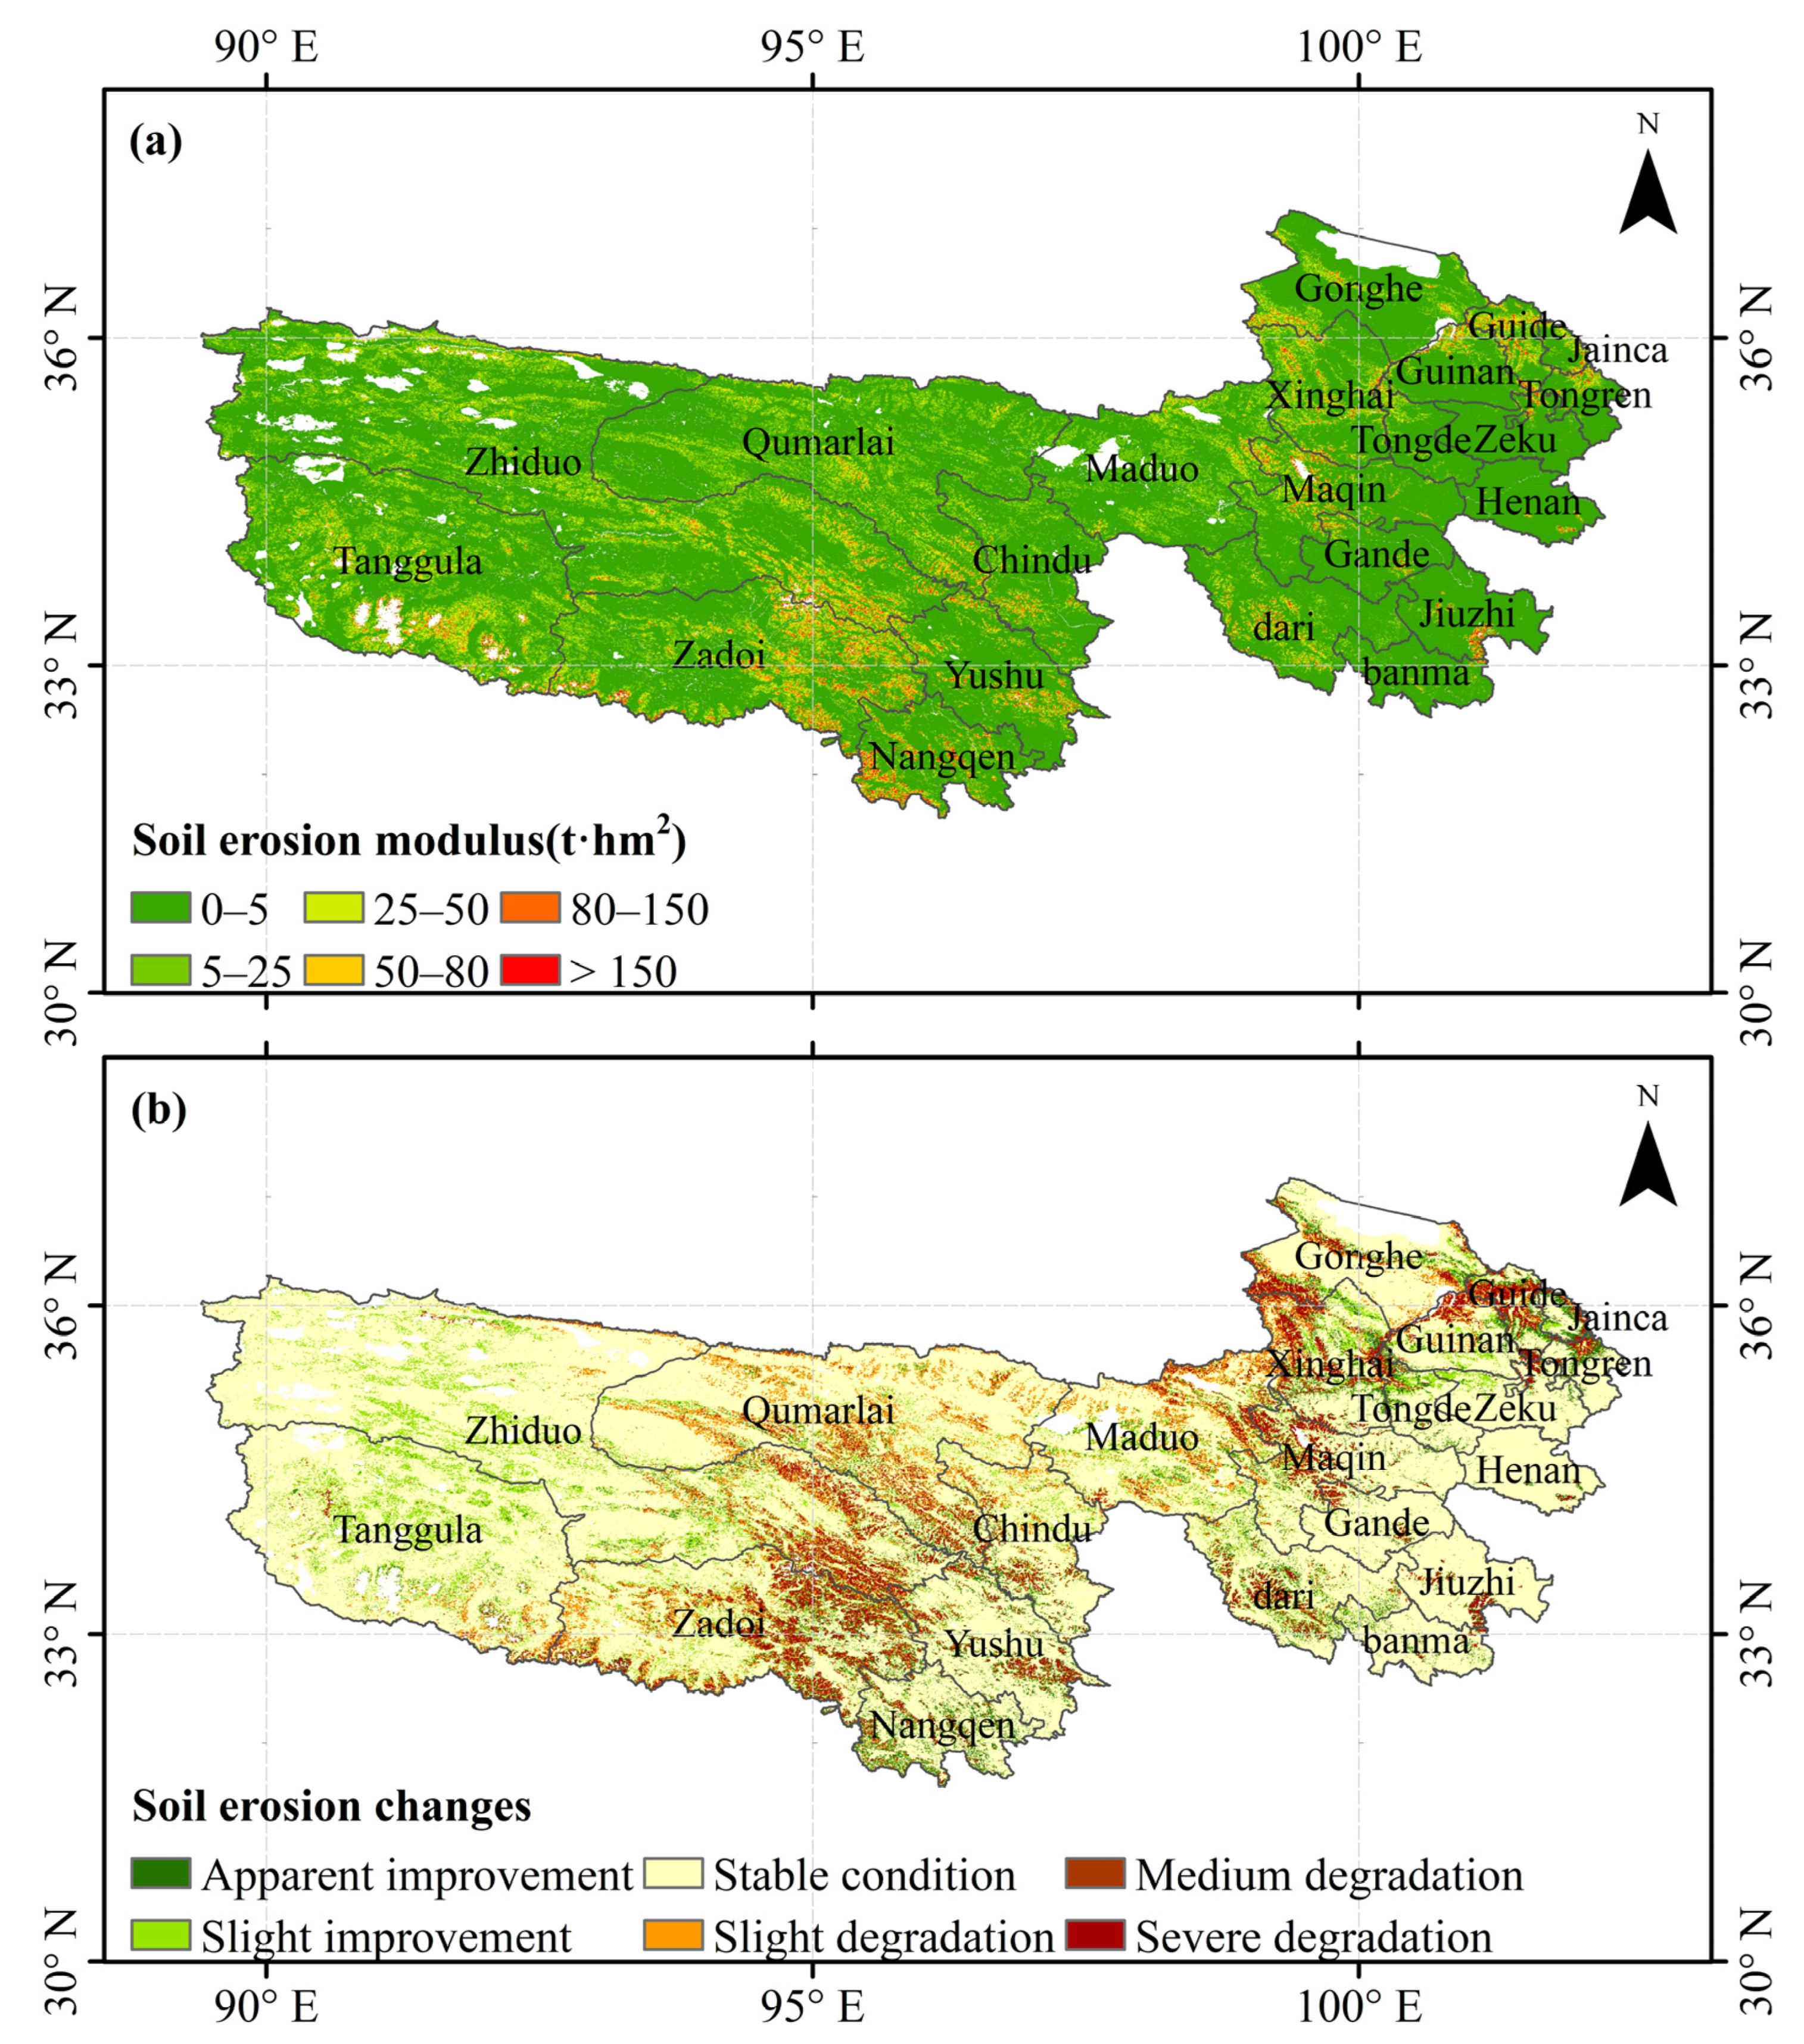
3.2.3. Soil Erosion
4. Discussion
4.1. Comparison of Land Degradation Assessment Results with Previous Studies
4.2. Driving Forces of Land Degradation
4.3. Limitations and Future Work
5. Conclusions
- (1)
- The TRHR exhibits the superimposition of different land degradation pathways. Approximately 5.64% of the regions experience the simultaneous presence of two or more land degradation pathways. However, the superposition of all three degradation paths is observed in only 0.56% of the areas. Notably, the most frequent superposition is between soil erosion and grassland degradation, which accounts for 4.1% of the total area. These findings emphasize the complex nature of land degradation in the region and highlight the need for holistic management approaches to address the multiple drivers and impacts of degradation;
- (2)
- Land degradation in the TRHR is primarily concentrated in the meadow areas. From the perspective of landscape degradation, approximately 2.39% of the study areas exhibit signs of degradation. Based on the classification framework of vegetation degradation, 22.26% of the study areas experienced slight degradation, while 7.21% and 5.63% showed medium and severe degradation, respectively. The soil erosion modulus increased at an average annual rate of 0.03 t/hm2/a over the 20-year period, with 5.99%, 3.51%, and 3.86% of the total area experiencing slight, medium, and severe soil erosion intensification, respectively. These areas are mainly concentrated in the central and northeastern parts of the study area. Implementing robust ecological protection projects in future work is crucial to preventing further land degradation in the TRHR;
- (3)
- During the period from 2000 to 2020, the most significant trend observed in the TRHR was land improvement, accounting for 55.34% of the entire region. These land improvement areas were primarily distributed in the western and eastern parts of the region. The regrowth of grassland in the western areas and the improvement and homogenization of grassland productivity in the eastern areas played crucial roles in promoting land improvement.
Author Contributions
Funding
Data Availability Statement
Conflicts of Interest
References
- Prăvălie, R. Exploring the multiple land degradation pathways across the planet. Earth-Sci. Rev. 2021, 220, 103689. [Google Scholar] [CrossRef]
- Barbier, E.B.; Hochard, J.P. Land degradation and poverty. Nat. Sustain. 2018, 1, 623–631. [Google Scholar] [CrossRef]
- Gibbs, H.; Salmon, J.M. Mapping the world’s degraded lands. Appl. Geogr. 2015, 57, 12–21. [Google Scholar] [CrossRef]
- Schillaci, C.; Jones, A.; Vieira, D.; Munafò, M.; Montanarella, L. Evaluation of the United Nations Sustainable Development Goal 15.3.1 indicator of land degradation in the European Union. Land Degrad. Dev. 2023, 34, 250–268. [Google Scholar] [CrossRef]
- Jiang, L.; Bao, A.; Jiapaer, G.; Liu, R.; Yuan, Y.; Yu, T. Monitoring land degradation and assessing its drivers to support sustainable development goal 15.3 in Central Asia. Sci. Total Environ. 2022, 807, 150868. [Google Scholar] [CrossRef]
- Yao, T.; Xue, Y.; Chen, D.; Chen, F.; Thompson, L.; Cui, P.; Koike, T.; Lau, W.K.M.; Lettenmaier, D.; Mosbrugger, V.; et al. Recent Third Pole’s Rapid Warming Accompanies Cryospheric Melt and Water Cycle Intensification and Interactions between Monsoon and Environment: Multidisciplinary Approach with Observations, Modeling, and Analysis. Bull. Am. Meteorol. Soc. 2019, 100, 423–444. [Google Scholar] [CrossRef]
- Li, R.; Zhang, M.; Konstantinov, P.; Pei, W.; Tregubov, O.; Li, G. Permafrost degradation induced thaw settlement susceptibility research and potential risk analysis in the Qinghai-Tibet Plateau. Catena 2022, 214, 106239. [Google Scholar] [CrossRef]
- Wang, X.; Li, X.; Cai, D.; Lou, J.; Li, D.; Liu, F. Salinification and salt transports under aeolian processes in potential desertification regions of China. Sci. Total Environ. 2021, 782, 146832. [Google Scholar] [CrossRef]
- Yao, T.; Bolch, T.; Chen, D.; Gao, J.; Immerzeel, W.; Piao, S.; Su, F.; Thompson, L.; Wada, Y.; Wang, L.; et al. The imbalance of the Asian water tower. Nat. Rev. Earth Environ. 2022, 3, 618–632. [Google Scholar] [CrossRef]
- Li, L.; Zhang, Y.; Wu, J.; Li, S.; Zhang, B.; Zu, J.; Zhang, H.; Ding, M.; Paudel, B. Increasing sensitivity of alpine grasslands to climate variability along an elevational gradient on the Qinghai-Tibet Plateau. Sci. Total Environ. 2019, 678, 21–29. [Google Scholar] [CrossRef]
- Teng, H.; Liang, Z.; Chen, S.; Liu, Y.; Rossel, R.A.V.; Chappell, A.; Yu, W.; Shi, Z. Current and future assessments of soil erosion by water on the Tibetan Plateau based on RUSLE and CMIP5 climate models. Sci. Total Environ. 2018, 635, 673–686. [Google Scholar] [CrossRef] [PubMed]
- Teng, Y.; Zhan, J.; Liu, W.; Sun, Y.; Agyemang, F.B.; Liang, L.; Li, Z. Spatiotemporal dynamics and drivers of wind erosion on the Qinghai-Tibet Plateau, China. Ecol. Indic. 2021, 123, 107340. [Google Scholar] [CrossRef]
- Zhang, G.; Nan, Z.; Hu, N.; Yin, Z.; Zhao, L.; Cheng, G.; Mu, C. Qinghai-Tibet Plateau Permafrost at Risk in the Late 21st Century. Earth’s Future 2022, 10, e2022EF002652. [Google Scholar] [CrossRef]
- Liu, J.; Xu, X.; Shao, Q. Grassland degradation in the “three-river headwaters” region, Qinghai province. J. Geogr. Sci. 2008, 18, 259–273. [Google Scholar] [CrossRef]
- Yang, L.; Zhao, G.; Mu, X.; Lan, Z.; Jiao, J.; An, S.; Wu, Y.; Miping, P. Integrated assessments of land degradation on the Qinghai-Tibet plateau. Ecol. Indic. 2023, 147, 109945. [Google Scholar] [CrossRef]
- Sun, Y.; Liu, S.; Shi, F.; An, Y.; Li, M.; Liu, Y. Spatio-temporal variations and coupling of human activity intensity and ecosystem services based on the four-quadrant model on the Qinghai-Tibet Plateau. Sci. Total Environ. 2020, 743, 140721. [Google Scholar]
- Kumar, B.P.; Babu, K.R.; Anusha, B.; Rajasekhar, M. Geo-environmental monitoring and assessment of land degradation and desertification in the semi-arid regions using Landsat 8 OLI/TIRS, LST, and NDVI approach. Environ. Chall. 2022, 8, 100578. [Google Scholar] [CrossRef]
- Sun, X.; Li, S.; Zhai, X.; Wei, X.; Yan, C. Ecosystem changes revealed by land cover in the three-river headwaters region of Qinghai, China (1990–2015). Res. Cold Arid Reg. 2023, 15, 85–91. [Google Scholar] [CrossRef]
- Mao, D.; Wang, Z.; Wu, B.; Zeng, Y.; Luo, L.; Zhang, B. Land degradation and restoration in the arid and semiarid zones of China: Quantified evidence and implications from satellites. Land Degrad. Dev. 2018, 29, 3841–3851. [Google Scholar] [CrossRef]
- Zhang, S.; Wu, T.; Guo, L.; Zou, H.; Shi, Y. Integrating ecosystem services supply and demand on the Qinghai-Tibetan Plateau using scarcity value assessment. Ecol. Indic. 2023, 147, 109969. [Google Scholar] [CrossRef]
- Li, C.; de Jong, R.; Schmid, B.; Wulf, H.; Schaepman, M.E. Changes in grassland cover and in its spatial heterogeneity indicate degradation on the Qinghai-Tibetan Plateau. Ecol. Indic. 2020, 119, 106641. [Google Scholar] [CrossRef]
- Li, X.L.; Perry, G.; Brierley, G.; Sun, H.Q.; Li, C.H.; Lu, G.X. Quantitative assessment of degradation classifications for degraded alpine meadows (heitutan), Sanjiangyuan, western China. Land Degrad. Dev. 2014, 25, 417–427. [Google Scholar] [CrossRef]
- Giuliani, G.; Mazzetti, P.; Santoro, M.; Nativi, S.; Van Bemmelen, J.; Colangeli, G.; Lehmann, A. Knowledge generation using satellite earth observations to support sustainable development goals (SDG): A use case on Land degradation. Int. J. Appl. Earth Obs. Geoinf. 2020, 88, 102068. [Google Scholar] [CrossRef]
- Assennato, F.; Di Leginio, M.; d’Antona, M.; Marinosci, I.; Congedo, L.; Riitano, N.; Luise, A.; Munafò, M. Land degradation assessment for sustainable soil management. Ital. J. Agron. 2020, 15, 299–305. [Google Scholar] [CrossRef]
- Zheng, L.; Wang, Y.; Li, J. Quantifying the spatial impact of landscape fragmentation on habitat quality: A multi-temporal dimensional comparison between the Yangtze River Economic Belt and Yellow River Basin of China. Land Use Policy 2023, 125, 106463. [Google Scholar] [CrossRef]
- Xoxo, S.; Mantel, S.; De Vos, A.; Mahlaba, B.; Le Maitre, D.; Tanner, J. Towards SDG 15.3: The biome context as the appropriate degradation monitoring dimension. Environ. Sci. Policy 2022, 136, 400–412. [Google Scholar] [CrossRef]
- Easdale, M.H.; Fariña, C.; Hara, S.; León, N.P.; Umaña, F.; Tittonell, P.; Bruzzone, O. Trend-cycles of vegetation dynamics as a tool for land degradation assessment and monitoring. Ecol. Indic. 2019, 107, 105545. [Google Scholar] [CrossRef]
- Morales, N.S.; Zuleta, G.A. Comparison of different land degradation indicators: Do the world regions really matter? Land Degrad. Dev. 2020, 31, 721–733. [Google Scholar] [CrossRef]
- Tsymbarovich, P.; Kust, G.; Kumani, M.; Golosov, V.; Andreeva, O. Soil erosion: An important indicator for the assessment of land degradation neutrality in Russia. Int. Soil Water Conserv. Res. 2020, 8, 418–429. [Google Scholar] [CrossRef]
- Zhao, L.; Yu, W.; Meng, P.; Zhang, J.; Zhang, J. InVEST model analysis of the impacts of land use change on landscape pattern and habitat quality in the Xiaolangdi Reservoir area of the Yellow River basin, China. Land Degrad. Dev. 2022, 33, 2870–2884. [Google Scholar] [CrossRef]
- Maurya, S.; Srivastava, P.K.; Gupta, M.; Islam, T.; Han, D. Integrating soil hydraulic parameter and microwave precipitation with morphometric analysis for watershed prioritization. Water Resour. Manag. 2016, 30, 5385–5405. [Google Scholar] [CrossRef]
- Li, W.; Wang, D.; Li, Y.; Zhu, Y.; Wang, J.; Ma, J. A multi-faceted, location-specific assessment of land degradation threats to peri-urban agriculture at a traditional grain base in northeastern China. J. Environ. Manag. 2020, 271, 111000. [Google Scholar] [CrossRef] [PubMed]
- Zhang, H.; Jiang, C.; Wang, Y.; Wang, J.; Li, C.; Yang, Z.; Gong, Q.; Yang, C. Improving the integrated efficacy of ecosystem restoration efforts by linking land degradation neutrality to ecosystem service enhancement from a spatial association perspective. Ecol. Eng. 2022, 181, 106693. [Google Scholar] [CrossRef]
- Zhang, L.; Zhang, H.; Xu, E. Information entropy and elasticity analysis of the land use structure change influencing eco-environmental quality in Qinghai-Tibet Plateau from 1990 to 2015. Environ. Sci. Pollut. Res. 2022, 29, 18348–18364. [Google Scholar] [CrossRef]
- Zhao, D.; Zhu, Y.; Wu, S.; Lu, Q. Simulated response of soil organic carbon density to climate change in the Northern Tibet permafrost region. Geoderma 2022, 405, 115455. [Google Scholar] [CrossRef]
- Liu, S.; Shao, Q.; Ning, J.; Niu, L.; Zhang, X.; Liu, G.; Huang, H. Remote-sensing-based assessment of the ecological restoration degree and restoration potential of ecosystems in the upper yellow river over the past 20 years. Remote Sens. 2022, 14, 3550. [Google Scholar] [CrossRef]
- Rivas, C.A.; Guerrero-Casado, J.; Navarro-Cerillo, R.M. Deforestation and fragmentation trends of seasonal dry tropical forest in Ecuador: Impact on conservation. For. Ecosyst. 2021, 8, 46. [Google Scholar] [CrossRef]
- Fischer, R.; Taubert, F.; Müller, M.S.; Groeneveld, J.; Lehmann, S.; Wiegand, T.; Huth, A. Accelerated forest fragmentation leads to critical increase in tropical forest edge area. Sci. Adv. 2021, 7, eabg7012. [Google Scholar] [CrossRef]
- Zhu, C.; Zhang, X.; Zhou, M.; He, S.; Gan, M.; Yang, L.; Wang, K. Impacts of urbanization and landscape pattern on habitat quality using OLS and GWR models in Hangzhou, China. Ecol. Indic. 2020, 117, 106654. [Google Scholar] [CrossRef]
- Huang, Z.; Bai, Y.; Alatalo, J.M.; Yang, Z. Mapping biodiversity conservation priorities for protected areas: A case study in Xishuangbanna Tropical Area, China. Biol. Conserv. 2020, 249, 108741. [Google Scholar] [CrossRef]
- Terrado, M.; Sabater, S.; Chaplin-Kramer, B.; Mandle, L.; Ziv, G.; Acuna, V. Model development for the assessment of terrestrial and aquatic habitat quality in conservation planning. Sci. Total Environ. 2016, 540, 63–70. [Google Scholar] [CrossRef] [PubMed]
- Polasky, S.; Nelson, E.; Pennington, D.; Johnson, K.A. The Impact of Land-Use Change on Ecosystem Services, Biodiversity and Returns to Landowners: A Case Study in the State of Minnesota. Environ. Resour. Econ. 2011, 48, 219–242. [Google Scholar] [CrossRef]
- Rimal, B.; Sharma, R.; Kunwar, R.; Keshtkar, H.; Stork, N.E.; Rijal, S.; Rahman, S.A.; Baral, H. Effects of land use and land cover change on ecosystem services in the Koshi River Basin, Eastern Nepal. Ecosyst. Serv. 2019, 38, 100963. [Google Scholar] [CrossRef]
- Hou, Y.; Zhao, W.; Liu, Y.; Yang, S.; Hu, X.; Cherubini, F. Relationships of multiple landscape services and their influencing factors on the Qinghai-Tibet Plateau. Landsc. Ecol. 2021, 36, 1987–2005. [Google Scholar] [CrossRef]
- Williams, J.R. The erosion-productivity impact calculator (EPIC) model: A case history. Philos. Trans. R. Soc. London Ser. B Biol. Sci. 1990, 329, 421–428. [Google Scholar]
- Wu, D.; Peng, R.; Huang, L.; Cao, W.; Huhe, T. Spatio-Temporal Analysis and Driving Factors of Soil Water Erosion in the Three-River Headwaters Region, China. Water 2022, 14, 4127. [Google Scholar] [CrossRef]
- Kang, J.; Zhang, Y.; Biswas, A. Land degradation and development processes and their response to climate change and human activity in China from 1982 to 2015. Remote Sens. 2021, 13, 3516. [Google Scholar] [CrossRef]
- Zhang, C.; Li, Q.; Shen, Y.; Zhou, N.; Wang, X.; Li, J.; Jia, W. Monitoring of aeolian desertification on the Qinghai-Tibet Plateau from the 1970s to 2015 using Landsat images. Sci. Total Environ. 2018, 619, 1648–1659. [Google Scholar] [CrossRef]
- Bardgett, R.D.; Bullock, J.M.; Lavorel, S.; Manning, P.; Schaffner, U.; Ostle, N.; Chomel, M.; Durigan, G.; Fry, E.L.; Johnson, D.; et al. Combatting global grassland degradation. Nat. Rev. Earth Environ. 2021, 2, 720–735. [Google Scholar] [CrossRef]
- Tang, Z.; Zhang, Y.; Cong, N.; Wimberly, M.; Wang, L.; Huang, K.; Li, J.; Zu, J.; Zhu, Y.; Chen, N. Spatial pattern of pika holes and their effects on vegetation coverage on the Tibetan Plateau: An analysis using unmanned aerial vehicle imagery. Ecol. Indic. 2019, 107, 105551. [Google Scholar] [CrossRef]
- Jiang, C.; Zhang, L. Climate Change and Its Impact on the Eco-Environment of the Three-Rivers Headwater Region on the Tibetan Plateau, China. Int. J. Environ. Res. Public Health 2015, 12, 12057–12081. [Google Scholar] [CrossRef] [PubMed]
- Zhang, Y.; Hong, S.; Liu, D.; Piao, S. Susceptibility of vegetation low-growth to climate extremes on Tibetan Plateau. Agric. For. Meteorol. 2023, 331, 109323. [Google Scholar] [CrossRef]
- Xie, S.; Qu, J.; Xu, X.; Pang, Y. Interactions between freeze–thaw actions, wind erosion desertification, and permafrost in the Qinghai–Tibet Plateau. Nat. Hazards 2017, 85, 829–850. [Google Scholar] [CrossRef]
- Wang, X.; Zhao, X.; Zhang, Z.; Yi, L.; Zuo, L.; Wen, Q.; Liu, F.; Xu, J.; Hu, S.; Liu, B. Assessment of soil erosion change and its relationships with land use/cover change in China from the end of the 1980s to 2010. Catena 2016, 137, 256–268. [Google Scholar] [CrossRef]
- Luo, S.; Fang, X.; Lyu, S.; Jiang, Q.; Wang, J. Interdecadal changes in the freeze depth and period of frozen soil on the Three Rivers Source Region in China from 1960 to 2014. Adv. Meteorol. 2017, 2017, 5931467. [Google Scholar] [CrossRef]
- Lv, M.; Wang, Y.; Gao, Z. The change process of soil hydrological properties in the permafrost active layer of the Qinghai–Tibet Plateau. CATENA 2022, 210, 105938. [Google Scholar] [CrossRef]
- Wang, T.; Zhao, Y.; Xu, C.; Ciais, P.; Liu, D.; Yang, H.; Piao, S.; Yao, T. Atmospheric dynamic constraints on Tibetan Plateau freshwater under Paris climate targets. Nat. Clim. Chang. 2021, 11, 219–225. [Google Scholar] [CrossRef]


| Data Type | Data Use | Data Format | Data Source |
|---|---|---|---|
| Precipitation | Rainfall erodibility | Grid, 500 m resolution, from 2000 to 2020. | National Climate Center of the China Meteorological Administration (http://data.cma.cn/, accessed on 1 September 2022). 500 m resolution grid is interpolated using the professional meteorological interpolation software ANUSPLINA-version 4.4 (http://fennerschool.anu.edu.au/files/anusplin44.pdf, accessed on 1 September 2022) |
| Land use | Fragmentation index, habitat quality, and soil erosion | Grid, 30 m resolution, 2000, 2005, 2010, 2015, and 2020 | Resource and Environment Center of Chinese Academy of Sciences (http://www.resdc.cn, accessed on 1 September 2022) |
| Digital elevation model (DEM) | Soil erosion | Grid, 500 m resolution, 2020 | Resource and Environment Center of Chinese Academy of Sciences (http://www.resdc.cn, accessed on 1 September 2022) |
| NDVI | Habitat quality, grassland degradation | Grid, 500 m resolution, 16-day scale from 2000 to 2020. | MOD13A1 (https://modis.gsfc.nasa.gov/data/, accessed on 1 September 2022) |
| Road | Habitat quality, grassland degradation | Shapefile, 2000 and 2015 | Geographic Data Platform, School of Urban and Environmental Sciences, Peking University (http://geodata.pku.edu.cn, accessed on 1 September 2022) |
| Eco-function zones of the TRHR | Habitat quality | Shapefile | The data are converted into vector format using the eco-function zones map of the Three-River-Source National Park of China. |
| Soil properties (The fraction of sand, silt, and clay. The content of soil organic carbon.) | Water conservation and soil erosion | Grid, 30 arc second, 1995 | Harmonized world soil database (HWSD) v1.2 (http://www.fao.org/soils-portal/soil-survey/soil-maps-and-databases/harmonized-world-soil-database-v12/en/, accessed on 1 September 2022) |
| Soil depth | Water conservation | Grid, 1 km resolution, 1990 | Soil Data Center, National Earth System Science Data Sharing Infrastructure, National Science and Technology Infrastructure of China (http://soil.geodata.cn, accessed on 1 September 2022) |
| Degradation Pathways | Evaluation Index | Land Degradation Intensity 1 | Classification Method |
|---|---|---|---|
| Landscape degradation (structure and quality) | Fragmentation index | Apparent improvement | Compared with the images in 2000 and 2020, the relative percentage of the fragmentation index decreased by more than 20% |
| Slight improvement | Compared with the two images, the relative percentage of the fragmentation index decreased by 10–20% | ||
| Slight degradation | Compared with the two images, the relative percentage of the fragmentation index increased by 10–20% | ||
| Moderate degradation | Compared with the two images, the relative percentage of the fragmentation index increased by 20–50% | ||
| Severe degradation | Compared with the two images, the relative percentage of the fragmentation index increased by more than 50% or the grassland patches disappeared completely | ||
| Habitat quality | Apparent improvement | The habitat quality demonstrated a positive trend, with the change period increasing by over 20% compared to the average value during the baseline period | |
| Slight improvement | The habitat quality demonstrated a positive trend, with the change period increasing by 10–20% compared to the average value during the baseline period | ||
| Slight degradation | The habitat quality exhibited a declining trend, with the change period decreasing by 10–20% compared to the average value during the baseline period | ||
| Medium degradation | The habitat quality exhibited a declining trend, with the change period decreasing by 20–50% compared to the average value during the baseline period | ||
| Severe degradation | The habitat quality exhibited a declining trend, with the change period decreasing by over 50% compared to the average value during the baseline period | ||
| Vegetation degradation | Grassland degradation | Apparent improvement | NDVI increased and spatial heterogeneity decreased simultaneously |
| Slight improvement | NDVI and spatial heterogeneity increased (regions with NDVI < 0.2) | ||
| Slight degradation | NDVI and spatial heterogeneity increased (regions with NDVI > 0.2) | ||
| Medium degradation | NDVI decreased and spatial heterogeneity increased | ||
| Severe degradation | NDVI and spatial heterogeneity decreased simultaneously (regions with NDVI > 0.2) | ||
| Soil erosion | Soil water erosion | Apparent improvement | The change rate of erosion modulus for multiple years is below −0.5 t/hm2/a |
| Slight improvement | The change rate of erosion modulus for multiple years ranges between −0.5 and −0.05 t/hm2/a | ||
| Slight degradation | The change rate of erosion modulus for multiple years ranges between 0.05 and 0.2 t/hm2/a | ||
| Medium degradation | The change rate of erosion modulus for multiple years ranges between 0.2 and 0.5 t/hm2/a | ||
| Severe degradation | The change rate of erosion modulus for multiple years is above 0.5 t/hm2/a |
| Threat | Rural Settlements | Cropland | Main Road | Railway | ||
|---|---|---|---|---|---|---|
| Maximum influence distance | 5 | 3 | 10 | 10 | ||
| Weight | 0.2 | 0.2 | 0.3 | 0.3 | ||
| Distance–decay function | Index | Linear | Linear | Index | ||
| Land Use | Habitat Type | Habitat Suitability | ||||
| Agriculture | Cropland | 0.3 | 0.7 | 0 | 0.6 | 0.65 |
| Forest | Forest | 1 | 0.9 | 0.8 | 0.8 | 0.85 |
| Shrub forest | 0.85 | 0.8 | 0.7 | 0.7 | 0.75 | |
| Sparse woodland | 0.9 | 0.9 | 0.8 | 0.8 | 0.85 | |
| Other woodlands | 0.8 | 0.9 | 0.8 | 0.8 | 0.85 | |
| Grassland | Highly covered grassland | 0.8 | 0.8 | 0.7 | 0.7 | 0.75 |
| Medium-covered grassland | 0.75 | 0.8 | 0.7 | 0.7 | 0.75 | |
| Low-coverage grassland | 0.7 | 0.8 | 0.7 | 0.7 | 0.75 | |
| Waterbody | Rivers, lakes, reservoirs, and beaches | 0.7 | 0.9 | 0.8 | 0.8 | 0.85 |
| Permanent glacier | 0 | 0 | 0 | 0 | 0 | |
| Tideland | 0.1 | 0 | 0.3 | 0.3 | 0.35 | |
| Built-up area | Rural settlements | 0 | 0 | 0 | 0 | 0 |
| Other construction land | 0 | 0 | 0 | 0 | 0 | |
| Unutilized land | Sand, bare land, etc. | 0.2 | 0.6 | 0.5 | 0.5 | 0.55 |
| Classification | Water Erosion Intensity (t/hm2/a) |
|---|---|
| micro | <10 |
| mild | 10–25 |
| moderate | 25–50 |
| strong | 50–80 |
| extreme | 80–150 |
| severe | >150 |
| Types of Land Degradation | Slight Degradation | Medium Degradation | Severe Degradation | Area Proportion of Land Degradation Types |
| LEV | 0.01 | 0.23 | 0.32 | 0.56 |
| LE | 0.03 | 0.02 | 0.16 | 0.21 |
| LV | 0.04 | 0.29 | 0.44 | 0.77 |
| L | 0.11 | 0.08 | 0.65 | 0.84 |
| EV | 1 | 1.27 | 1.83 | 4.1 |
| E | 3.63 | 2.26 | 2.6 | 8.49 |
| V | 20.16 | 5.49 | 4.04 | 29.69 |
| Area proportion of land degradation intensity | 24.98 | 9.64 | 10.04 | \ |
| Types of Land Improvement | Slight Improvement | Apparent Improvement | Proportion of Land Improvement Types | |
| LEV | 0.60 | 1.19 | 1.79 | |
| LV | 1.26 | 5.78 | 7.04 | |
| EV | 1.11 | 6.29 | 7.40 | |
| V | 10.68 | 28.43 | 39.11 | |
| Proportion of land improvement | 13.65 | 41.69 | \ | |
| Severe Degradation | Medium Degradation | Slight Degradation | Slight Improvement | Apparent Improvement |
|---|---|---|---|---|
| 5.63% | 7.21% | 22.26% | 16.56% | 48.34% |
| Classification | Micro | Mild | Moderate | Strong | Extreme | Severe |
|---|---|---|---|---|---|---|
| 2000–2010 | 80.53 | 9.89 | 5.22 | 2.35 | 1.69 | 0.32 |
| 2011–2020 | 80.86 | 9.69 | 5.03 | 2.28 | 1.74 | 0.40 |
| 2000–2020 | 80.76 | 9.79 | 5.11 | 2.3 | 1.69 | 0.35 |
| Degree of soil erosion intensification/amelioration | Apparent improvement | Slight improvement | Stable condition | Slight degradation | Medium degradation | Severe degradation |
| 2000–2020 | 4.86 | 8.28 | 73.50 | 5.99 | 3.51 | 3.86 |
Disclaimer/Publisher’s Note: The statements, opinions and data contained in all publications are solely those of the individual author(s) and contributor(s) and not of MDPI and/or the editor(s). MDPI and/or the editor(s) disclaim responsibility for any injury to people or property resulting from any ideas, methods, instructions or products referred to in the content. |
© 2023 by the authors. Licensee MDPI, Basel, Switzerland. This article is an open access article distributed under the terms and conditions of the Creative Commons Attribution (CC BY) license (https://creativecommons.org/licenses/by/4.0/).
Share and Cite
Pan, Y.; Yin, Y.; Cao, W. Integrated Assessments of Land Degradation in the Three-Rivers Headwater Region of China from 2000 to 2020. Remote Sens. 2023, 15, 4521. https://doi.org/10.3390/rs15184521
Pan Y, Yin Y, Cao W. Integrated Assessments of Land Degradation in the Three-Rivers Headwater Region of China from 2000 to 2020. Remote Sensing. 2023; 15(18):4521. https://doi.org/10.3390/rs15184521
Chicago/Turabian StylePan, Yao, Yunhe Yin, and Wei Cao. 2023. "Integrated Assessments of Land Degradation in the Three-Rivers Headwater Region of China from 2000 to 2020" Remote Sensing 15, no. 18: 4521. https://doi.org/10.3390/rs15184521
APA StylePan, Y., Yin, Y., & Cao, W. (2023). Integrated Assessments of Land Degradation in the Three-Rivers Headwater Region of China from 2000 to 2020. Remote Sensing, 15(18), 4521. https://doi.org/10.3390/rs15184521