
Dual-Frequency Signal Enhancement Method of Moving Target Echoes for GNSS-S Radar

 , , ,
, , ,
Abstract
:1. Introduction
2. Methodology
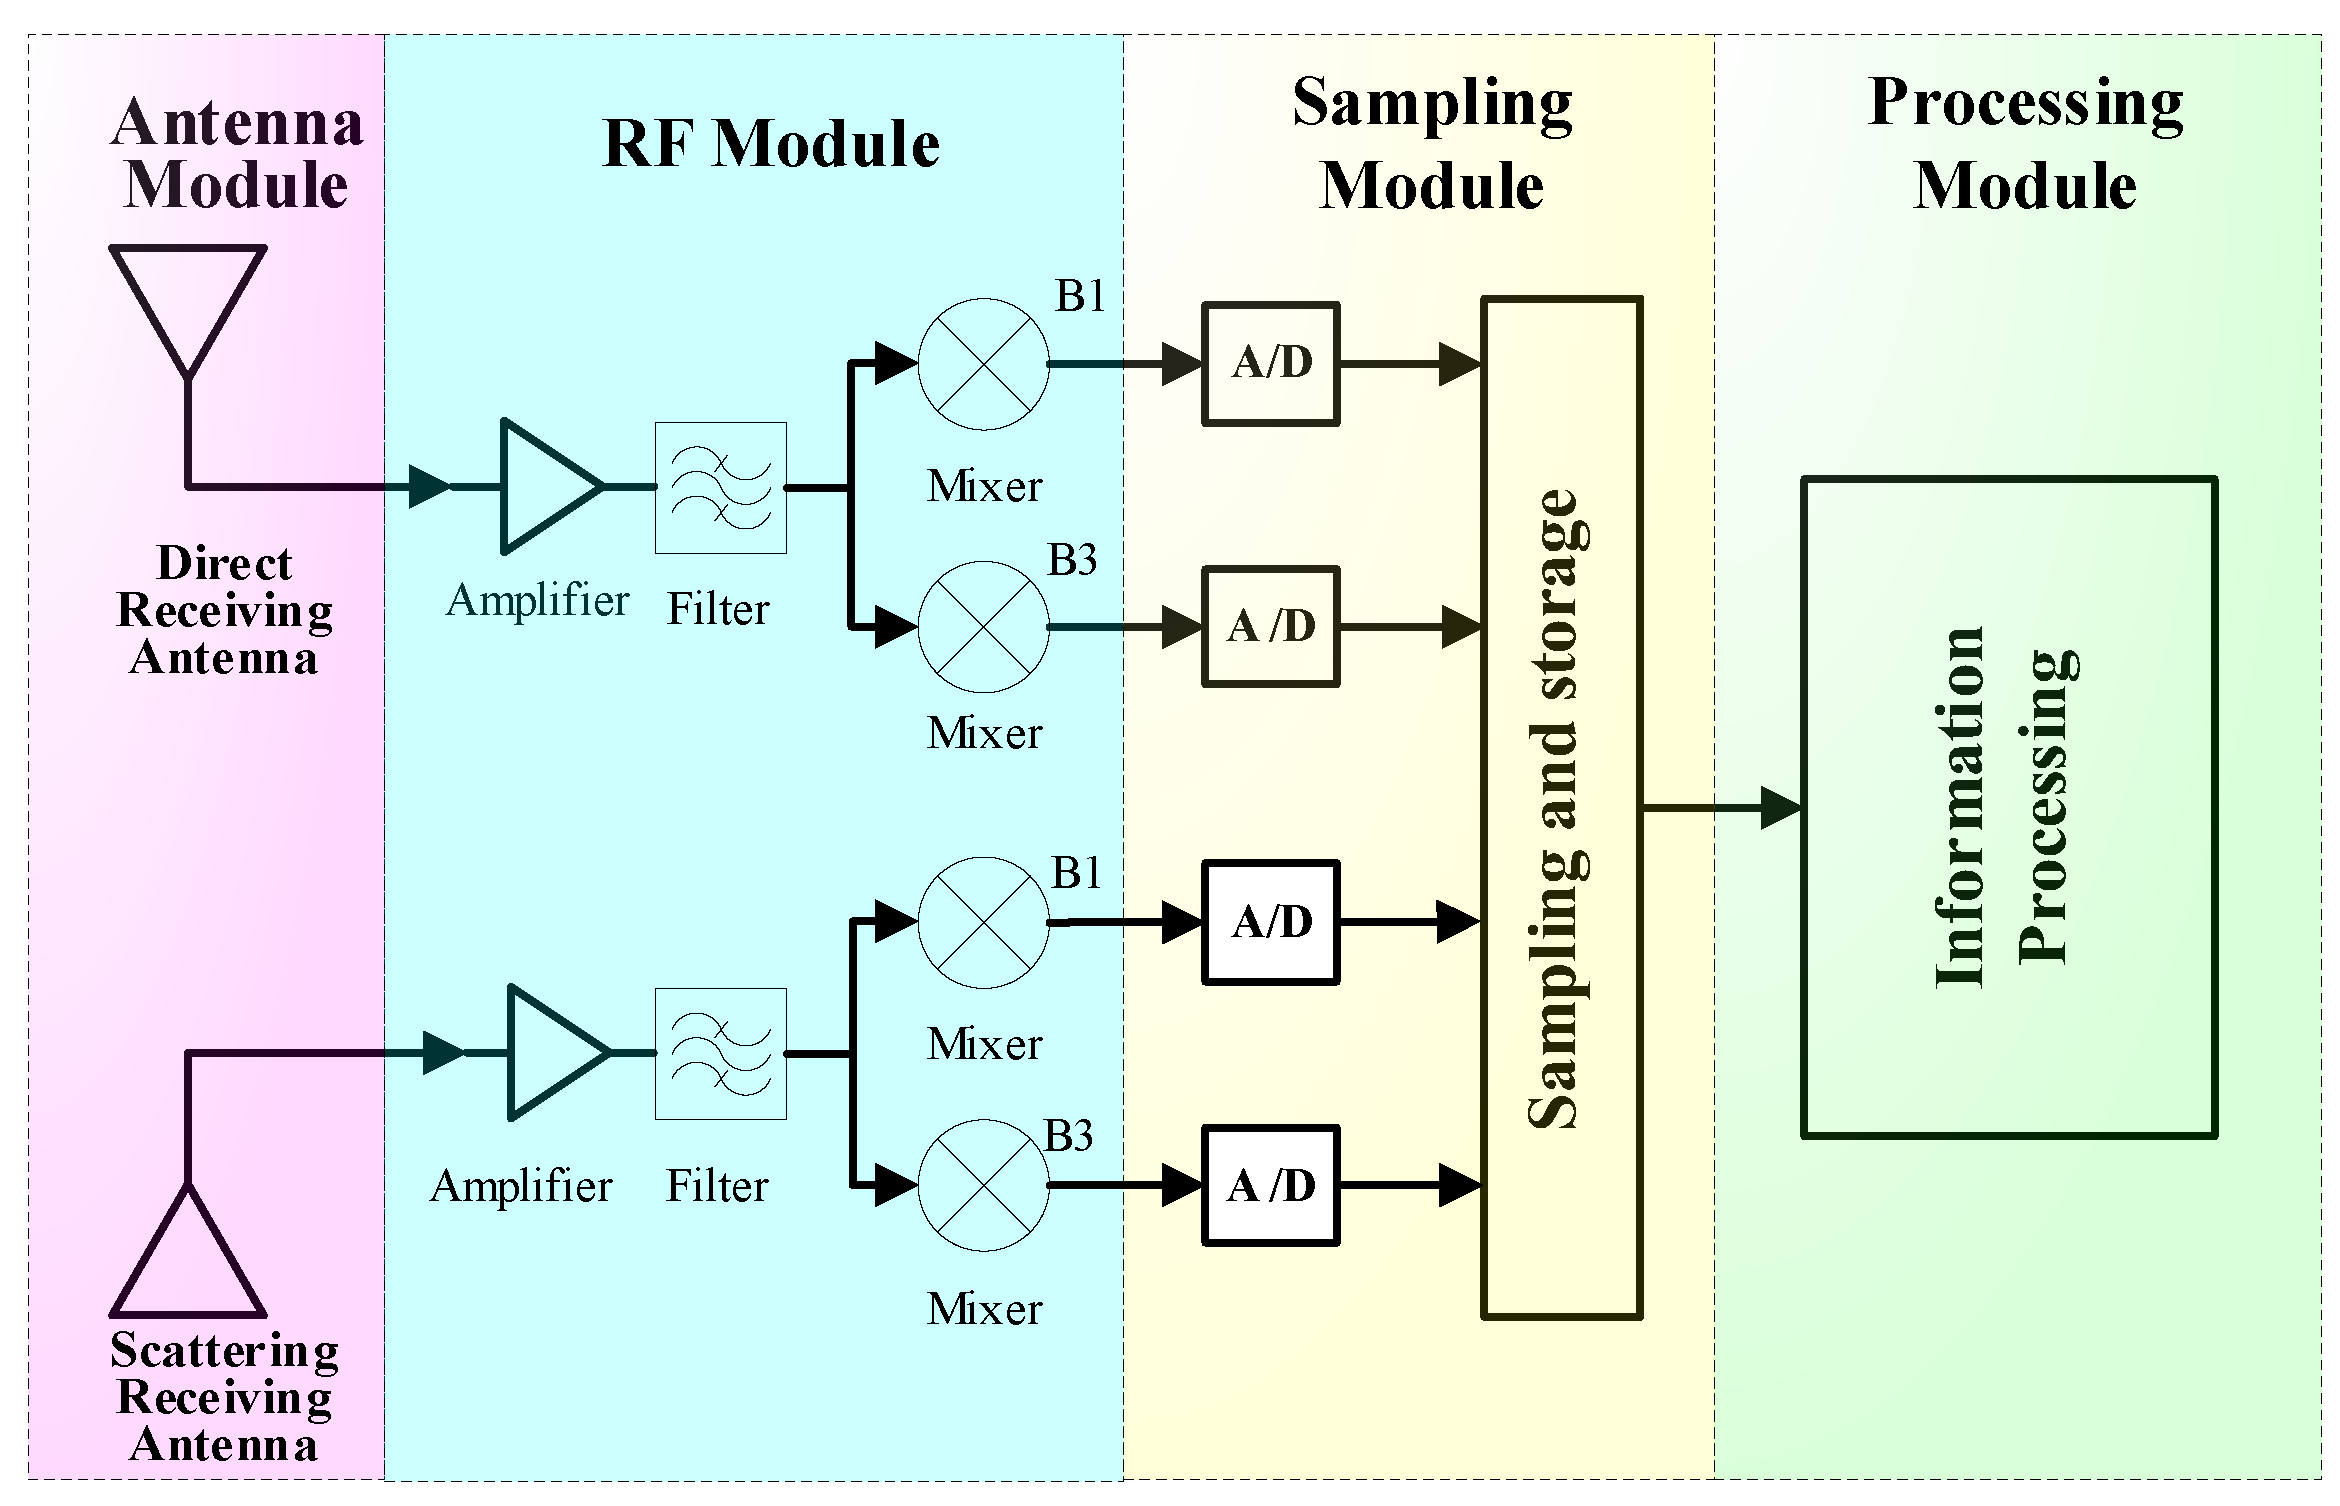
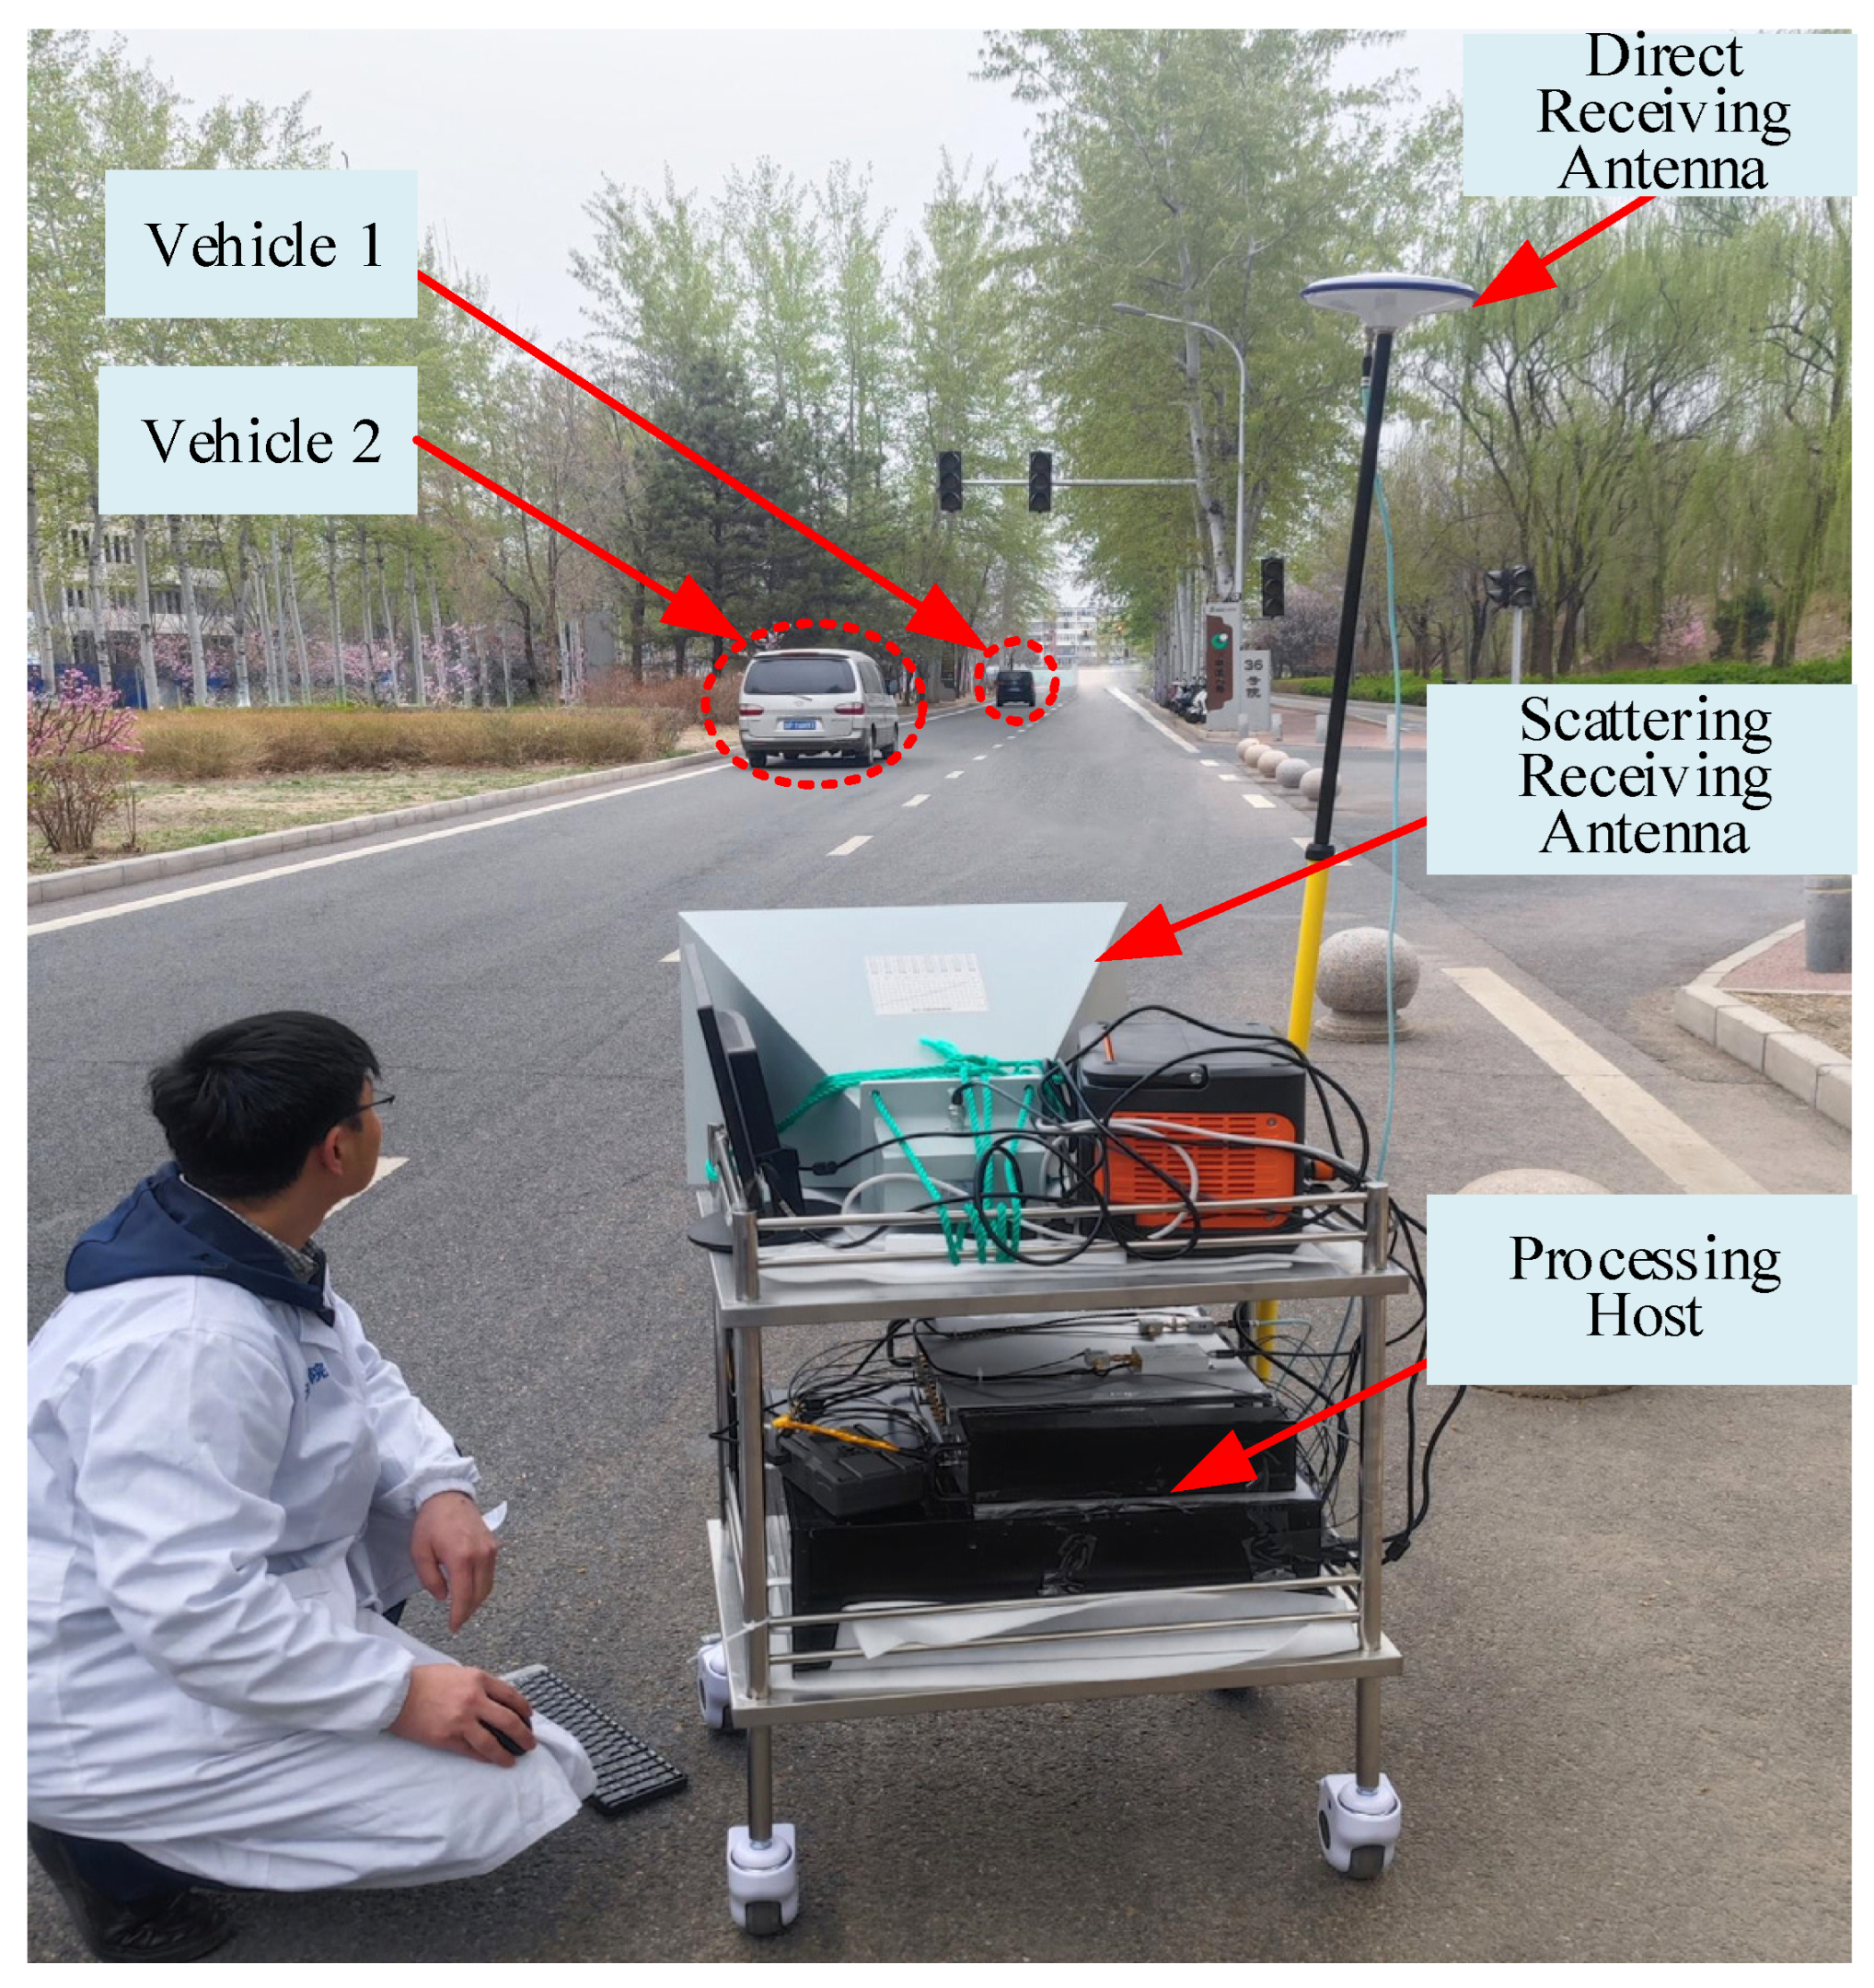
2.1. Composition of the GNSS-S Radar System
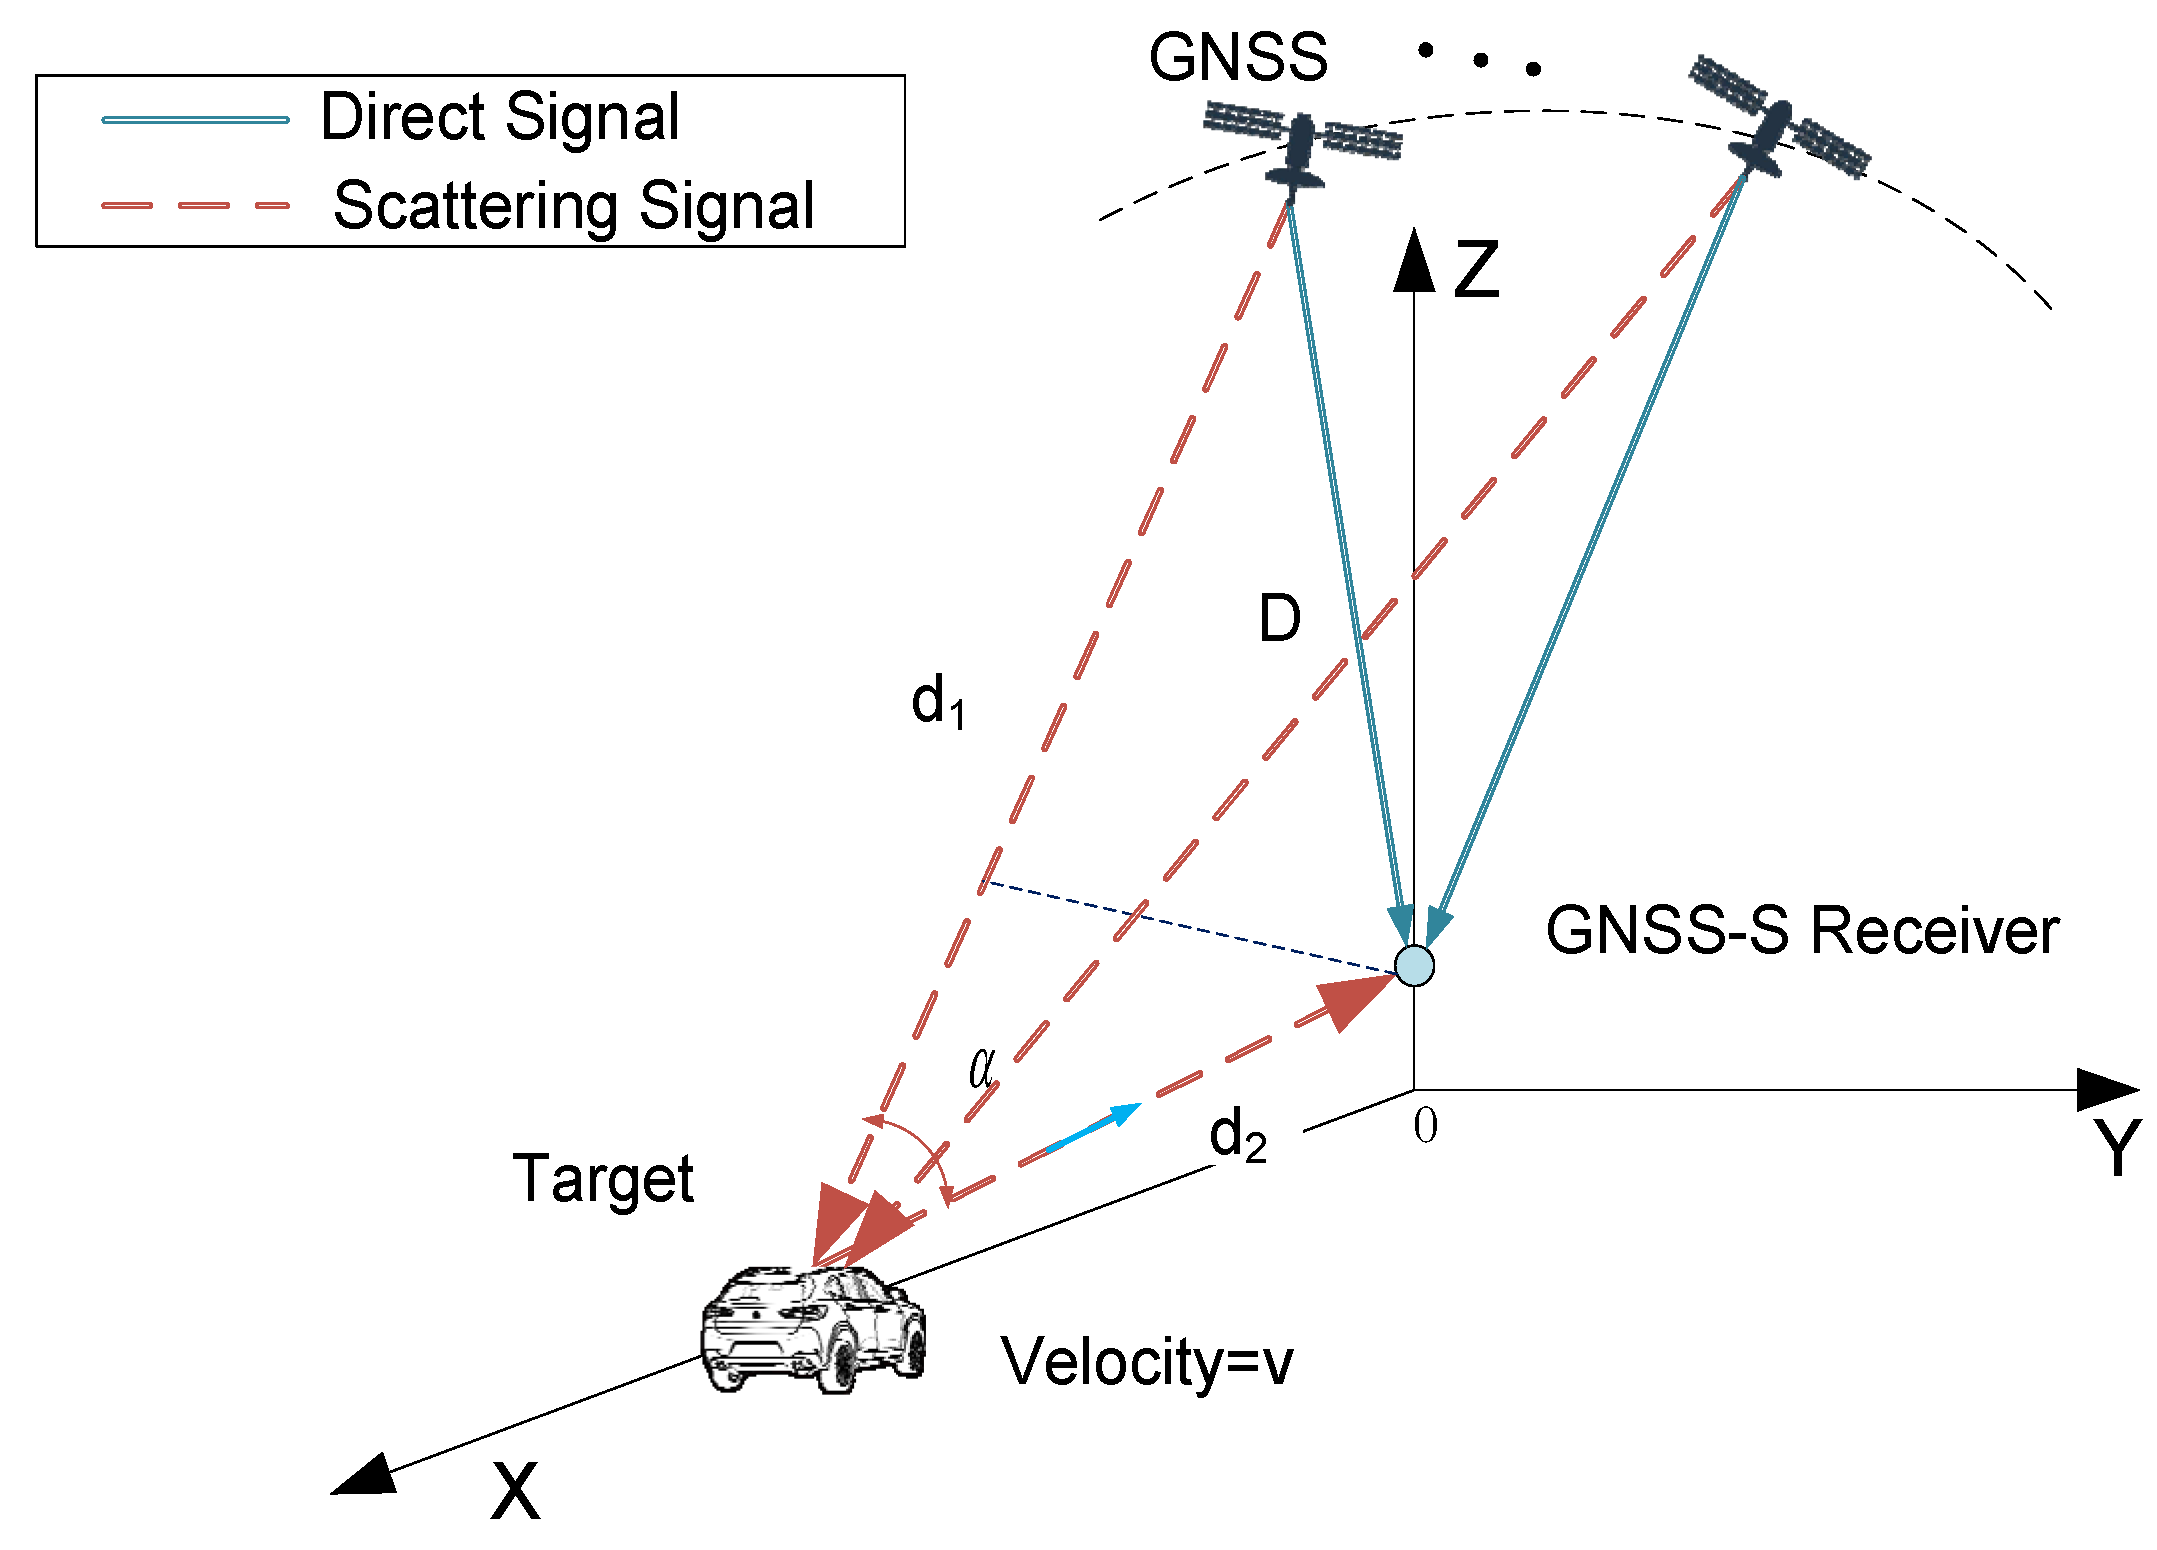
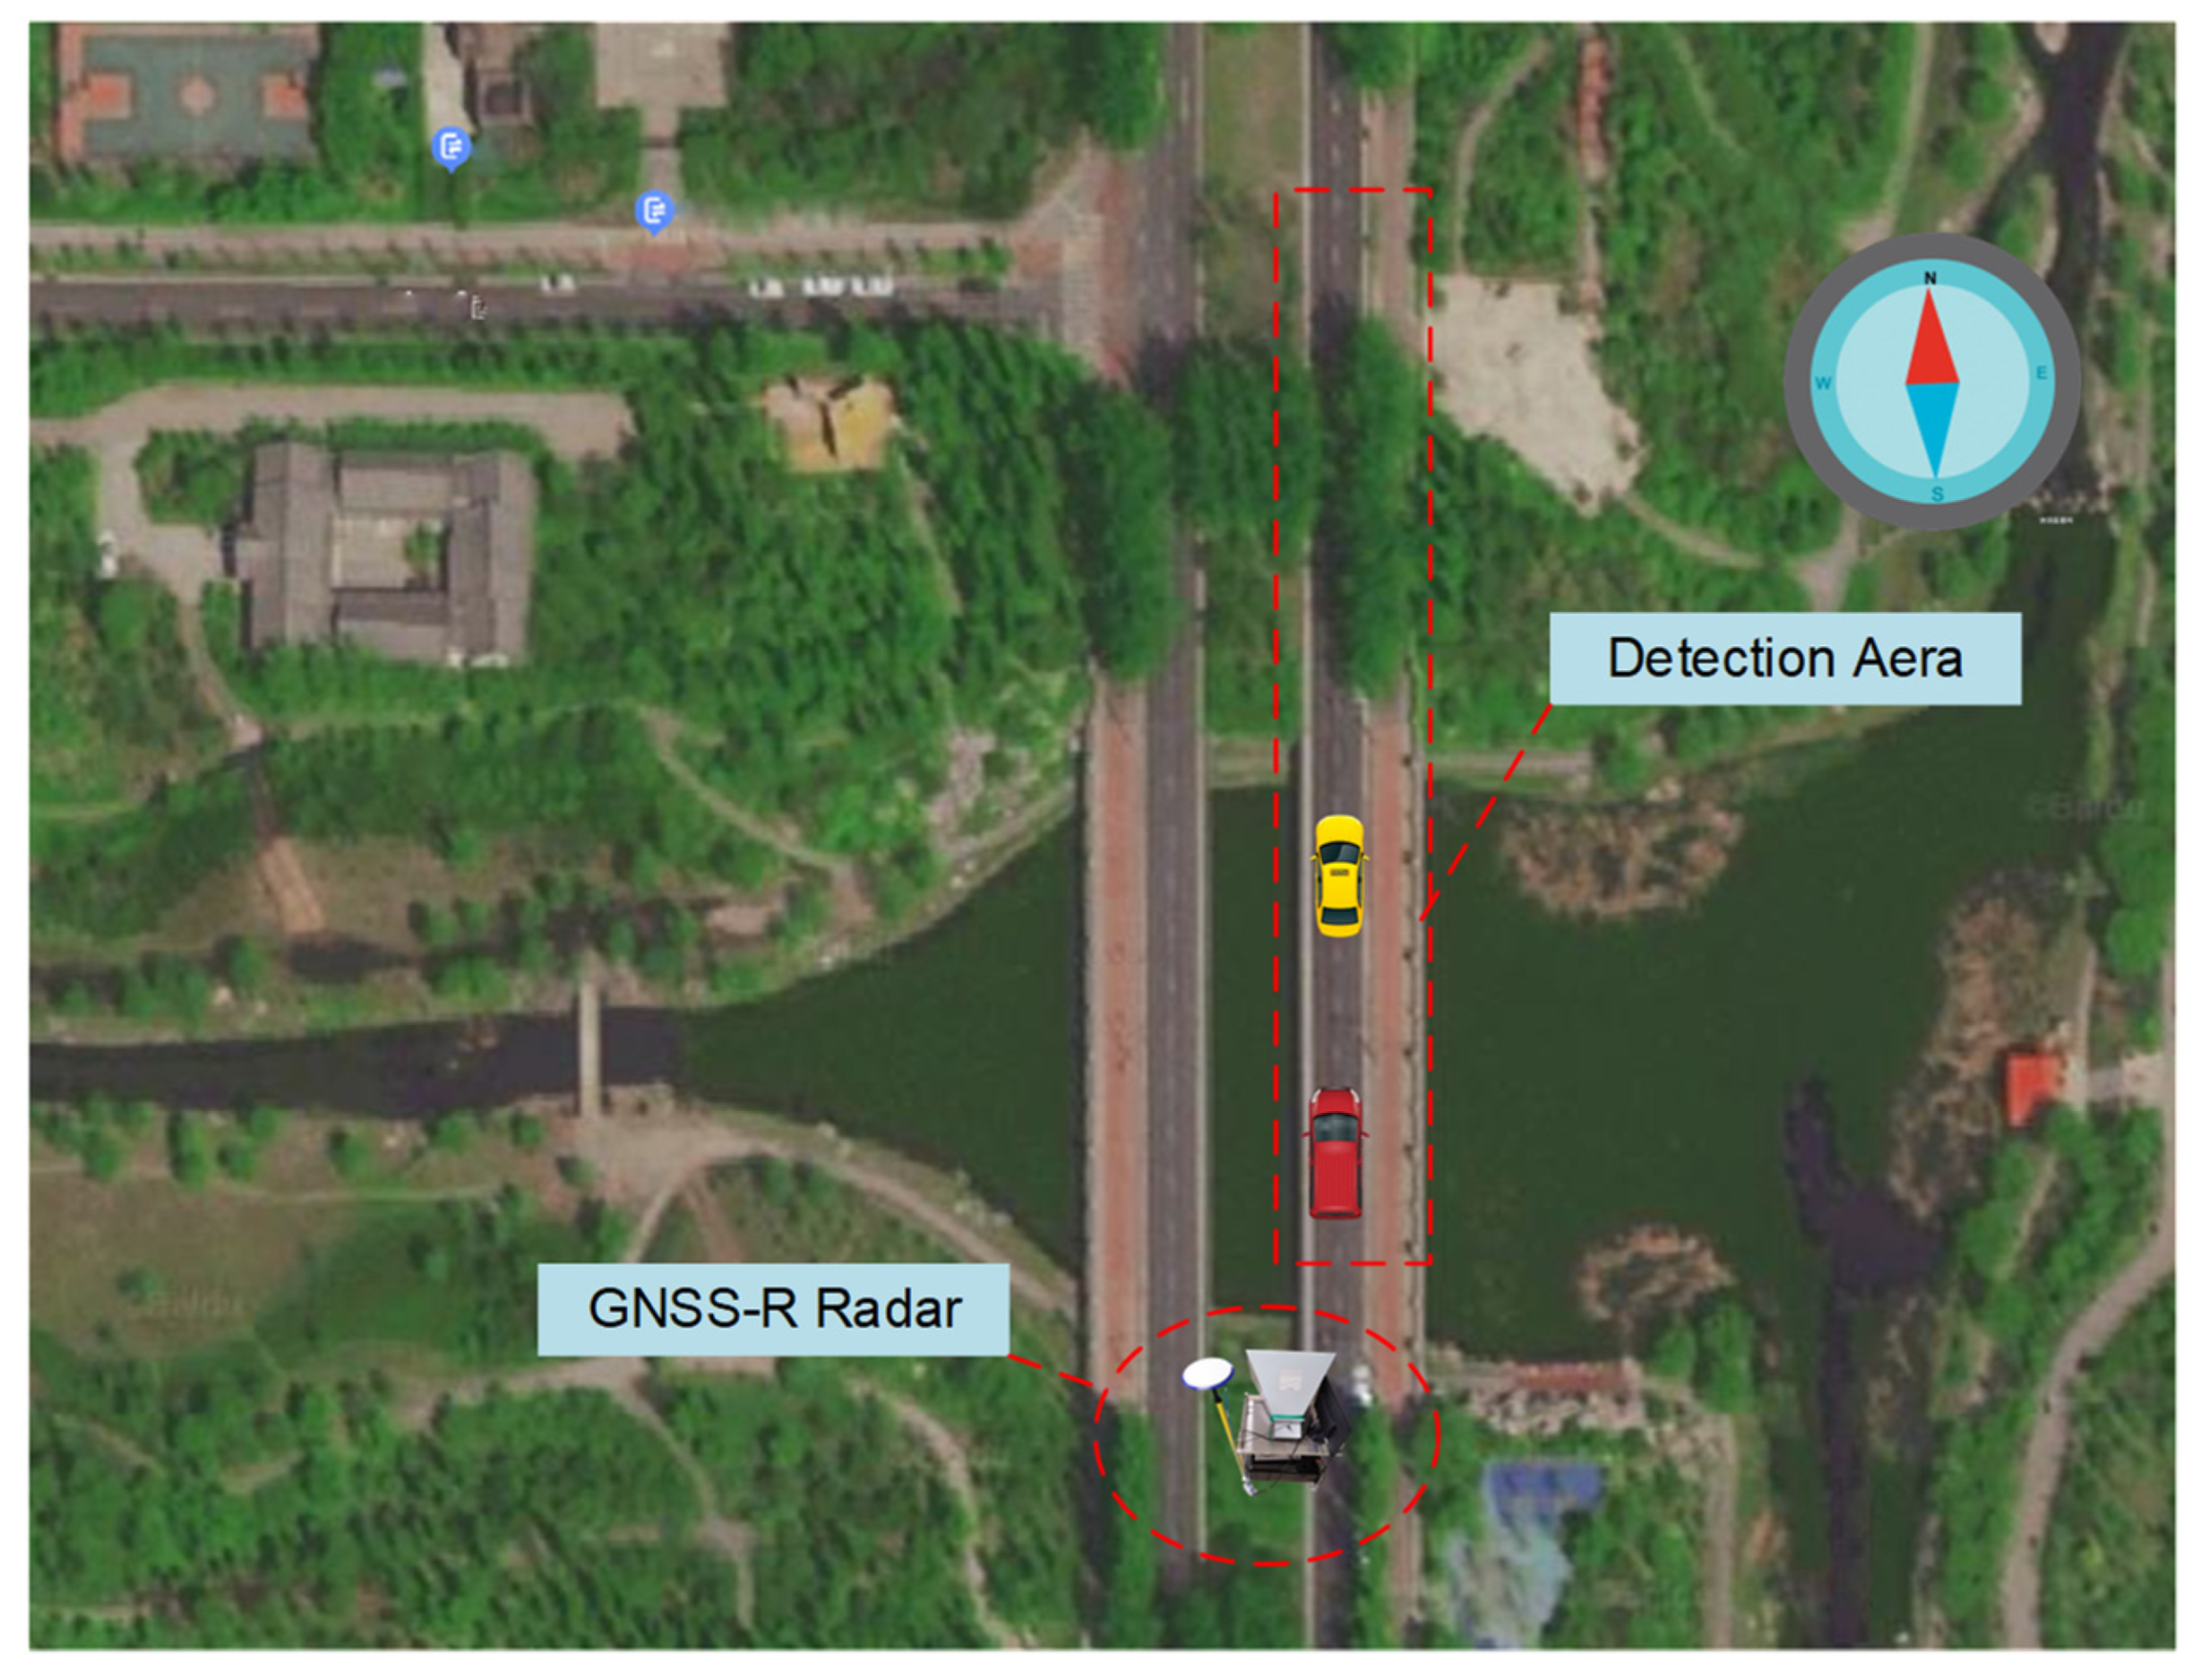
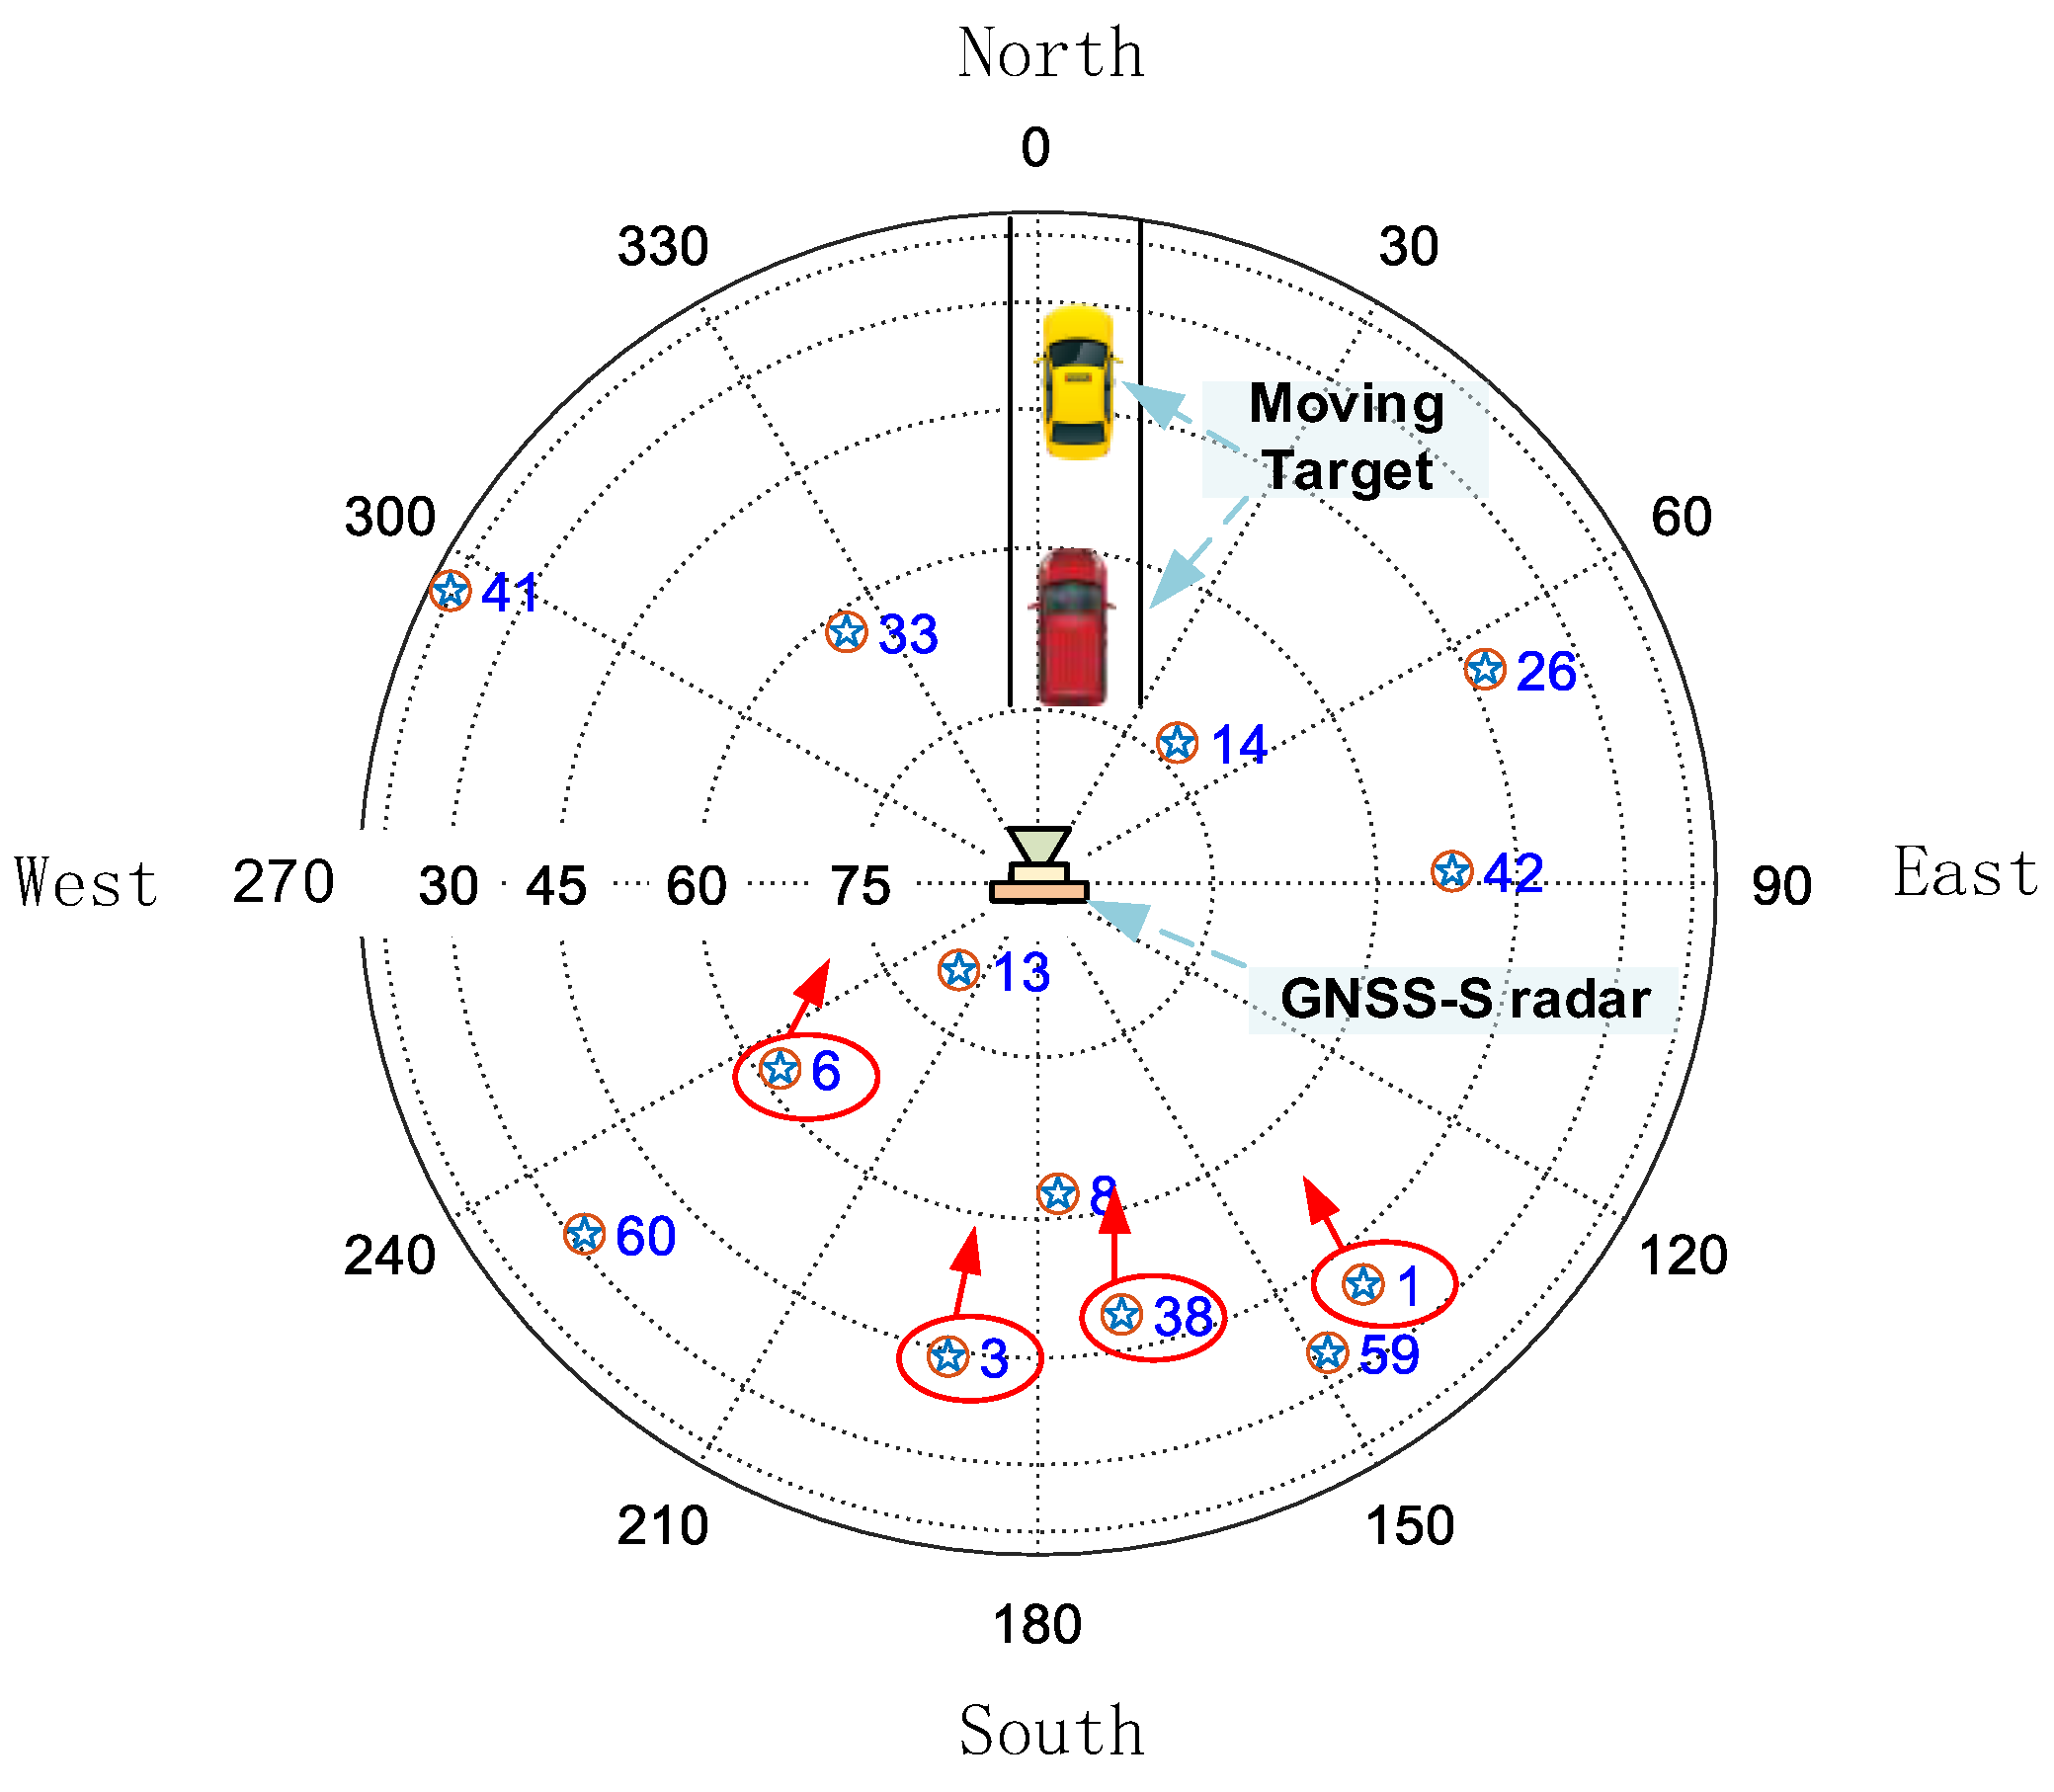
2.2. Geometry Configuration
2.3. Signal Model
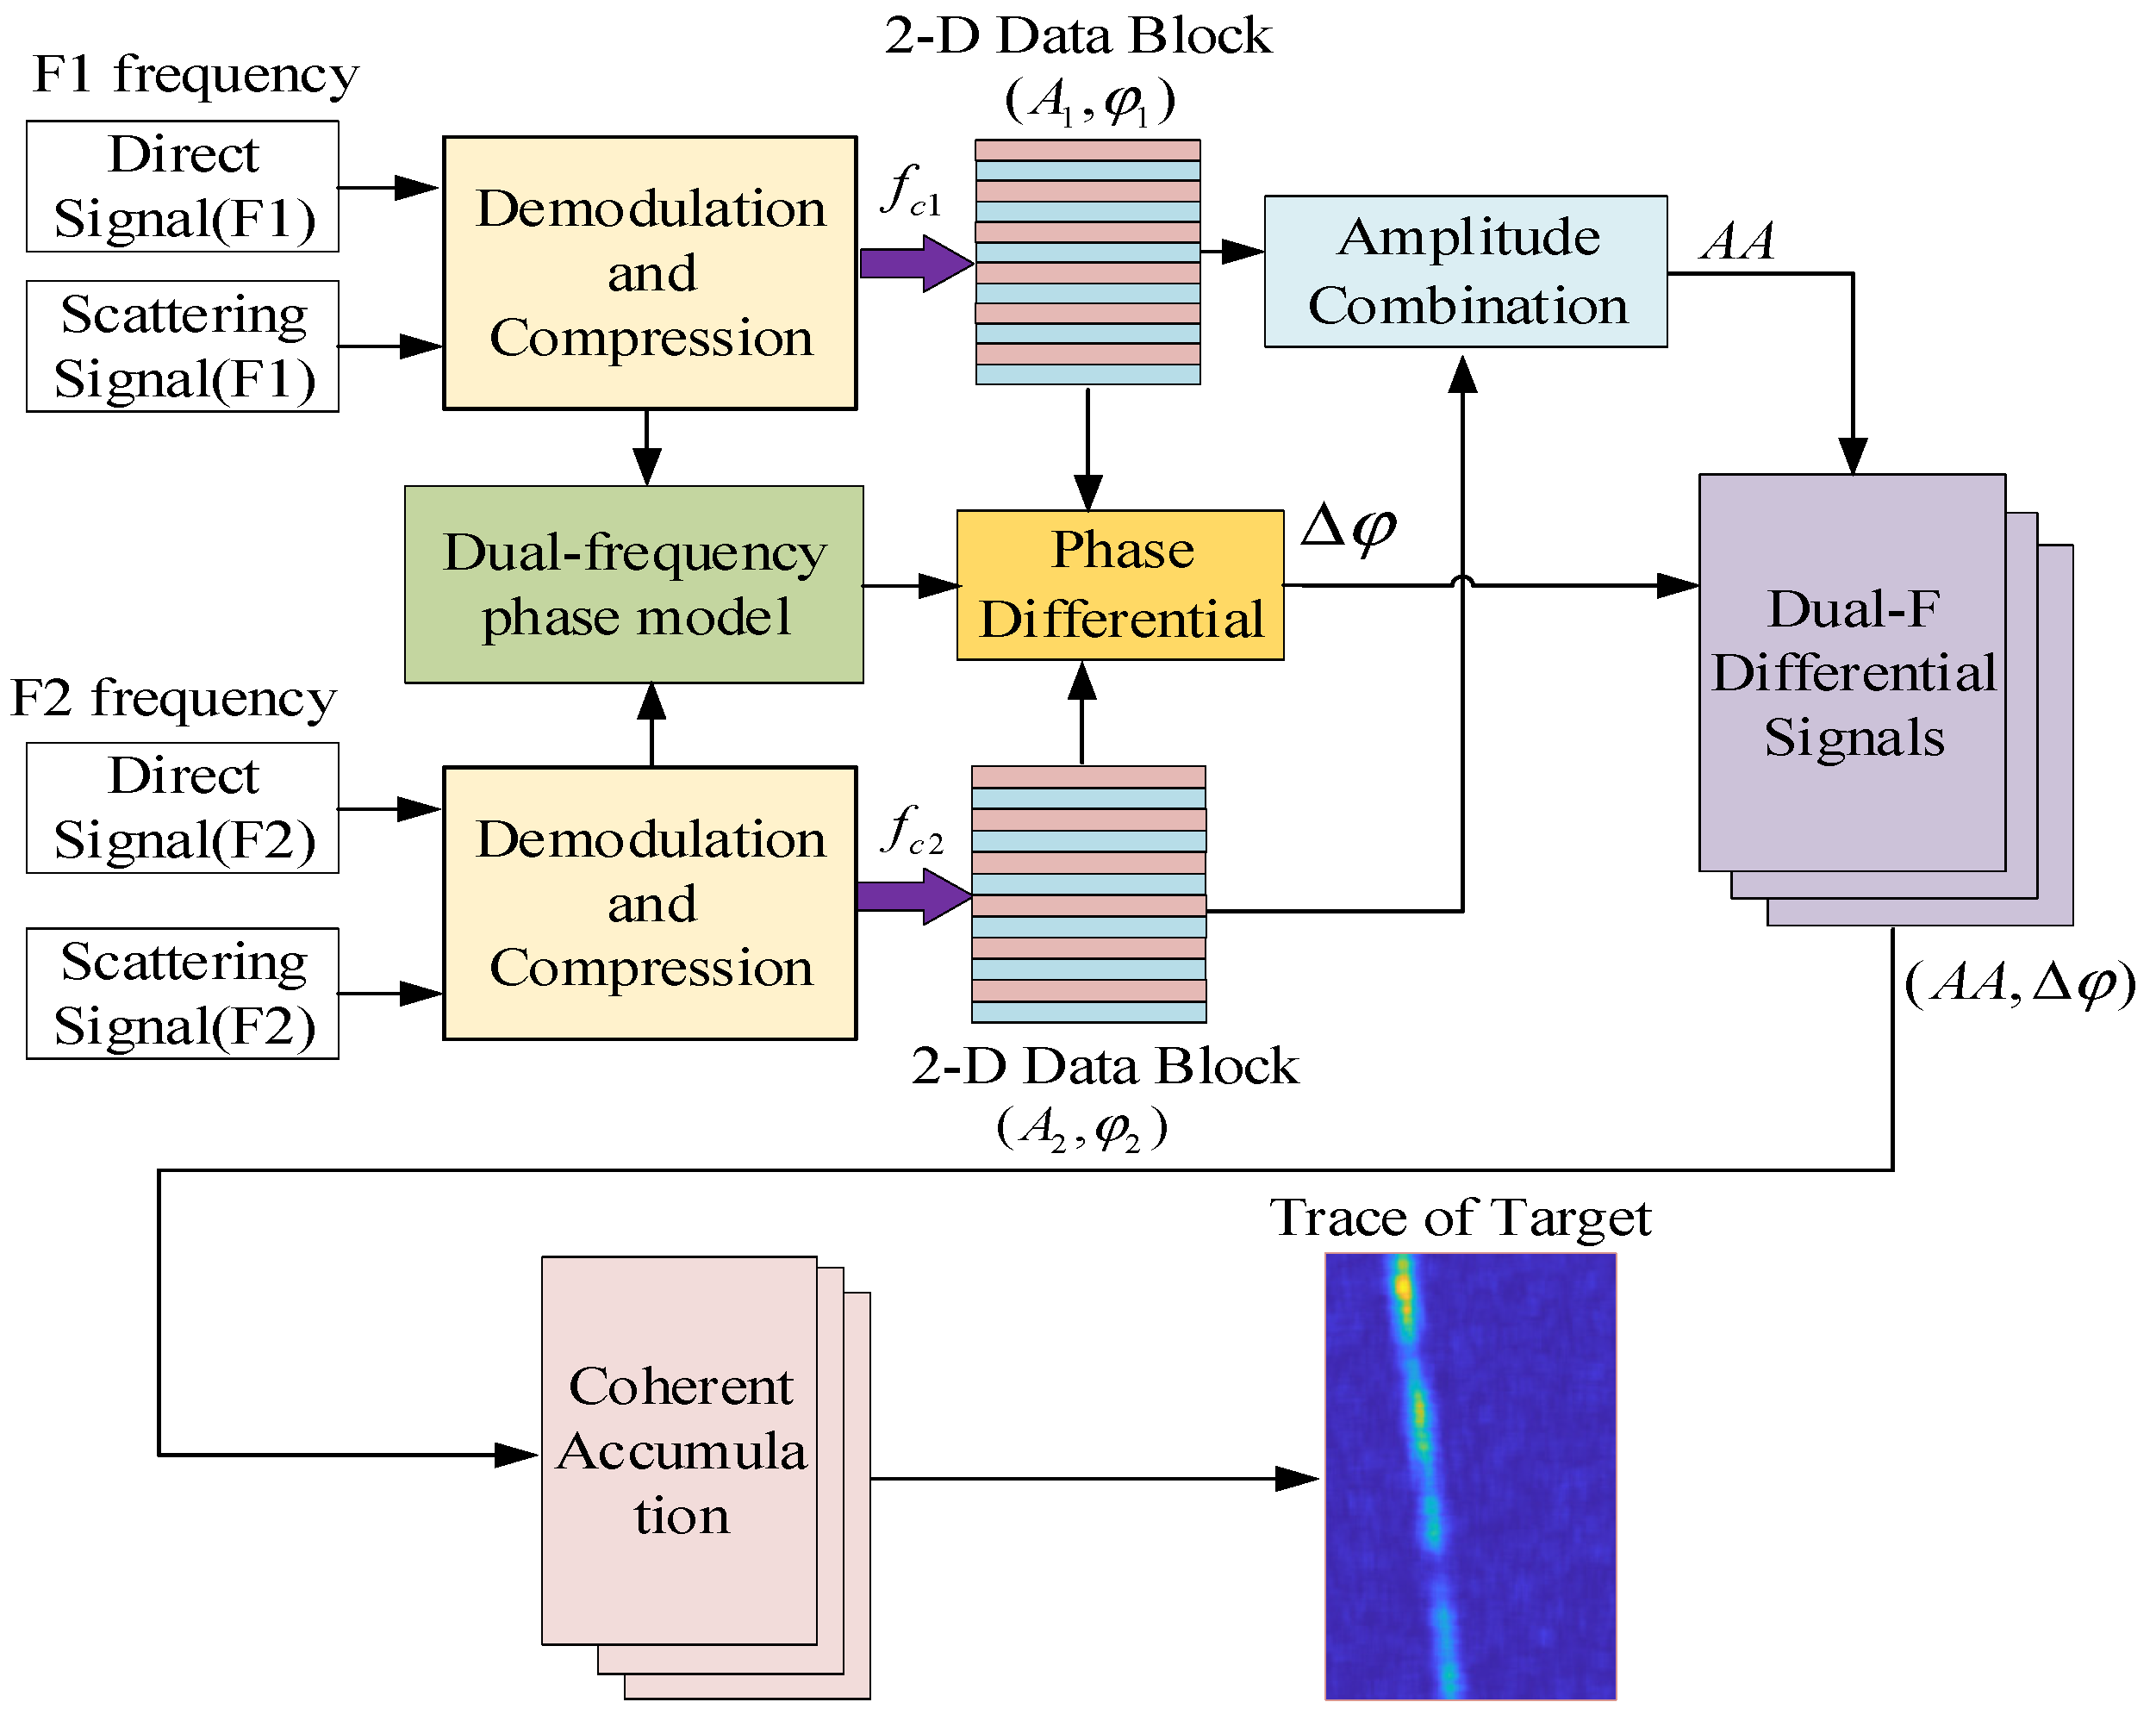
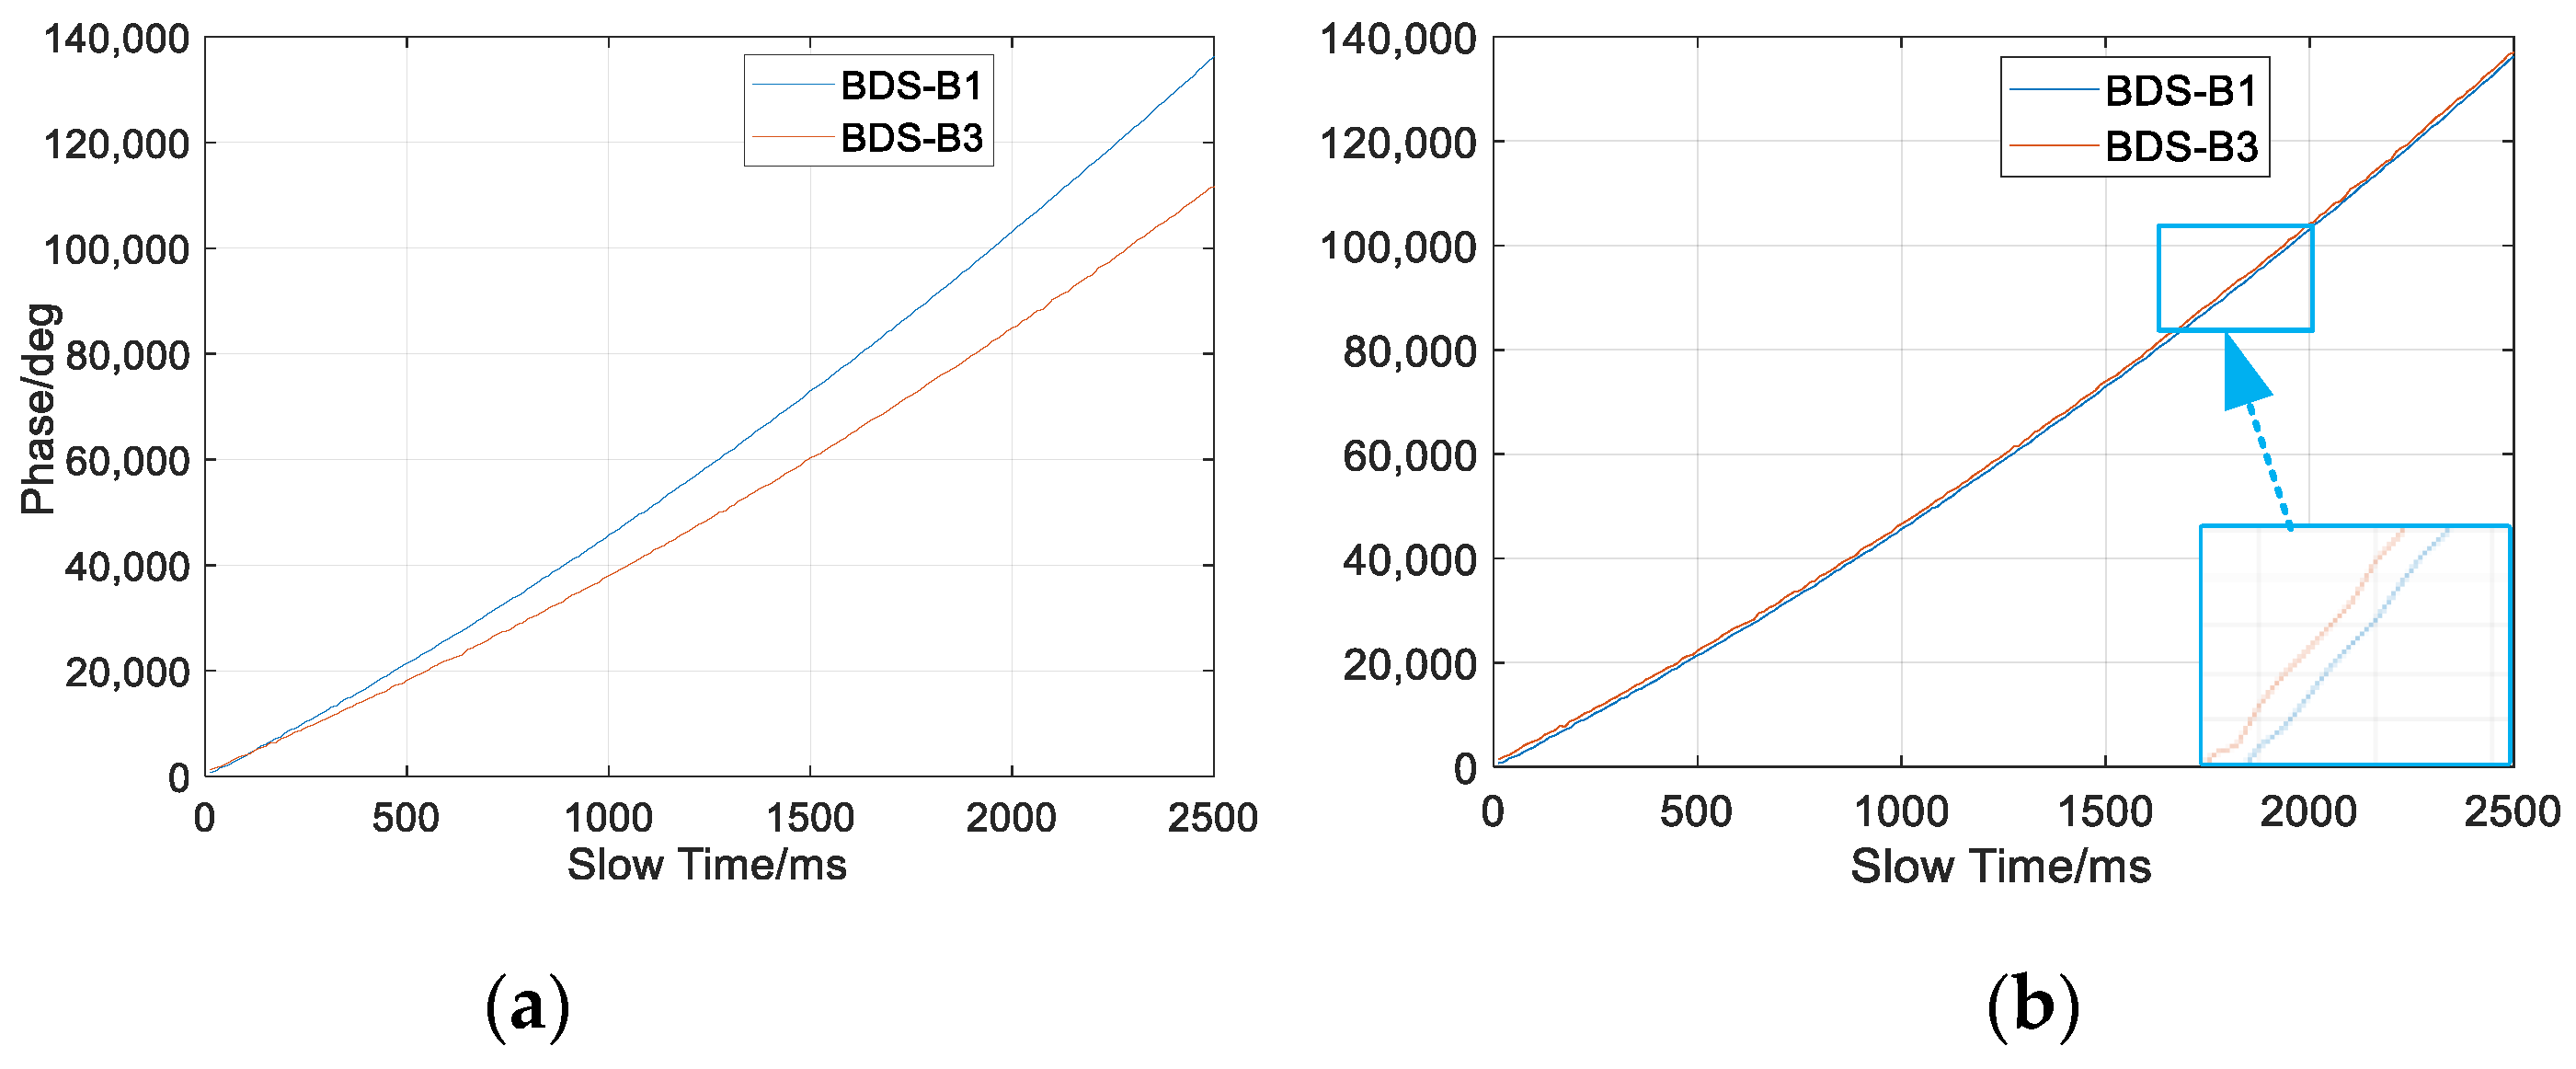
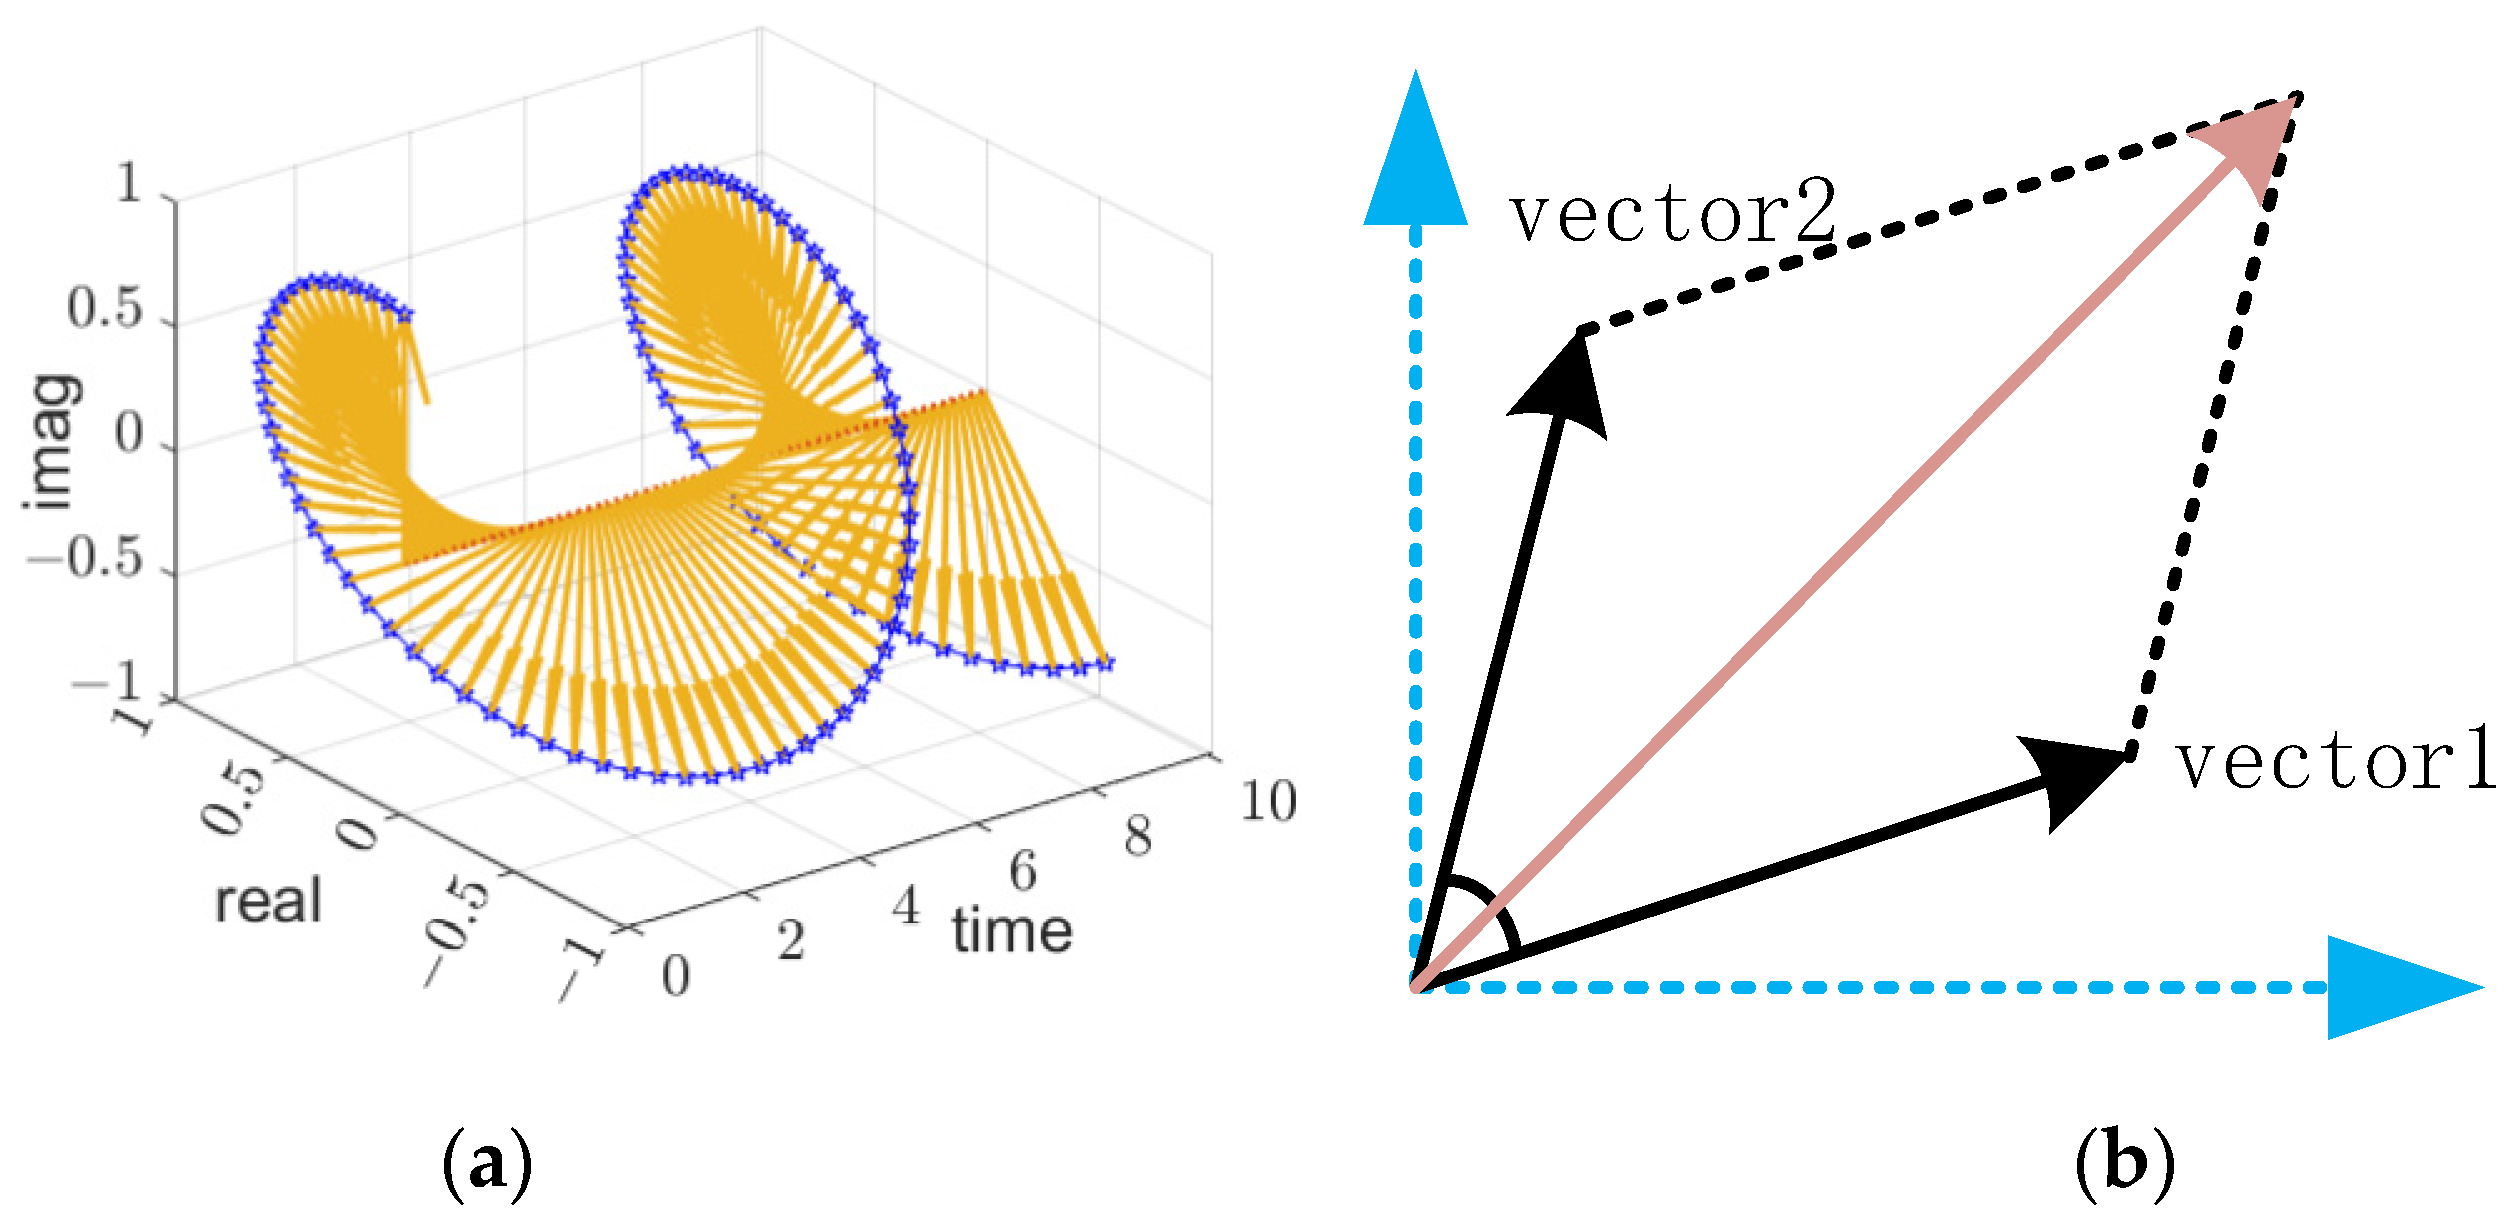
2.4. Dual-Frequency Processing Methods
3. Simulation and Experimental Results
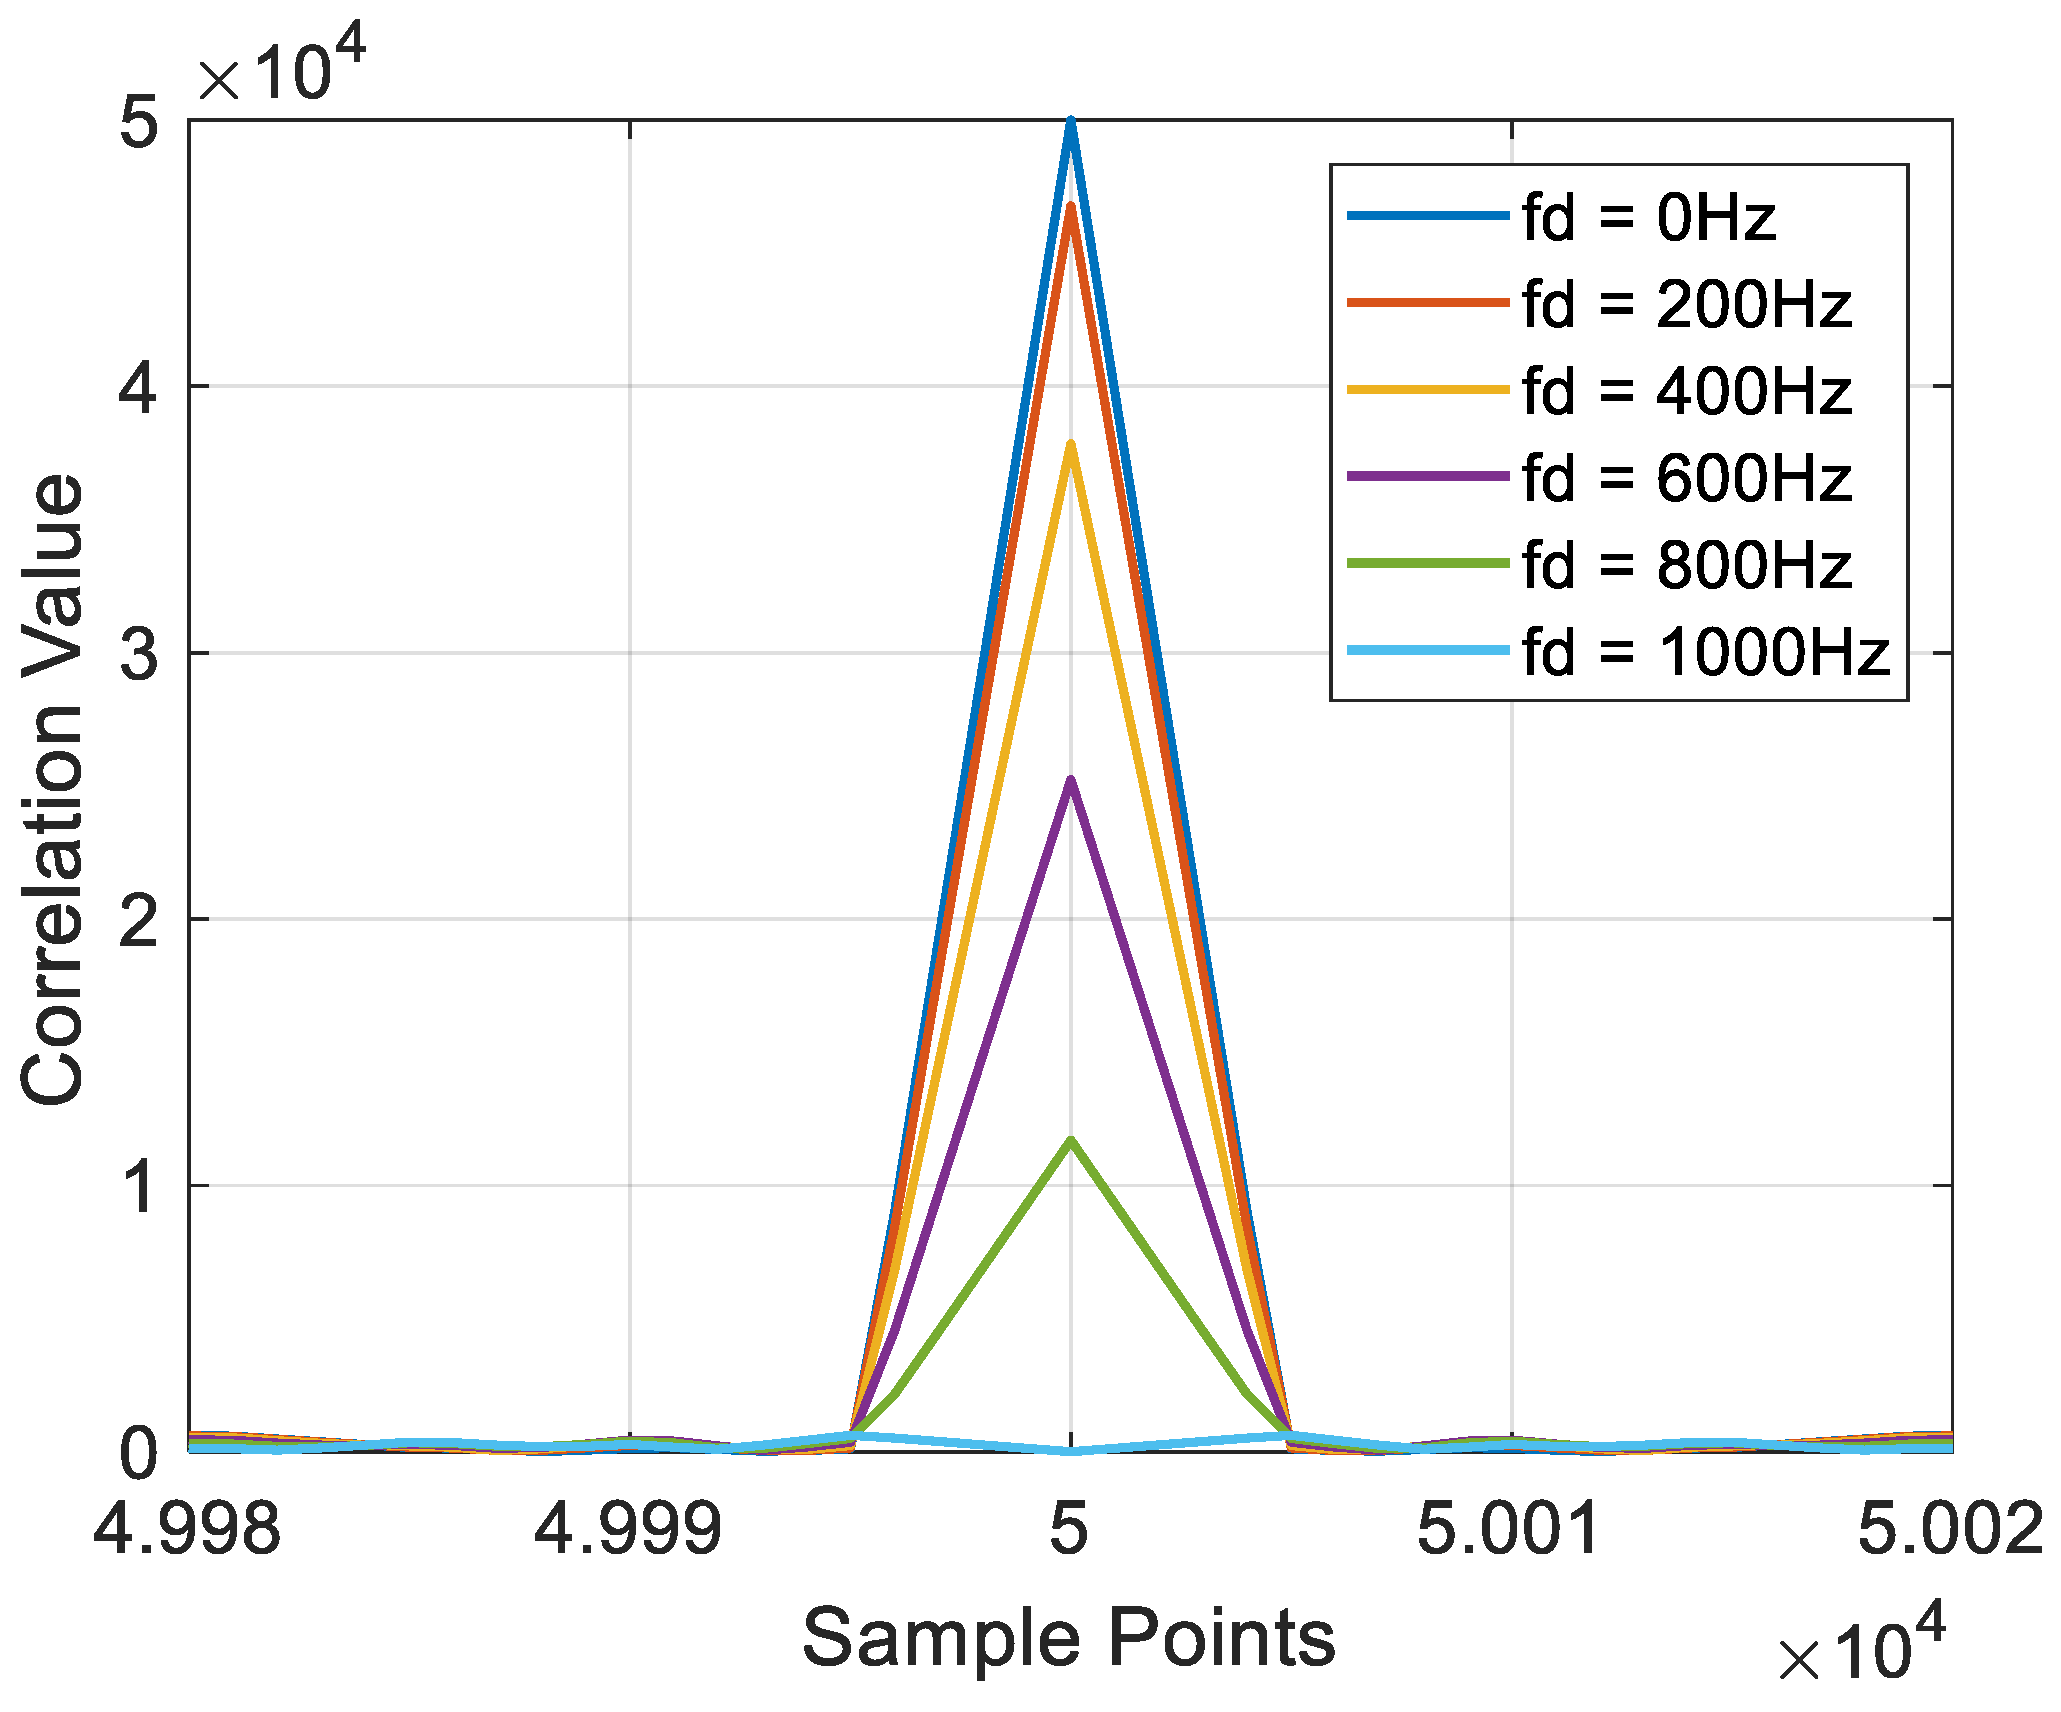
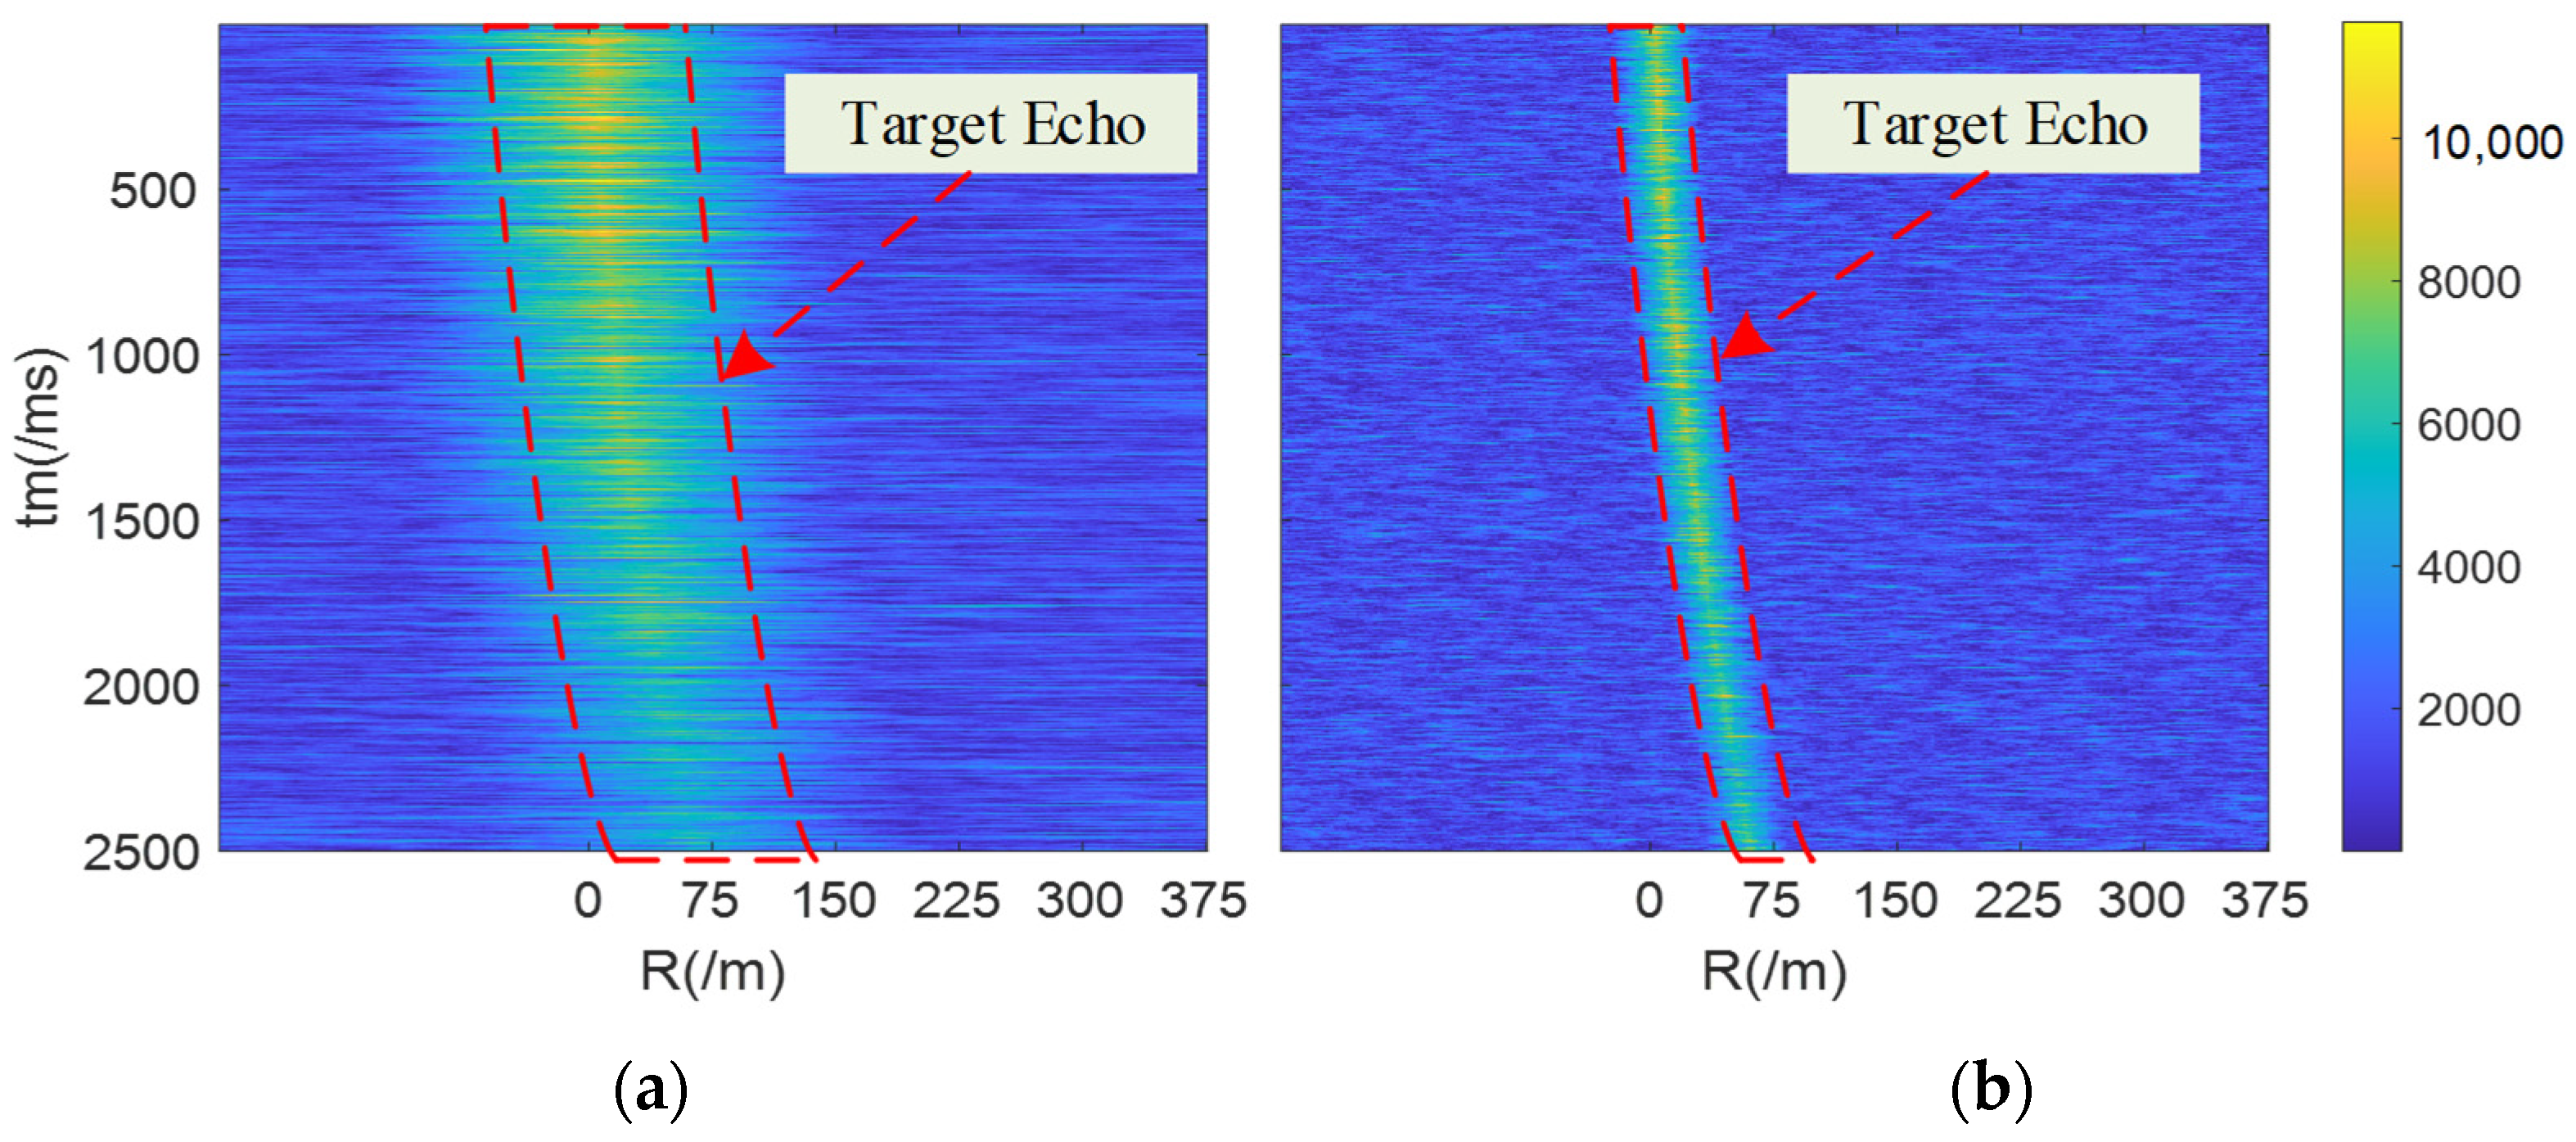
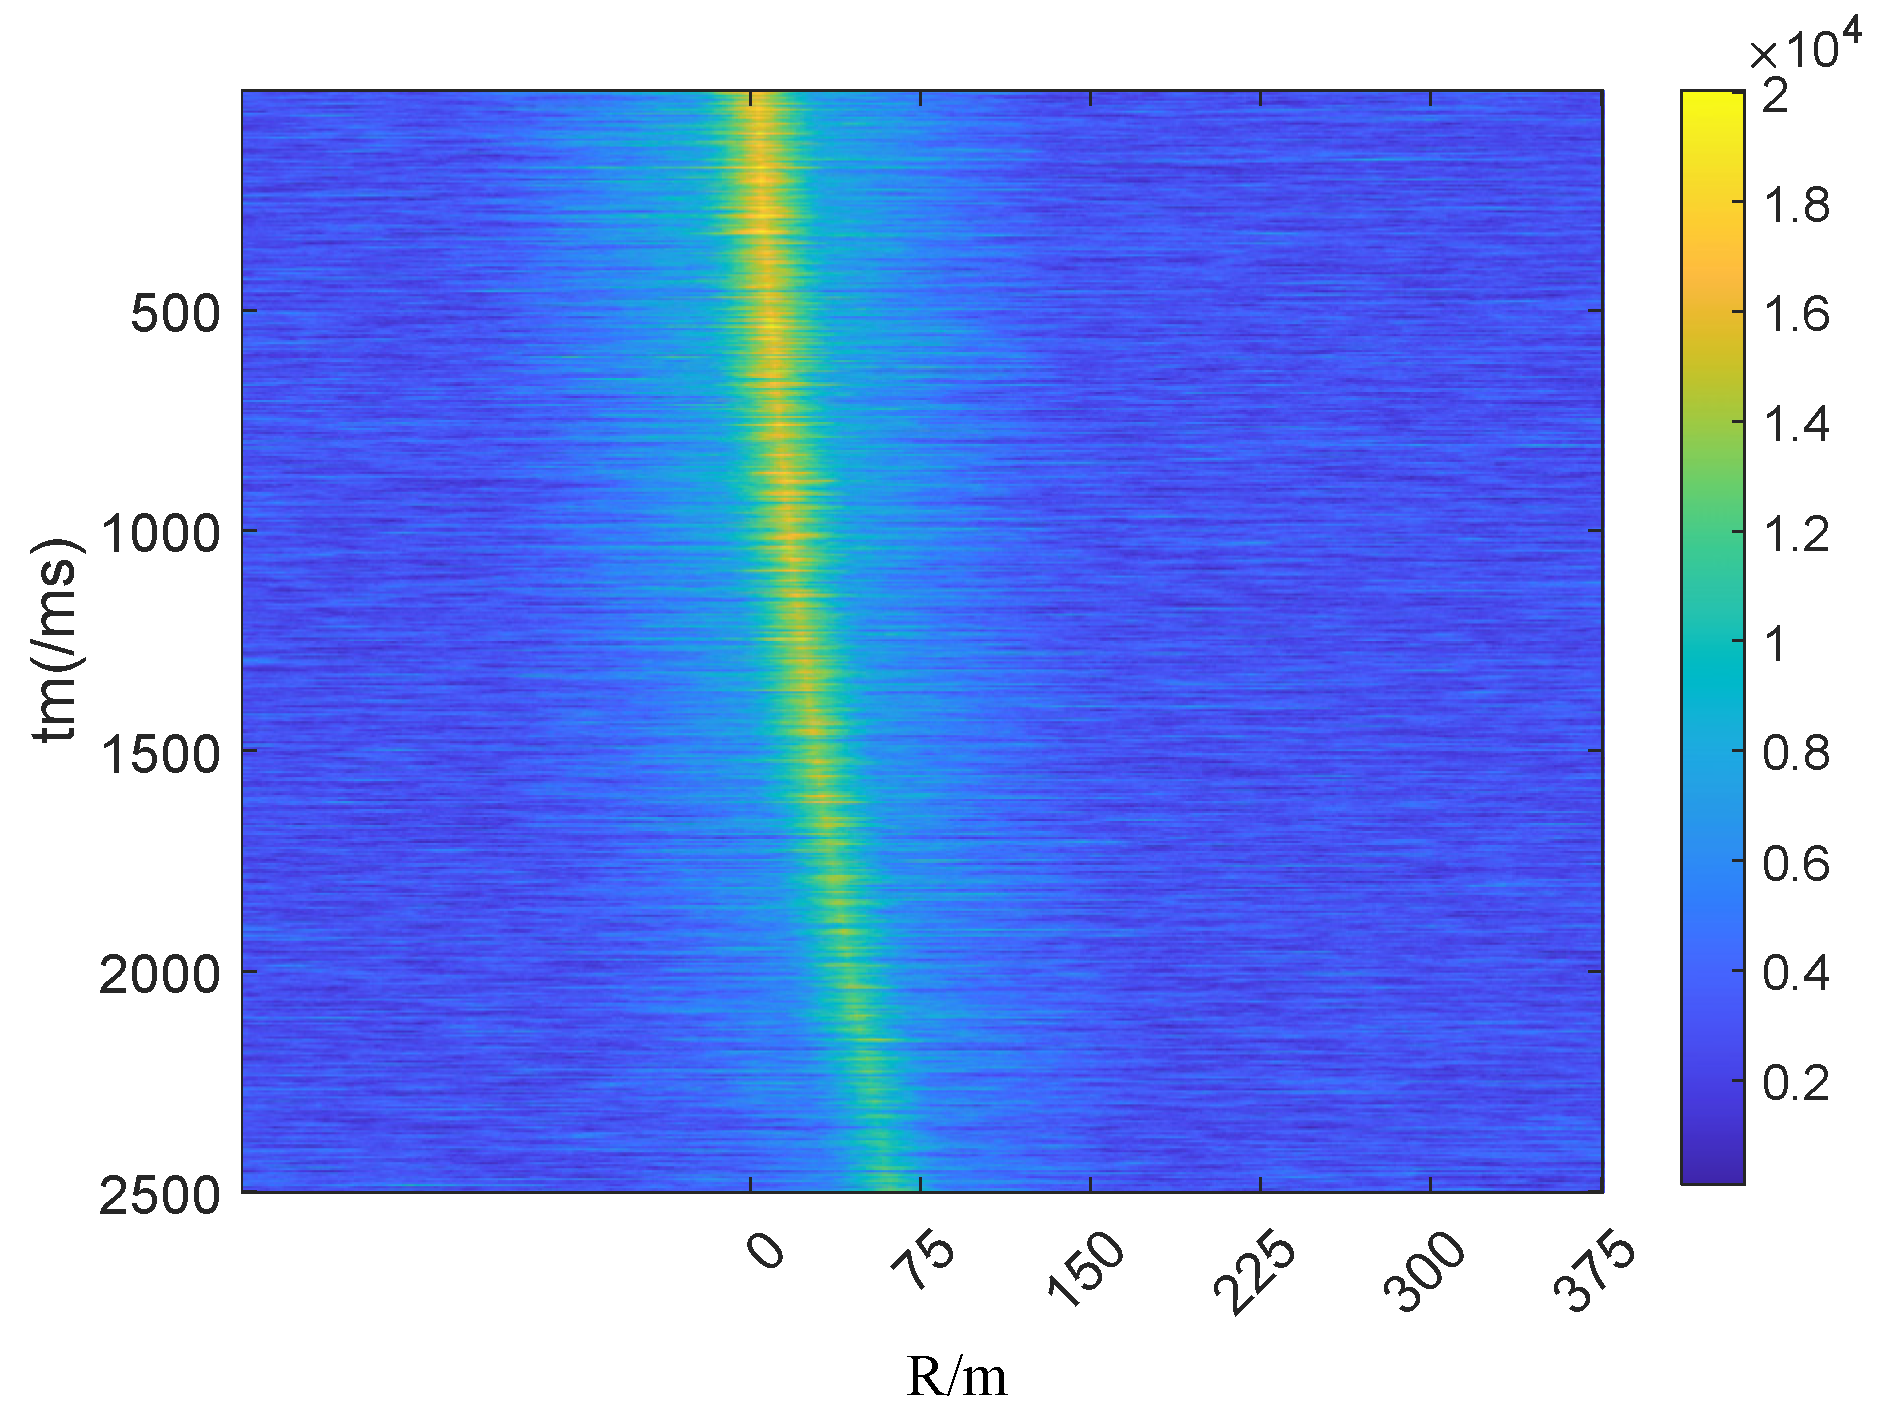
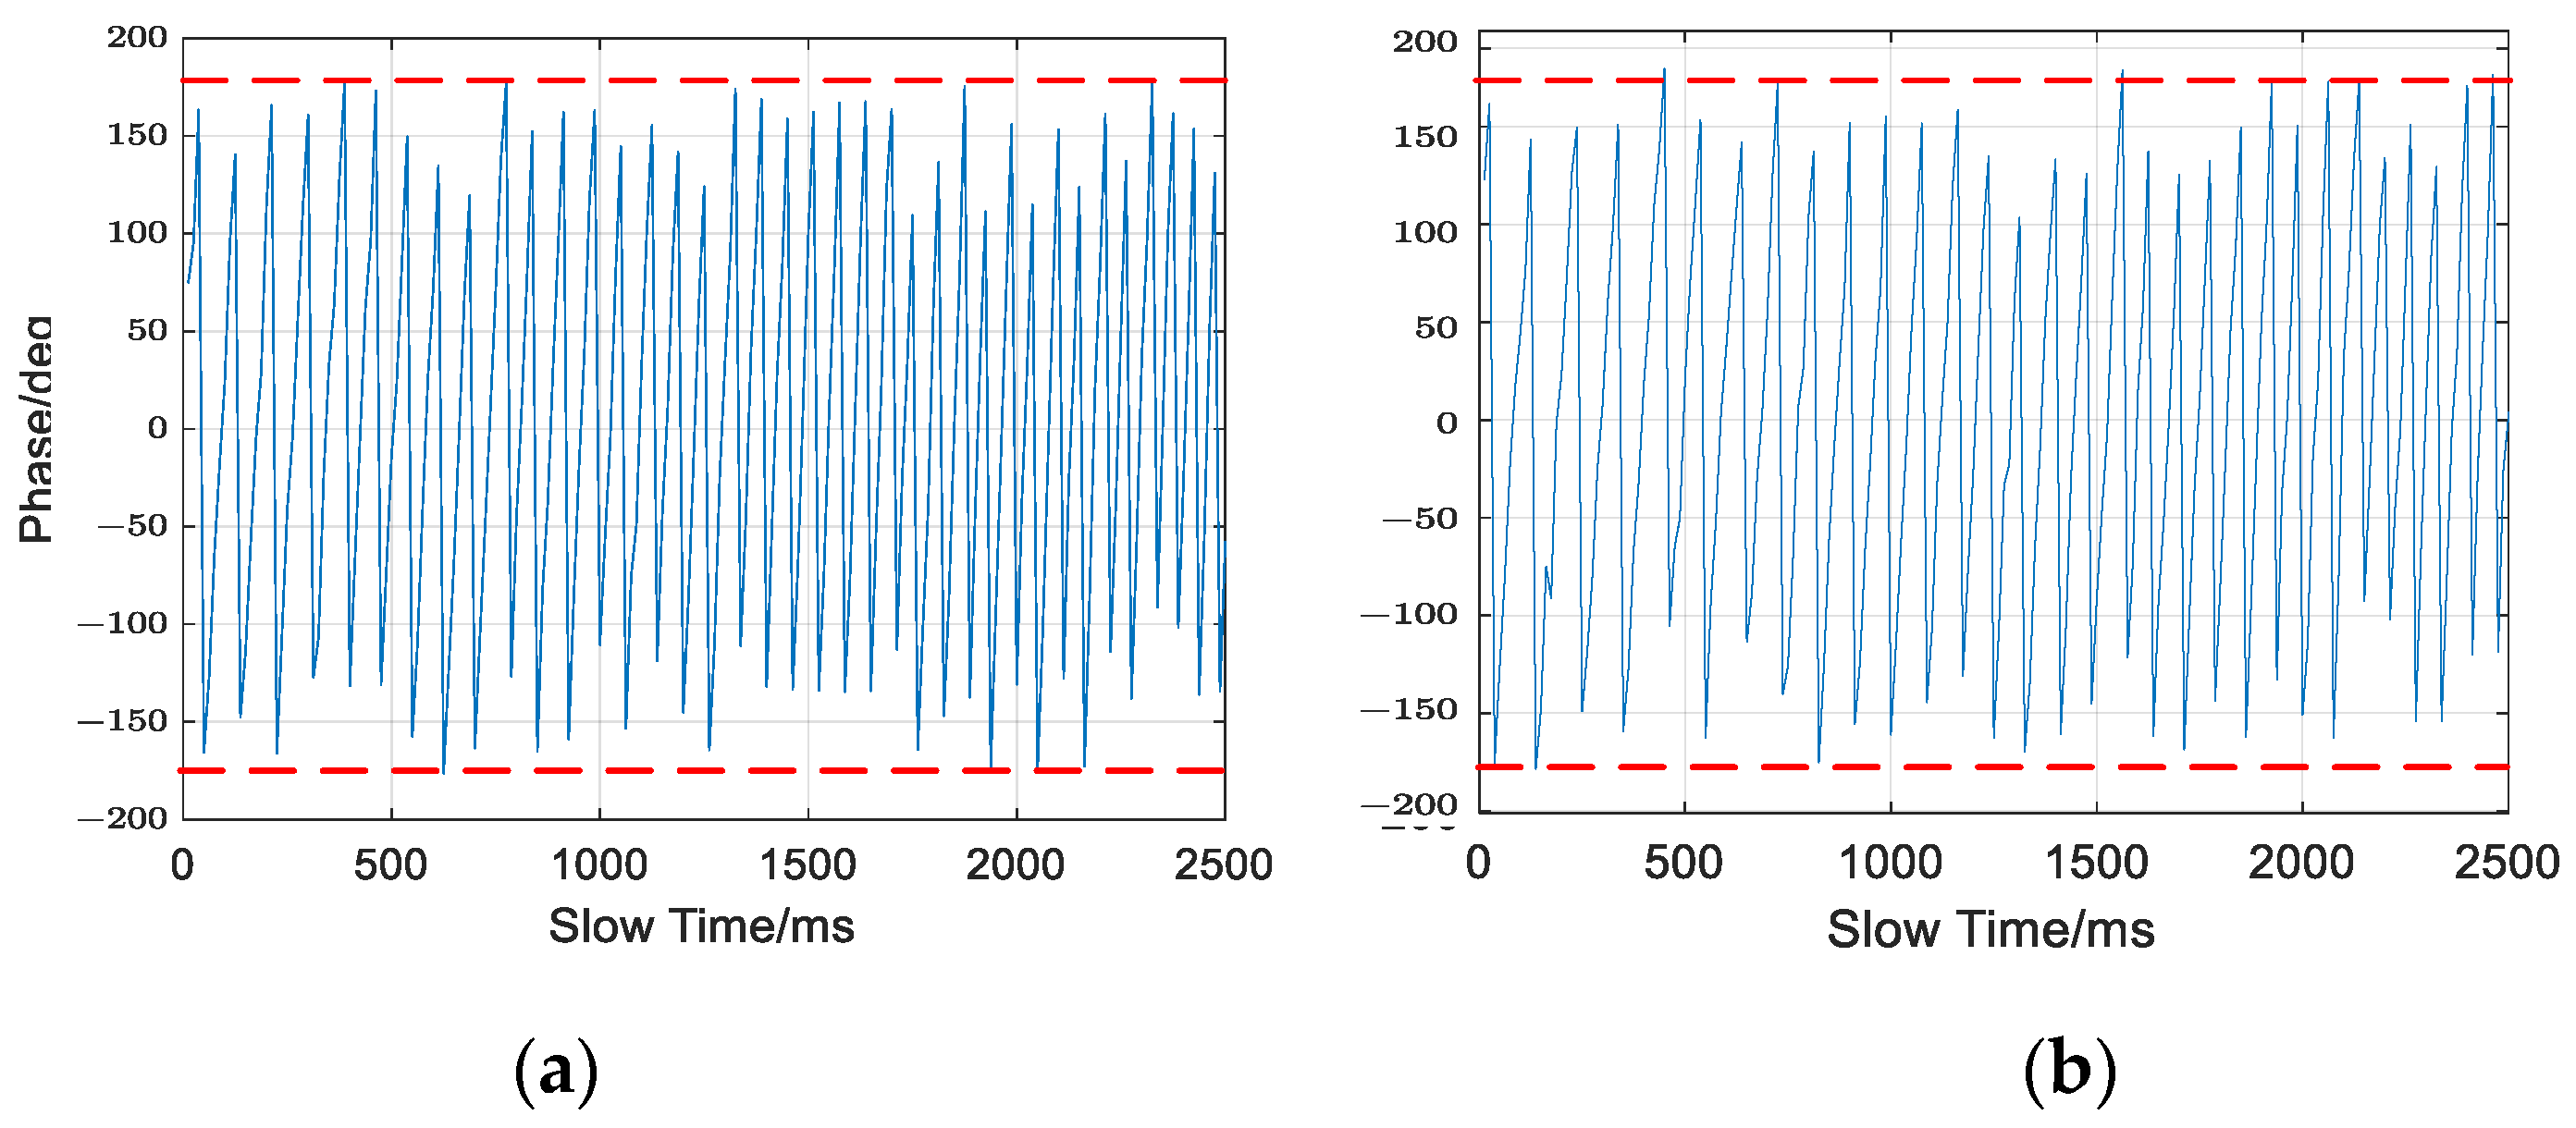
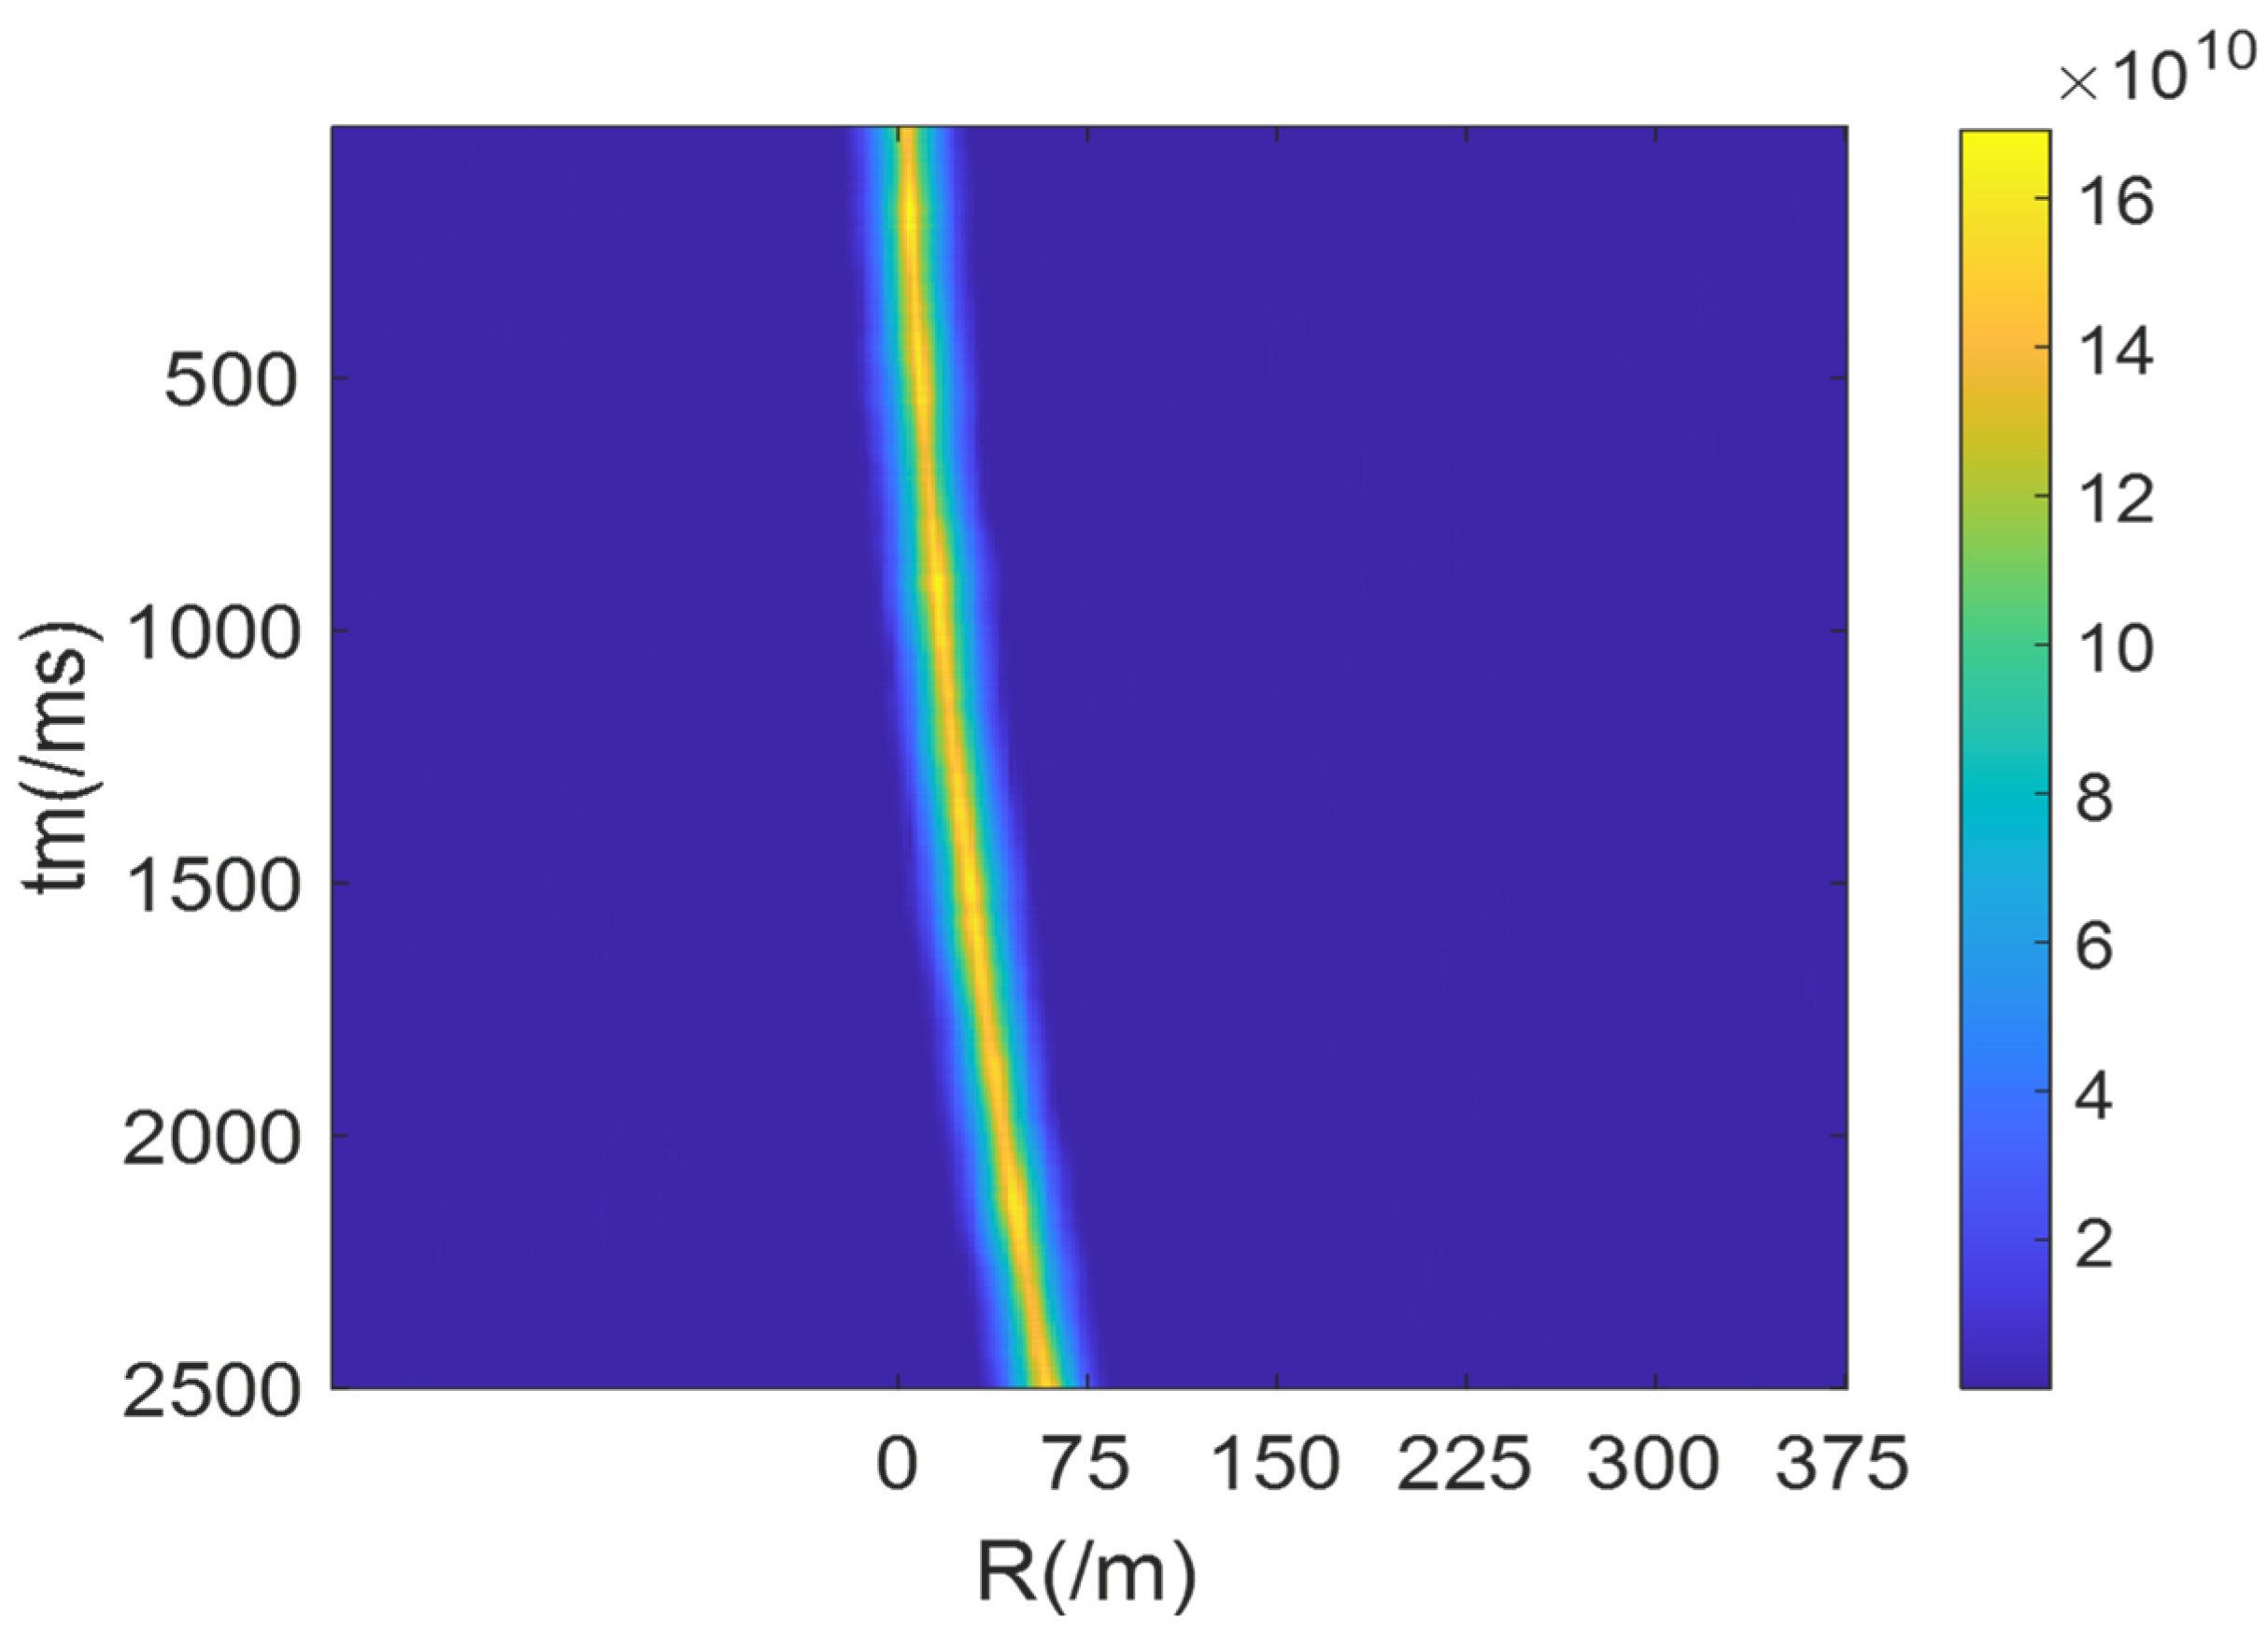
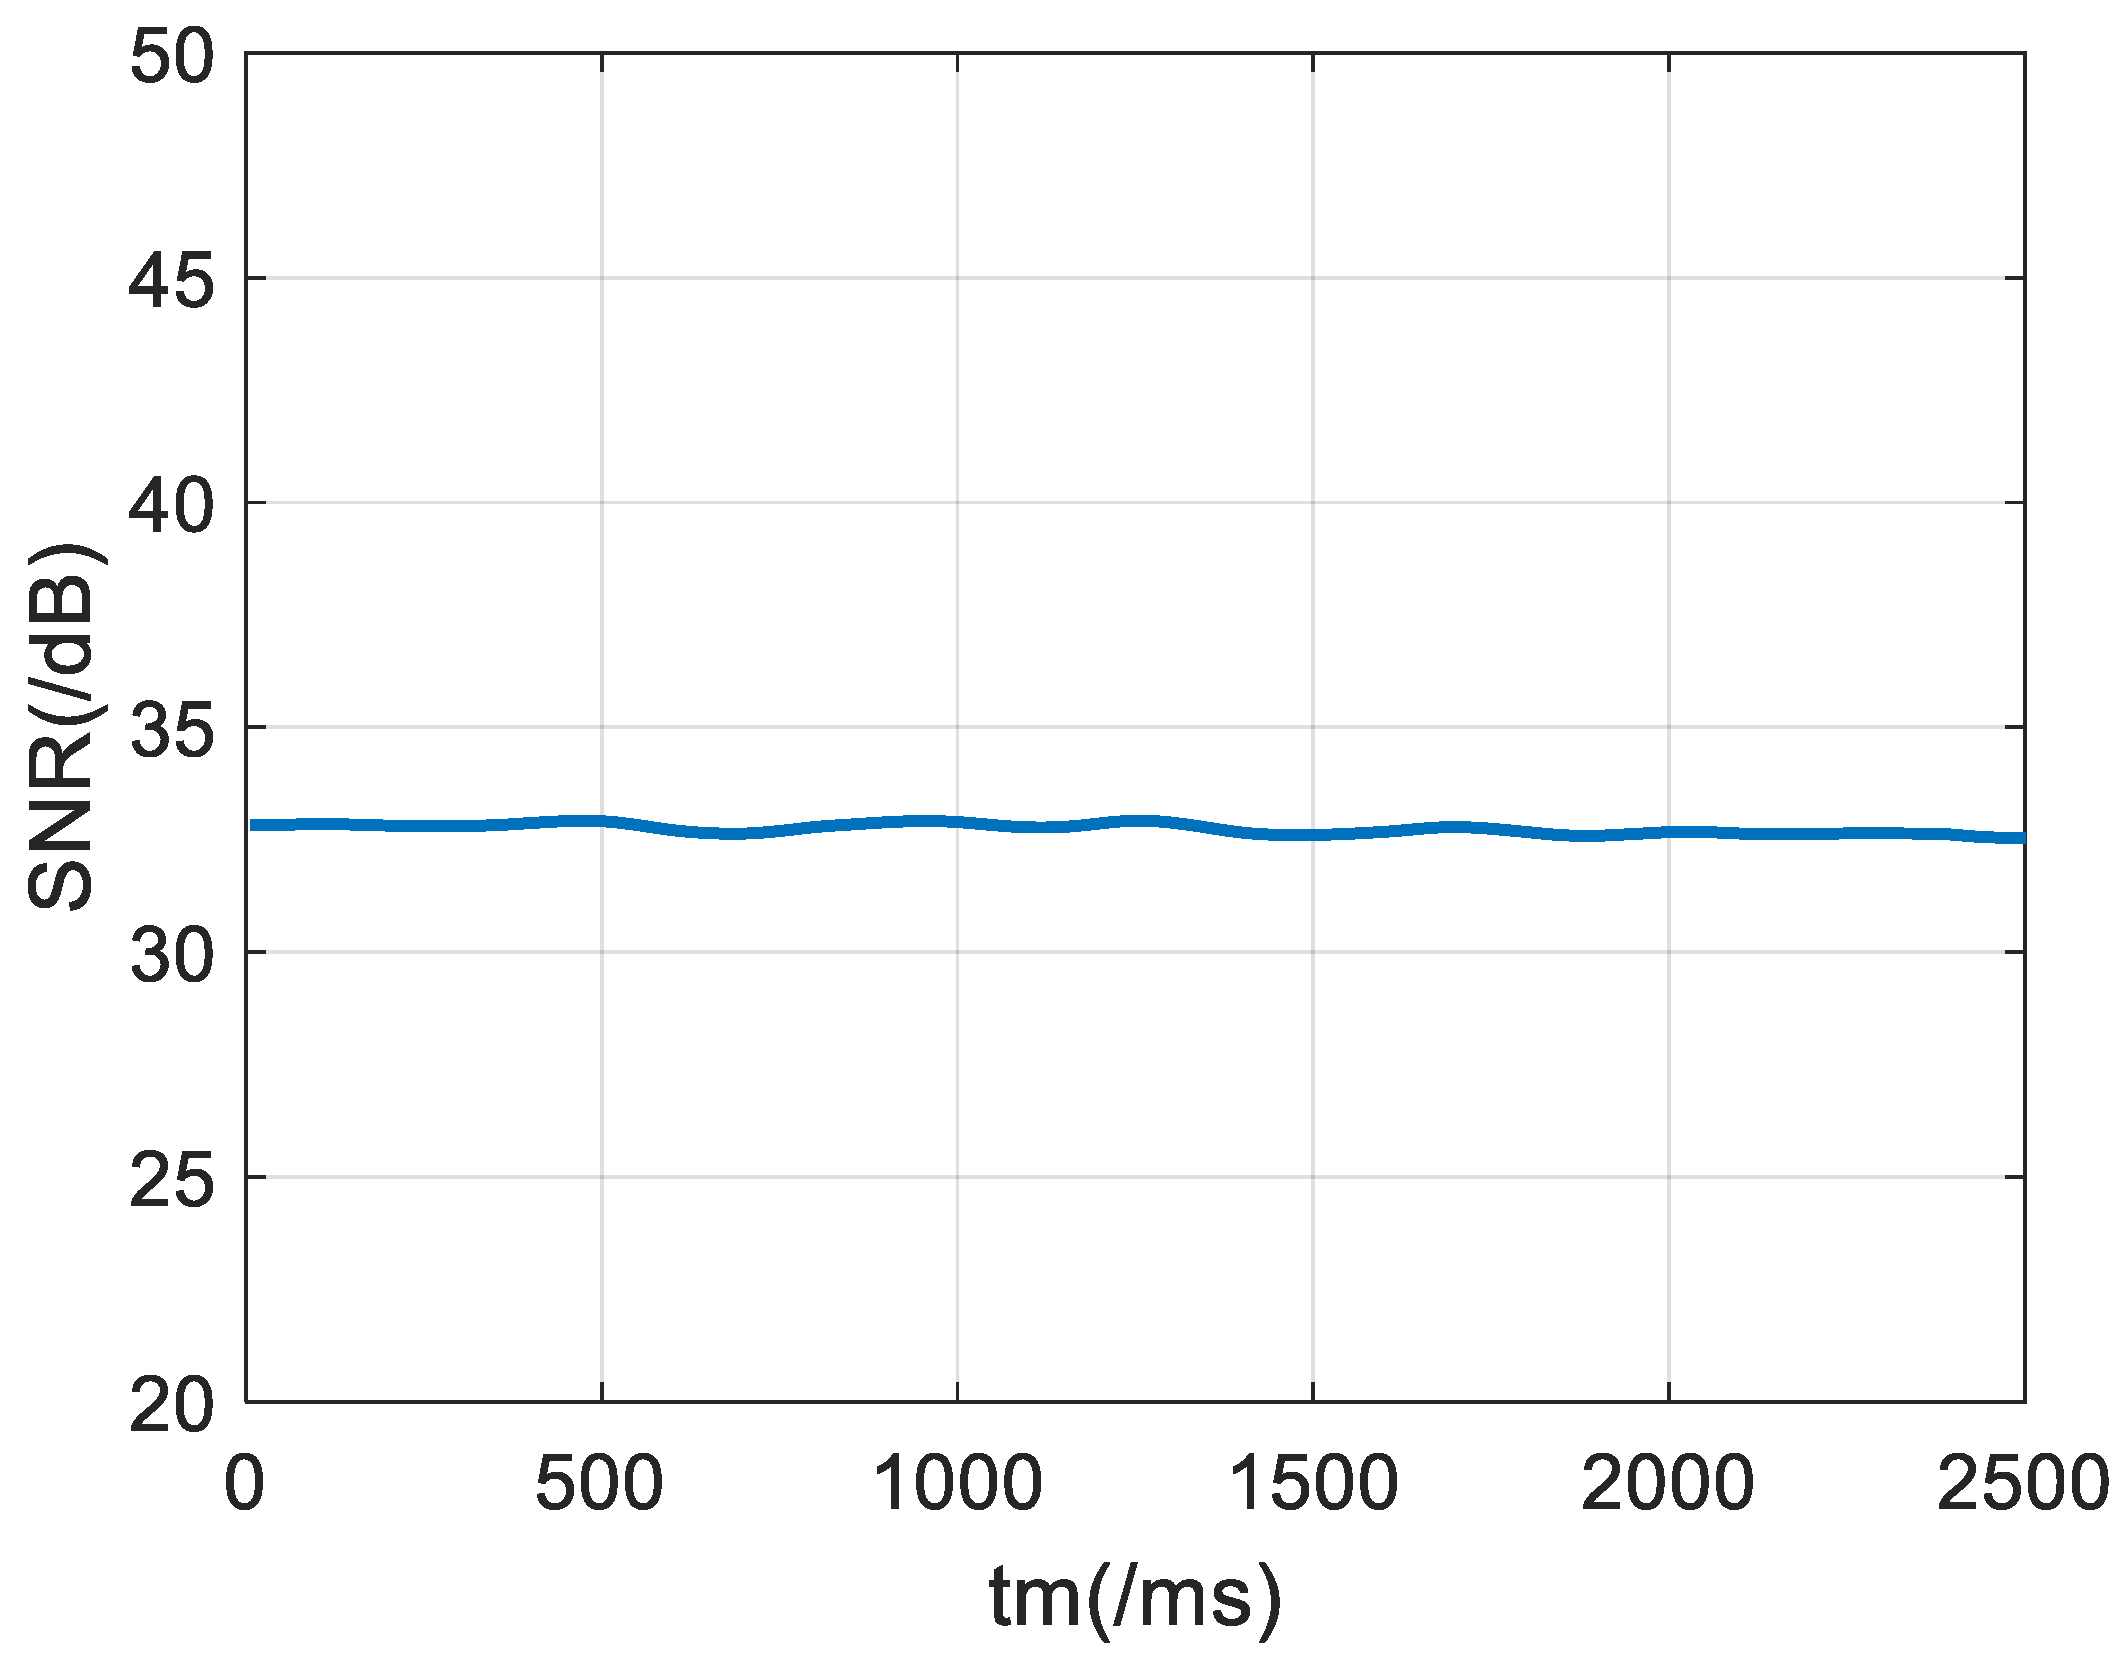
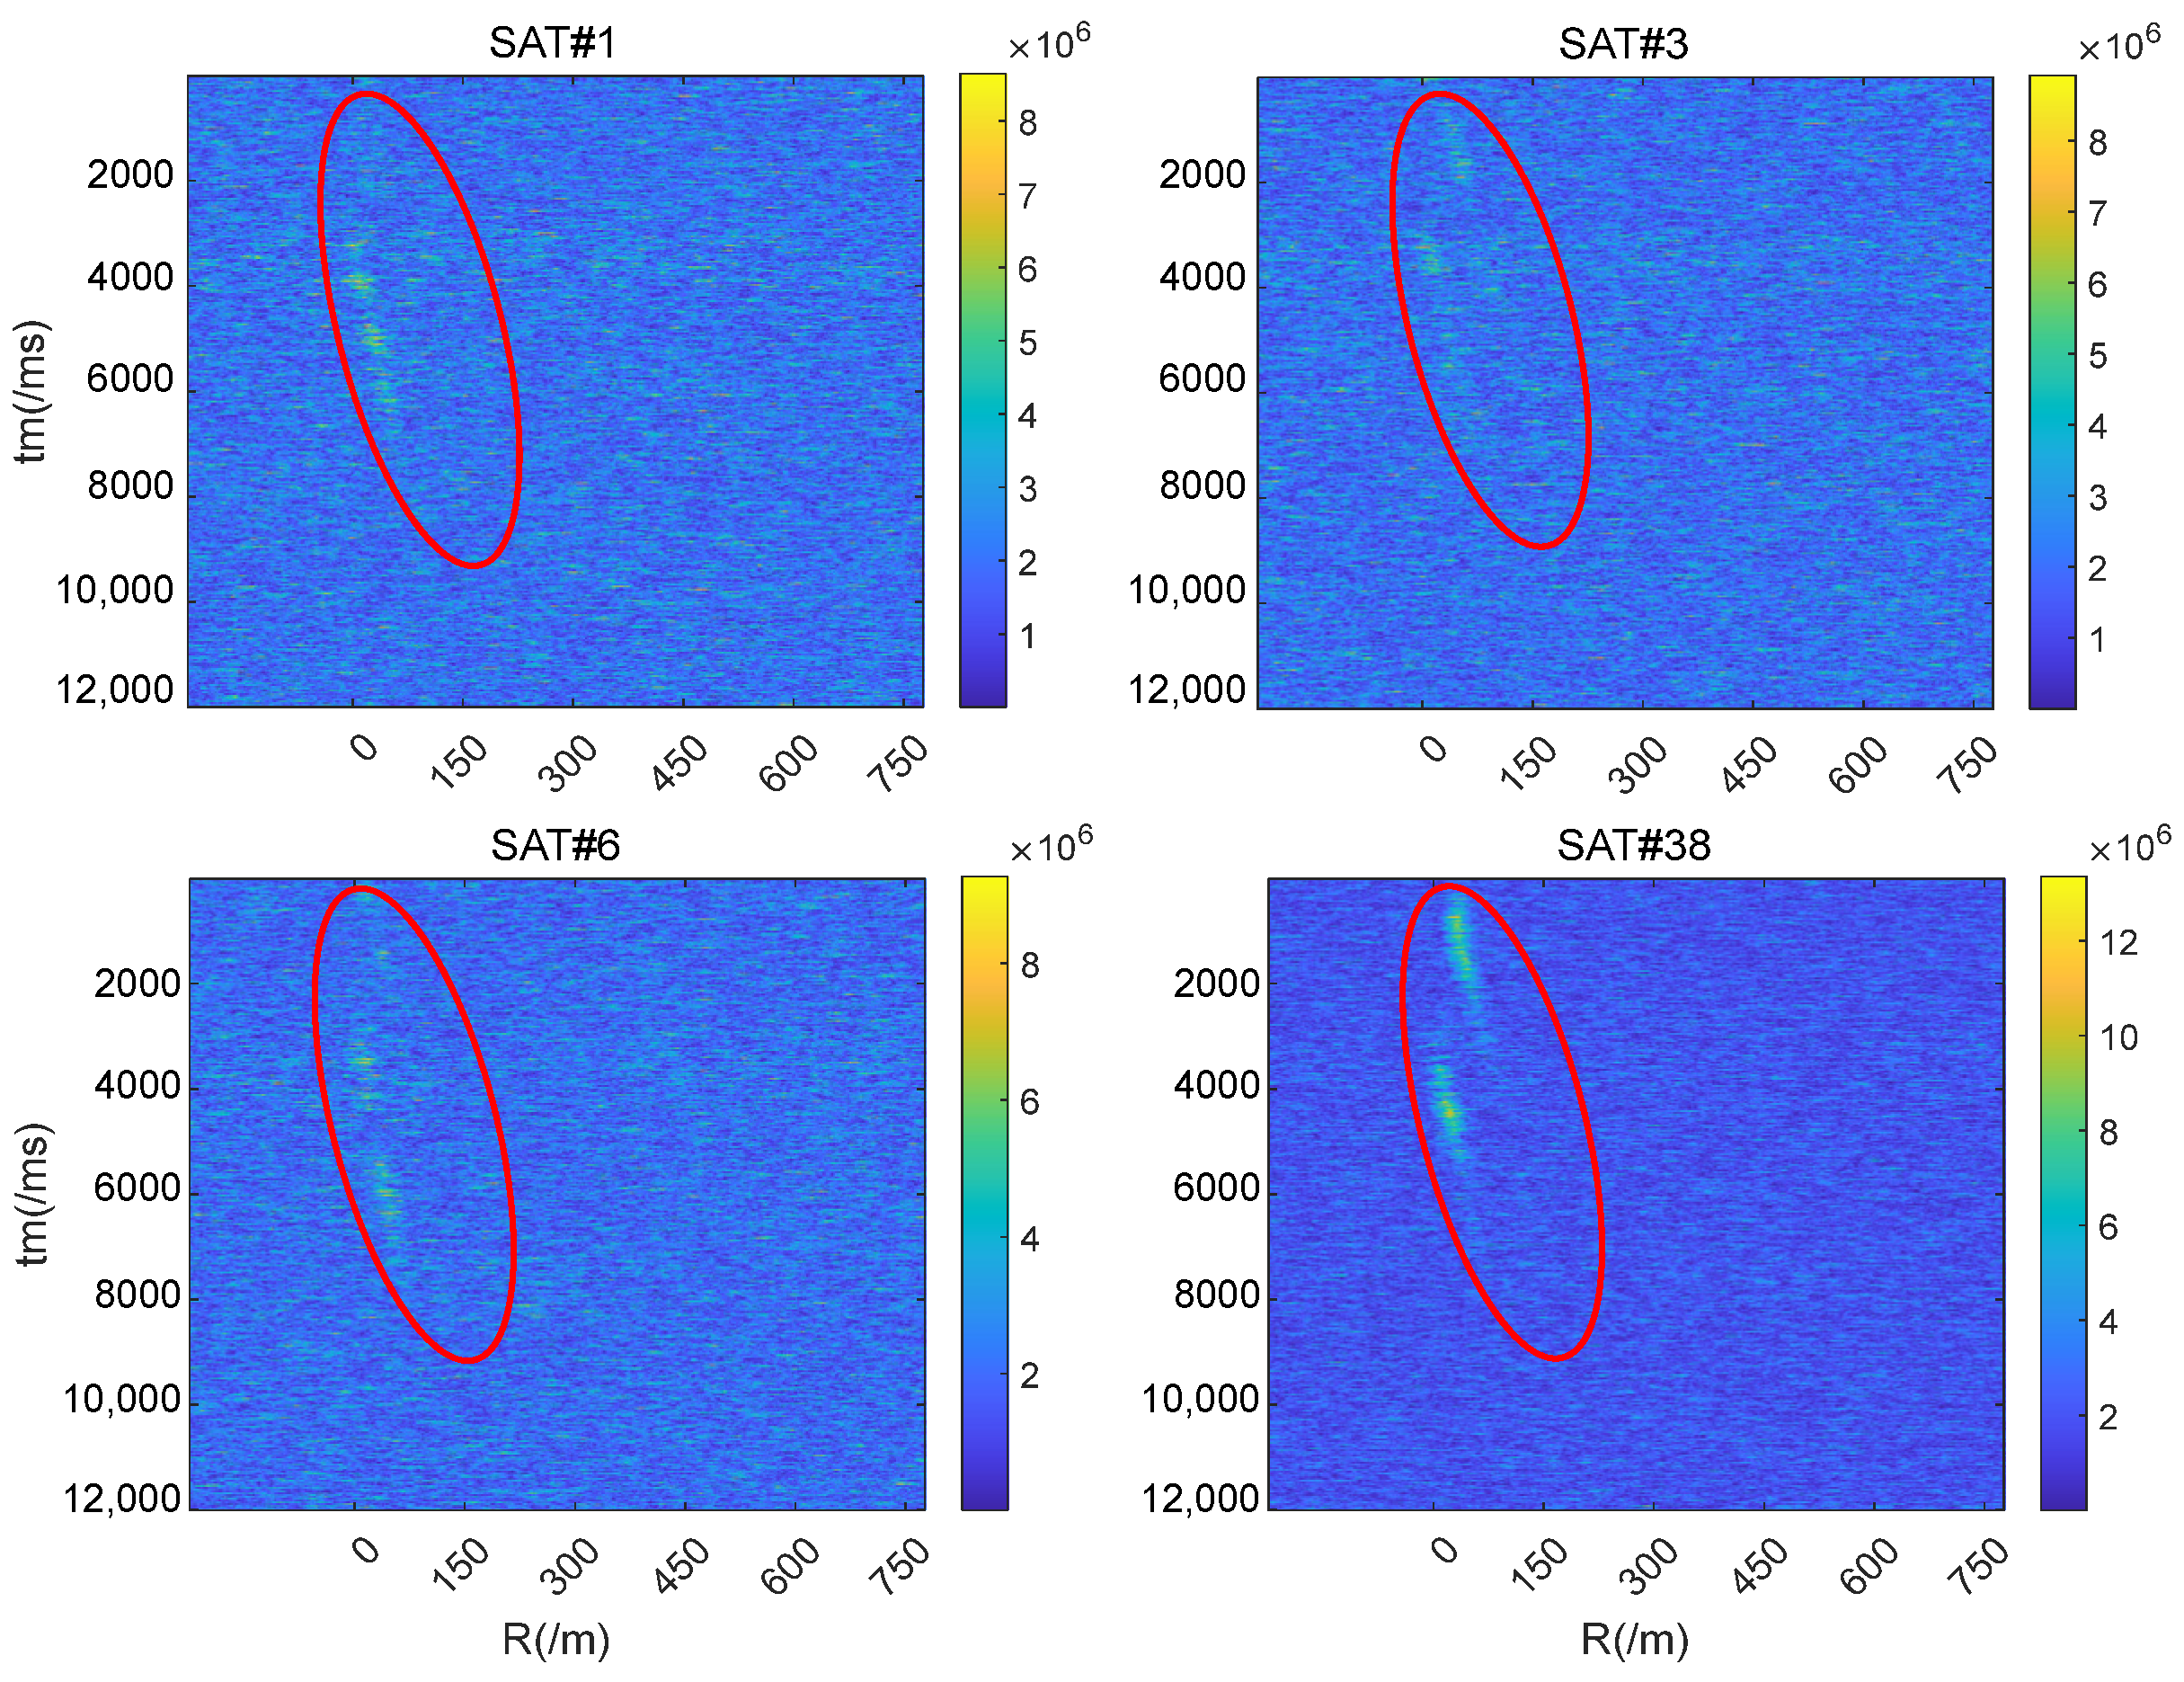
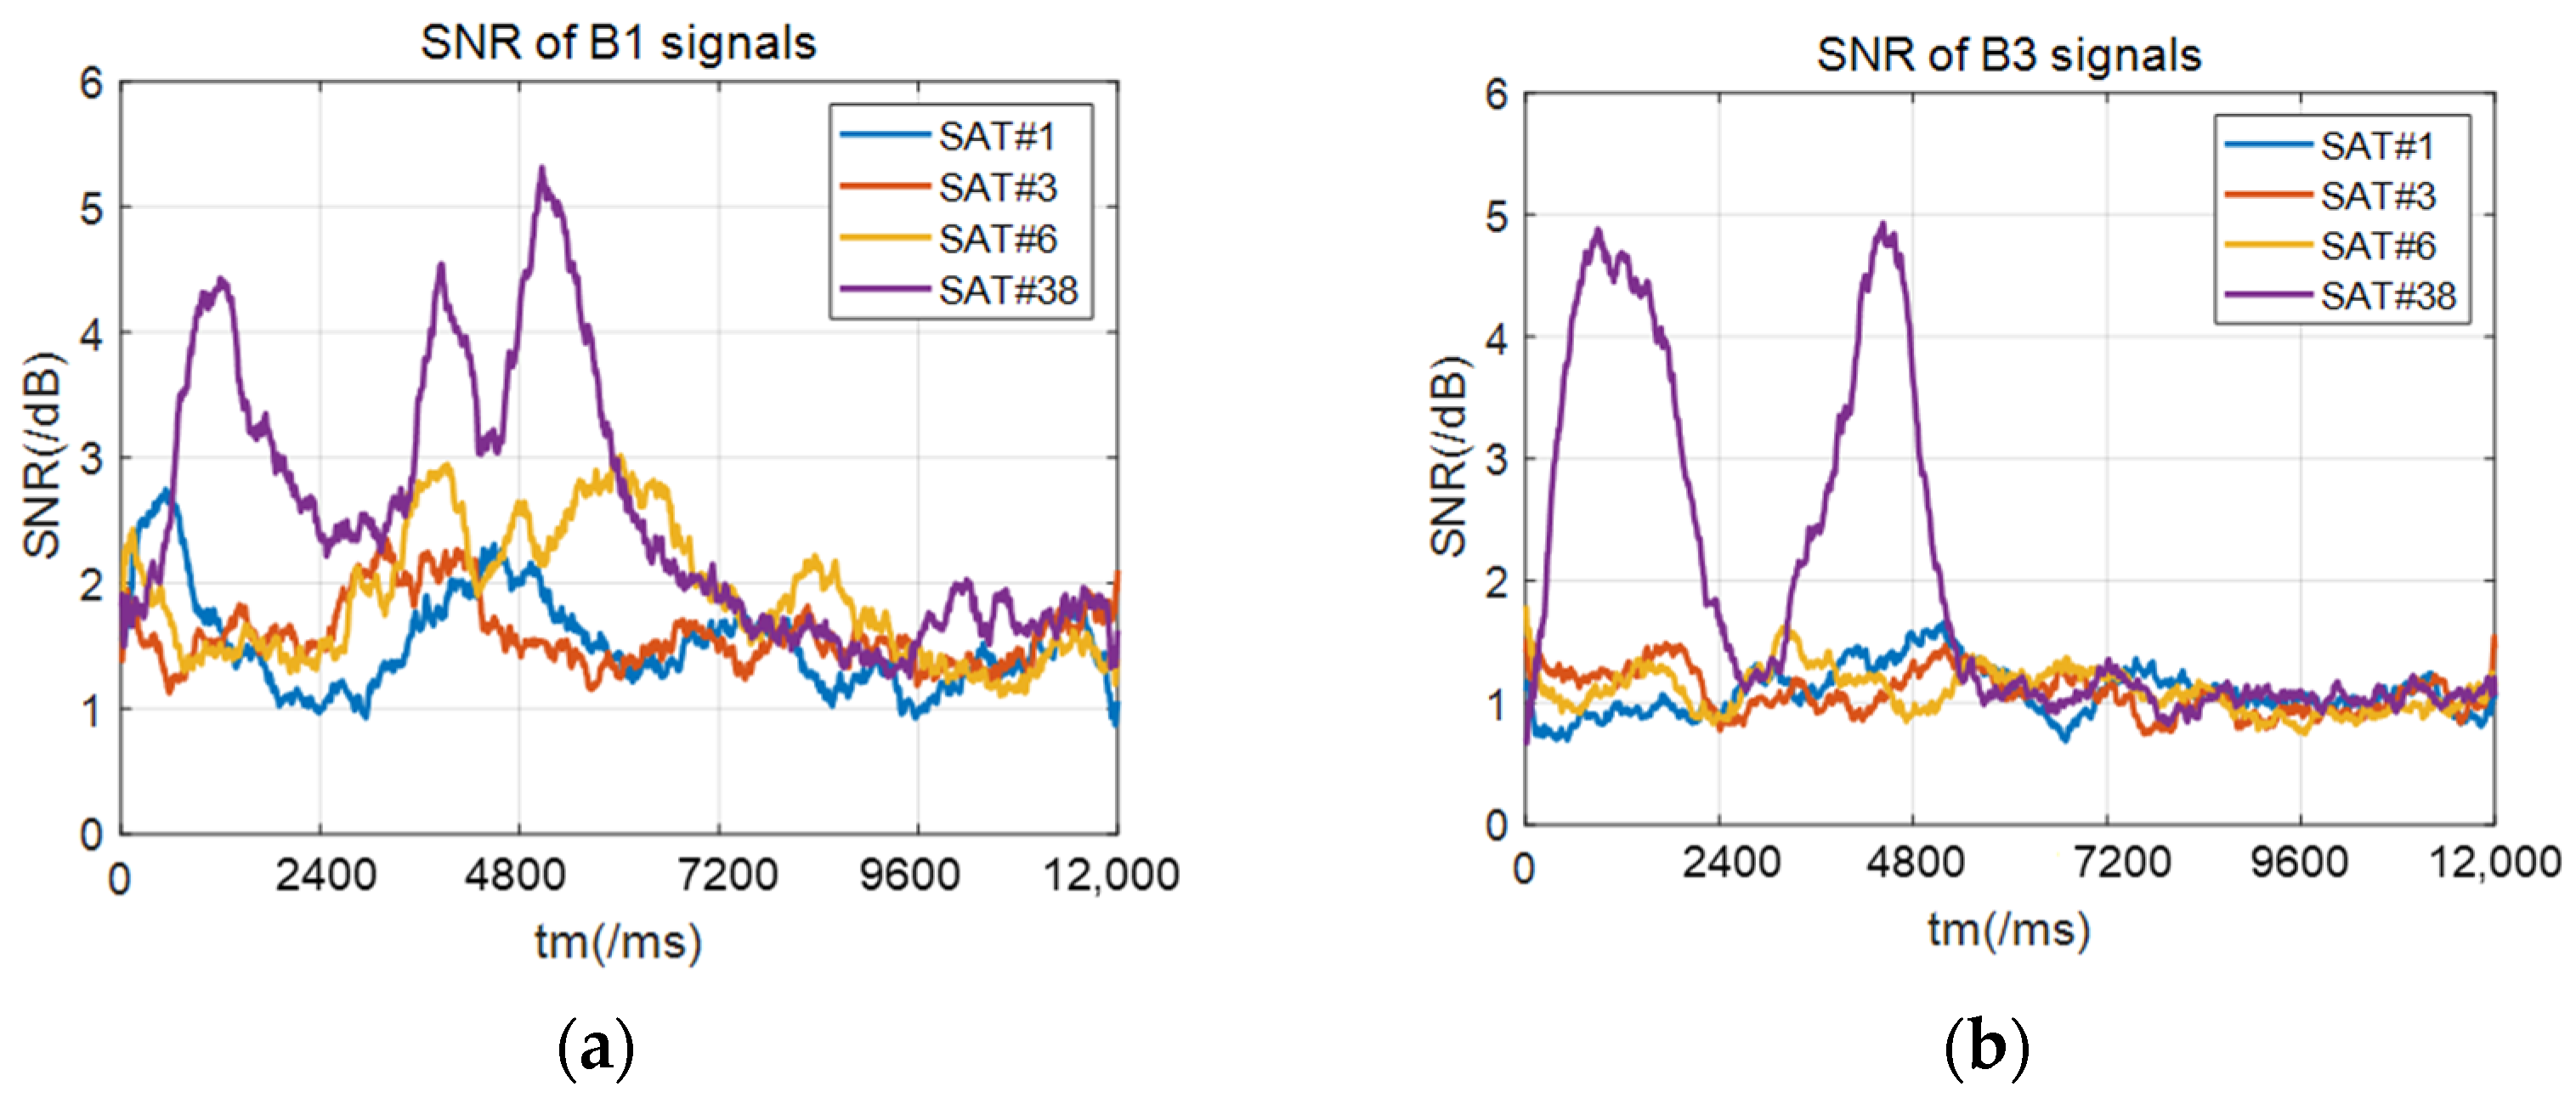
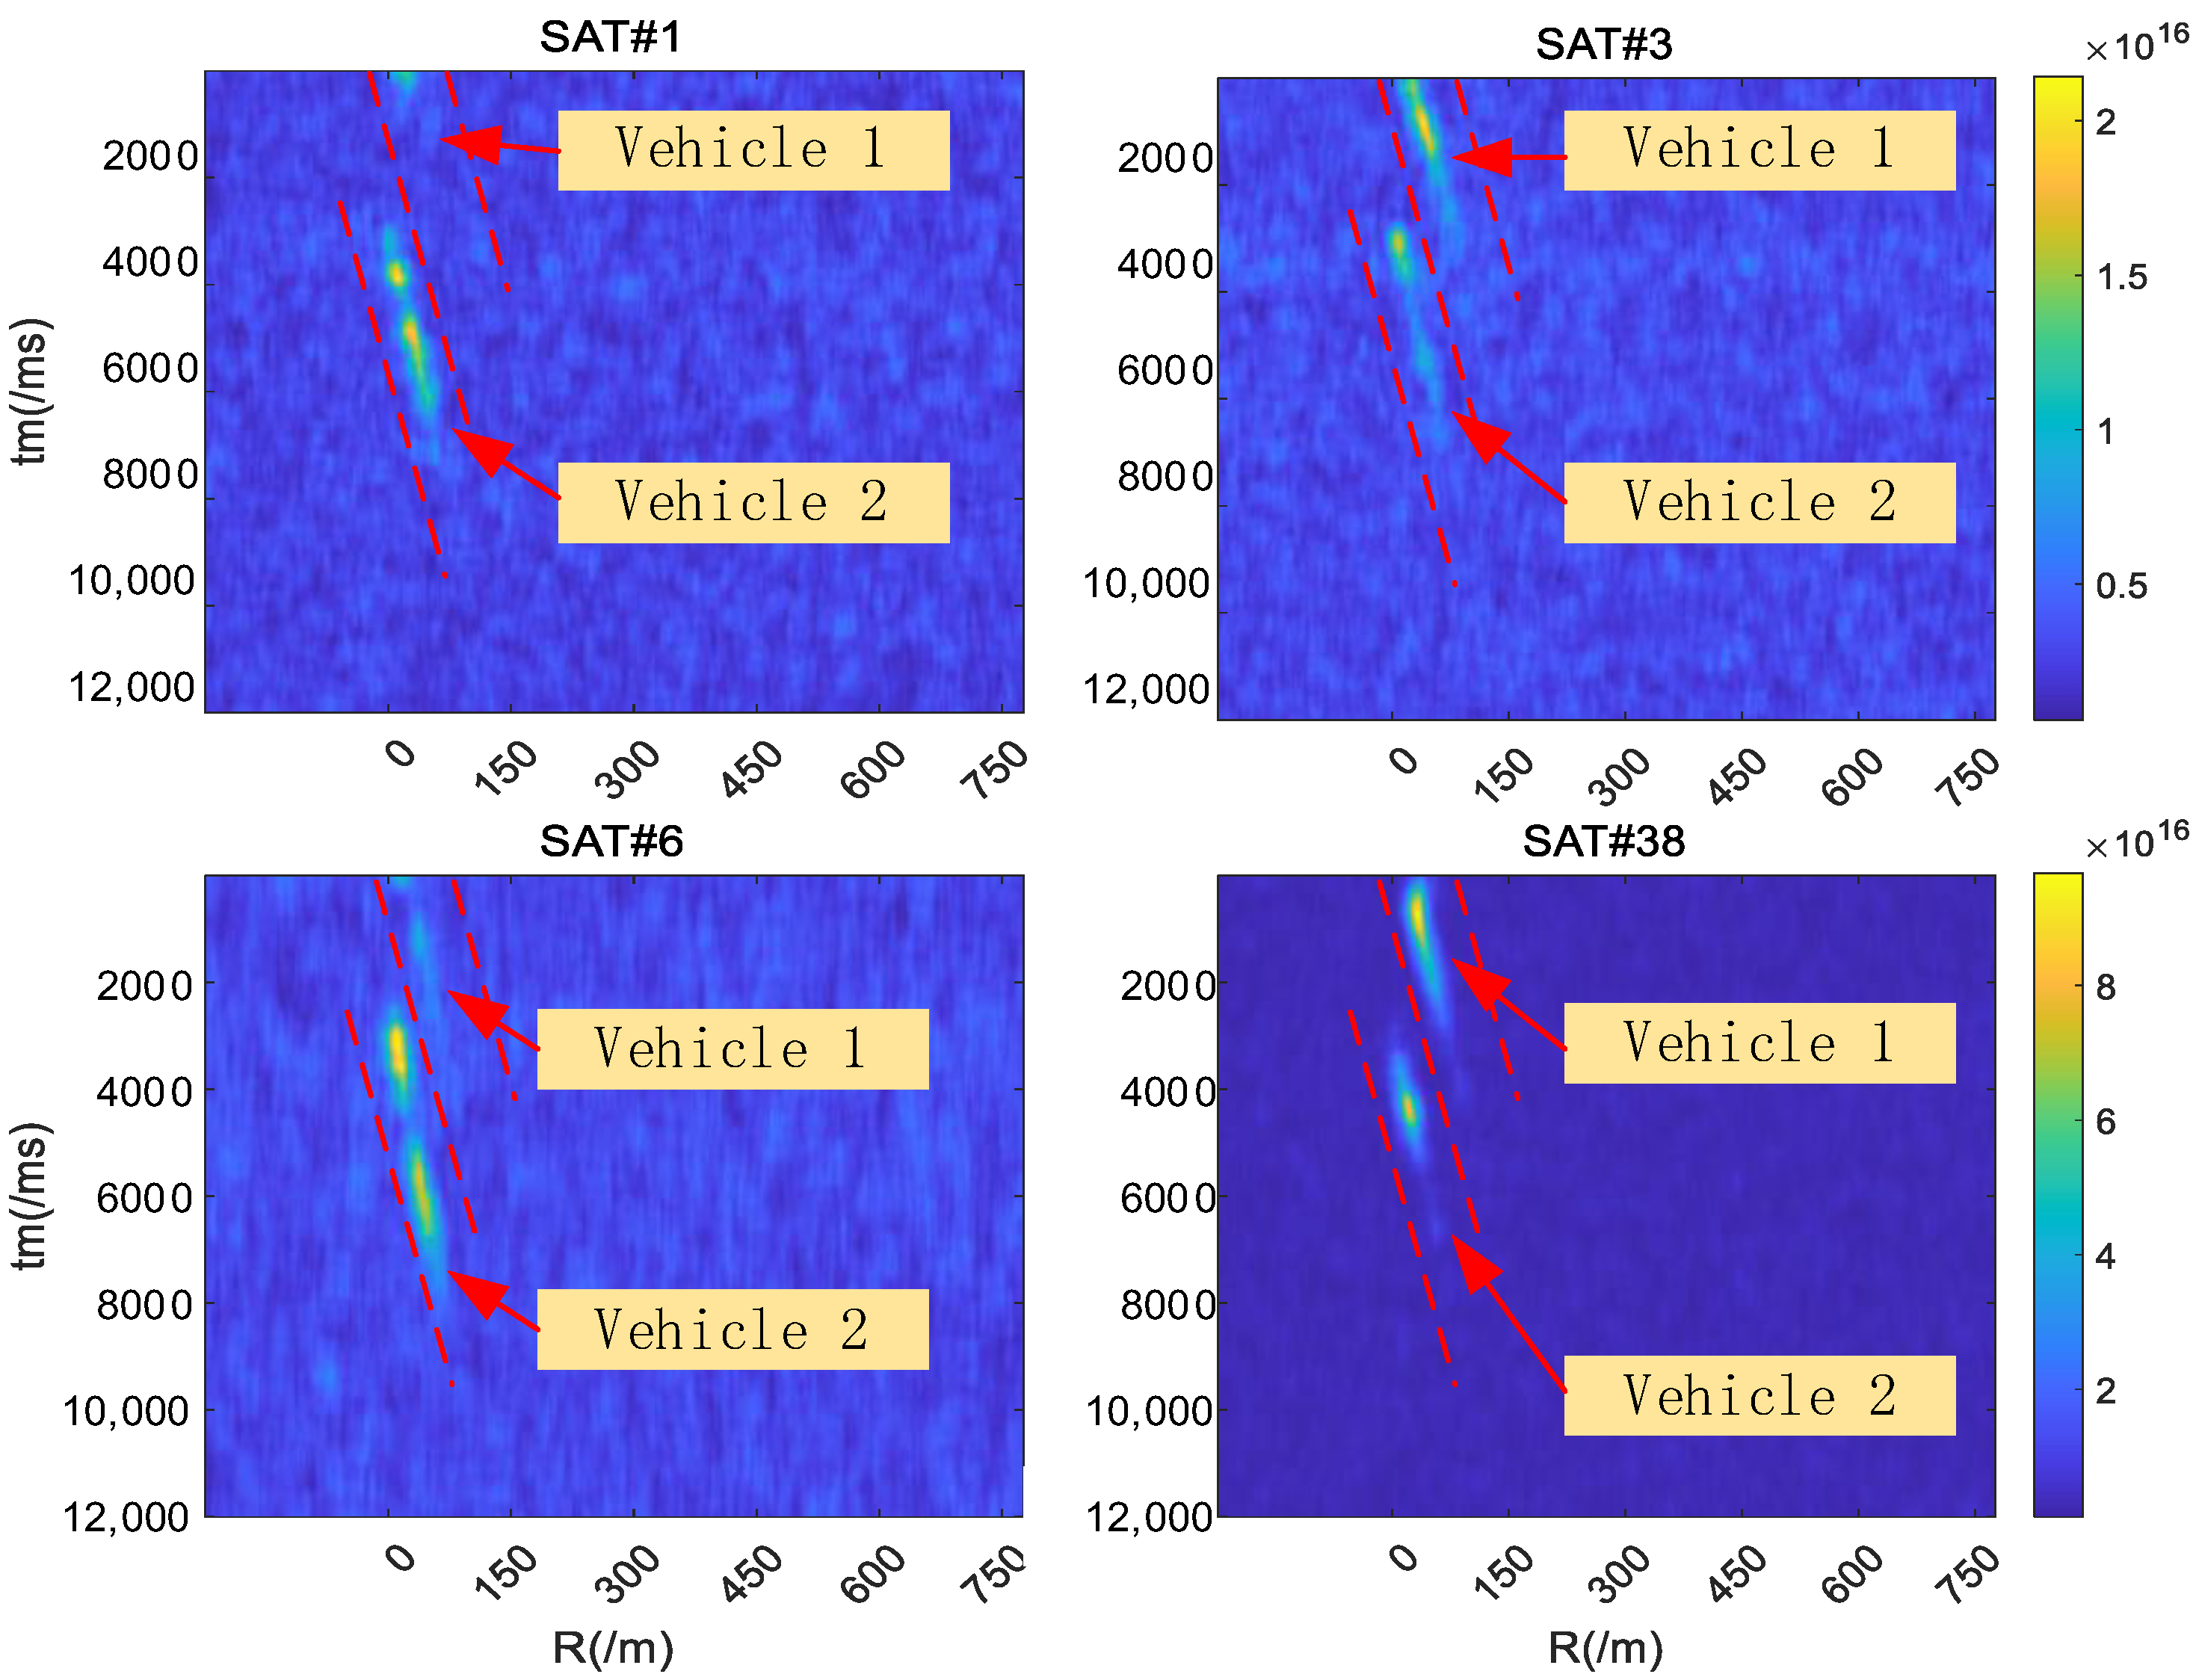
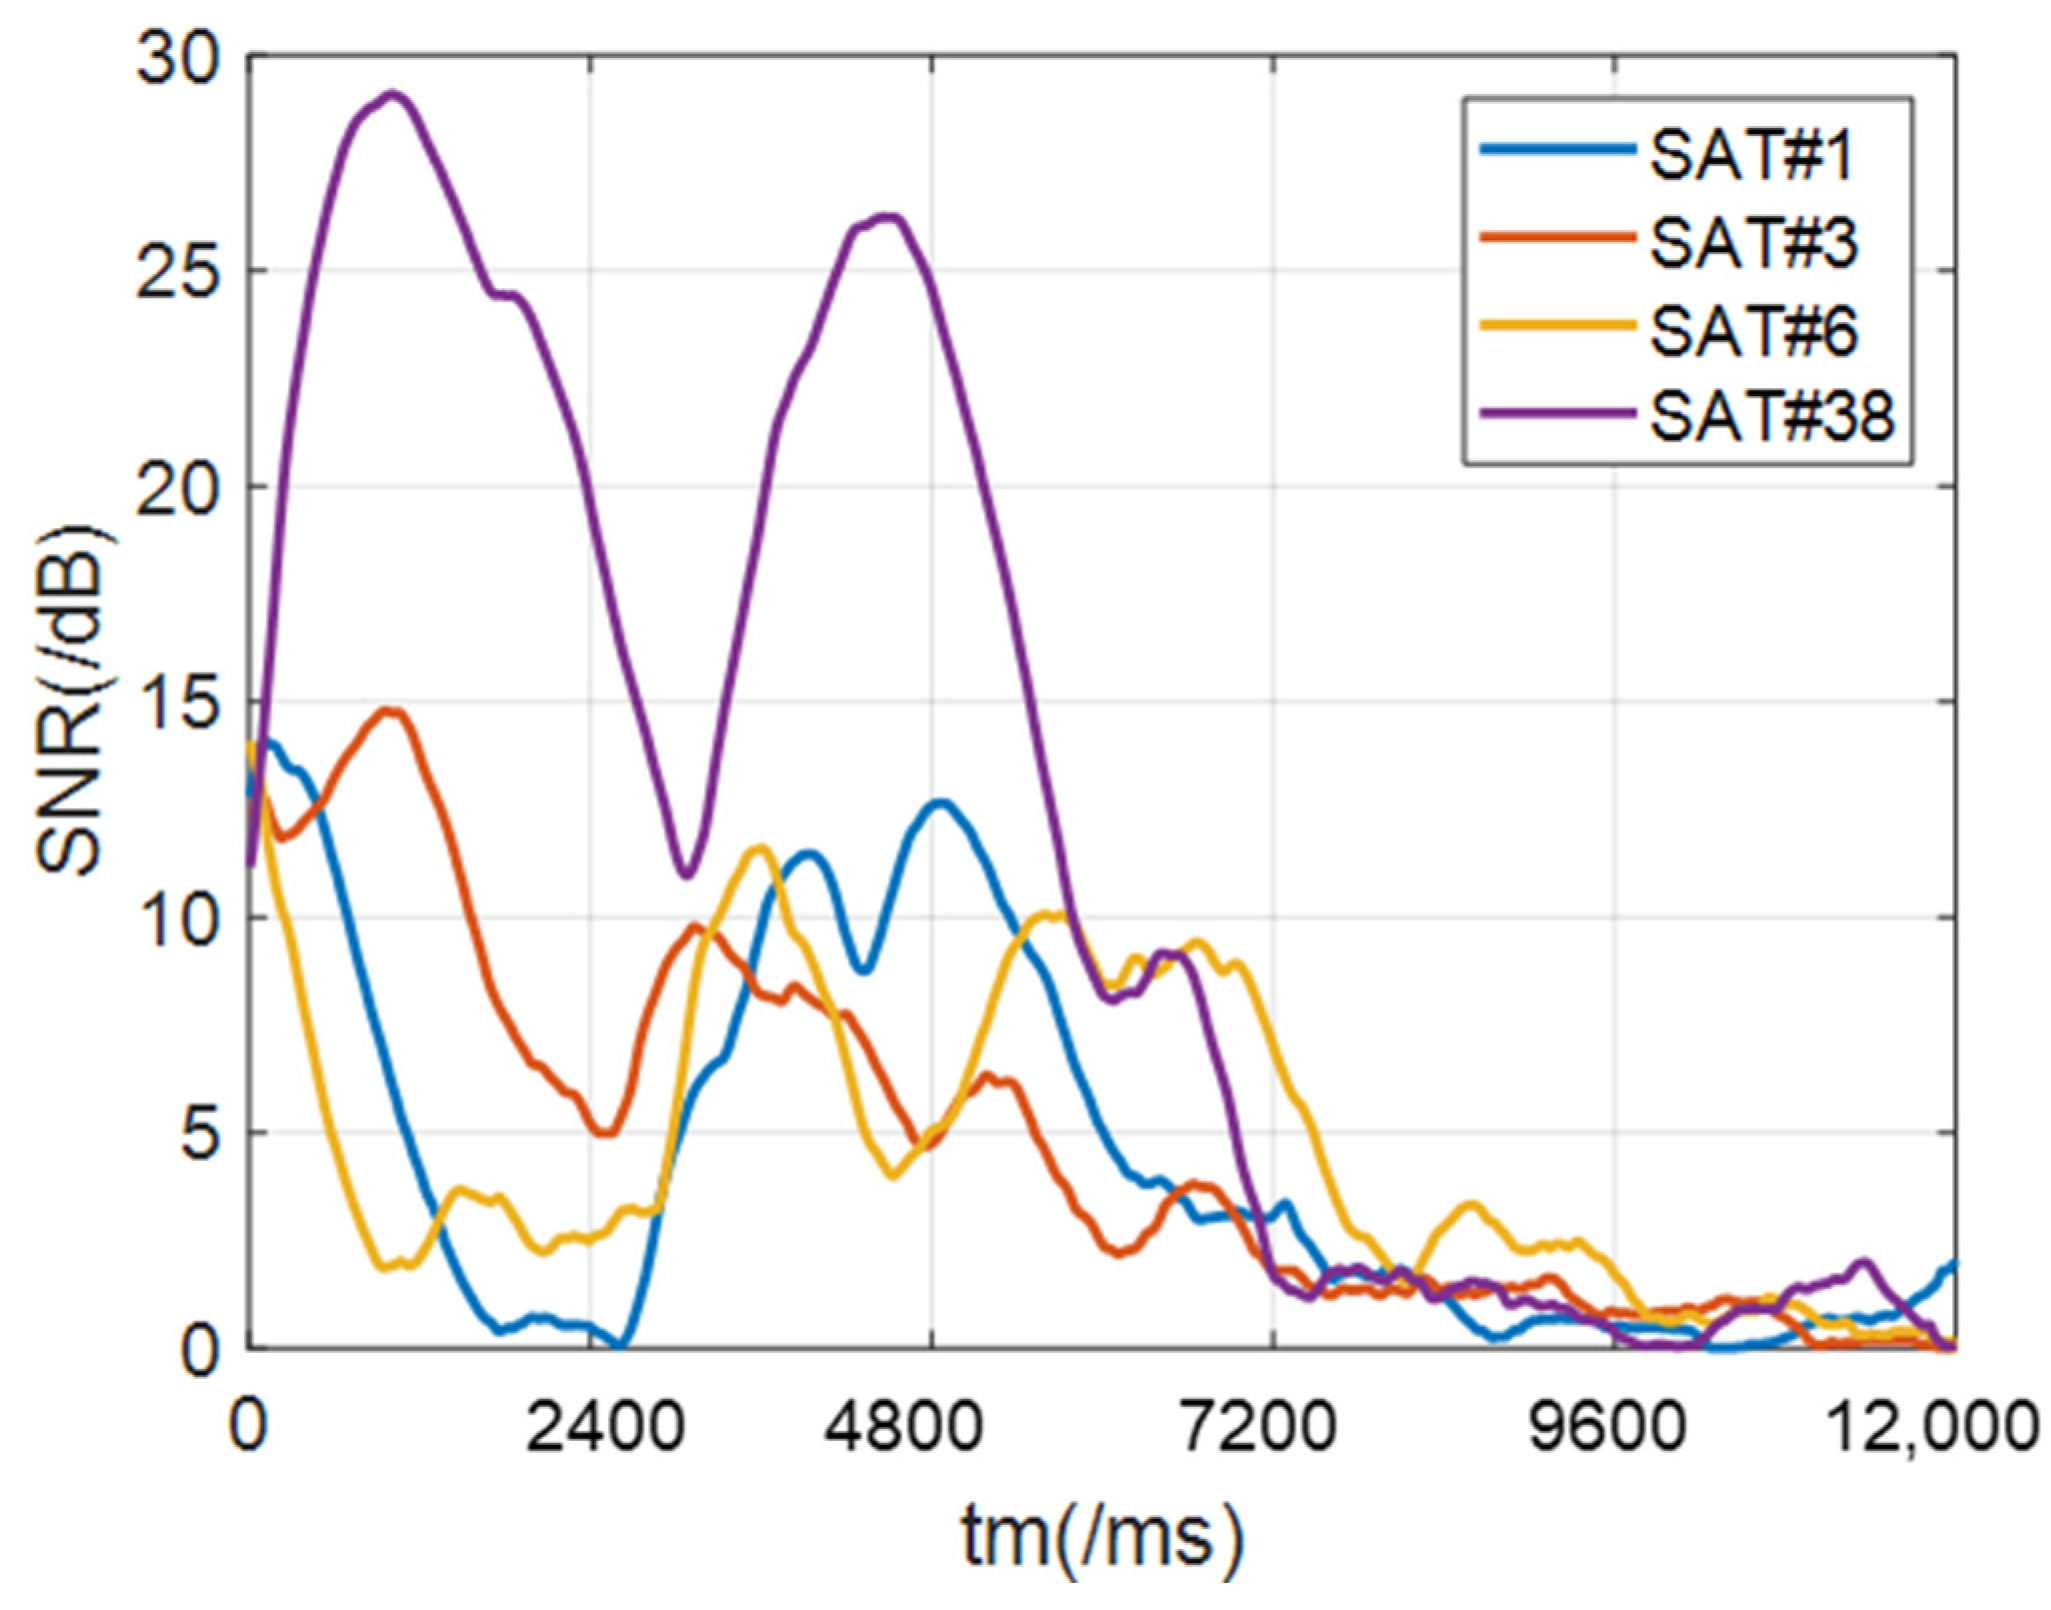
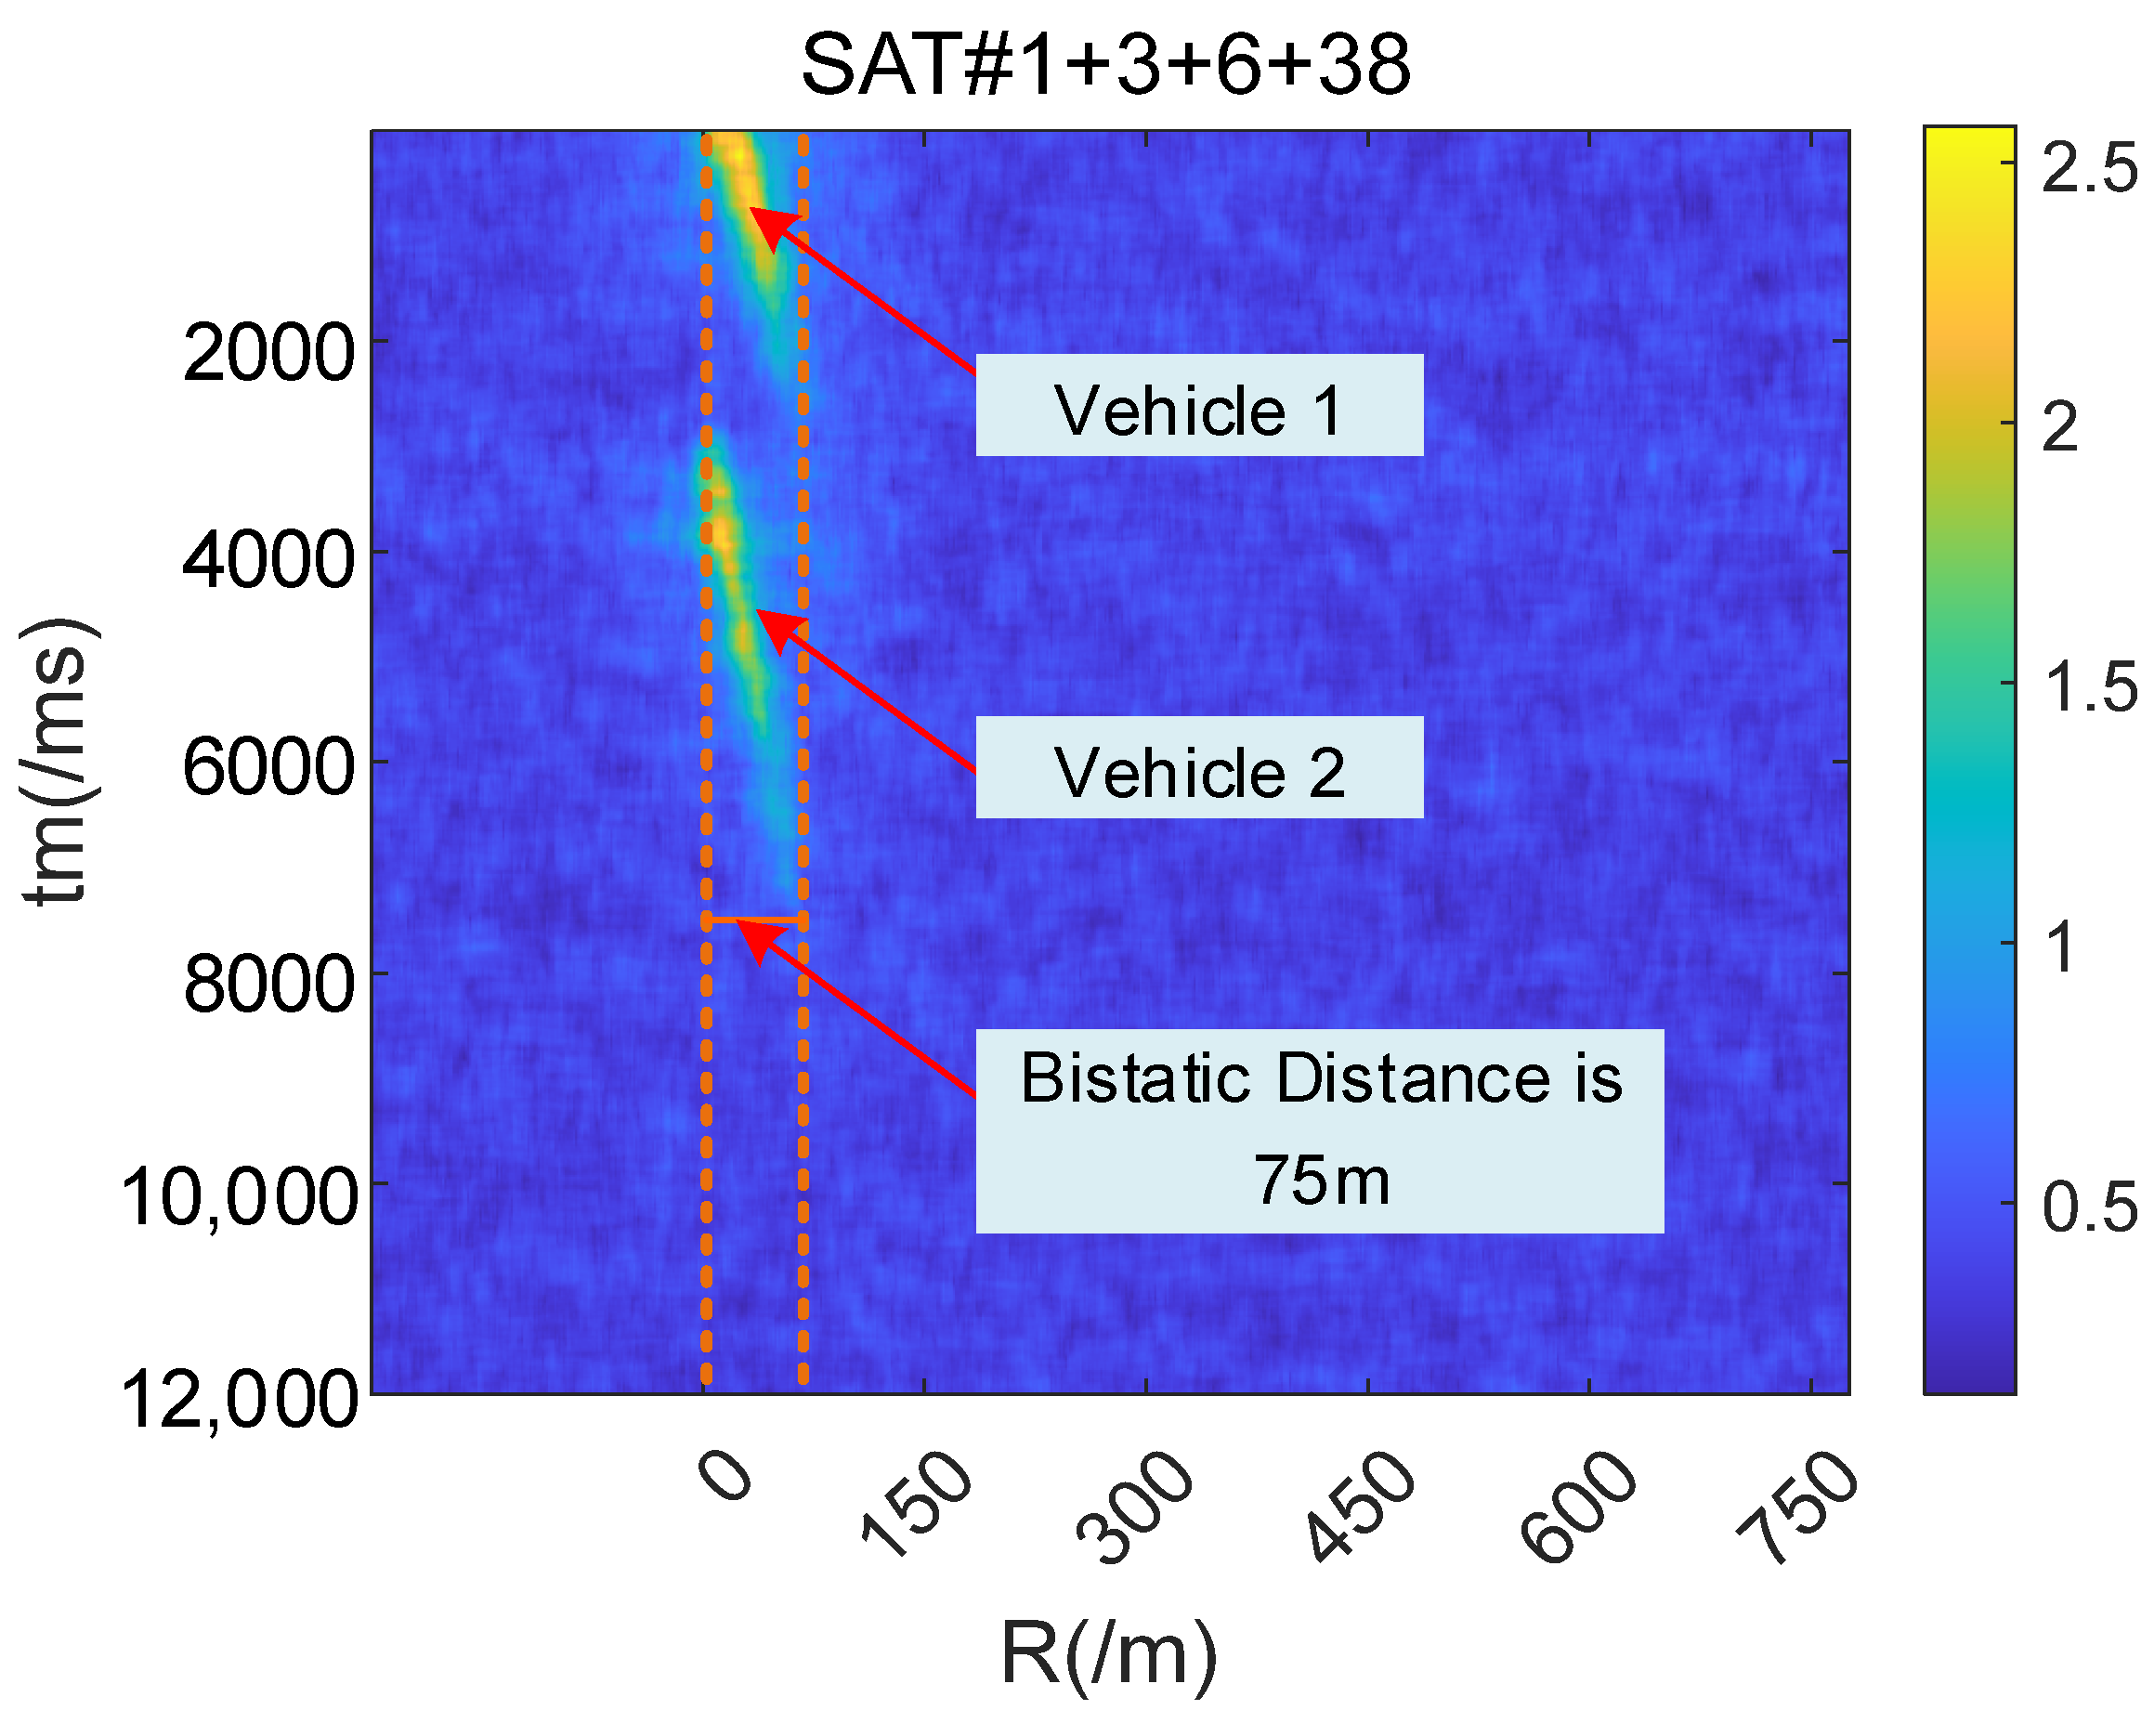
3.1. Simulation
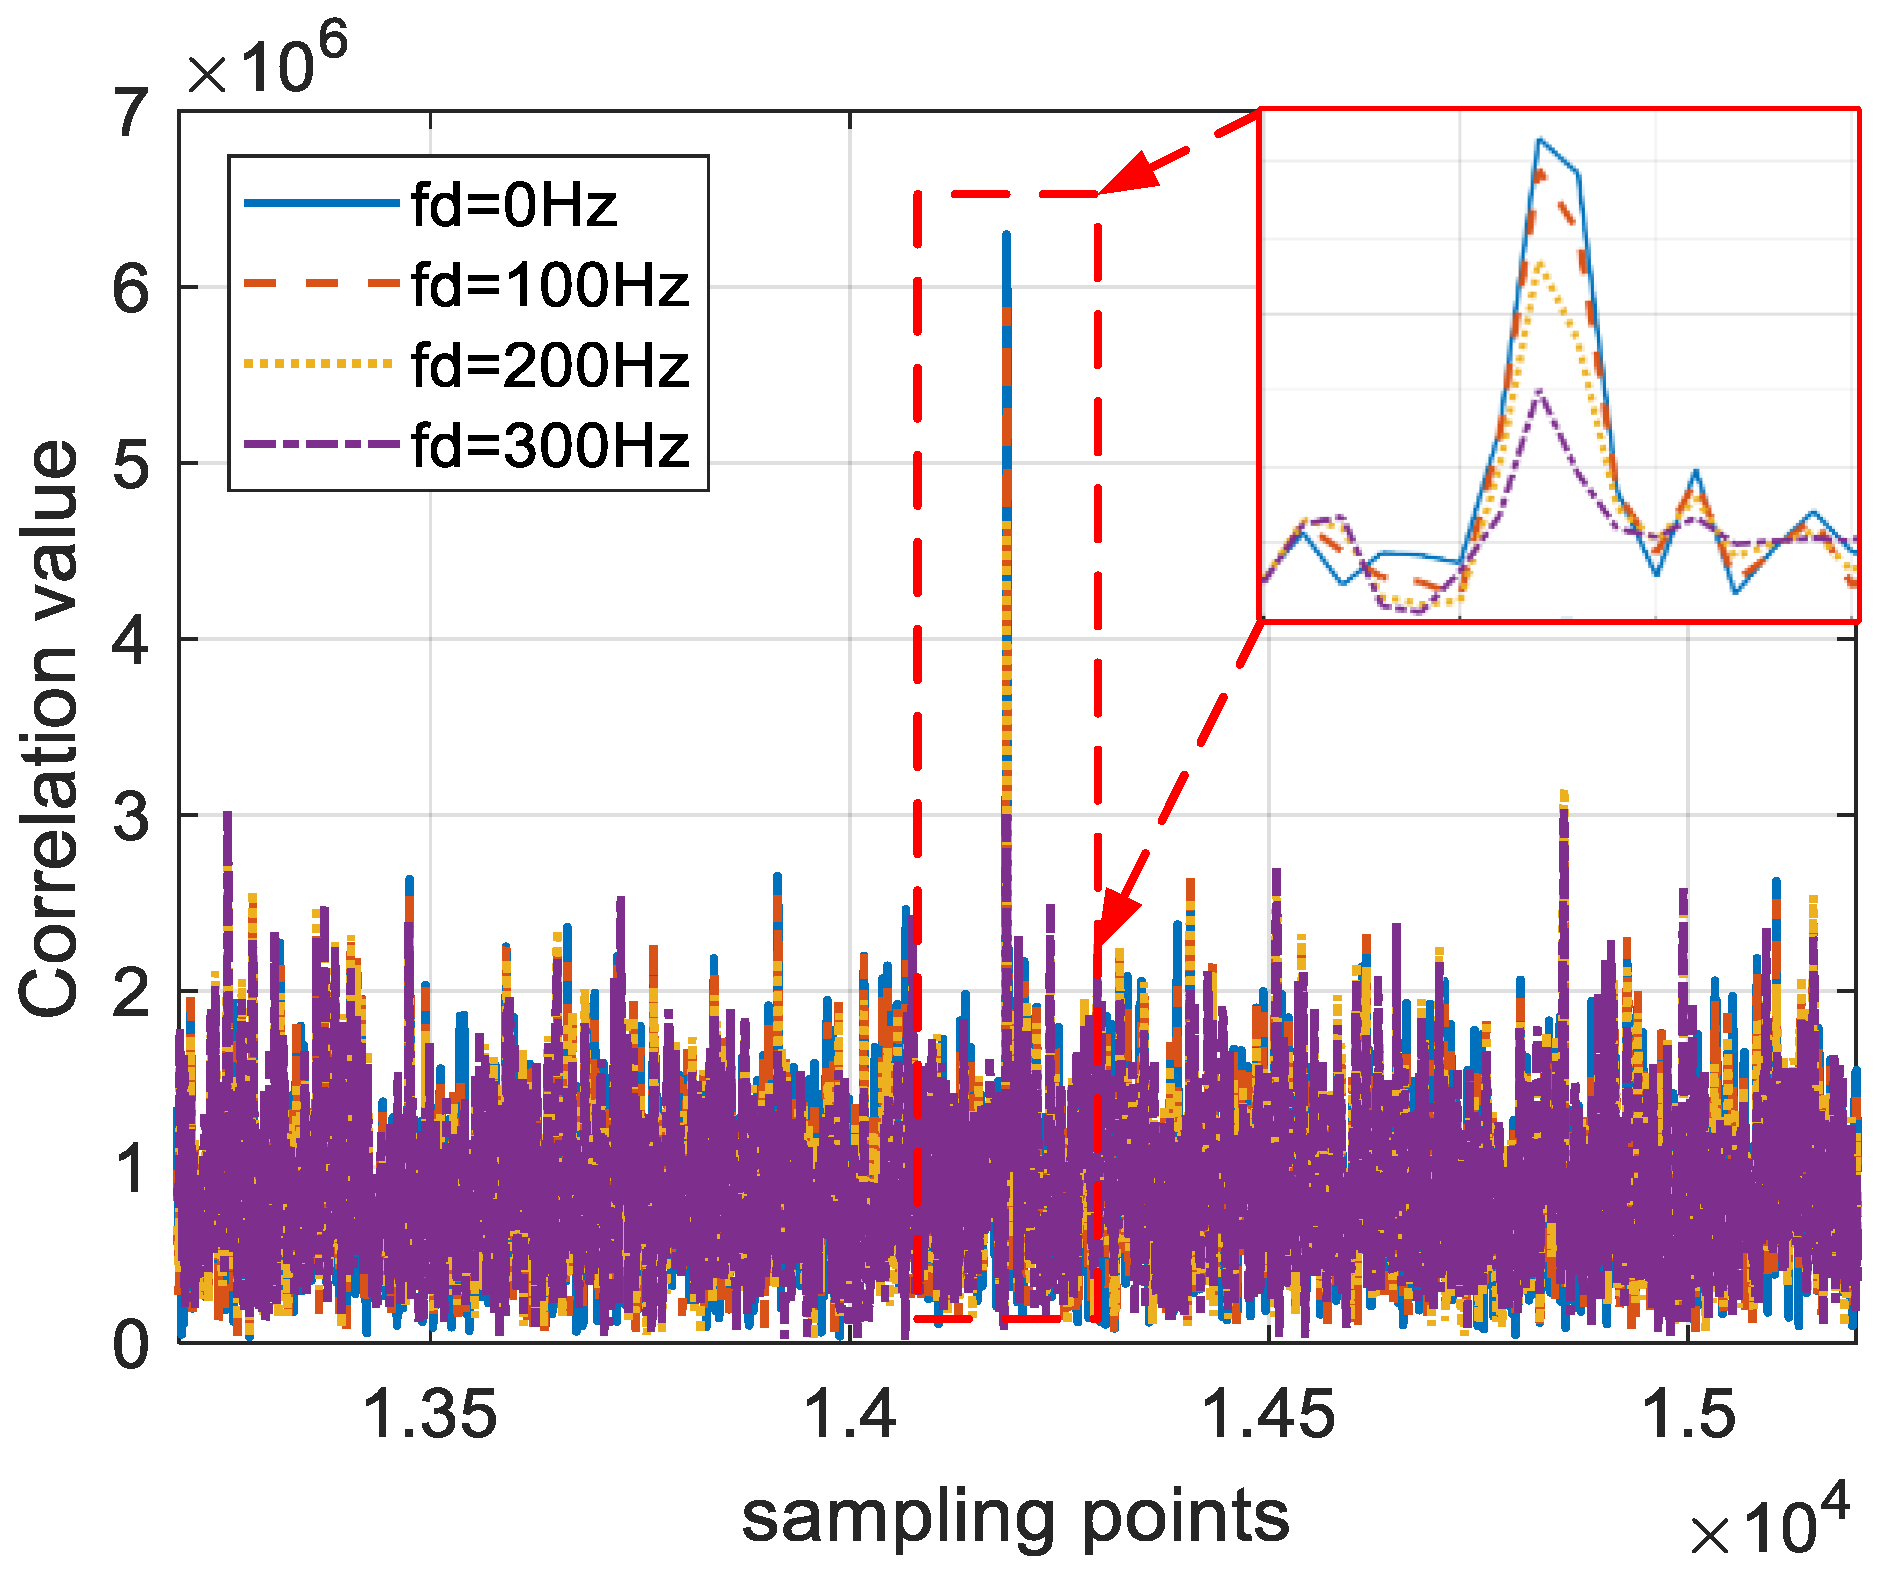
3.2. Experiments
4. Discussion
5. Conclusions
Author Contributions
Funding
Data Availability Statement
Conflicts of Interest
References
- Jin, S.; Wang, Q.; Dardanelli, G. A review on multi-GNSS for earth observation and emerging applications. Remote Sens. 2022, 14, 3930. [Google Scholar] [CrossRef]
- Teunissen, P.J.; Montenbruck, O. Handbook of Global Navigation Satelite Systems; Springer International Publishing AG: Berlin/Heidelberg, Germany, 2017; Volume 10, p. 978-3. [Google Scholar]
- Liu, J.; Shao, L.; Zhang, X. Advances in GNSS-R studies and key technologies. Geomat. Inf. Sci. Wuhan Univ. 2007, 32, 955–960. [Google Scholar]
- Yu, K.; Rizos, C.; Burrage, D.; Dempster, A.G.; Zhang, K.; Markgraf, M. An overview of GNSS remote sensing. EURASIP J. Adv. Signal Process. 2014, 2014, 1–14. [Google Scholar] [CrossRef]
- Gao, W.; Yue, F.; Tang, D.; Liu, P. Research on GNSS Navigation Method of Lunar Orbiting Spacecraft Based on Ground Enhancement. In Proceedings of the China Satellite Navigation Conference (CSNC 2022) Proceedings, Beijing, China, 25–27 May 2022; Springer Nature: Singapore, 2022; Volume III, pp. 563–572. [Google Scholar]
- Cherniakov, M.; Saini, R.; Zuo, R.; Antoniou, M. Space-surface bistatic synthetic aperture radar with global navigation satellite system transmitter of opportunity experimental results. IET Radar Sonar Navigat. 2007, 1, 447–458. [Google Scholar] [CrossRef]
- Santi, F.; Antoniou, M.; Pastina, D. Point spread function analysis for GNSS-based multistatic SAR. IEEE Geosci. Remote Sens. Lett. 2015, 12, 304–308. [Google Scholar] [CrossRef]
- Yang, J.; Dong, G.; Peng, Y.; Yamaguchi, Y.; Yamada, H. Generalized optimization of polarimetric contrast enhancement. IEEE Geosci. Remote Sens. Lett. 2004, 1, 171–174. [Google Scholar] [CrossRef]
- Ma, H.; Antoniou, M.; Cherniakov, M.; Pastina, D.; Santi, F.; Pieralice, F.; Bucciarelli, M. Maritime target detection using GNSS-based radar: Experimental proof of concept. In Proceedings of the 2017 IEEE Radar Conference (RadarConf), Seattle, WA, USA, 8–12 May 2017; pp. 0464–0469. [Google Scholar]
- Ma, H.; Antoniou, M.; Stove, A.G.; Winkel, J.; Cherniakov, M. Maritime Moving Target Localization Using Passive GNSS-Based Multistatic Radar. IEEE Trans. Geosci. Remote Sens. 2018, 56, 4808–4819. [Google Scholar] [CrossRef]
- Santi, F.; Pastina, D.; Bucciarelli, M. Experimental demonstration of ship target detection in GNSS-based passive radar combining target motion compensation and track-before-detect strategies. Sensors 2020, 20, 599. [Google Scholar] [CrossRef]
- Di Martino, G.; Di Simone, A.; Iodice, A.; Riccio, D. Link Budget Analysis for GNSS-R Sea Surface Return in Arbitrary Acquisition Geometries Using BA-PTSM. Remote Sens. 2022, 14, 520. [Google Scholar] [CrossRef]
- Antoniou, M.; Cherniakov, M. GNSS-based bistatic SAR: A signal processing view. EURASIP J. Adv. Signal Process. 2013, 2013, 1–16. [Google Scholar] [CrossRef]
- Ma, H.; Antoniou, M.; Pastina, D.; Santi, F.; Pieralice, F.; Bucciarelli, M.; Cherniakov, M. Maritime moving target indication using passive GNSS-based bistatic radar. IEEE Trans. Aerosp. Electron. Syst. 2017, 54, 115–130. [Google Scholar] [CrossRef]
- Ma, H.; Antoniou, M.; Stove, A.G.; Cherniakov, M. Target Kinematic State Estimation with Passive Multistatic Radar. IEEE Trans. Aerosp. Electron. Syst. 2021, 57, 2121–2134. [Google Scholar] [CrossRef]
- Zeng, T.; Zhang, T.; Tian, W.; Hu, C.; Yang, X. Bistatic SAR imaging processing and experiment results using BeiDou-2/Compass-2 as illuminator of opportunity and a fixed receiver. In Proceedings of the 2015 IEEE 5th Asia-Pacific Conference on Synthetic Aperture Radar (APSAR), Singapore, 1–4 September 2015; pp. 302–305. [Google Scholar]
- Wu, S.; Yang, D.; Zhu, Y.; Wang, F. Improved GNSS-Based Bistatic SAR Using Multi-Satellites Fusion: Analysis and Experimental Demonstration. Sensors 2020, 20, 7119. [Google Scholar] [CrossRef]
- Li, Y.; Yan, S.; Gong, J.; Zeng, F. SNR enhancement of back scattering signals for bistatic radar based on beidou GEO satellites. Remote Sens. 2021, 13, 1254. [Google Scholar] [CrossRef]
- Pastina, D.; Santi, F.; Pieralice, F.; Bucciarelli, M.; Ma, H.; Tzagkas, D.; Antoniou, M.; Cherniakov, M. Maritime moving target long time integration for GNSS-based passive bistatic radar. IEEE Trans. Aerosp. Electron. Syst. 2018, 54, 3060–3083. [Google Scholar] [CrossRef]
- Pastina, D.; Sedehi, M.; Cristallini, D. Passive bistatic ISAR based on geostationary satellites for coastal surveillance. In Proceedings of the 2010 IEEE Radar Conference, Paris, France, 30 September–1 October 2010; pp. 865–870. [Google Scholar]
- He, Z.; Yang, Y.; Chen, W. A hybrid integration method for moving target detection with GNSS-based passive radar. IEEE J. Sel. Top. Appl. Earth Obs. Remote Sens. 2020, 14, 1184–1193. [Google Scholar] [CrossRef]
- Gao, W.; Yue, F.; Xu, Z. Integrity Monitoring Methods of Beidou Receiver Based on Inertial Assistance. Navig. Position. Timing 2021, 8, 107–113. [Google Scholar]
- Zhang, Z.; Liu, N.; Hou, Y.; Zhang, S.; Zhang, L. A coherent integration segment searching based GRT-GRFT hybrid integration method for arbitrary fluctuating target. Remote Sens. 2022, 14, 2695. [Google Scholar] [CrossRef]
- He, Z.Y.; Yang, Y.; Chen, W.; Weng, D.J. Moving target imaging using GNSS-based passive bistatic synthetic aperture radar. Remote Sens. 2020, 12, 3356. [Google Scholar] [CrossRef]
- Yu, J.; Xu, J.; Peng, Y.N.; Xia, X.G. Radon-Fourier transform for radar target detection (III): Optimality and fast implementations. IEEE Trans. Aerosp. Electron. Syst. 2012, 48, 991–1004. [Google Scholar] [CrossRef]
- Gao, W.; Yue, F.; Xia, Z.; Liu, X.; Zhang, C.; Liu, Z.; Jin, S.; Zhang, Y.; Zhao, Z.; Zhang, T.; et al. Weak Signal Processing Method for Moving Target of GNSS-S Radar Based on Amplitude and Phase Self-Correction. Remote Sens. 2023, 15, 969. [Google Scholar] [CrossRef]
- Ma, R.; Gao, W. A Fast Pattern Synthesis Method for Arbitrary Planar Arrays. In Proceedings of the 2022 16th European Conference on Antennas and Propagation (EuCAP), Madrid, Spain, 27 March 2022–1 April 2022; pp. 1–4. [Google Scholar]
- Ma, R.; Gao, W. Butler-Matrices-Based Omnidirectional Beamforming of Circular/Cylindrical Arrays. In Proceedings of the 2022 16th European Conference on Antennas and Propagation (EuCAP), Madrid, Spain, 27 March–1 April 2022; pp. 1–4. [Google Scholar]
- Richards, M. Fundamentals of Radar Signal Processing; McGraw-Hill Education: New York, NY, USA, 2014. [Google Scholar]
- China Satellite Navigation Office. BeiDou Navigation Satellite System Signal in Space Interface Control Document Open Service Signal B3I (Version 1.0). 2017. Available online: http://en.beidou.gov.cn/SYSTEMS/ICD/ (accessed on 9 September 2023).


| Parameter | Value |
|---|---|
| Gain of the direct receiving antenna | 3 dBi |
| Gain of the scattering receiving antenna | 15 dBi |
| Working Frequency | 1561.098 MHz and 1268.52 MHz |
| Working Bandwidth | 4.092 MHz and 20.46 MHz |
| Beam angle of the scattering receiving antenna | ±13° |
| Sampling rate | 200 MSPS |
| Number of channels | 4 |
| Storage capacity | 1 TB |
| Parameter | Value |
|---|---|
| Signal type | BDS B1, B3 |
| Carrier frequency | B1:1561.098 MHz; B3:1268.52 MHz |
| PRN code period | 1 ms |
| SNR | −20 dB |
| Initial speed of the target | 16 m/s |
| Acceleration of the target | 10 m/s2 |
| Satellite ID | Elevation/° | Azimuth/° | Bistatic Angle α/° |
|---|---|---|---|
| 1 | 35 | 140 | 51 |
| 3 | 44 | 189 | 45 |
| 6 | 62 | 234 | 74 |
| 38 | 49 | 169 | 50 |
Disclaimer/Publisher’s Note: The statements, opinions and data contained in all publications are solely those of the individual author(s) and contributor(s) and not of MDPI and/or the editor(s). MDPI and/or the editor(s) disclaim responsibility for any injury to people or property resulting from any ideas, methods, instructions or products referred to in the content. |
© 2023 by the authors. Licensee MDPI, Basel, Switzerland. This article is an open access article distributed under the terms and conditions of the Creative Commons Attribution (CC BY) license (https://creativecommons.org/licenses/by/4.0/).
Share and Cite
Gao, W.; Yue, F.; Xia, Z.; Liu, X.; Zhao, Z.; Zhang, Y.; Liu, Z. Dual-Frequency Signal Enhancement Method of Moving Target Echoes for GNSS-S Radar. Remote Sens. 2023, 15, 4519. https://doi.org/10.3390/rs15184519
Gao W, Yue F, Xia Z, Liu X, Zhao Z, Zhang Y, Liu Z. Dual-Frequency Signal Enhancement Method of Moving Target Echoes for GNSS-S Radar. Remote Sensing. 2023; 15(18):4519. https://doi.org/10.3390/rs15184519
Chicago/Turabian StyleGao, Wenning, Fuzhan Yue, Zhenghuan Xia, Xin Liu, Zhilong Zhao, Yao Zhang, and Zongqiang Liu. 2023. "Dual-Frequency Signal Enhancement Method of Moving Target Echoes for GNSS-S Radar" Remote Sensing 15, no. 18: 4519. https://doi.org/10.3390/rs15184519
APA StyleGao, W., Yue, F., Xia, Z., Liu, X., Zhao, Z., Zhang, Y., & Liu, Z. (2023). Dual-Frequency Signal Enhancement Method of Moving Target Echoes for GNSS-S Radar. Remote Sensing, 15(18), 4519. https://doi.org/10.3390/rs15184519