Abstract
A polarimetric synthetic aperture radar (PolSAR) has great potential in ground target classification. However, current methods experience difficulties in separating forests and buildings, especially oriented buildings. To address this issue, inspired by the three-component decomposition method, multiple new scattering models were proposed to describe the difference between forest scattering and building scattering. However, this problem cannot effectively be solved with scattering power alone since HV polarization records significant scattering powers from building areas that are similar to vegetation. Therefore, in this study, two new parameters, the polarization orientation angle (POA) variance and helix angle (HA) variance, were defined to describe the distributions of buildings and forests. By combining scattering power with POA and HA variances, the random forest algorithm was used to conduct the land cover classification, focusing on distinguishing between forests and oriented buildings. Finally, the C- and L-band polarimetric SAR data acquired by the GF-3, ALOS1 PALSAR, and SAOCOM systems were selected to test the proposed method. The results indicate that it is feasible to improve PolSAR classification accuracy by introducing polarimetric parameters. Quantitatively, the classification accuracies increased by 23.78%, 10.80%, and 12.97% for the ALOS1 PALSAR, GF-3, and SAOCOM data, respectively.
1. Introduction
A polarimetric synthetic aperture radar (PolSAR) can acquire images with high resolution full-time and in all weather [1,2]. In the event of disasters and wars, PolSAR has timely and effective ground-mapping capabilities [3,4]. Using polarimetry, four polarizations (HH, VV, HV, and VH) are used to illuminate the ground targets, making them sensitive to the shape, orientation, and dielectric properties of illuminated targets and capable of distinguishing different targets [5,6,7,8,9,10,11,12,13,14,15].
To effectively classify ground targets from PolSAR images, it is necessary to understand the PolSAR scattering process [16]. To this end, PolSAR decomposition technology has been widely used to interpret the scattering process by decomposing the PolSAR coherency matrix into several scattering matrices related to the geometrical and physical characteristics of ground targets. Currently, PolSAR decomposition includes coherent target decomposition [17,18,19] and incoherent target decomposition [20,21,22,23]. The former is mainly suitable for analyzing deterministic targets, while the latter can be used to investigate the scattering process of distributed targets and has received widespread attention [24]. In particular, model-based decomposition, as an incoherent decomposition, plays an important role in land cover classification [25,26,27,28,29,30,31].
In 1998, Freeman–Durden decomposition was proposed by Freeman and Durden, which decomposes the scattering process of the land cover into surface scattering caused by micro-rough surfaces, double-bounce scattering generated from two mutually perpendicular planes, and volume scattering induced by random dipoles [20]. Although Freeman–Durden decomposition can effectively describe the scattering process of natural media based on the assumption of reflection symmetry, only some of the elements in the PolSAR coherency matrix are used to interpret the scattering process. In this case, for the oriented buildings that do not satisfy reflection symmetry, the corresponding scattering signals are also recorded by the PolSAR coherency matrix, which cannot be interpreted by the Freeman–Durden scattering model. As a result, the misclassification of oriented buildings and vegetation is significant since the volume scattering contribution from oriented buildings is strong and similar to that of vegetation. To solve this problem, the non-reflection symmetry elements in the PolSAR coherency matrix should be considered in a model-based decomposition.
There are two types of methods that can be used to describe the scattering process following non-reflection symmetry, including scattering model-based and polarimetric orientation rotation methods. Yamaguchi et al. first introduced the helix scattering model to describe the scattering process linked to the imaginary part of , which can absorb some scattering power of the HV channel and reduce the overestimation of volume scattering contribution from oriented buildings to some degree [32]. In the following studies, the most representative scattering model to absorb the scattering components following non-reflection symmetry was proposed by Singh et al., including the six- and seven-component decomposition models [33,34]. Compared with the Freeman–Durden scattering model, Singh’s model can effectively reduce the overestimation of the volume scattering contribution from the oriented building area. In contrast to the above scattering models, the methods based on polarimetric orientation rotation interpret the scattering process following non-reflection symmetry by rotating the PolSAR coherency matrix. A reflection symmetry algorithm is proposed by An et al. [35], in which the polarimetric orientation angle (POA) is used to rotate the PolSAR coherency matrix so that the real part of can be changed to zero [35,36,37,38]. The helix angle (HA) corresponding to the imaginary part of is then used to rotate the PolSAR coherency matrix. Finally, the is rotated to zero by a further 45° POA rotation. In such a case, the term has been minimized as much as possible, which reduces the misclassification of oriented buildings and forests, and the corresponding scattering process recorded by the PolSAR coherency matrix can be well fitted by the Freeman–Durden scattering model.
Although the difference in scattering powers from oriented buildings and forests is enhanced by the above two kinds of strategies, the misclassification of oriented buildings and forests is still a common phenomenon, which makes it difficult to extract the building areas from the PolSAR image [39]. In fact, it is hard to separate highly oriented buildings from the PolSAR signal because the corresponding scattering contributions are mainly recorded by the HV channel, presenting a scattering process similar to that of forests. To solve this problem, two polarimetric parameters, polarization orientation angle (POA) variance and helix angle (HA) variance, recording the texture information, are proposed to enhance the distinction between buildings and forests, which is complementary to the scattering power in classification.
2. Methodology
For PolSAR image acquisition, the scattering matrix of each pixel can be recorded as follows [7,24]:
where the subscripts represent different polarimetric modes, e.g., HV means transmitting vertical waves and receiving horizontal waves. According to the reciprocity condition, the Pauli scattering vector can be expressed by the following [7,24]:
Subsequently, the Pauli scattering vector can be converted to obtain the coherency matrix T as follows [7,24]:
where * denotes the complex conjugate. To investigate the scattering process from illuminated targets, different decomposition methods have been proposed based on the coherency matrix.
2.1. The Freeman–Durden Decomposition and Reflection Symmetry Approximation Methods
The Freeman–Durden decomposition method uses specific physical models to fit all ground targets of the PolSAR image, using three scattering processes, namely, surface scattering, double-bounce scattering, and volume scattering. Assuming that these three scattering models are independent of each other, the corresponding coherency matrices can be expressed as follows [20]:
where , , and represent the scattering coefficient of the surface, double-bounce, and volume scattering models, respectively. and are parameters related to the incidence angle and the relative dielectric properties of the scatterer, respectively. By converting Equation (4), we can obtain the following four equations [20]:
In such a case, Equation (5) faces the rank deficiency problem. To solve this, we determine which of the surface scattering and the double-bounce scattering is dominant according to the relationship between and , and then set one of the model parameters to be zero. In this case, all model parameters can be solved with the following [20]. Additionally, therefore, the power corresponding to different scattering mechanisms can be subsequently calculated with the following [20]:
It is noteworthy that for the distributed target that follows reflection symmetry in the plane normal to the line of sight, the associated coherency matrix can be expressed by the following [24]:
This means that the Freeman–Durden decomposition algorithm truncates the coherency matrix directly, and T13 and T23 should be set to 0 [20]. However, this stronger assumption is invalid for oriented buildings because they are not symmetrical in the plane that is normal to the line of sight. To address this issue, a new reflection symmetry algorithm was proposed in [26,36]. The core idea is to rotate T13 and T23 to zero using POA and HA rotations [35]. By doing so, the resultant new coherency matrix satisfies the reflection symmetry assumption, allowing the Freeman–Durden decomposition to use it. In addition, since the new coherency matrix is obtained by rotating the POA and HA, the power of different scattering mechanisms contained in the matrix is redistributed. As a result, the double-bounce scattering power is significantly enhanced, and the volume scattering power is suppressed, which is expected to improve the discrimination between oriented buildings and forests.
2.2. POA Variance and HA Variance
It is important to note that rotating the measured matrix is similar to rotating an oriented building toward the radar’s line of sight. The orientation angle information of ground objects is no longer included in the rotated observation matrix due to the real part of being turned to zero [37]. In such a case, the rotated matrix makes it difficult to explore the scattering differences between buildings with different POAs. Thus, orthogonal buildings and oriented buildings still cannot effectively be distinguished solely based on the scattering power due to the lower sensitivity to building orientations. In addition, although the POA and HA compensations can enhance the double-bounce scattering power for oriented buildings, the double-bounce scattering power for forest areas is also increased. It is foreseeable that improvements in classification accuracy are limited. Therefore, besides scattering power, we must seek more information or parameters to improve the distinction between buildings of different orientations and forests. The scattering power derived from the PolSAR decomposition only describes the scattering properties of individual pixels. However, different ground targets have different texture features in space. As a supplement to scattering power, adding texture information is helpful for land-cover classification.
When short-wavelength SAR is used to observe vegetation, the POA mainly reflects the orientation of scatterers within the canopy due to the limited penetration. In the case of long-wavelength SAR data, the POA represents both vegetation and ground orientations. Typically, the randomness associated with canopy scatterer orientations is high, resulting in significant variations in POA from pixel to pixel. Conversely, orthogonal buildings often exhibit regular arrangements, leading to approximate POAs among neighborhood pixels. This contrast allows for a better distinction between buildings and forests. In addition, the HA can also describe the distribution of scatterers, providing valuable information for separating buildings from forests. Drawing inspiration from the concept of POA randomness [40], we defined the POA variance and HA variance as follows:
- (1)
- Compute the POA and HA for the entire PolSAR image:where and denote real and imagenary parts of . Then, labels are assigned from 1 to 10 based on the values of the POA and HA, as illustrated in Figure 1a. In this study, the decision to divide the orientation angles into 10 parts is driven by the objective of preventing targets with similar orientations from being classified into different categories.
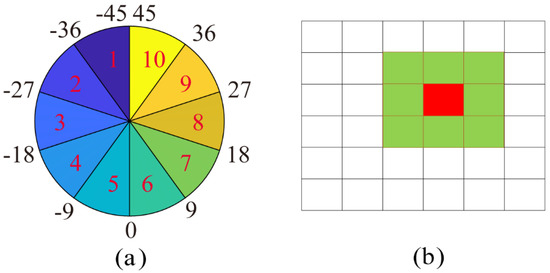 Figure 1. Schematic diagram of POA variance and HA variance. (a) Ten labels of POA values. (b) Neighborhood pixels involved in statistics. Red and green represent the central pixel and surrounding pixels, respectively.
 - (2)
- To calculate the POA variance and HA variance for each pixel, the following formula can be used:where and represent the label of the POA and the label of the HA, respectively. and are the labels of the central pixel. denotes the number of window sizes used to calculate the variance, as illustrated by Figure 1b.
2.3. Classification Method
To perform the classification, we first employ the Freeman–Durden decomposition and reflection symmetry algorithms [35], as described in Section 2.1, to obtain the surface, double-bounce, and volume scattering powers. Following that, the POA variance and HA variance are calculated using the method outlined in Section 2.2. Finally, the random forest method is applied to each image to derive the final classification result [41,42].
To train the random forest model, we selected 1% of all pixels and ensured that these sample pixels covered all land cover types. In addition, the number of decision trees was set to 100 in this study, and the feature importance was evaluated with the Gini coefficient [41,42]. To better evaluate the performance of the proposed parameters, three feature sets were used for classification {Ps, Pd, and Pv}, {Ps, Pd, Pv, and POA randomness [40]}, and {Ps, Pd, Pv, POA, and HA variances}. A detailed flowchart of the proposed method for land cover classification is shown in Figure 2.
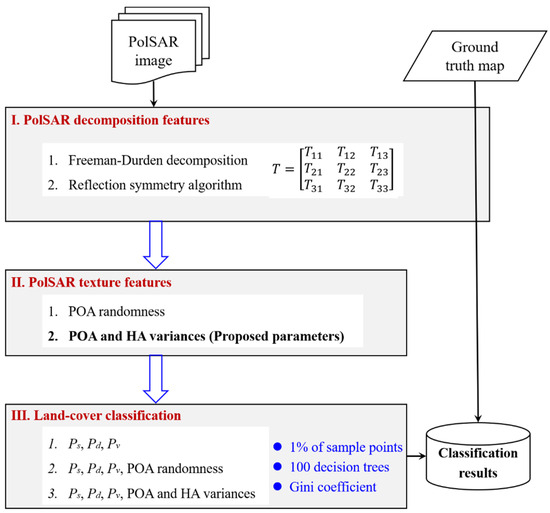
Figure 2.
Flowchart of the proposed method for land cover classification.
3. Study Areas and Datasets
To test the proposed method, we used three different PolSAR datasets. The first one was from the ALOS1 PALSAR at L-band, acquired over San Fernando Valley, California, USA. This image was collected on 8 June 2006 in the PLR mode. The second dataset, from the GaoFen-3 at C-band, was collected over Oakland, Virginia, USA. This image was acquired on 15 September 2017. The third dataset, from SAOCOM data at the L-band, was collected over Guangzhou, China. This image was acquired on 12 November 2022. All of these SAR images were acquired in Stripmap mode with full polarization. The coverage of these datasets is shown in Figure 3, and the corresponding parameters of all the PolSAR data used in this study are listed in Table 1.
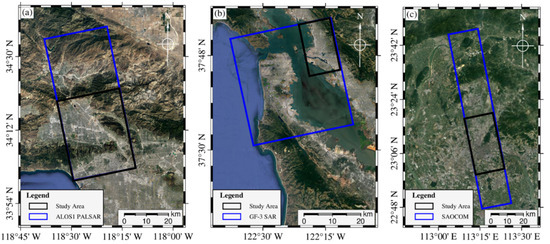
Figure 3.
Study area locations: (a) San Fernando Valley, (b) Oakland, and (c) Guangzhou. The blue rectangles indicate the coverage of PolSAR images.

Table 1.
Datasets over three different study areas.
To assess the classification results derived by the proposed method, ground truth data of land cover type were employed, manually outlined against the optical map. In the San Fernando Valley test site, the predominant land cover types include forests, orthogonal buildings, and oriented buildings. These land types are well-suited for evaluating the effectiveness of the proposed method. The Oakland test site encompasses the same land cover types found in the San Fernando Valley test site, which provides a similar environment for evaluating the proposed method. Compared with the first two test areas, the third research area, located in Guangdong Province, China, covers more fragmented ground categories. Experiments using three PolSAR images covering targets with different characteristics can more strongly demonstrate the role of the proposed parameters in land-cover classification.
4. Experimental Results and Analysis
4.1. San Fernando Valley Test Site
To reduce speckle noise, a multi-look operation was applied to the images. The final azimuth and range resolutions are 13 m and 12 m, respectively. Figure 4a shows the Pauli color-coded image, while the ground truth map is shown in Figure 4b. It can be observed that for the orthogonal building area, the double-bounce scattering contribution is significant, which is different from the chaparral area. However, for the oriented building area, strong volume scattering contribution makes it difficult to distinguish from the chaparral area.
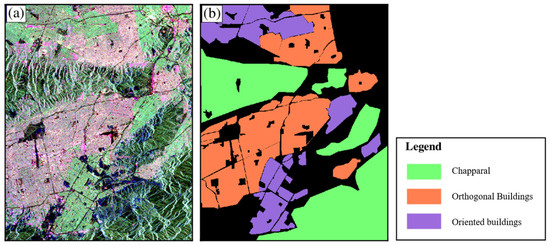
Figure 4.
San Fernando Valley test site: (a) the Pauli color-coded image of ALOS1 PALSAR data; (b) ground truth map.
The classification results of {Ps, Pd, Pv} are shown in Figure 5a. It is important to note that the three scattering powers were calculated by the reflection symmetry algorithm [37]. In Figure 5a, many oriented buildings are misclassified as chaparral areas, indicating that using only scattering power cannot effectively distinguish oriented buildings from chaparral areas. To analyze the reason for this result, the decomposition results of the reflection symmetry algorithm are shown in Figure 6. In the areas with oriented buildings, the double-bounce scattering power is weak, while the volume scattering power is strong, resulting in similar scattering characteristics to the chaparral area. Thus, oriented buildings are difficult to distinguish from forests.
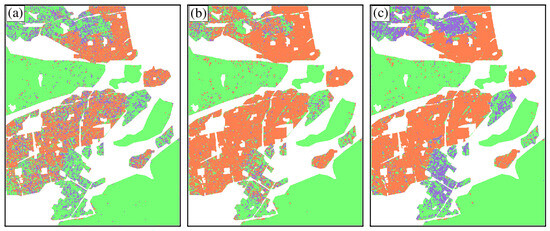
Figure 5.
San Fernando Valley test site: ALOS1 PALSAR classification results: from (a) {Ps, Pd, Pv}; (b) {Ps, Pd, Pv, POA randomness [37]}; and (c) {Ps, Pd, Pv, POA and HA variances}.
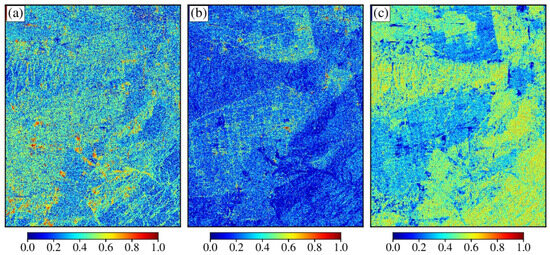
Figure 6.
San Fernando Valley test site: Decomposition result obtained by the reflection symmetry algorithm. The ratio between total power and (a) surface scattering power, (b) double-bounce scattering power, and (c) volume scattering power.
The classification results from {Ps, Pd, Pv, POA randomness [40]} are shown in Figure 5b. In Figure 5b, in addition to the misclassification between oriented buildings and chaparals, many oriented buildings are misclassified as orthogonal buildings. As Figure 7a shows, some oriented buildings have POA randomness as low as that of the orthogonal buildings, while buildings oriented otherwise have very high POA randomness, like chaparrals. This leads to difficulty in learning clear features of oriented buildings for the classifier. The reason for this is that POA randomness generally regards buildings and chaparals with a difference of 40° in the POA as the same label, which cannot effectively reflect the difference between orthogonal buildings, oriented buildings, and chaparals.
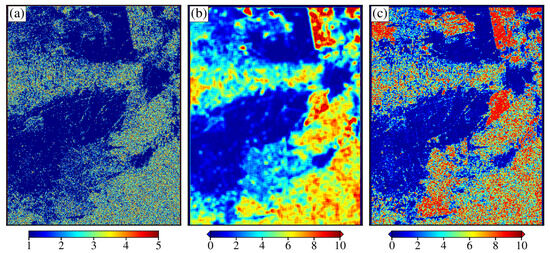
Figure 7.
Parameters related to POA and HA. (a) POA randomness [37]; (b) POA variance; (c) HA variance.
The classification results from {Ps, Pd, Pv, POA, and HA variances} are shown in Figure 5c. We can observe that the proposed parameters effectively improve the classification accuracy of orthogonal buildings, oriented buildings, and chaparals. To conduct further analysis, the POA variance and HA variance are shown in Figure 7b,c. The POA variance is small in the orthogonal building area and large in the chaparral area. Such differences make it possible to distinguish chaparals from oriented buildings. The HA variance of the orthogonal building area is smaller than that of the oriented building area and chaparral area, which can be used to identify the orthogonal buildings. By introducing POA and HA variance, the proposed method can provide better classification results than POA randomness. The reason for this advantage is that firstly, all POA values are divided into 10 groups, which better reflects the detailed information of different categories compared to dividing POA values into 5 groups in the literature [40]. In addition, variance is more conducive to extracting detailed information than randomness. According to the definition of these two parameters, the value range of variance is much larger than that of randomness. Secondly, the texture information of POA and HA can reflect the differences between these three kinds of ground targets, but the scattering power is limited in terms of this aspect.
The ability of POA and HA variances to distinguish the three ground targets was quantitatively analyzed, as shown in Table 2, Table 3 and Table 4. Compared with existing methods, the classification accuracy obtained by the proposed method was improved by 23.78% and 5.98%, respectively. Thus, introducing POA and HA variances effectively improves the distinction between different targets. The improvement in the classification accuracy of orthogonal buildings and oriented buildings is the most obvious. The reason for this is that the proposed parameters reflect the difference between buildings with different orientation angles. As shown in Figure 8, the POA variance is small in the orthogonal buildings since the SAR signal returns directly after interacting with the dihedral structure formed by the ground and building walls. In oriented buildings, the SAR signal bounces between buildings, so the POA variance increases. Therefore, the POA variance effectively improves the distinguishability between orthogonal and oriented buildings. In addition, introducing HA variance further improves the classification accuracy of the oriented buildings. In addition to the rotation, the features of ground objects described by HA also include structures with different distances from radar signals. Therefore, introducing POA and HA variance can help to fully explore the distribution characteristics of different ground types.

Table 2.
Quantitative classification results from {Ps, Pd, Pv}.

Table 3.
Quantitative classification results from {Ps, Pd, Pv, and POA randomness}.

Table 4.
Quantitative classification results from {Ps, Pd, Pv, POA, and HA variances}.
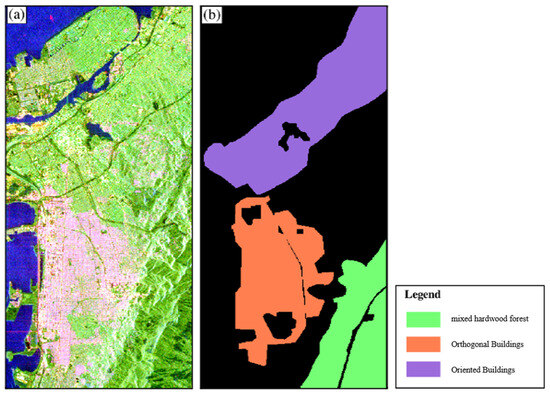
Figure 8.
Oakland test site: (a) the Pauli color-coded map of GF-3 data and (b) the ground truth map.
4.2. Oakland Test Site
The C-band GF-3 PolSAR data were used to further validate the proposed method. A multi-look operation was applied to reduce the speckle noise. The final azimuth and range resolutions were approximately 6 m and 5 m, respectively. The Pauli color-coded map and ground truth map are shown in Figure 8.
The classification results obtained by different parameters are shown in Figure 9. As expected, the results derived with the scattering power alone cannot effectively distinguish orthogonal buildings, oriented buildings, and mixed hardwood forests (see Figure 9a). Adding the POA randomness as a feature does not effectively improve the classification accuracy (Figure 9b). To investigate the reasons behind this phenomenon, the POA randomness of the orthogonal buildings area (red box), sparsely oriented buildings area (green box), densely oriented buildings area (white box), and mixed hardwood forest area (black box), were selected for analysis (Figure 10a). The POA randomness of orthogonal buildings and sparsely clustered oriented buildings is very small, but that of the densely clustered oriented buildings and mixed hardwood forests have large values. The oriented buildings have two types of contradictory features, which causes the classifier to learn inaccurately. Compared with other parameters (Figure 9a,b), combining the POA variance, HA variance, and scattering power has better accuracy in discriminating these three types of ground targets (Figure 9c). More specifically, the mixing of orthogonal and oriented buildings is greatly reduced. This further validates the ability of the proposed parameters in PolSAR image classification.
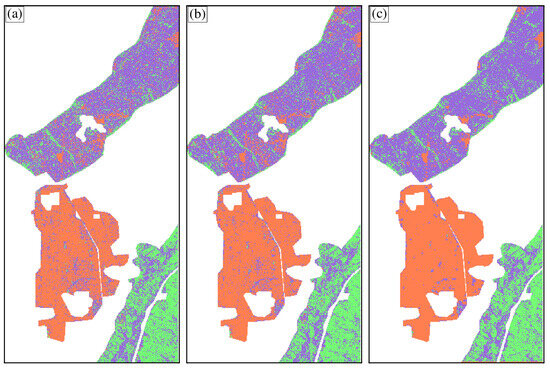
Figure 9.
Oakland test site: GF-3 data classification results from (a) {Ps, Pd, and Pv}; (b) {Ps, Pd, Pv, and POA randomness [40]}; (c) {Ps, Pd, Pv, POA, and HA variances}.
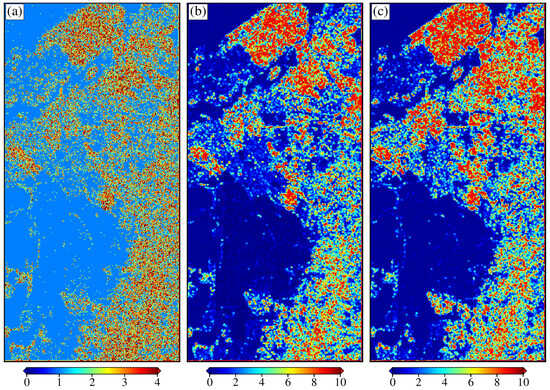
Figure 10.
Oakland test site: the parameters related to POA and HA. (a) POA randomness [40]. (b) POA variance. (c) HA variance.
The quantitative classification results of different methods for C-band GF-3 data are shown in Table 5. The overall accuracy increases from 73.37% and 75.78% to 81.30% with the proposed method. In detail, the classification accuracy of oriented buildings increases from 67.03% and 69.29% to 75.15%. This is mainly attributed to the detailed division of the POA and HA variance. We divide the possible values of the POA into ten groups and use the variance to calculate its texture features. The difference between orthogonal and oriented buildings provides more detailed information for classification. It helps the classifier to learn object features from different aspects. However, the proposed method cannot effectively distinguish between densely clustered oriented buildings and forests because they exhibit similar POA and HA variance. As shown in Figure 11, the POA and HA are very noisy in the densely oriented building area because SAR signals reflect between buildings. As reflection increases, the spatial randomness of the POA increases. However, in general, the POA and HA variance effectively increase the distinguishability among the three types of ground targets.

Table 5.
Quantitative classification results of different methods for C-band GF-3 data.
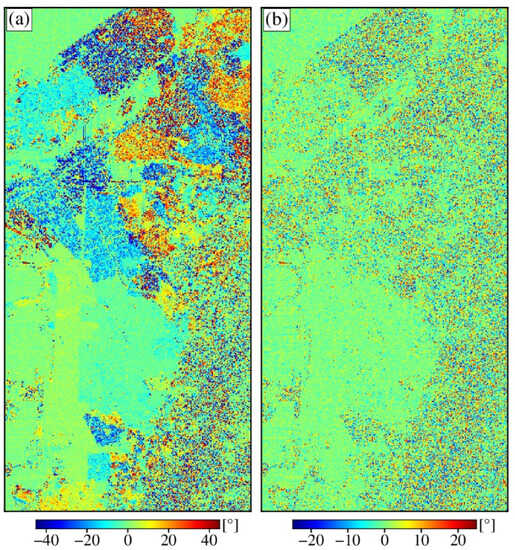
Figure 11.
Oakland test site: (a) POA map. (b) HA map.
4.3. Guangzhou Test Site
The L-band SAOCOM data were also used to validate the effectiveness of the proposed POA and HA parameters. The PolSAR image was processed using the multi-look operation to reduce the speckle noise. The azimuth and range resolutions are approximately 30 m × 30 m. The Pauli color-coded map and ground truth map are shown in Figure 12.
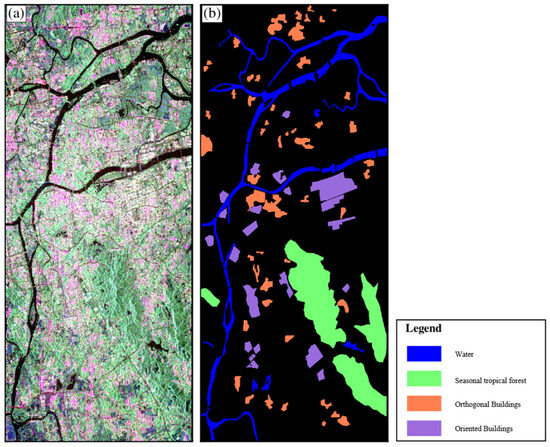
Figure 12.
Guangzhou test site: (a) the Pauli color-coded image of SAOCOM data. (b) Ground truth map.
The classification results from different polarization parameters are shown in Figure 13. Firstly, it can be observed that all three methods can identify the water area well. Regarding other areas, the proposed method exhibits superior performance in land cover classification. Specifically, Figure 13a,b show that some oriented buildings are misclassified as seasonal tropical forests. Neither scattering power nor POA randomness can depict the difference between buildings with different orientation angles and seasonal tropical forests. However, the classification results obtained by the proposed method (see Figure 13c) indicate a significant improvement compared to those of the other two methods (Figure 13a,b). These results can be attributed to the introduction of the POA variance and HA variance. To further analyze the potential of the proposed parameters, the quantitative evaluation results were summarized, as shown in Table 6. The overall accuracy was increased from 74.62% and 76.94% to 84.30% with the proposed method. In detail, the classification accuracies increased from 91.42%, 69.12%, 32.90%, and 84.03% to 95.19%, 88.07%, 48.07%, and 91.10% for water, orthogonal buildings, oriented buildings, and seasonal tropical forest areas, respectively. These results further confirm the potential of the proposed parameters in land cover classification.
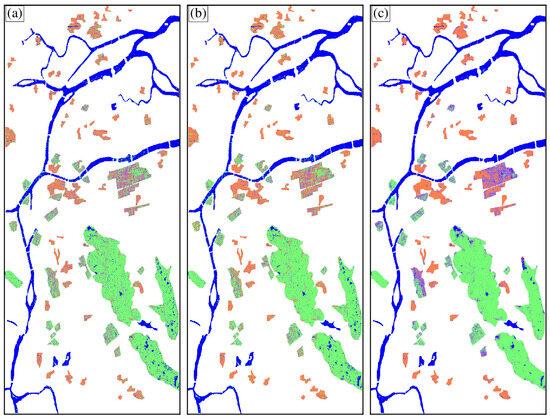
Figure 13.
Guangzhou test site: SAOCOM data classification results using (a) {Ps, Pd, and Pv}; (b) {Ps, Pd, Pv, and POA randomness [40]}; (c) {Ps, Pd, Pv, POA, and HA variances}.

Table 6.
Quantitative classification results of different methods for L-band SAOCOM data.
5. Discussion
5.1. The POA and HA Characteristics of Ground Targets
To validate the effectiveness of POA and HA variances for land cover classification, POA and HA histograms of the ALOS1 PALSAR data over different areas were created, as shown in Figure 14. The distribution of orientation angles in the forest area is flatter, that of orthogonal buildings is sharper, and that of oriented buildings is in between. This is consistent with the initial conjecture. The reason for this is that the orientations of scatterers in the vegetation canopy are random, which increases the difference in orientations between pixels, resulting in a larger POA variance. Orthogonal buildings are arranged along the radar line of sight. SAR signals return to the radar sensor after being reflected by the ground and building walls. The scattering process is regular, and the POA difference between pixels is small, resulting in a small POA variance. The orientations of oriented buildings are not as random as the vegetation canopy. However, because the arrangement direction of oriented buildings is not along the radar line of sight, the SAR signals continue to reflect between the walls, which increases the difference in POA, resulting in a moderate POA variance. Chaparrals, orthogonal buildings, and oriented buildings have different POA variances, which provides insight into the distinction among the three targets. Furthermore, orthogonal buildings are the most concentrated, followed by directional buildings and chaparrals. In addition, there are differences in HA distribution and POA distribution. In such a case, combining POA and HA variances can explore more comprehensive orientation information of ground targets.
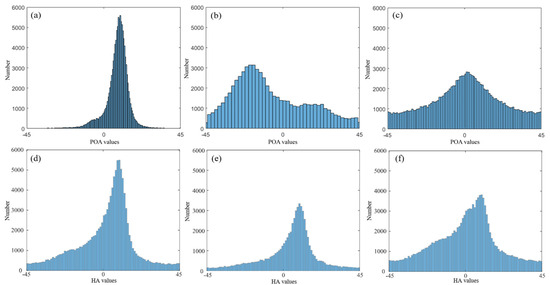
Figure 14.
POA and HA histograms for ALOS1/PALSAR1 data. (a) POA histogram for orthogonal buildings. (b) POA histogram for oriented buildings. (c) POA histogram for chaparrals. (d) HA histogram for orthogonal buildings. (e) HA histogram for oriented buildings. (f) HA histogram for forests.
5.2. The Effect of Window Size on Classification Results
The window size affects the POA and HA variances, thus affecting the classification accuracy. To analyze the impact of window size on classification results, three window sizes of 3 × 3, 7 × 7, and 13 × 13 were selected for comparison. The classification results of the POA variance calculated with three different windows are shown in Figure 15. It can be observed that as the window size increases, the classification results become smoother. The reason for this is that the larger the window, the more stable the statistical results of the POA and HA variances. However, it is difficult to evaluate the optimal window suitable for PolSAR image classification. The reason is that enlarging the window enlarges the regions of correct classification and misclassification simultaneously. On the one hand, as shown in the black rectangular areas, the area where the oriented buildings are misdivided into orthogonal buildings increases with the increase in window size. On the other hand, for the red rectangular areas, the increase in window size avoids the misclassification of oriented buildings as chaparrals. However, if some ground truth data were available, the relationship between window size and classification performance could be analyzed to derive the optimal statistical window for POA and HA variances.
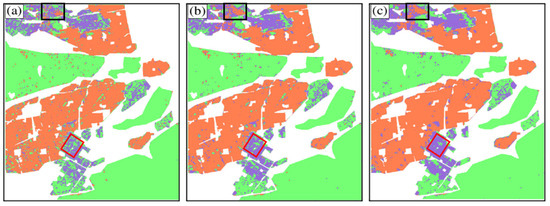
Figure 15.
Classification results of the POA variance using different window sizes. (a) 3 × 3; (b) 7 × 7; (c) 13 × 13. The black and red rectangular ares are oriented buildings misclassified as orthogonal buildings and forests respectively.
5.3. Complementary Properties of Scattering Power and Proposed Parameters
Scattering power data derived from the PolSAR decomposition scheme are widely used for land-cover classification. However, they only describe the scattering characteristics of a single pixel. It is important to note that the different ground targets have different texture features in space. The scattering power tends to describe the geometric and physical properties in the resolution unit, while the texture features tend to describe the characteristics of local ground targets. Thus, texture features are a complement to scattering power for classification [43,44]. In such a case, we suggest combining scattering power and texture features for classification.
Furthermore, considering that texture features can effectively improve the classification accuracy of ground targets, more texture features will be proposed and used for classification in the future. Texture features related to orientation angle are used in this study. It is important to note that the scattering power also has texture information. For example, the double-bounce scattering powers of orthogonal buildings have little variety. As the orientation angle increases, the randomness of the double-bounce scattering intensity increases because the SAR signal is reflected back and forth on the wall. In the vegetation areas, due to the discontinuity of the canopy gap, the double-bounce scattering intensities have a large difference between neighboring pixels. The calculation processes of the variances of {Ps, Pd, Pv} are similar to those of POA and HA variances. The ratio of scattering power to total power is evenly divided into ten parts from 0 to 1, and a window of size 3 × 3 is used to estimate scattering power variances.
The ALOS1 PALSAR classification results of {Ps, Pd, Pv, and the variances of Ps, Pd, Pv, POA, and HA} are shown in Figure 16 and Table 7. Compared with the classification results by {Ps, Pd, Pv, POA, and HA variances}, the accuracy of oriented buildings has been significantly improved. Further comparing Table 4 and Table 7, it can be found that the total accuracy has increased from 85% to 87.53%. The more surprising observation is that the classification accuracy of oriented buildings has improved from 51.39% to 72.65%. This further validates the role of texture feature parameters in land-cover classification.
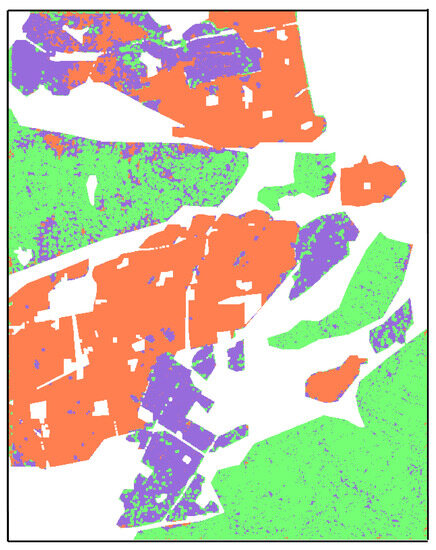
Figure 16.
San Fernando Valley test site: ALOS1 PALSAR classification results: of {Ps, Pd, and Pv, and the variances of Ps, Pd, Pv, POA, and HA}.

Table 7.
Quantitative classification results from {Ps, Pd, Pv, the variances of Ps, Pd, Pv, POA, and HA}.
6. Conclusions
Classifying forests and buildings with different orientations is important for urban planning and forest parameter inversion. However, existing decomposition methods cannot effectively distinguish buildings with different orientation angles from forests. The core reason for this is the overestimation of volume scattering. Although novel decomposition schemes have been proposed to reduce the volume scattering power for oriented buildings, the volume scattering power for forest areas is also reduced. This does not effectively improve classification accuracy. In such a case, a type of polarimetric parameter that is capable of distinguishing oriented buildings from forests makes sense for land cover classification. Therefore, polarization orientation angle (POA) variance and helix angle (HA) variance are proposed. The two proposed parameters record the texture information of ground targets, and they supplement the scattering power in classification. Between adjacent pixels, the POAs of vegetation canopy scatterers are relatively random, the POAs of orthogonal buildings are more regular, and the POAs of oriented buildings are slightly higher than those of orthogonal buildings due to the continuous reflection of SAR signals between walls. Thus, the variances in orientation angles are the largest for forested areas, followed by oriented buildings and forests. The introduction of POA and HA variances can contribute to the efficacy of the decomposition method in classifying oriented buildings and forests. The full polarization data obtained by different satellites working at different bands are used to demonstrate the proposed parameters. The classification accuracy increased by 23.78%, attributed to the proposed polarimetric parameters. Furthermore, the proposed parameters have deepened the understanding of POA and HA of different ground targets.
Author Contributions
Z.L. provided the initial idea for this study and conceived the experiments; Y.L. contributed the experimental data and supplied the infrastructure for the experiments; Z.L. and X.H. performed the experiments, analyzed the results, and wrote the paper; Y.L. and J.H. conducted project administration, and provided important suggestions and reviews. All authors have read and agreed to the published version of the manuscript.
Funding
This paper was funded by the National Natural Science Foundation of China, grant numbers 41301377 and 42171260; the Collaborative Innovation Center for Natural Resources Planning and Marine Technology of Guangzhou, grant number 2023B04J0301; the Guangdong Enterprise Key Laboratory for Urban Sensing, Monitoring and Early Warning, grant number 2020B121202019.
Data Availability Statement
The data presented in this study are available on request from the corresponding author.
Acknowledgments
The authors thank the anonymous reviewers for their helpful suggestions and constructive comments on this paper.
Conflicts of Interest
The authors declare no conflict of interest.
References
- Turkar, V.; Checker, J.; De, S.; Singh, G. Impact of G4U and 7-component Target Decomposition on PolSAR Image Semantic Segmentation. Adv. Space. Res. 2022, 70, 3798–3810. [Google Scholar]
- De, S.; Bruzzone, L.; Bhattacharya, A.; Bovolo, F.; Chaudhuri, S. A novel technique based on deep learning and a synthetic target database for classification of urban areas in PolSAR data. IEEE J. Sel. Topics Appl. Earth Observ. Remote Sens. 2018, 11, 154–170. [Google Scholar] [CrossRef]
- Fan, H.; Quan, S.; Dai, D.; Wang, X.; Xiao, S. Refined model-based and feature-driven extraction of buildings from PolSAR images. Remote Sens. 2019, 11, 1379. [Google Scholar] [CrossRef]
- Chen, S.W.; Wang, X.S.; Xiao, S.P. Urban Damage Level Mapping Based on Co-Polarization Coherence Pattern Using Multitemporal Polarimetric SAR Data. IEEE J. Sel. Topics Appl. Earth Observ. Remote Sens. 2018, 11, 2657–2667. [Google Scholar] [CrossRef]
- Wang, H.; Yang, H.; Huang, Y.; Wu, L.; Guo, Z.; Li, N. Classification of Land Cover in Complex Terrain Using Gaofen-3 SAR Ascending and Descending Orbit Data. Remote Sens. 2023, 15, 2177. [Google Scholar] [CrossRef]
- van Zyl, J.J. Application of Cloude’s target decomposition theorem to polarimetric imaging radar data. Proc. SPIE Int. Soc. Opt. Eng. 1993, 1748, 184–192. [Google Scholar]
- Cloude, S.R.; Pottier, E. A review of target decomposition theorems in radar polarimetry. IEEE Trans. Geosci. Remote Sens. 1996, 34, 498–518. [Google Scholar] [CrossRef]
- Qi, Z.; Yeh, A.G.-O.; Li, X.; Lin, Z. A novel algorithm for land use and land cover classification using RADARSAT-2 polarimetric SAR data. Remote Sens. Environ. 2012, 118, 21–39. [Google Scholar] [CrossRef]
- Quan, S.; Xiong, B.; Xiang, D.; Kuang, G. Derivation of the Orientation Parameters in Built-Up Areas: With Application to Model-Based Decomposition. IEEE Trans. Geosci. Remote Sens. 2018, 56, 4714–4730. [Google Scholar] [CrossRef]
- Liu, W.; Yang, J.; Li, P.; Han, Y.; Zhao, J.; Shi, H. A Novel Object-Based Supervised Classification Method with Active Learning and Random Forest for PolSAR Imagery. Remote Sens. 2018, 10, 1092. [Google Scholar] [CrossRef]
- De Borba, A.A.; Muhuri, A.; Marengoni, M.; Frery, A.C. Feature Selection for Edge Detection in PolSAR Images. Remote Sens. 2023, 15, 2479. [Google Scholar] [CrossRef]
- Bouhlel, N.; Akbari, V.; Méric, S. Change Detection in Multilook Polarimetric SAR Imagery with Determinant Ratio Test Statistic. IEEE Trans. Geosci. Remote Sens. 2022, 60, 1–15. [Google Scholar] [CrossRef]
- Xiang, D.L.; Ban, Y.; Su, Y. Model-based decomposition with cross scattering for polarimetric SAR urban areas. IEEE Geosci. Remote Sens. Lett. 2015, 12, 2496–2500. [Google Scholar] [CrossRef]
- Quan, S.; Zhang, T.; Wang, W.; Kuang, G.; Wang, X.; Zeng, B. Exploring Fine Polarimetric Decomposition Technique for Built-up Area Monitoring. IEEE Trans. Geosci. Remote Sens. 2023, 61, 5204719. [Google Scholar] [CrossRef]
- Chen, Y.; Zhang, L.; Zou, B.; Gu, G. Polarimetric SAR Decomposition Method Based on Modified Rotational Dihedral Model. Remote Sens. 2023, 15, 101. [Google Scholar] [CrossRef]
- Chen, S.; Li, Y.; Wang, X.; Xiao, S.; Sato, M. Modeling and interpretation of scattering mechanisms in polarimetric synthetic aperture radar: Advances and perspectives. IEEE Signal Process. Mag. 2014, 31, 79–89. [Google Scholar] [CrossRef]
- Krogager, E. New decomposition of the radar target scattering matrix. Electron. Lett. 1990, 26, 1525–1527. [Google Scholar] [CrossRef]
- Cameron, W.L.; Youssef, N.N.; Leung, L.K. Simulated polarimetric signatures of primitive geometrical shapes. IEEE Trans. Geosci. Remote Sens. 1996, 34, 793–803. [Google Scholar] [CrossRef]
- Touzi, R. Target scattering decomposition in terms of roll-invariant target parameters. IEEE Trans. Geosci. Remote Sens. 2007, 45, 73–84. [Google Scholar] [CrossRef]
- Freeman, A.; Durden, S.L. A three-component scattering model for polarimetric SAR data. IEEE Trans. Geosci. Remote Sens. 1998, 36, 963–973. [Google Scholar] [CrossRef]
- Zhang, L.M.; Zou, B.; Cai, H.J. Multiple-component scattering model for polarimetric SAR image decomposition. IEEE Geosci. Remote Sens. Lett. 2008, 5, 603–607. [Google Scholar] [CrossRef]
- Chen, S.; Wang, X.S.; Xiao, S.P.; Sato, M. General Polarimetric Model-Based Decomposition for Coherency Matrix. IEEE Trans. Geosci. Remote Sens. 2014, 52, 1843–1855. [Google Scholar] [CrossRef]
- Sato, A.; Yamaguchi, Y.; Singh, G.; Park, S.E. Four-component scattering power decomposition with extended volume scattering model. IEEE Geosci. Remote Sens. Lett. 2012, 9, 166–170. [Google Scholar] [CrossRef]
- Lee, J.S.; Pottier, E. Polarimetric Radar Imaging: From Basics to Applications; CRC Press: Boca Raton, FL, USA, 2009. [Google Scholar]
- Li, D.; Zhang, Y. Adaptive Model-Based Classification of PolSAR Data. IEEE Trans. Geosci. Remote Sens. 2018, 56, 6940–6955. [Google Scholar] [CrossRef]
- Xiang, D.; Tang, T.; Ban, Y.; Su, Y.; Kuang, G. Unsupervised polarimetric SAR urban area classification based on model-based decomposition with cross scattering. ISPRS J. Photogramm. Remote Sens. 2016, 116, 86–100. [Google Scholar] [CrossRef]
- Han, W.; Fu, H.; Zhu, J.; Zhang, S.; Xie, Q.; Hu, J. A Polarimetric Projection-Based Scattering Characteristics Extraction Tool and Its Application to PolSAR Image Classification. ISPRS J. Photogramm. Remote Sens. 2023, 20, 314–333. [Google Scholar] [CrossRef]
- Lee, J.S.; Grunes, M.R.; Ainsworth, T.L.; Du, L.J.; Schuler, D.L.; Cloude, S.R. Unsupervised classification using polarimetric decomposition and the complex wishart classifier. IEEE Trans. Geosci. Remote Sens. 2002, 37, 2249–2258. [Google Scholar]
- Xie, Q.; Wang, J.; Liao, C.; Shang, J.; Lopez-Sanchez, J.M.; Fu, H.; Liu, X. On the Use of Neumann Decomposition for Crop Classification Using Multi-Temporal RADARSAT-2 Polarimetric SAR Data. Remote Sens. 2019, 11, 776. [Google Scholar] [CrossRef]
- Hariharan, S.; Mandal, D.; Tirodkar, S.; Kumar, V.; Bhattacharya, A.; Lopez-Sanchez, J.M. A Novel Phenology Based Feature Subset Selection Technique Using Random Forest for Multitemporal PolSAR Crop Classification. IEEE J. Sel. Top. Appl. Earth Obs. Remote Sens. 2018, 11, 4244–4258. [Google Scholar] [CrossRef]
- Zhou, Y.; Wang, H.; Xu, F.; Jin, Y.Q. Polarimetric SAR Image Classification Using Deep Convolutional Neural Networks. IEEE Geosci. Remote Sens. Lett. 2016, 13, 1935–1939. [Google Scholar] [CrossRef]
- Yamaguchi, Y.; Moriyama, T.; Ishido, M.; Yamada, H. Four-component scattering model for polarimetric SAR image decomposition. IEEE Trans. Geosci. Remote Sens. 2005, 43, 1699–1706. [Google Scholar] [CrossRef]
- Singh, G.; Yamaguchi, Y. Model-based six-component scattering matrix power decomposition. IEEE Trans. Geosci. Remote Sens. 2018, 56, 5687–5704. [Google Scholar] [CrossRef]
- Singh, G.; Malik, R.; Mohanty, S. Seven-component scattering power decomposition of POLSAR coherency matrix. IEEE Trans. Geosci. Remote Sens. 2019, 57, 8371–8382. [Google Scholar] [CrossRef]
- An, W.T.; Lin, M. A reflection symmetry approximation of multilook polarimetric SAR data and its application to Freeman–Durden decomposition. IEEE Trans. Geosci. Remote Sens. 2019, 57, 3649–3660. [Google Scholar] [CrossRef]
- Yamaguchi, Y.; Sato, A.; Boerner, W.M. Four-component scattering power decomposition with rotation of coherency matrix. IEEE Trans. Geosci. Remote Sens. 2011, 49, 2251–2258. [Google Scholar] [CrossRef]
- Lee, J.S.; Ainsworth, T.L. The effect of orientation angle compensation on coherency matrix and polarimetric target decompositions. IEEE Trans. Geosci. Remote Sens. 2010, 49, 53–64. [Google Scholar] [CrossRef]
- Singh, G.; Yamaguchi, Y.; Park, S.E. General four-component scattering power decomposition with unitary transformation of coherency matrix. IEEE Trans. Geosci. Remote Sens. 2013, 51, 3014–3022. [Google Scholar] [CrossRef]
- Quan, S.N.; Xiong, B.L.; Xiang, D.L.; Zhao, L.J.; Zhang, S.Q.; Kuang, G.Y. Eigenvalue-based urban area extraction using polarimetric SAR data. IEEE J. Sel. Topics Appl. Earth Observ. Remote Sens. 2018, 11, 458–471. [Google Scholar] [CrossRef]
- Kajimoto, M.; Susaki, J. Urban-Area Extraction from Polarimetric SAR Images Using Polarization Orientation Angle. IEEE Geoscie. Remote Sens. Lett. 2013, 10, 337–341. [Google Scholar] [CrossRef]
- Pal, M. Random forest classifier for remote sensing classification. Int. J. Remote Sens. 2005, 26, 217–222. [Google Scholar] [CrossRef]
- Sonobe, R.; Tani, H.; Wang, X.; Kobayashi, N.; Shimamura, H. Random forest classification of crop type using multi-temporal TerraSAR-X dual-polarimetric data. Remote Sens. Lett. 2014, 5, 157–164. [Google Scholar] [CrossRef]
- Collins, M.J.; Allan, J.M. Modeling and simulation of SAR image texture. IEEE Trans. Geosci. Remote Sens. 2009, 47, 3530–3546. [Google Scholar] [CrossRef]
- Yu, H.; Jiang, H.; Liu, Z.; Zhou, S.; Yin, X. EDTRS: A Superpixel Generation Method for SAR Images Segmentation Based on Edge Detection and Texture Region Selection. Remote Sens. 2022, 14, 5589. [Google Scholar] [CrossRef]
Disclaimer/Publisher’s Note: The statements, opinions and data contained in all publications are solely those of the individual author(s) and contributor(s) and not of MDPI and/or the editor(s). MDPI and/or the editor(s) disclaim responsibility for any injury to people or property resulting from any ideas, methods, instructions or products referred to in the content. |
© 2023 by the authors. Licensee MDPI, Basel, Switzerland. This article is an open access article distributed under the terms and conditions of the Creative Commons Attribution (CC BY) license (https://creativecommons.org/licenses/by/4.0/).