Article

Integration and Detection of a Moving Target with Multiple Beams Based on Multi-Scale Sliding Windowed Phase Difference and Spatial Projection

1
School of Microelectronics and Communication Engineering, Chongqing University, Chongqing 400044, China
2
Guangxi Key Laboratory of Wireless Wideband Communication and Signal Processing, Guilin 541004, China
3
School of Information and Electronics, Beijing Institute of Technology, Beijing 100081, China
*
Author to whom correspondence should be addressed.
Remote Sens. 2023, 15(18), 4429; https://doi.org/10.3390/rs15184429
Submission received: 10 July 2023 / Revised: 2 September 2023 / Accepted: 6 September 2023 / Published: 8 September 2023
(This article belongs to the Special Issue Advances in Radar Systems for Target Detection and Tracking)

Abstract

:
Due to the fast scanning speed of the current phased-array radar and the moving characteristics of the target, the moving target usually spans multiple beams during coherent integration time, which results in severe performance loss for target focusing and parameter estimation because of the unknown entry/departure beam time within the coherent period. To solve this issue, a novel focusing and detection method based on the multi-beam phase compensation function (MBPCF), multi-scale sliding windowed phase difference (MSWPD), and spatial projection are proposed in this paper. The proposed method mainly includes the following three steps. First, the geometric and signal models of multiple beam integration with observed moving targets are accurately established where the range migration (RM), Doppler frequency migration (DFM), and beam migration (BM) are analyzed. Based on that, the BM is eliminated by the MBPCF, the second-order keystone transform (SOKT) is utilized to mitigate the RM, and then, a new MSWPD operation is developed to estimate the target’s entry/departure beam time, which realizes well-focusing output within the beam. After that, by dividing the radar detection area, the spatial projection (SP) method is adopted to obtain multiple-beams joint integration, and thus, improved detection performance can be obtained. Numerical experiments are carried out to evaluate the performance of the proposed method. The results show that the proposed method could achieve superior focusing and detection performances.

Graphical Abstract

1. Introduction

Target detection and parameter estimation are two important functions of modern radars, which are very meaningful for the subsequent target imaging and recognition tasks [1,2,3,4,5,6,7,8,9]. However, the development of stealth technology and the promotion of target maneuverability result in the performance of detection and parameter estimation deterioration. Therefore, how to improve the focusing and parameter estimation performances has become a current research hot topic [10,11,12,13]. The long-time integration method, which has been proven to be a powerful signal-processing approach for enhancing target detection ability, has attracted more and more attention in the past decades [14,15,16]. However, due to the fast scanning characteristics and flexible beam shape of the modern radar system, the moving target usually spans multiple beams during integration time. In addition to range migration (RM) and Doppler frequency migration (DFM), beam migration (BM) commonly happens within the coherent integration period [17,18]. As a consequence, the existing moving target focusing and detection methods, in which only RM correction and DFM compensation are considered, could not obtain the focusing and detection anymore [19,20,21,22,23,24,25,26,27,28,29,30,31,32,33,34,35,36,37,38,39,40,41,42,43,44,45,46,47]. Therefore, it is necessary to study further the accumulation method suitable for multi-beam with moving targets.
In the last decades, many long-time integration methods have been proposed to detect the moving target. They are generally divided into the following two categories: incoherent integration methods [19,20,21,22,23,24,25,26] and coherent integration methods [27,28,29,30,31,32,33,34,35,36,37,38,39,40,41,42]. The first one is easy to realize because it merely adds up the magnitude of the echo signal. Typical incoherent integration methods contain Hough transform (HT) [19], Radon transform (RT) [20,21], matching filter [22,23], dynamic programming [24], and projection transformation [25,26]. However, the common disadvantage of these methods is low integration gain since the phase information is discarded.
Coherent integration methods consider the amplitude information and phase information simultaneously so they can achieve a higher signal-to-noise ratio (SNR) gain. Accurate RM correction and DFM compensation are the keys to achieving coherent accumulation. Over the years, many approaches have been proposed to eliminate RM, which is mainly classified into three groups. The first kind is keystone transform (KT)-based approaches [27,28,29,30,31], such as first-order KT [27,28], second-order KT (SOKT) [29], Doppler keystone [30], deramp keystone [31], etc. However, these methods suffer from the problem of Doppler ambiguity. The second category is the RT- or HT-based methods [32,33,34], such as Radon linear canonical transform (RLCT) [32], Radon Lv’s distribution (RLVD) [33], and modified coherent HT (MCHT) [34], etc. However, the computational complexity of these methods is often huge for the multidimensional searching in the parameter space. The third class is the correlation function-based algorithms [35,36,37], such as symmetric autocorrelation function (SAF) [35], modified SAF (MSAF) [36], and adjacent cross-correlation function (ACCF) [37]. However, the SAF and MSAF methods have high computational load due to constructing autocorrelation functions in the range-azimuth domain. Although the computational complexity of the ACCF algorithm is low, it needs multiple nonlinear transformations, and the performance loss is relatively large.
After the range compression, the parameter search and estimation algorithms have been developed to estimate the time-varying DFM, for example, fractional Fourier-transform (FrFT) [38], Radon-Fourier-transform (RFT)-based [39,40,41,42,43], high-order ambiguity function (HAF) [44], Lv’s distribution (LVD) [45], etc. However, the FrFT and the RFT-based methods, such as Radon fractional Fourier-transform (RFrFT) and generalized RFT (GRFT), need to use search operation, which means huge computational complexity. The HAF method obtains phase parameters through a one-dimensional search based on multiple nonlinear operations, which saves much calculation but has a high performance loss. The LVD method can also suppress the DFM. However, a 2D parameter space is used to replace a one-dimensional signal with an increased computational cost. There are two other algorithms, i.e., the second-order Wigner-Ville distribution (SoWVD) [46] and the coherently integrated cubic phase function (CICPF) algorithm [47]. Similar to [46], the two algorithms use a 2D parameter space instead of a one-dimensional signal to perform the parameter estimation, so it is obviously not efficient. Additionally, through the processing of the above algorithms, beam migration of the moving target has not been considered, which means they are unsuitable for the situation where the target spans multiple beams.
As for beam migration (BM), there is little research on this aspect. Reference [48] proposed the time-shared multi-beam (TSMB) and space-shared multi-beam (SSMB) associated coherent integration algorithm. This method considers multi-beam compensation. However, it only considered the pointing phase difference between different beams but did not note the existence of RM and DFM, so it has certain limitations.
However, the methods mentioned above [19,20,21,22,23,24,25,26,27,28,29,30,31,32,33,34,35,36,37,38,39,40,41,42,43,44,45,46,47,48] are all based on the assumption that the time when the moving target enters and leaves the beam is already known. In the real scene application, the target may enter a radar coverage area unannounced and leave after an unspecified period, so the time information cannot be predicted, which leads to low efficacy for the above methods.
Motivated by the previous works, a novel focusing and detection method based on multi-beam phase compensation function (MBPCF), multi-scale sliding windowed phase difference (MSWPD), and spatial projection is proposed in this paper. The proposed method mainly includes the following three steps. First, the geometric model diagram system is established to obtain the echo signal. Then, the beam migration is compensated by MBPCF. The SOKT is used to compensate for the range curvature migration (RCM) within different beams. Next, a new multi-scale windowed phase difference (MSWPD) operation is proposed, which can estimate the time information of the target, eliminate the range walk migration (RWM) and linear DFM (LDFM), and complete coherent integration. In the next step, the spatial projection (SP) method is utilized to complete the joint multi-beam integration and collect the energy scattered in different beams. Finally, the results based on the simulation data and synthesized data are used to verify the effectiveness of the proposed algorithm.
The main contributions are summarized as follows.
(1)
The proposed MBPCF can accurately compensate for the beam migration;
(2)
The time information (the time when the moving target enters the beam and the time when it leaves the beam) can be accurately estimated by the proposed MSWPD. In this process, the RM and DFM are all eliminated, and coherent integration within the beam is realized;
(3)
Using the SP algorithm, multi-beam joint integration can be realized.
The remainder of the paper is organized as follows. The geometric and signal models of multiple beams integration with observed moving targets are established, and the impacts of RM, DFM, and BM on the integration are also analyzed in Section 2. In Section 3, the efficient focusing processing procedures of moving targets with multiple beams are presented. Some discussions of the proposed approach are given in Section 4. Numerical experiments are provided to demonstrate the performance of the proposed approach in Section 5 and Section 6. Finally, this paper concludes with a brief summary in Section 7.

2. Geometric and Signal Models for Moving Targets with Multiple Beam

2.1. Geometric and Signal Models

In the 3D slant plane, the geometric model between the radar platform and the moving target is depicted in Figure 1. In the model, a Cartesian coordinate system is formed by using the X O Y plane as the horizontal plane and the Z axis as its perpendicular. For this radar system, within the total integration time T , the radar platform emits N beams, which are represented by different colors. Assuming that v p , v a , and v r are radar platform speed, target azimuth speed, and target range speed, respectively. In the first beam, the position of the radar platform is ( 0 , 0 , H ) , and the position of the moving target is P M T ( 0 , Y 1 , 0 ) . In the n th beam, the position of the radar platform is ( X r , n , 0 , H ) , and the position of the moving target is P M T ( X n , Y n , 0 ) . During the time T , the target moves from P M T ( 0 , Y 1 , 0 ) to P M T . The instantaneous slant range between the moving target and the radar platform in the n th beam is indicated by R s ( t ˜ m ) .
Classification of methods to enhance feature extraction performance in a SAR ship and object detection. On the basis of the motion geometric model depicted in Figure 1, R s ( t ˜ m ) represents the instantaneous slant range between the moving target and the radar in the n th beam, and it is written as follows:
R s ( t ˜ m ) = ( X r , n + v p t ˜ m X n v a t ˜ m ) 2 + ( Y n v r t ˜ m ) 2 + H 2
where t ˜ m = t m t i n n denotes the slow-time variable in the n th beam and n [ 1 , 2 , , N ] . t m denotes the azimuth slow-time variable, t i n n is the time when the target enters the n th beam. Within the coherent integration time, the target instantaneous slant distance R s ( t ˜ m ) can be expanded according to the Taylor series expansion, and a quadratic term model is utilized; there is [49,50]:
R s ( t ˜ m ) R 0 , n + b 1 , n t ˜ m + b 2 , n t ˜ m 2
where R 0 , n , b 1 , n , and b 2 , n are defined as the nearest slant range, radial velocity, and radial acceleration in the n th beam, respectively, as follows:
R 0 , n = ( X r , n X n ) + Y n 2 + H 2 , b 1 , n = ( X r , n X n ) ( v p v a ) Y n v r R 0 , n b 2 , n = [ ( v p v a ) ( X r , n X n ) v r Y n ] 2 2 R 0 , n 3 + ( v p v a ) 2 + v r 2 2 R 0 , n
It is assumed that the radar system employed the widely used linear frequency modulation signal as the transmitted signal, with the following form:
s ( t ) = rect ( t T p ) exp ( j π K r t 2 ) exp ( j 2 π f c t )
where t ,   T p ,   f c , and K r represent the fast time, pulse length, carrier frequency, and chirp rate of the transmitted signal, respectively. The rect is the unit rectangular window function, and rect ( t T p ) = { 1 , | t | T p / 2 0 , | t | > T p / 2 . After down-conversion and beamforming, the received baseband signal of the moving target in the n th beam is expressed as follows [51,52]:
s b a s e , n ( t , t ˜ m ) = w n ( t ˜ m ) × rect [ t 2 R s ( t ˜ m ) / c T p ] × exp [ j π K r ( t 2 R s ( t ˜ m ) c ) 2 ] × exp [ j 4 π λ R s ( t ˜ m ) ] exp [ j π ( M 1 ) 2 θ d ( n ) ]
where c ,   λ , and M represent the speed of the electromagnetic wave, the wavelength of the transmitted signal, and the number of array elements in this radar system, respectively, w n ( t ˜ m ) is an azimuth modulation window function, i.e.,
w n ( t ˜ m ) = rect [ t m 0.5 ( t i n n + t o u n ) t o u n t i n n ] = rect ( t ˜ m 0.5 Δ T n Δ T n ) = { 1 , t i n n t m t o u n 0 , t o u n t m t i n ( n + 1 )
Δ T n is the integration time of the n th beam, θ d ( n ) = θ d 0 + ( n 1 ) ( θ b , 3 dB + θ C ) denotes the beam angle of the target in the n th beam. θ d 0 is the beam angle of the target in the first beam. θ b , 3 dB and θ C donate the half-power beam width and beam gap width, respectively. The derivation process of the third exponential term is given in Appendix A.
After the pulse compression [51,52] and substituting Equation (2) into Equation (5), the received baseband signal in the range- and azimuth-time domain is written as follows:
s b a s e , n ( t , t ˜ m ) = A × w n ( t ˜ m ) × sin c { B [ t 2 ( R 0 , n + b 1 , n t ˜ m + b 2 , n t ˜ m 2 ) c ] } × exp [ j 4 π λ ( R 0 , n + b 1 , n t ˜ m + b 2 , n t ˜ m 2 ) ] × exp [ j π ( M 1 ) 2 θ d ( n ) ]
where A is the complex amplitude of the received signal, B = K r T p is the bandwidth of the transmitted signal, and sin c ( x ) = sin ( π x ) / ( π x ) is the sin c function.

2.2. Signal Characteristics

(1) Range Migration and Doppler Frequency Migration Analysis: as described in the function term of Equation (6), the range fast time is coupled with the azimuth slow-time t ˜ m , which leads to the position of pulse envelope changes with the azimuth slow-time. Therefore, the offset from the range position of the target can be expressed as:
{ Δ R 1 , n = | b 1 , n t ˜ m | t ˜ m [ Δ T n 2 , Δ T n 2 ] = | 2 b 1 , n ( Δ T n 2 ) | Δ R 2 , n = | b 2 , n t ˜ m 2 | t ˜ m [ Δ T n 2 , Δ T n 2 ] = | b 2 , n ( Δ T n 2 ) 2 |
where Δ R 1 , n and Δ R 2 , n represent the range position offsets caused by t ˜ m and t ˜ m 2 -terms in the n th beam, respectively. If Δ R 1 , n > c / 2 B , then, there is an RWM phenomenon, the RWM is the linear trajectory in the range and azimuth plane. Additionally, if Δ R 2 , n > c / 2 B , the RCM will emerge, the RCM is the curved trajectory in the range and azimuth plane. The RWM and RCM lead to the target energy defocuses along the range dimension.
As described in the first exponential term of Equation (6), the offset from the azimuth-Doppler frequency of the target can be expressed as:
{ Δ f 1 , n = | 2 b 1 , n λ | t ˜ m [ Δ T n 2 , Δ T n 2 ] = | 2 b 1 , n λ | Δ f 2 , n = | 4 b 2 , n λ t ˜ m | t ˜ m [ Δ T n 2 , Δ T n 2 ] = | 8 b 2 , n λ ( Δ T n 2 ) | = | 4 b 2 Δ T n λ |
where Δ f 1 , n and Δ f 2 , n represent azimuth-Doppler frequency offsets caused by t ˜ m and t ˜ m 2 -terms in the n th beam, respectively. Doppler center shift (DCS) will emerge when Δ f 1 , n > 1 / T B , n , whereas DCS can not cause the defocusing of target energy. If Δ f 2 , n > 1 / T B , then LDFM will appear. The LDFM is symmetric with respect to the Doppler center frequency and results in the defocusing effect along the azimuth dimension;
(2) Beam Migration Analysis: In the second exponential term of Equation (6), the beam angle changes with the change of n :
Δ θ = | θ d n θ d 0 | = | ( n 1 ) ( θ b , 3 dB + θ C ) |
where Δ θ represents the offset of the beam angle caused by the moving target being in different beams. This leads to the BM, and the BM means that the energy scatters in different beams. Figure 2a shows the distribution diagram of BM. One can see that the dotted line represents the trajectory of the moving target, which indicates that the target spans multiple beams in the integration time T . In the meantime, Figure 2b shows the distribution diagram of RM, DFM, and BM in the range-time and azimuth-Doppler domain, and the red line is the trajectory of the moving target The graphic contains a number of range and azimuth-Doppler domain maps, each of which corresponds to different beams. It can be observed that the energy of the moving target defocuses along the range dimension and azimuth-Doppler dimension in each beam and scatters among different beams.
(3) Potential Complex Doppler Ambiguity Analysis: The potential complex azimuth-Doppler ambiguity is also an important factor affecting the focusing performance of radar systems [53,54], which should be further investigated. When DCS is larger than f PRF / 2 , a Doppler center blur will appear. In addition, the Doppler-spectrum distribution caused by DCS and LDFM can be divided into the following three situations: Case 1, when Δ f d < f PRF , and the Doppler-spectrum is distributed into one PRF band, as shown in Figure 3a; Case 2, when Δ f d < f PRF , but the Doppler-spectrum occupies into two adjacent PRF bands, as shown in Figure 3b; Case 3, the Doppler-spectrum is scattered into several adjacent PRF bands, as shown in Figure 3c. Δ f d is the Doppler-spectrum broadening, and f d c is the Doppler center shift. It should be noted that if the Doppler-spectrum is not in one PRF band (i.e., Case 2 and 3), there will be the Doppler-spectrum ambiguity phenomenon.

3. Propose Method Description

After the analysis in Section 2.2, RM and DFM led to defocusing on the range dimension and azimuth dimension. The BM causes the energy to be dispersed in different beams. Unknown target time information may also result in the invalidation of the integration methods. The above problems seriously affect the integration performance. Therefore, a new approach is developed in this section.

3.1. Beam Migration Compensation

Through the compensation of the second exponential term in Equation (6), the signals in different beam angles can be compensated to the same beam angle. The definition of MBPCF is:
F ( n ) = exp [ j π ( M 1 ) 2 ( n 1 ) ( θ b , 3 dB + θ C ) ]
Multiplying Equation (10) by Equation (6) to obtain the signal:
s 1 , n ( t , t ˜ m ) = A × w n ( t ˜ m ) × sin c { B [ t 2 ( R 0 , n + b 1 , n t ˜ m + b 2 , n t ˜ m 2 ) c ] } × exp [ j 4 π λ ( R 0 , n + b 1 , n t ˜ m + b 2 , n t ˜ m 2 ) ] × exp [ j π ( M 1 ) 2 θ d 0 ]
From Equation (11), one can see that the beam angles of all signals are θ d 0 . Then, the signal transformed into the range-frequency and the azimuth-time domain, and the corresponding result, omitting the complex amplitude and the second exponential term, is written as follows:
s 1 , n ( f , t ˜ m ) = w n ( t ˜ m ) × rect ( f B ) × exp [ j 4 π c ( f + f c ) R 0 , n ] × exp [ j 4 π c ( f + f c ) b 1 , n t ˜ m ] × exp [ j 4 π c ( f + f c ) b 2 , n t ˜ m 2 ]
After the beam angle compensation, the signals from different beam directions are regarded as coming from the same one. At this time, the BM is eliminated. However, due to the existence of a beam interval, the signals are distributed in different time periods. For convenience, we still use the description of the beam instead of the time period in the subsequent processing.

3.2. Fine Focusing on Moving Target

3.2.1. Coherent Integration within the Beam

Restoring t ˜ m , and the signal is recast as:
s 1 , n ( f , t m ) = w n ( t m ) × rect ( f B ) × exp [ j 4 π c ( f + f c ) R 0 , n ] × exp { j 4 π c ( f + f c ) [ b 1 , n ( t m t i n n ) ] } × exp { j 4 π c ( f + f c ) [ b 2 , n ( t m t i n n ) 2 ] }
From the range-frequency signal in Equation (13), one can see that three coupled terms between the range-frequency variable f and slow-time variable t m are generated, whose coefficients correspond to three motion parameters, i.e., b 1 , n , and b 2 , n . Considering that KT or SOKT can effectively eliminate the effect of RCM in the low signal-to-noise ratio (SNR) environment [27,55,56], we apply SOKT to eliminate the coupled term between the second-order coefficient b 2 , n and f . The expression of SOKT is noted as [56]:
( t m t i n n ) 2 = f c f + f c ( ξ t i n n ) 2
From Taylor series expansion: f c / ( f + f c ) 1 f / 2 f c . Substituting Equation (14) into Equation (13), there is:
s 2 , n ( f , ξ ) = w n ( t m ) × rect ( f B ) × exp ( j 4 π c f R 0 , n ) × exp { j 4 π c f [ b 1 , n 2 ( ξ t i n n ) ] } × exp { j 4 π λ [ R 0 , n + b 1 , n ( ξ t i n n ) ] } × exp { j 4 π λ b 2 , n ( ξ t i n n ) 2 }
where ξ denotes the new slow-time variable. According to Equation (15), the RCM is effectively compensated, but the RWM and DFM still exist. From estimation theory, the phase difference (PD) method is widely used to reduce the order of high-order signals and the PD is defined by [57]:
P D 1 [ n ; τ ] = x ( n + τ ) x ( n τ )
where ( * ) is a complex conjugate operation and τ represents a lag variable.
Motivated by the PD method, a new MSWPD operation is first proposed to perform RWM correction and LDFM compensation as well as the estimation of the moving target’s time information. The definition of MSWPD is:
MSWPD ( t ¯ , Δ T ¯ n ) = g ( t ¯ i n n , Δ T ¯ n ) × s 2 , n ( f , ξ + η n 2 ) × s 2 , n * ( f , ξ η n 2 ) = g ( t ¯ i n n , Δ T ¯ n ) × w n ( t m ) × rect ( f B ) × exp ( j 4 π λ b 1 , n η n ) × exp ( j 4 π c f b 1 , n 2 η n ) × exp [ j 4 π λ 2 b 2 , n η n ( ξ t i n n ) ]
where g ( t ¯ i n n , Δ T ¯ n ) denotes the window function, i.e.,
g ( t ¯ i n n , Δ T ¯ n ) = rect ( t m t ¯ i n n 0.5 Δ T ¯ n Δ T ¯ n ) = { 1 , t ¯ i n n t m t ¯ o u n 0 , t ¯ o u n t m t ¯ i n ( n + 1 )
and t ¯ i n n and Δ T ¯ n are, respectively, the beginning time and integration time of the n th beam that needs to be estimated. The η n is the lag variable; the value η n is analyzed in Section 4.
From Equation (18), one can see that after MSWPD operation, RWM and LDFM are all compensated. Therefore, after performing the range IFFT and azimuth FFT, a moving target will be finely focused in the range-time and azimuth-Doppler domain, i.e.,
s 3 , n ( t , f ξ ) = δ ( t b 1 , n η n c ) × δ [ ( Δ T n η n ) ( f ξ + 4 b 2 , n η n λ ) ]
where f ξ is the azimuth–Doppler frequency variable corresponding to ξ . From (17) and (18), one can see that if the beginning time t i n n and integration time Δ T n are accurately matched, the moving target will be well-focused at ( b 1 , n η n / c , 4 b 2 , n η n / λ ) . Therefore, t i n n and Δ T n can be obtained via the following cost function:
( t i n n , Δ T n ) = arg   max ( t ¯ i n n , Δ T ¯ n ) | IFFT f { FFT ξ [ MSWPD ( t ¯ , Δ T ¯ n ) ] } |
where IFFT f ( · ) and FFT ξ ( · ) represent the IFFT over the range–frequency variable f and FFT over the slow-time variable ξ , and MSWPD ( · ) represents a multi-scale sliding window phase difference operation. The peak position can be obtained as follows:
( t , f ξ ) = arg   max ( t , f ξ ) | IFFT f { FFT ξ [ MSWPD ( t , Δ T n ) ] } |
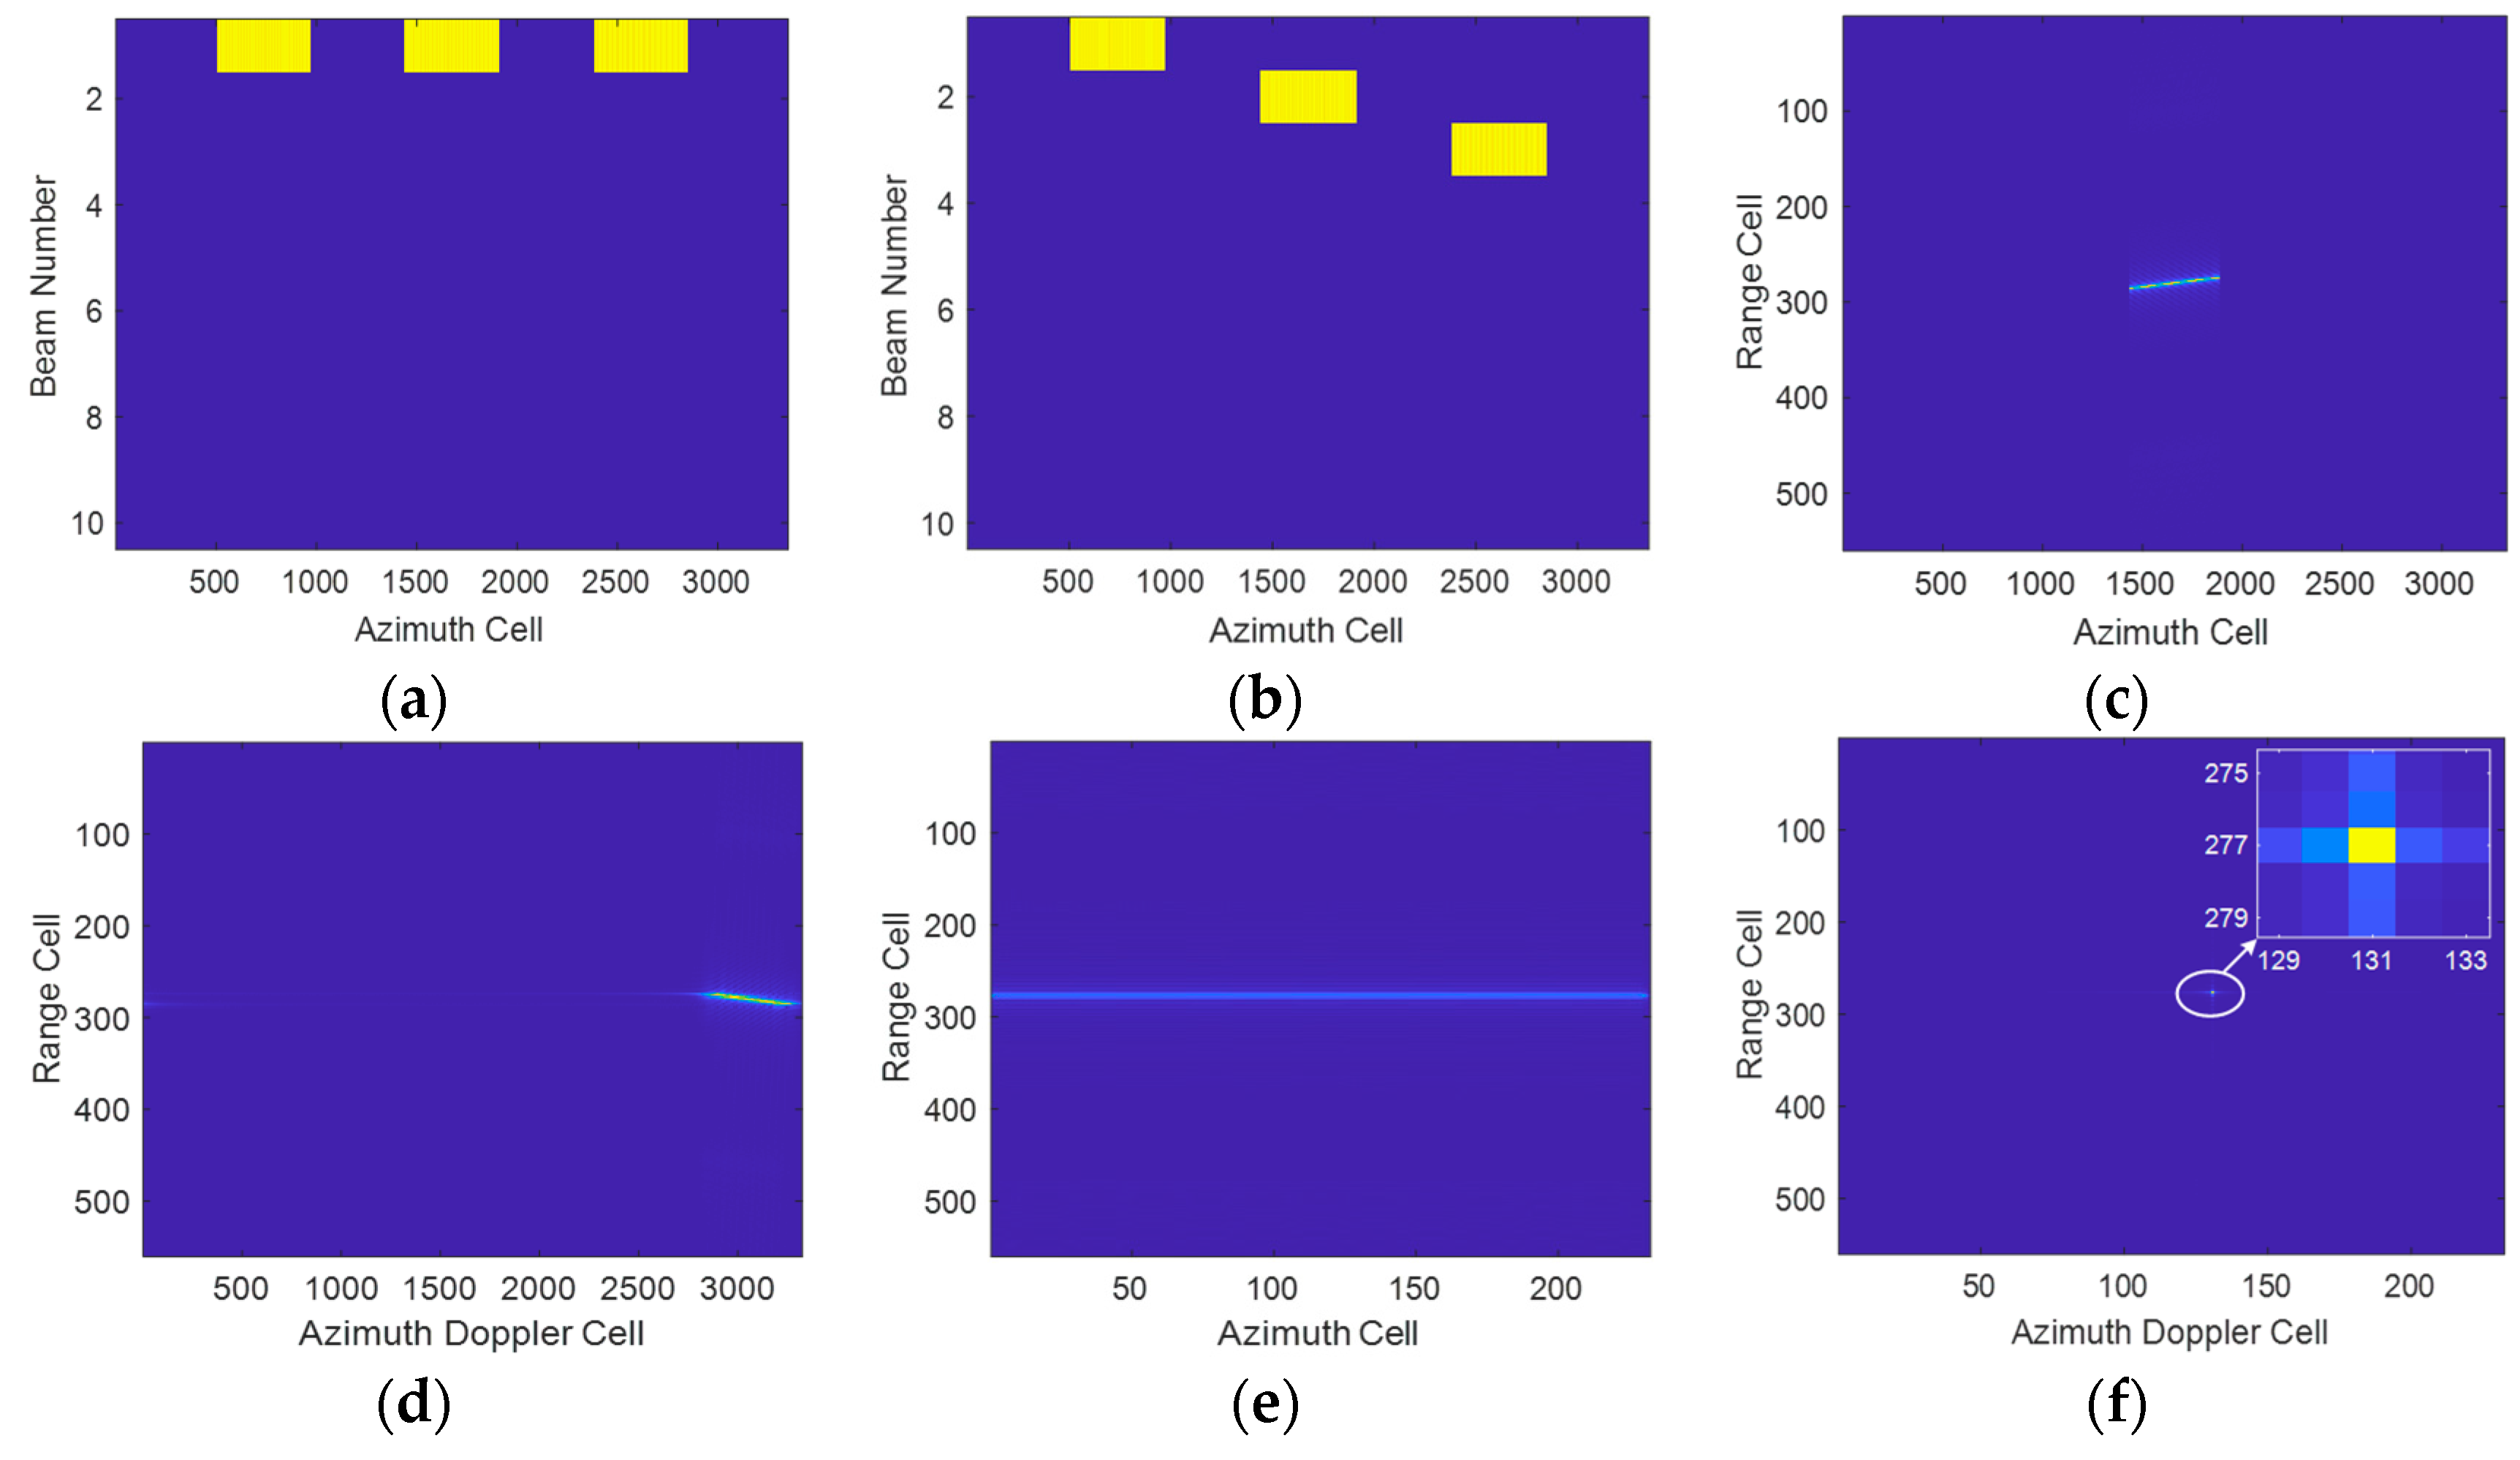
Here, a simulation example, denoted as Example A, is provided to verify the above analysis for the MBPCF and MSWPD performance. Figure 4 shows the result of the above operations without noise. The main simulated parameters for the radar are set as follows: f c = 2   GHz , B = 30   MHz , P R F = 1000   Hz , B e a m N u m b e r = 3 , and T = 2.35   s . The moving target A, with v a = 260   m / s and v r = 130   m / s is set. Figure 4a indicates that the target echoes are distributed in different beams. After the MBPCF operation, the target echoes are concentrated in the same beam, as shown in Figure 4b. These two images attest that the MBPCF can deal with the BM of the target. Figure 4c–f prove the effectiveness of the MSWPD operation. For the convenience of describing all beams being processed in the same way, we take the second beam as an example here. The trajectory of the target after range compression is shown in Figure 4c, from which the trajectory indicates evident RM. The Doppler spectra of the moving target in the range-time and the Doppler–frequency domain are displayed in Figure 4d. Notably, the target energy still distributes into several azimuth-Doppler cells. Figure 4e shows the range-azimuth map of the target in the second beam after SOKT and MSWPD processing. It can be seen that the RM and LDFM are all compensated. At this time, the target can be subjected to Fourier transform along the azimuth dimension to realize energy integration, and the result is shown in Figure 4f.
After the MBPCF and MSWPD processing, the coherent integration is completed within the beam. In order to increase the SNR gain as much as possible, we use the SP operation to realize multi-beam joint integration.

3.2.2. Joint Integration among Different Beams Based on Spatial Projection

After the processing in Section 3.2.1, the times the moving target enters and leaves the n th beam have been known, and the signal can be rephrased as:
s 3 , n ( t , f ξ n ) = δ ( t b 1 , n η n c ) × δ ( f ξ n + 4 b 2 , n η n λ )
where ξ n represents the slow time in the nth beam. The azimuth velocity and radial acceleration of the moving target are both constant values. Therefore, there are:
Δ T 1 = Δ T 2 = , , = Δ T N = 2 η n = 2 η b 2 , 1 = b 2 , 2 = , , = b 2 , N = b 2
The signal can be represented as:
s 3 , n ( t , f ξ n ) = δ ( t b 1 , n η c ) × δ ( f ξ n + 4 b 2 η λ )
After conducting the FFT along the variable t in Equation (23), we have
s 3 , n ( f , f ξ n ) = exp ( j 4 π c f b 1 , n 2 η ) × δ ( f ξ n + 4 b 2 η λ )
According to Equation (23), the moving target appears at the same Doppler position in the N maps. Nevertheless, the b 1 , n is different with the change of n , which leads to the offset in range dimension, and the different and unknown ranges where the moving target is located to make the direct integration of a multi-beam in the range–Doppler domain impracticable.
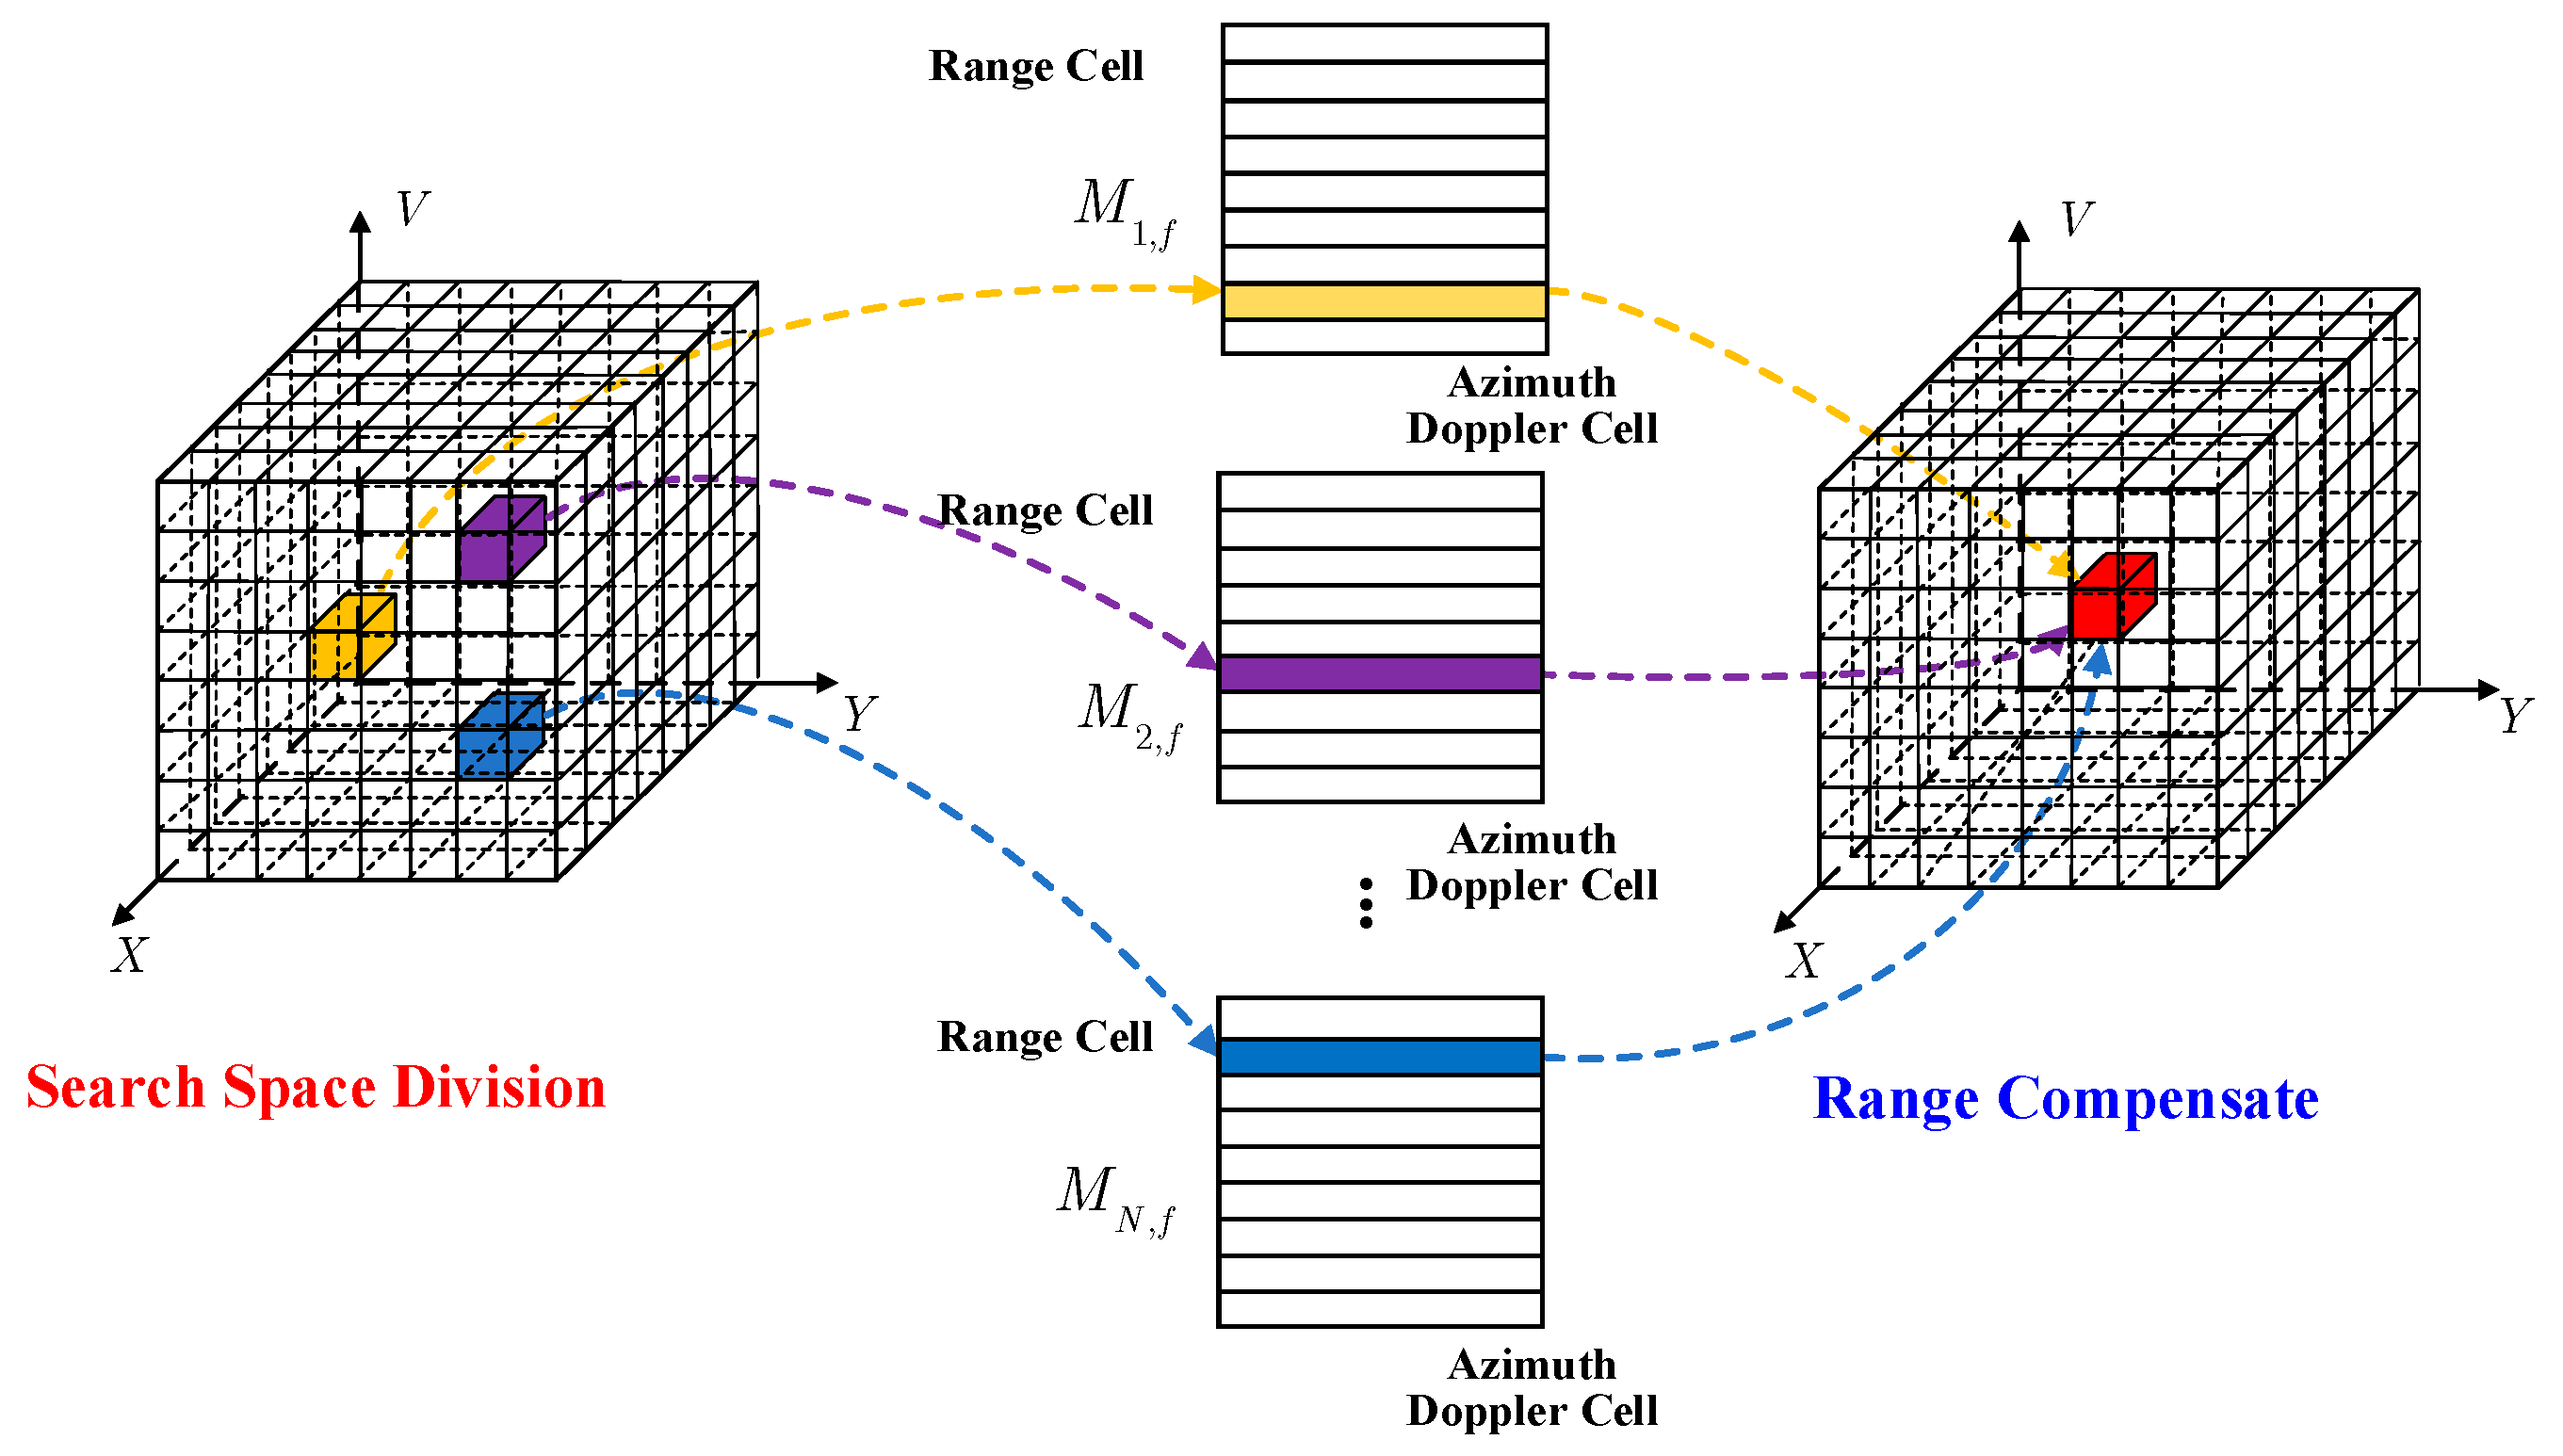
From Equation (3), b 1 , n is determined by the position ( X n , Y n ) , range velocity v r , and azimuth velocity v a of the moving target in n th beam. However, the influence of v a can be ignored, see Appendix B for a certificate. Based on the above analysis, we propose a new SP method and re-establish the X Y V coordinate system in the spatial domain, in which X , Y , and V are the azimuth position, the range position, and the range velocity of the moving target, respectively. The different ranges in the range-Doppler domain are all projected into the same position in the X Y V domain (i.e., the ranges are the same), and the multi-beam joint integration is possible. The specific operation is as follows.
Firstly, project the ranges into the X Y V domain. The radar detection area is divided into the grid with cells in the X Y V domain, and the position of each cell can be expressed as ( x ¯ k , y ¯ k , v ¯ r k ) . From Equation (15), the radial velocity b ¯ 1 , k can be expressed as:
b ¯ 1 , k ( x ¯ k , y ¯ k , v ¯ r k ) = ( X r , k x ¯ k ) v p R ¯ 0 , k v ¯ r , k y ¯ k R ¯ 0 , k
For the n th beam, the coordinates are ( x ¯ n , y ¯ n , v ¯ r n ) , and we have:
b ¯ 1 , n ( x ¯ k , y ¯ k , v ¯ r k ) = ( X r , n x ¯ n ) v p R ¯ 0 , n v ¯ r , n y ¯ n R ¯ 0 , n
where x ¯ n = x ¯ k , y ¯ n = y ¯ k + v ¯ r , k ( t i n n t i n k ) , and v ¯ r , n = v ¯ r , k .
Secondly, construct the range compensation function and realize range compensation. In the X Y V domain, the positions in different beams are all compensated to the k th beam, so the range compensation function of the n th beam is:
H r , n ( f ; x ¯ k , y ¯ k , v ¯ r , k ) = exp [ j 4 π c f η b ¯ 1 , n ( x ¯ k , y ¯ k , v ¯ r k ) ] × exp [ j 4 π c f η b ¯ 1 , k ( x ¯ k , y ¯ k , v ¯ r k ) ]
Multiplying Equation (24) and Equation (27), there is:
s 4 , n ( f , f ξ n ; x ¯ k , y ¯ k , v ¯ r , k ) = exp ( j 4 π c f ( b 1 , n 2 b ¯ 1 , n 2 ) η ) × exp ( j 4 π c f b ¯ 1 , k 2 η ) × δ ( f ξ n + 4 b 2 η λ ) , ( n = 1 , 2 , , N )
At this time, in the X Y V domain, the positions of the moving target in different beams are the same, i.e., the range positions of different maps are all at the same one in the range-Doppler domain.
Last, complete multi-beam joint integration. The joint-integration result of all beams can be expressed by the following formula:
s m ( f , f ξ n ; x ¯ k , y ¯ k , v ¯ r , k ) = n = 1 N | s 4 , n ( f , f ξ n ; x ¯ k , y ¯ k , v ¯ r , k ) | = N exp ( j 4 π c f b ¯ 1 , k η 2 ) × δ ( f ξ n + 4 b 2 η λ )
where | · | means absolute value operation. Then, after the range IFFT is performed in Equation (29), the following form can be obtained:
s m ( t , f ξ n ; x ¯ k , y ¯ k , v ¯ r , k ) = N δ ( t b ¯ 1 , n η c ) × δ ( f ξ n + 4 b 2 η λ )
If the motion parameters ( x ¯ k , y ¯ k , v ¯ r k ) are correctly matched, an obvious peak will be formed in the range-Doppler domain. Considering that the motion parameters are usually unknown a priori, which can be obtained by the following operation:
( x k , y k , v r , k ) = arg   max ( x ¯ k , y ¯ k , v ¯ r , k ) [ s m ( t , f ξ n ; x ¯ k , y ¯ k , v ¯ r , k ) ]
The final result of multi-beam joint integration is as follows:
s m ( t , f ξ n ) = N δ ( t b 1 , n η c ) × δ ( f ξ n + 4 b 2 η λ )
After the SP operations, the joint integration can be realized. The sketch of the multi-beam joint integration is shown in Figure 5.
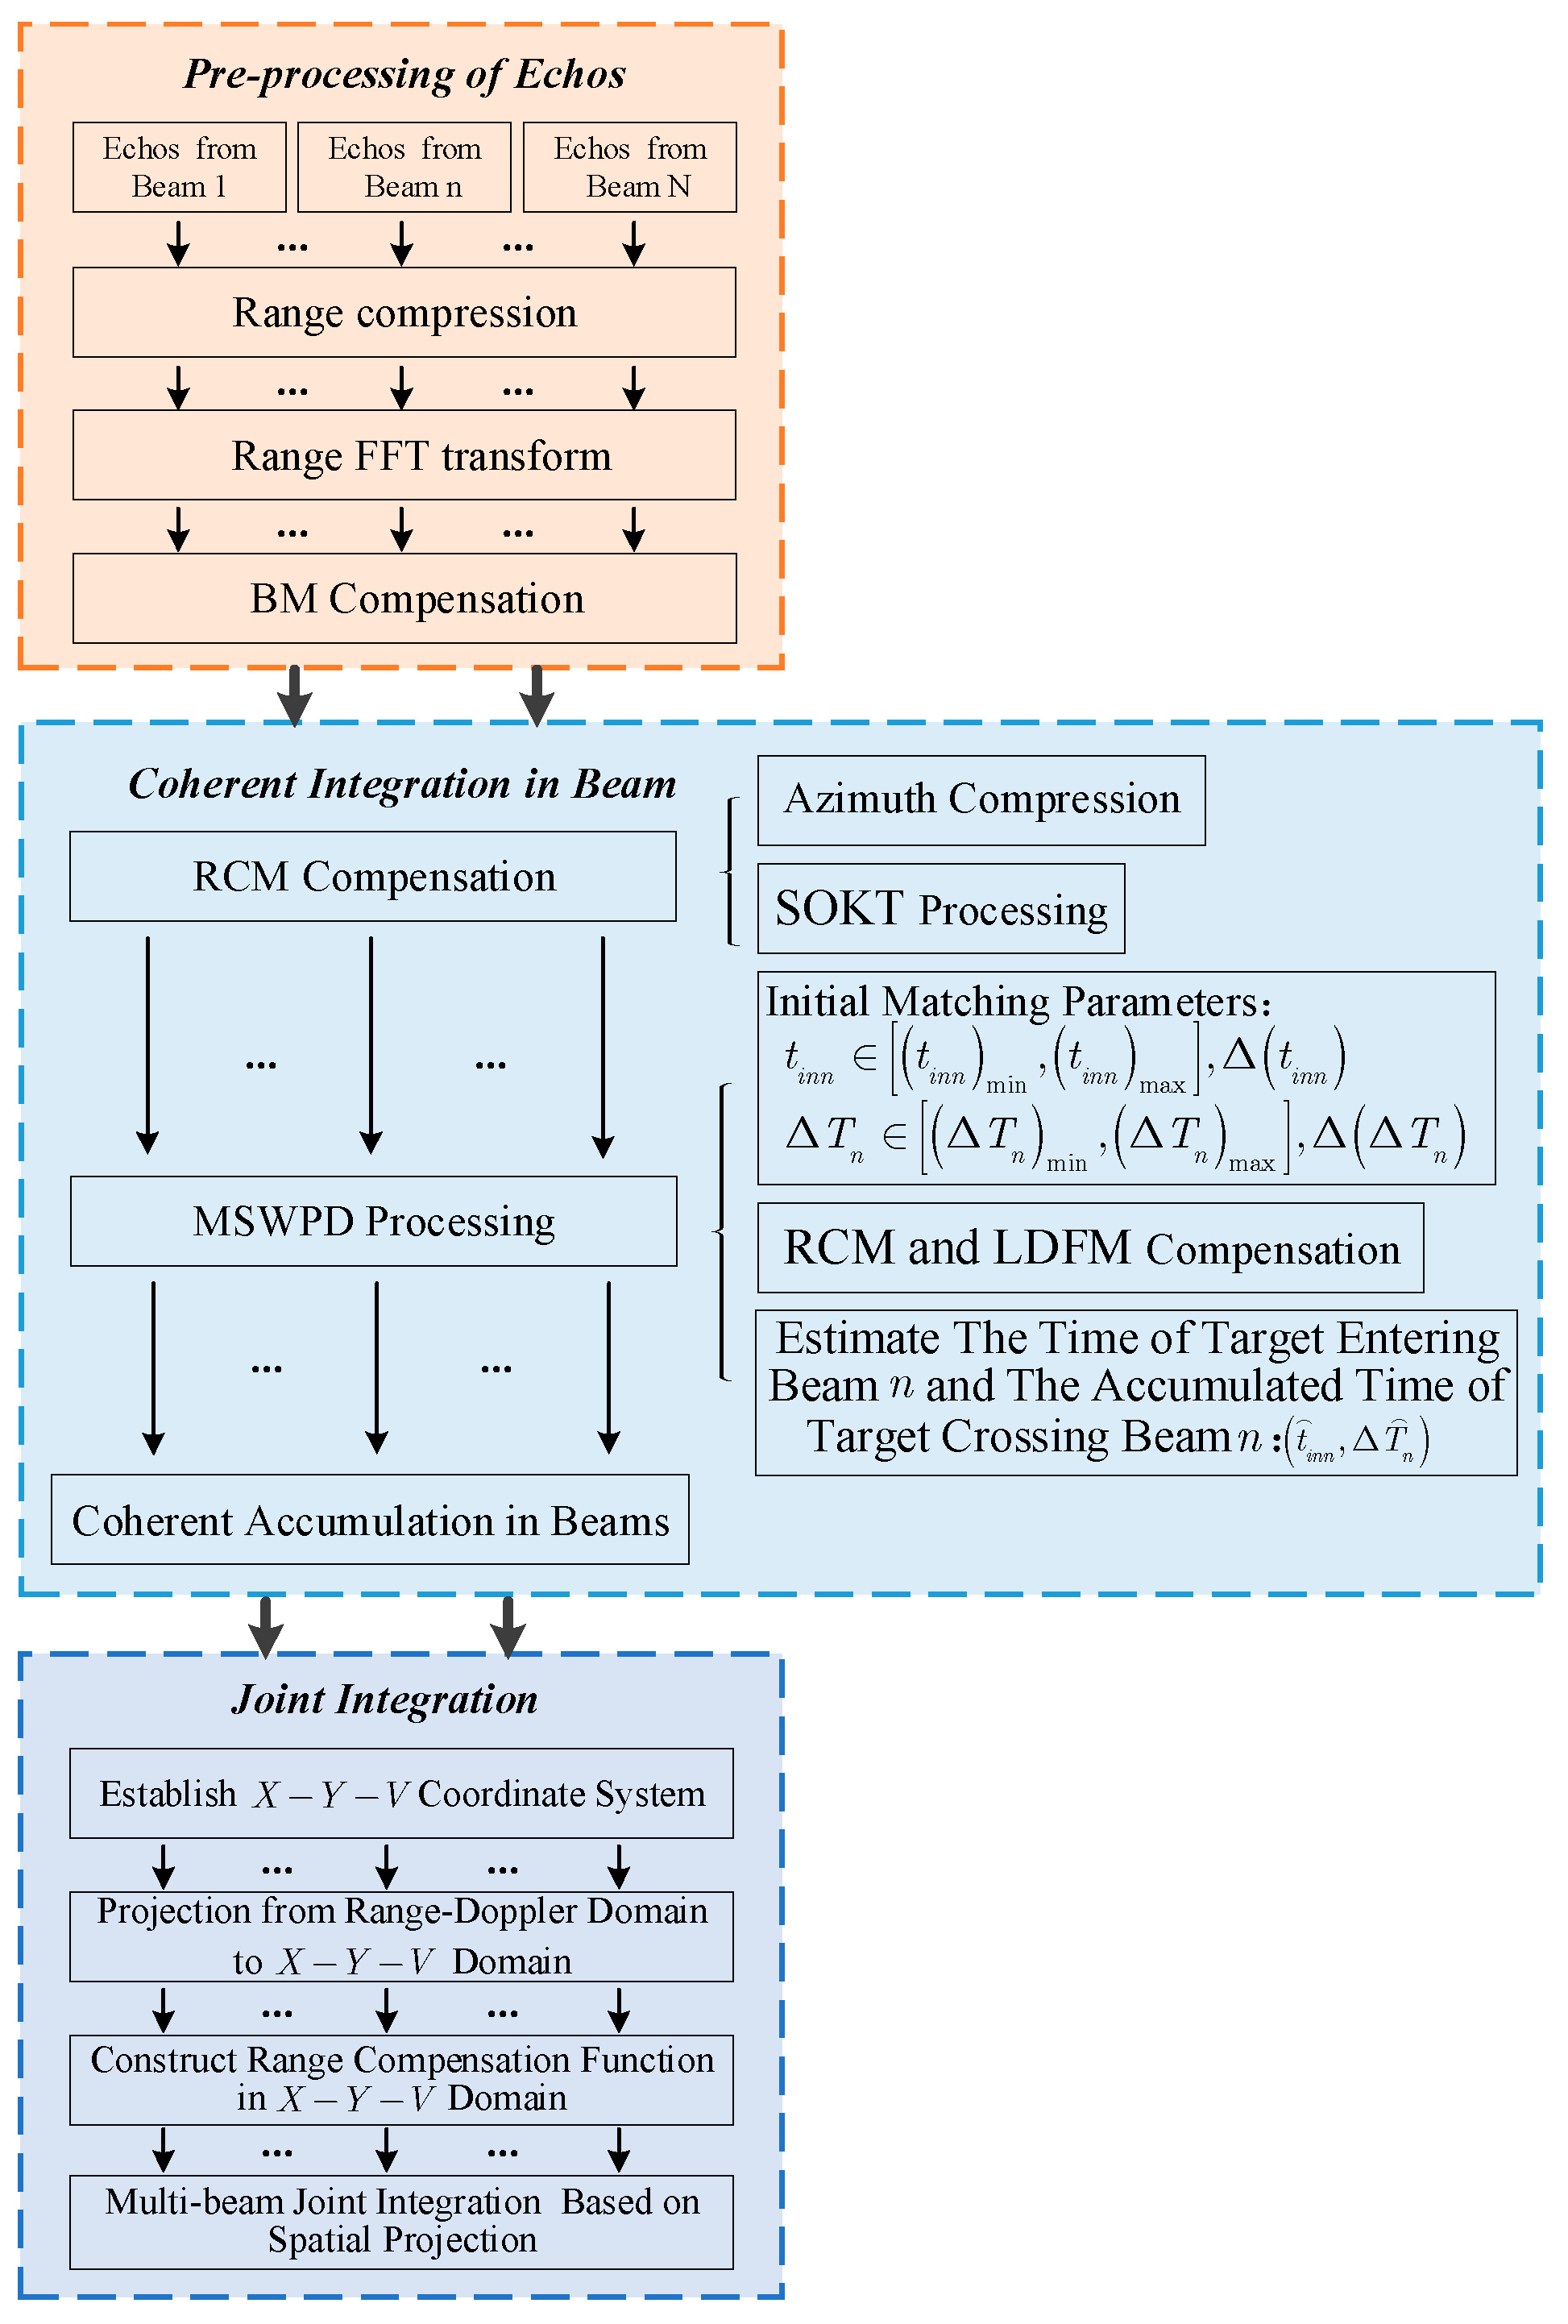
As described in Equation (32), the effects of RM, DFM, and BM can be accurately eliminated, and a fine-focused result can be obtained in the range–Doppler domain. Compared with the integration result of a single beam, the proposed approach combines the energy of the target in multiple beams, and the focusing and parameter estimation performances are effectively improved. Figure 6 shows the steps of the proposed approach.

4. Some Discussions for the Proposed Approach in Applications

4.1. The Analysis of Azimuth Doppler–Spectrum Bandwidth

It can be seen from Section 2.2 that Doppler-spectrum broadening leads to spectrum splitting. At this time, the trajectory of the moving target will be split when the KT or SOKT operation is directly used [58], which seriously affects the subsequent RM compensation performance. Therefore, in order to avoid this phenomenon, a Doppler-spectrum compression function is constructed:
H 1 ( f , t m ) = exp [ j 4 π c ( f + f c ) v p 2 2 R 0 , n t m 2 ]
Assuming that M a m b , n and b 0 , n are the Doppler ambiguity number and the radial baseband velocity in the n th beam, respectively, there is:
b 1 , n = b 0 , n + M a m b , n λ f P R F 2
Substituting Equation (35) into Equation (13), and since exp ( j 2 π M a m b , n f P R F t m ) = 1 , the signal after Doppler–spectrum bandwidth compression can be expressed as:
s 5 , n ( f , t m ) = w n ( t m ) rect ( f B ) × exp [ j 4 π c ( f + f c ) R 0 , n ] × exp [ j 4 π c f ( M a m b , n λ f P R F 2 ) ( t m t i n n ) ] × exp [ j 4 π c ( f + f c ) b 0 , n ( t m t i n n ) ] × exp [ j 4 π c ( f + f c ) Δ b 2 , n ( t m t i n n ) 2 ]
where Δ b 2 , n = b 2 , n v p 2 / ( 2 R 0 , n ) . In Equation (36), one can see that the azimuth–Doppler-spectrum is greatly compressed, usually less than f P R F / 2 , and the spectrum splitting phenomenon is basically solved. However, if the Doppler center shifts, Doppler–spectrum splitting still exists in the extreme case. At this time, a method proposed in [58] can be used to eliminate the spectrum splitting, and no further description is given here.
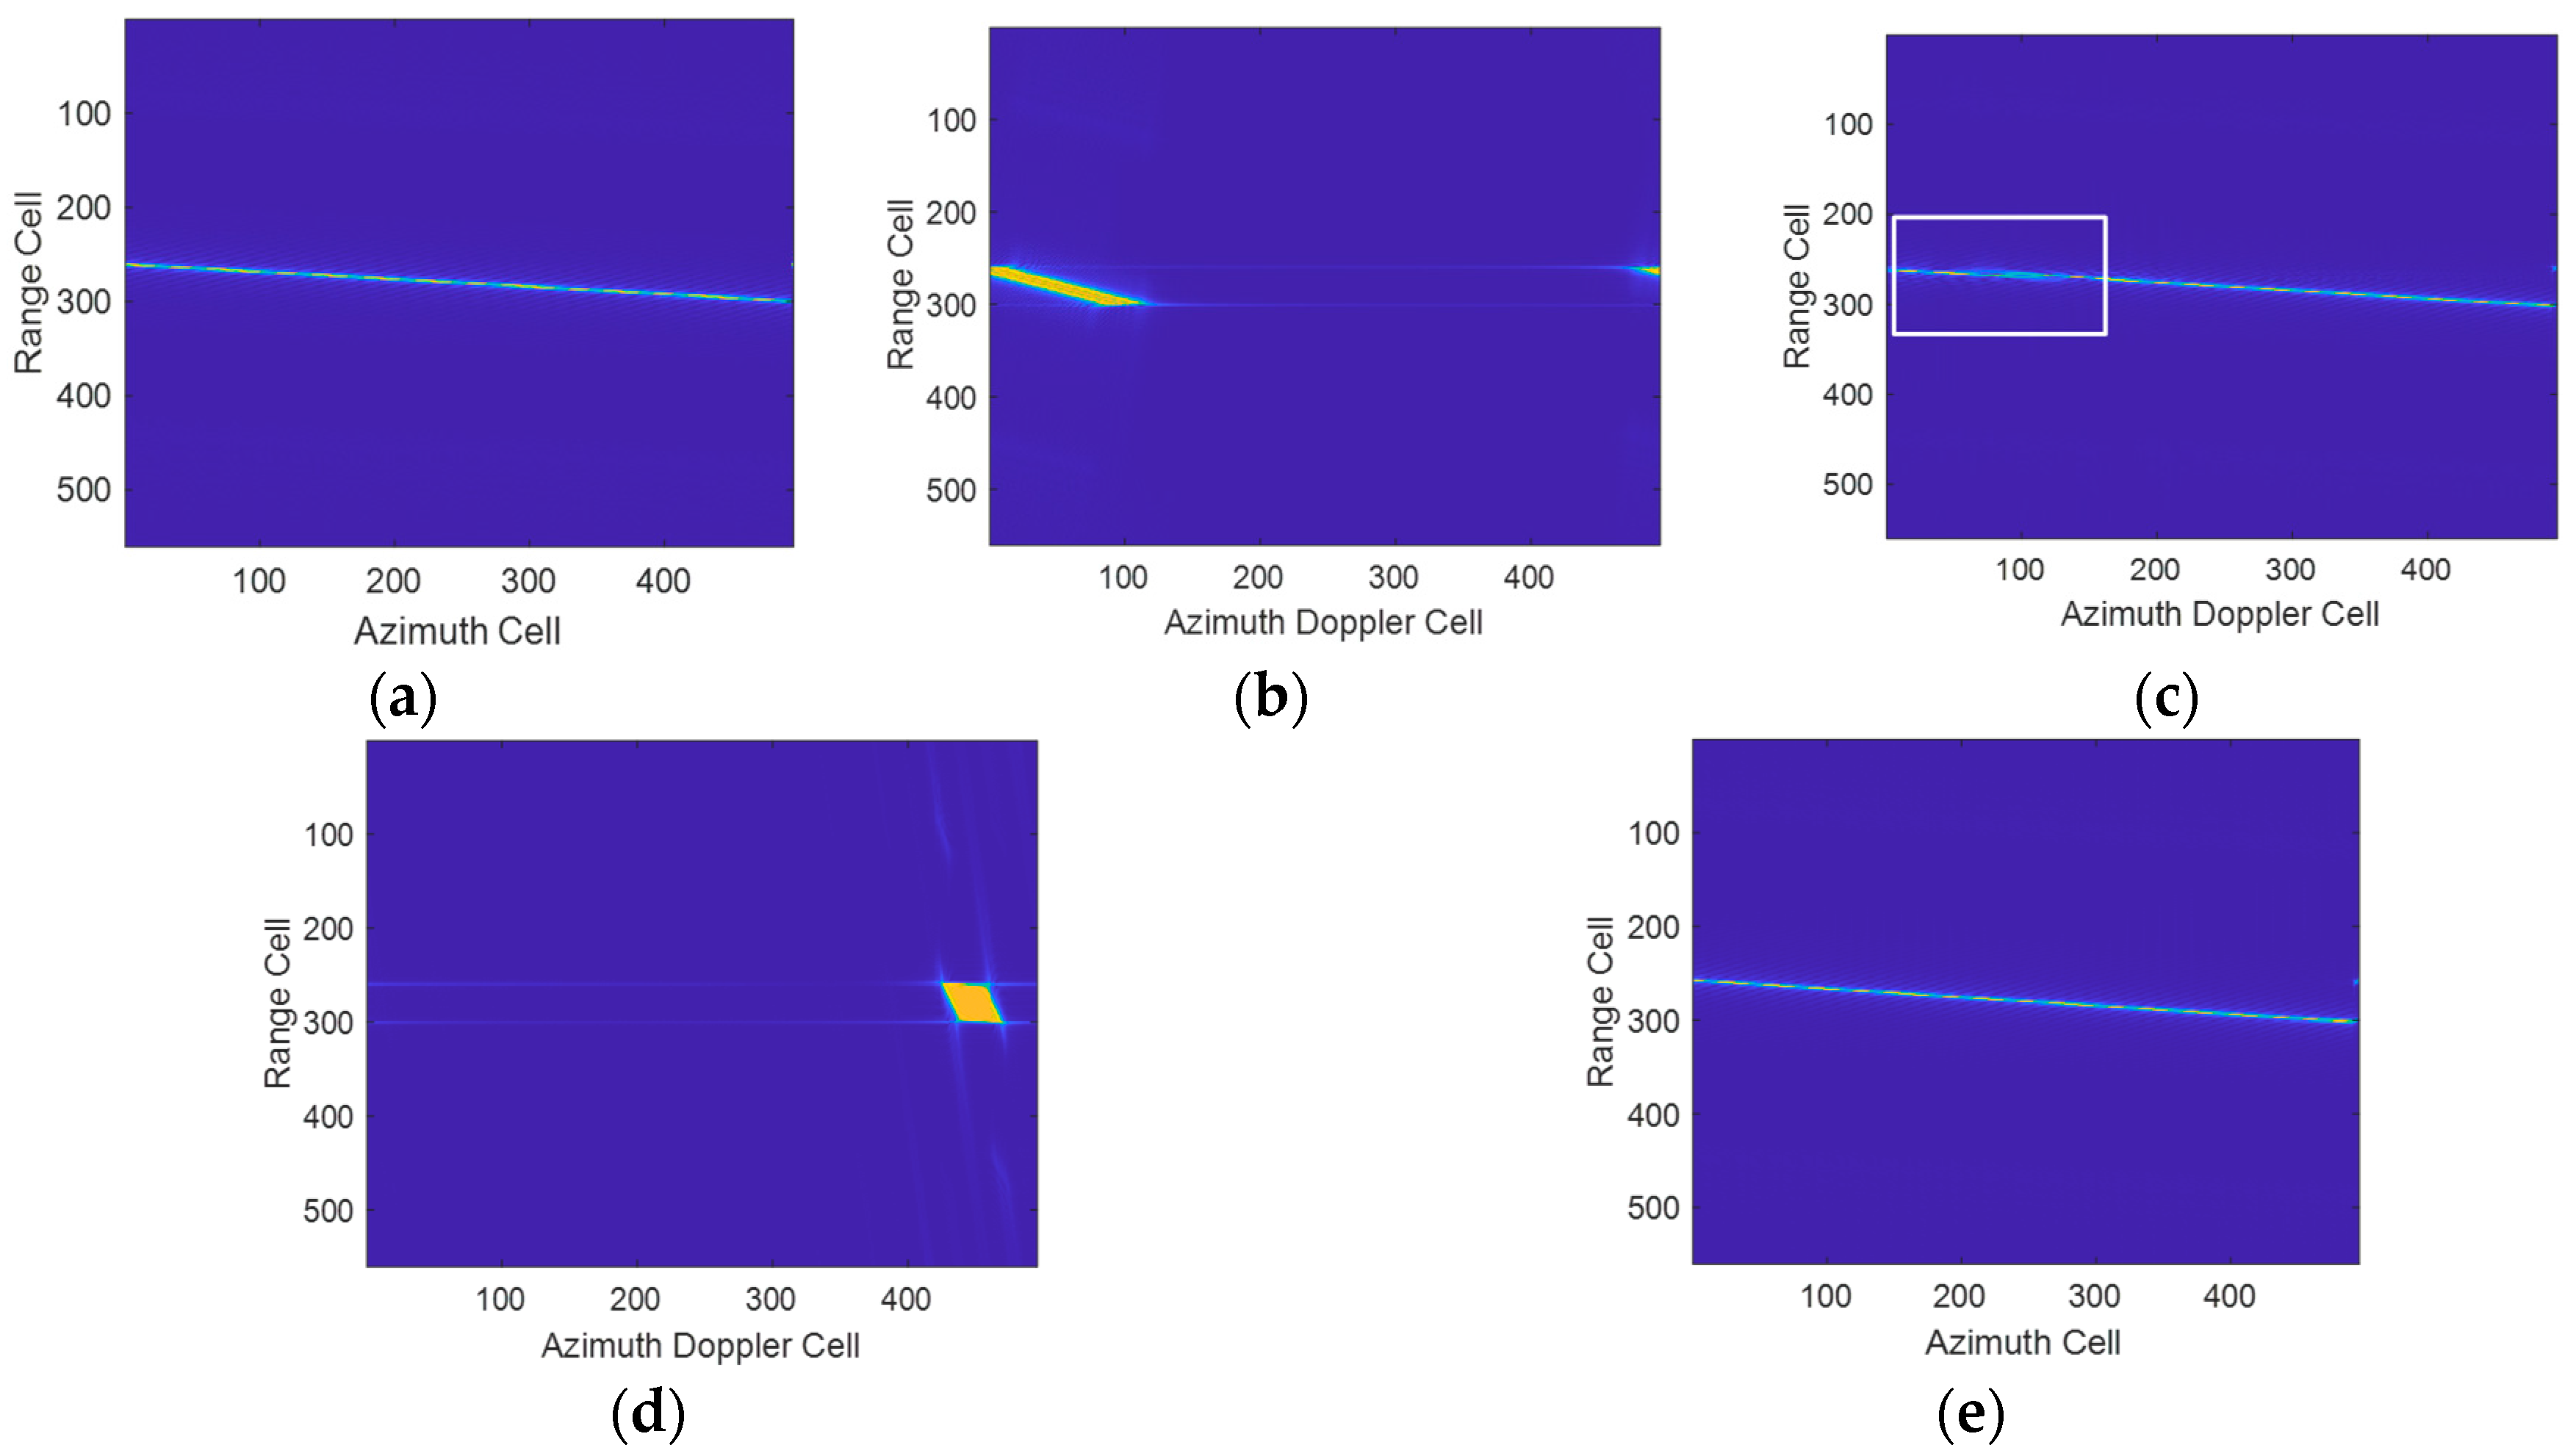
To validate the effectiveness of the Doppler-spectrum compression function, a simulation of Example B without noise is provided, as shown in Figure 7. The main simulated parameters for the radar are set as follows: f c = 2   GHz , B = 30   MHz , P R F = 1000   Hz and T = 0.47   s . The speed of the radar platform is set to v p = 7165   m / s . The moving target B, with v a = 400   m / s and v r = 420   m / s is set. Figure 7a shows the trajectory of the target after pulse compression, Figure 7b shows the distribution of the target in the range–Doppler domain, and it can be found that the Doppler-spectrum of the target occupies two PRF bands. Figure 7c shows the trajectory after SOKT processing; one can find that there is an obvious trajectory fracture phenomenon. Figure 7d shows the range–Doppler map of the target after the Doppler-spectrum compression operation. The Doppler-spectrum of the target is greatly compressed after the SOKT operation, and the target trajectory splitting phenomenon no longer exists, as shown in Figure 7e.

4.2. The Analysis of the Lag Variable in MSWPD Operation

For the convenience of representation, in this section, the beam variable n is ignored. According to Equation (20), the first-order and second-order motion parameters of the moving target can be calculated by peak value ( t , f ξ ) . Therefore, in the range-Doppler domain, if the first-order and second-order motion parameters cannot be expressed by the integer multiple of range resolution and azimuth-Doppler resolution, respectively, the maximum estimation error should be less than one resolution unit. Therefore, the estimation errors of first-order and second-order motion parameters can be expressed as:
Δ b 1 = c Δ t 2 η , Δ b 2 = λ Δ f ξ 4 η
where Δ t = 1 / ( 2 f r ) is the range fast time resolution, f r is the range fast time sampling frequency, Δ f ξ = 1 / ( T B ( η / 2 ( η / 2 ) ) ) represents the azimuth-Doppler resolution, and T B represents the integration time. Then, the Equation (37) can be rewritten as:
Δ b 1 = c 4 η f r , Δ b 2 = λ 4 η ( T B η ) = λ 4 ( η T B / 2 ) 2 + T B 2
According to Equation (37), the estimation error of the first-order motion parameter Δ b 1 is inversely proportional to the delay variable η . Therefore, the larger the selected value of η , the smaller the error Δ b 1 will be. However, the larger the value of η , the fewer the integration pulses in Equation (20), so the coherent integration gain of the target will decrease at this time. Therefore, it is necessary to achieve a good balance between the coherent integration gain and the accuracy of target motion parameter estimation. On the other hand, according to Equation (37), when η = T B / 2 , the second-order motion parameter estimation error will have a minimum value. Based on the above analysis, considering the estimation error of each order motion parameter of the target and the coherent integration gain, the delay variable η is finally selected as: T B / 2 .

4.3. The Analysis of Computational Complexity

In this section, the computational complexity of the proposed method is analyzed. Assuming that the N b ,   N r , and N a represent the number of beams, range units, and azimuth pulses, respectively. The search times of the time parameters ( t i n n , Δ T n + 1 , n ) are denoted by C t i n and C T . The grid numbers along the X - ,   Y - , and V - axes are represented by C x ,   C y , and C v , respectively.
The proposed method is used to realize coherent integration within the beam, which includes a SOKT operation and a MSWPD operation. If the SOKT operation is achieved via the Chirp-Z transform, the calculation complexity is about N r N a log 2 N a . The MSWPD operation includes a 2D time parameters search process, and the PD is required for each search. So the calculation complexity of all beams is about:
O { N b [ N r N a log 2 N a + C t i n C T ( N r N a log 2 N a + N r N a log 2 N r ) ] }
As for the SP operation, there is a 3D motion parameters search operation, and the computational complexity is about:
O [ C x C y C v ( N r N a log 2 N r ) ]
Therefore, the total computational complexity of the proposed algorithm is about:
O { N b [ N r N a log 2 N a + C t i n C T ( N r N a log 2 N a + N r N a log 2 N r ) ] + C x C y C v ( N r N a log 2 N a ) }
In order to compare the computational complexity of the proposed algorithm with other algorithms more fairly, we analyze the computational complexity of ACCF and MTD algorithms in the case of multi-beams. At present, there is no research on using ACCF and MTD algorithms to deal with the long-term integration of targets in multi-beam mode. Therefore, in the following analysis of the computational complexity of ACCF and MTD algorithms, the methods proposed in this paper are used; that is, the estimation of target time information (the time of the target entering the beam and leaving the beam) is completed by parameter search, and the multi-beam joint integration is realized by SP operation.
The ACCF algorithm can correct the RM and DFM at the same time and abandon the parameter search process required by traditional methods. The target can be quickly detected only by complex multiplication, FFT and IFFT. The computational complexity of ACCF with the SP operation in this paper is about:
O { N b [ N r N a log 2 N a + C t i n C T ( N r N a log 2 N a + N r N a log 2 N r ) ] + C x C y C v ( N r N a log 2 N a ) }
The MTD algorithm is the most classical one, which can be understood as a band-pass filter bank, and it is realized by FFT operation. The MTD method directly performs FFT along the azimuth dimension of the echo signal, and it does not consider RM and DFM phenomena, so the SNR improvement is limited. The computational complexity of MTD with the SP operation in this paper is about:
O { N b [ N r N a log 2 N a + C t i n C T ( N r N a log 2 N r ) ] + C x C y C v ( N r N a log 2 N a ) }
Table 1 shows the comparison of the computational complexity of different methods. From Table 1, although the computational complexity of the ACCF algorithm and MTD algorithm are equivalent to the proposed algorithm, in the existing research, these two algorithms can not handle multi-beam situations. Therefore, compared with the proposed algorithm, the integration performance of these two algorithms is far less than that of the proposed method.

4.4. Multi-Target Detection Analysis

According to Section 3, the results of a single target can be effectively obtained by the proposed method. However, there may be multiple moving targets in the scene. The cross-term caused by multiple targets should be further analyzed. For the case of multiple targets, the signal in Equation (15) of the manuscript is written as follows:
s 2 , n , m ( f , ξ ) = l = 1 L w n ( t m ) × rect ( f B ) × exp ( j 4 π c f R 0 , n , l ) × exp { j 4 π c f [ b 1 , n , l 2 ( ξ t i n n ) ] } × exp { j 4 π λ [ R 0 , n , l + b 1 , n , l ( ξ t i n n ) ] } × exp { j 4 π λ b 2 , n , l ( ξ t i n n ) 2 }
where R 0 , n , l denotes the nearest slant range of the l th moving target in the n th beam. b 1 , n , l and b 2 , n , l are radial velocity and radial acceleration of the l th moving target in the n th beam. After the MSWPD operation, the corresponding signal of the multiple target case is expressed as:
MSWPD ( t ¯ , Δ T ¯ n ) = l = 1 L g ( t ¯ i n n , Δ T ¯ n ) × w n , l ( t m ) × rect ( f B ) × exp ( j 4 π λ b 1 , n , l η n ) × exp ( j 4 π c f b 1 , n , l 2 η n ) × exp [ j 4 π λ 2 b 2 , n , l η n ( ξ t i n n ) ] auto   term + l = 1 L d = 1 , d l L g ( t ¯ i n n , Δ T ¯ n ) × w n ( t m ) × rect ( f B ) × exp [ j 4 π c f ( R 0 , n , l R 0 , n , d ) ] × exp [ j 4 π λ ( R 0 , n , l R 0 , n , d ) ] × exp [ j 4 π c f ( b 1 , n , l 2 b 1 , n , d 2 ) ( ξ t i n n ) ] × exp [ j 4 π λ ( b 1 , n , l b 1 , n , d ) ( ξ t i n n ) ] × exp [ j 4 π λ ( b 2 , n , l b 2 , n , d ) ( ξ t i n n ) 2 ] × exp [ j 4 π c f ( b 1 , n , l 2 + b 1 , n , d 2 ) η n 2 ] × exp [ j 4 π λ ( b 1 , n , l + b 1 , n , d ) η n 2 ] × exp [ j 4 π λ ( b 2 , n , l b 2 , n , d ) η n 2 4 ] cross   term
After performing the range IFFT, we obtain:
s 3 , n , m ( t , ξ ) = l = 1 L δ ( t b 1 , n , l η n c ) × exp ( j 4 π λ 2 b 2 , n , l η n ( ξ t i n n ) ) auto   term + l = 1 L d = 1 , d l L δ ( t 2 ( R 0 , n , l R 0 , n , d ) + ( b 1 , n , l b 1 , n , d ) + ( b 1 , n , l 2 + b 1 , n , d 2 ) η n c ) × exp { j 4 π λ [ ( b 1 , n , l b 1 , n , d ) ( ξ t i n n ) + ( b 2 , n , l b 2 , n , d ) ( ξ t i n n ) 2 ] } cross   term
According to Equation (45), one can find that the RM and DFM of the auto terms are compensated, and only linear terms exist at this time. The auto terms can be focused as clear peaks after performing FFT along the azimuth dimension. Because of the existence of the RM and DFM of the cross terms, the cross terms are usually defocused. Therefore, the discrimination of the auto terms may not be affected by the cross items.

5. Simulation and Experimental Results

5.1. Validation of the Proposed Method

In this section, the effectiveness of the proposed method is verified by simulation experiments. The radar and target parameters are shown in Table 2, Table 3 and Table 4. We use Gaussian white noise with a mean of 0, and the SNR before pulse compression is −9 dB.
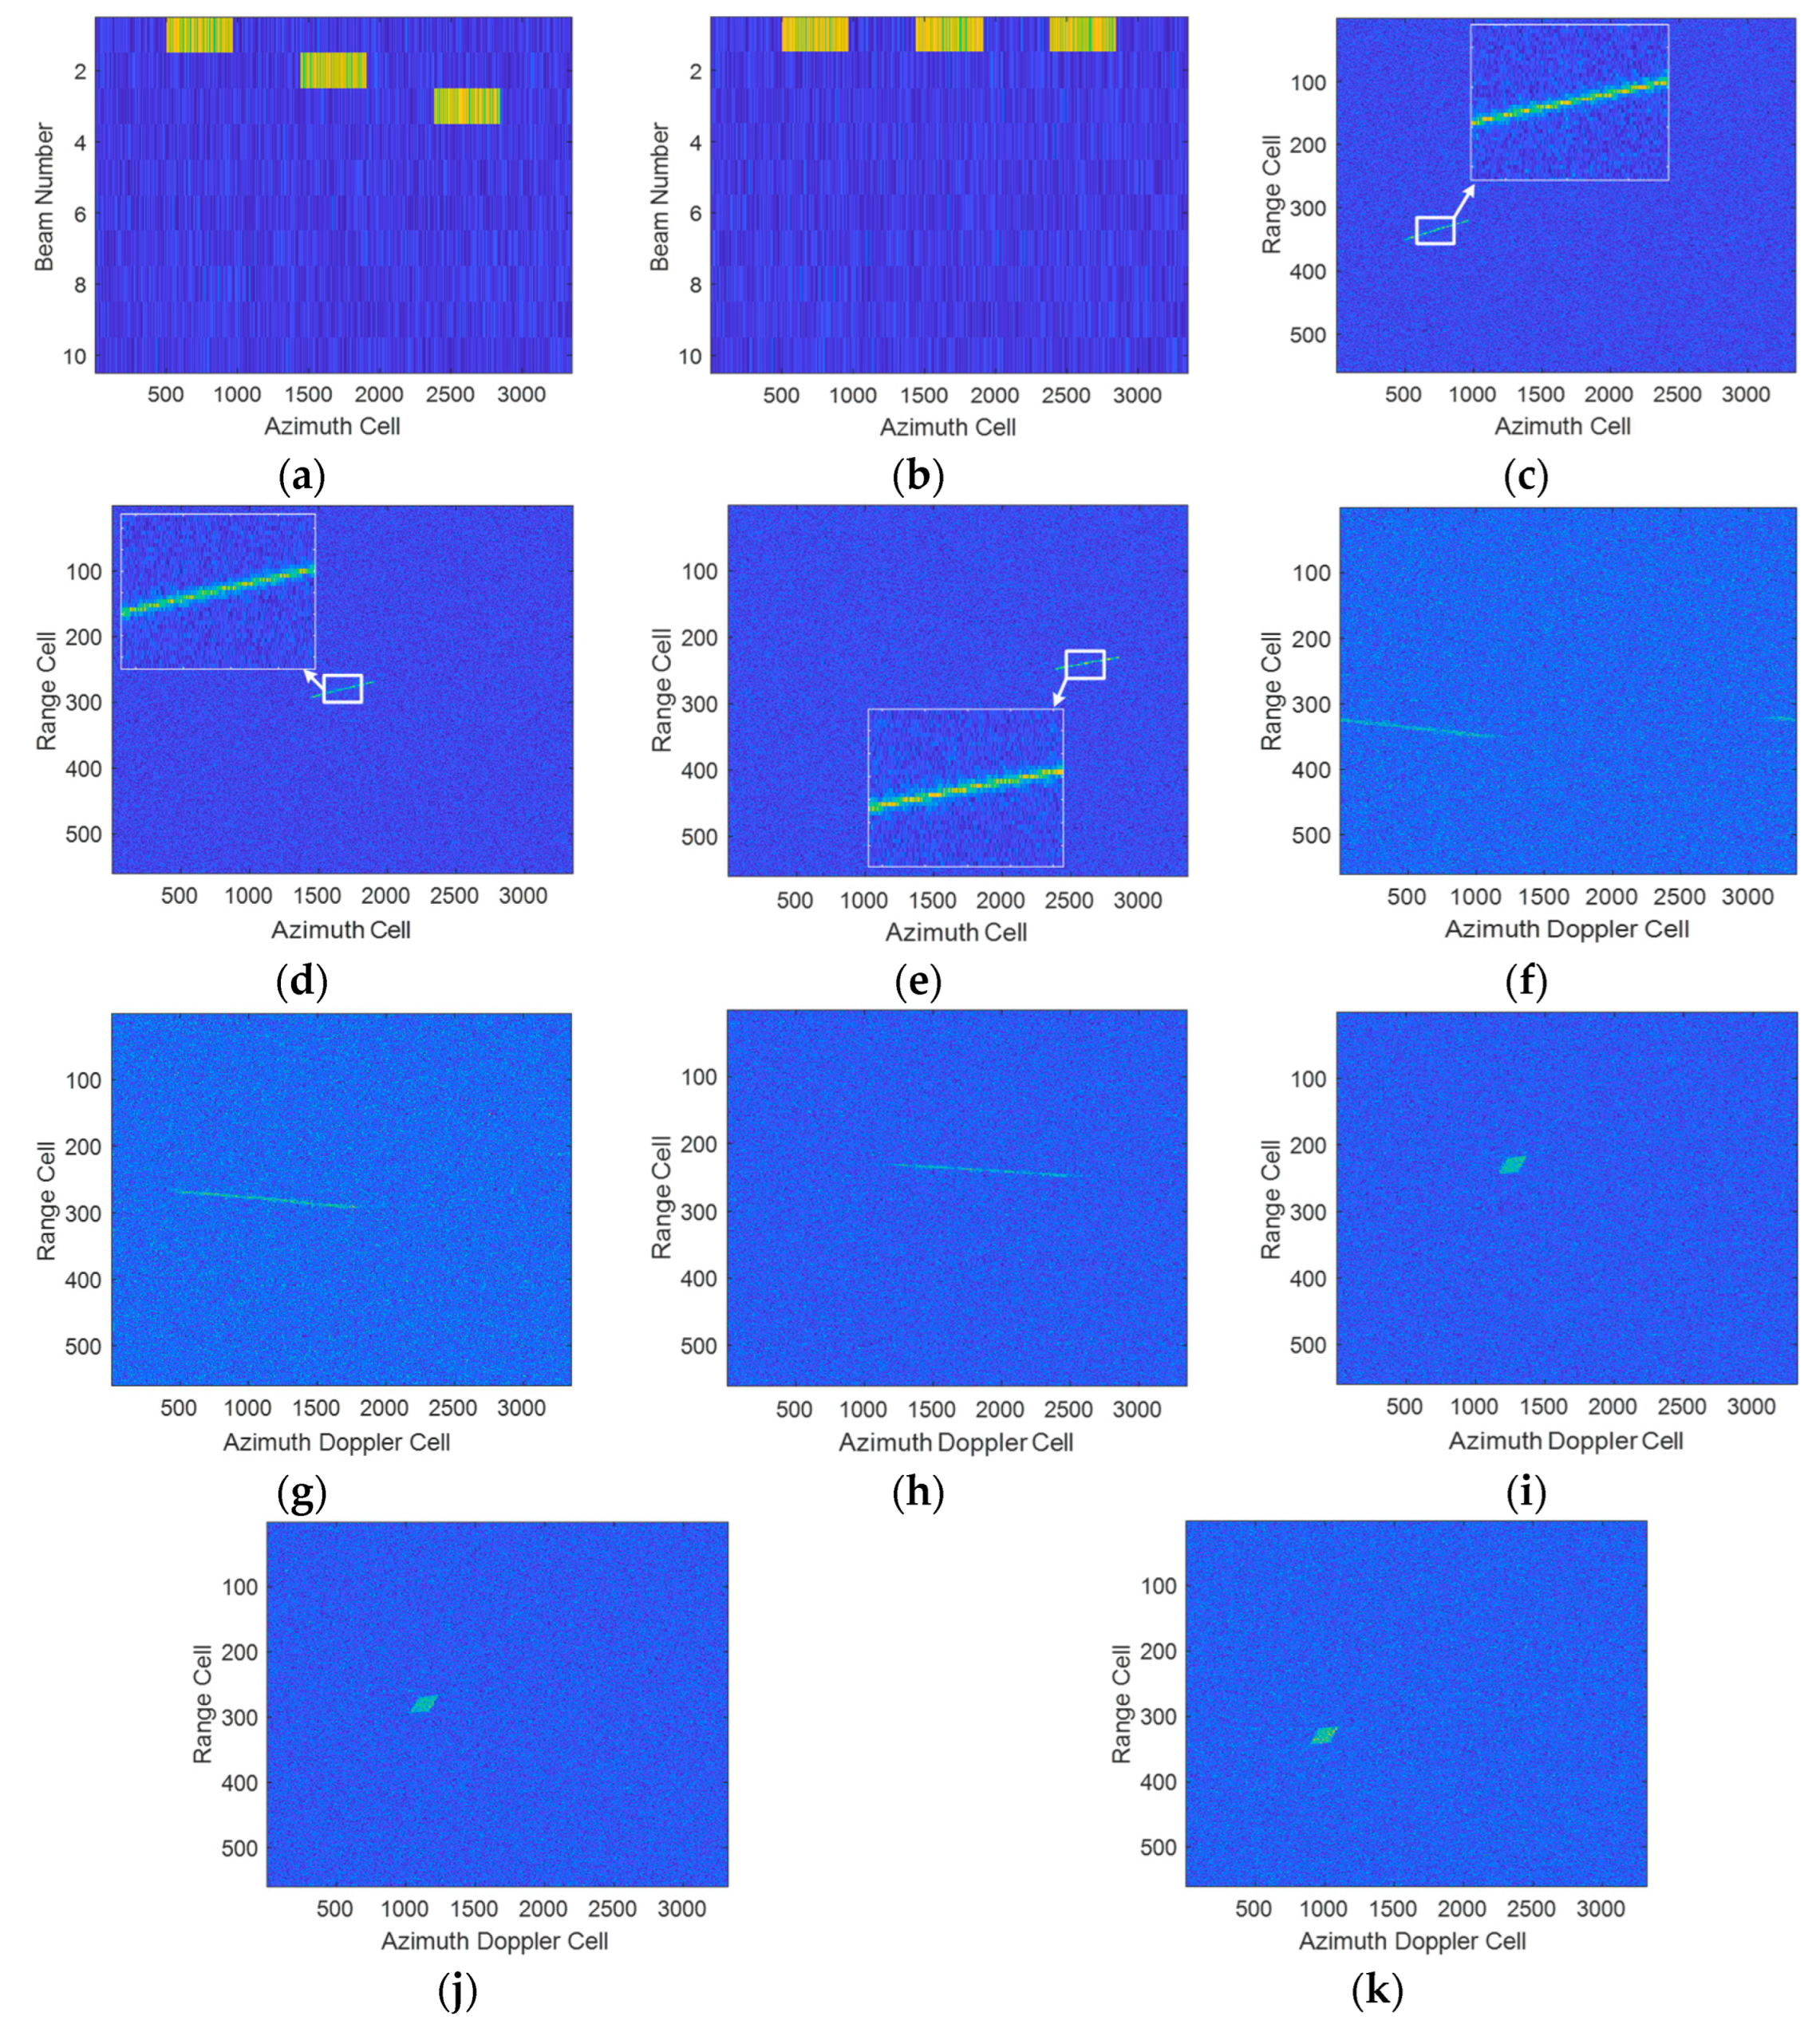
Figure 8 shows the simulation results of the BM compensation processing. Figure 8a shows that the echoes of the target are distributed in three beams with different beam angles. After the MBPCF operation, the target beams are concentrated in the same beam, as shown in Figure 8b. Figure 8c–e indicate the motion trajectories of the moving target after range compression, from which the motion trajectory shows obvious existing range walk and curvature. Due to the existence of a beam gap, the trajectory is distributed in different time periods. In the following expression, the description of the time period is replaced by the beam. Figure 8f–h, respectively, show the distribution of the target in the range-Doppler domain. One can see that the target energy is distributed into several azimuth-Doppler cells because of the influence of DFM, and as analyzed in Section 2.2, from Figure 8f, there is obviously the Doppler-spectrum ambiguity phenomenon. In order to avoid trajectory fracture after the subsequent SOKT process, we use the Doppler-spectrum compression function to compress the Doppler bandwidth of the target, as shown in Figure 8i–k.
After the BM correction, the compensated results of the RCM in different beams adopting the SOKT method are illustrated in Figure 9. Figure 9a–c show the results of SOKT processing without Doppler-spectrum compression, respectively. It can be seen from Figure 9a that the trajectory of the target is split. Figure 9d–f indicate the results of SOKT processing after Doppler-spectrum compression. The trajectory-splitting phenomenon no longer exists, and the RCM has been compensated.
Figure 10a–c show the results of the entering time in different beams (i.e., 0.5 s, 1.44 s, and 2.38 s). It can be seen that there is an obvious peak through MSWPD operation, and the beginning time can be accurately estimated by the peak position. Figure 10d–f show the number of pulses transmitted when the target crosses the different beams. One can see that the target has integrated 470 pulses within different beams, so the integration times are all 0.47 s in the first, second, and third beams. The trajectories of the target in different beams after SOKT and MSWPD processing are depicted in Figure 10g–i, which indicate that the RM and LDFM are both compensated. Figure 10j–l, respectively, show the results of coherent integration in different beams. One can see that the targets from different beams are focused in the range-Doppler domain. At the same time, it can also be found that all the positions are in the same azimuth-Doppler unit (i.e., the 119th) but in different ranges (i.e., the 269th, 273th, and 276th).
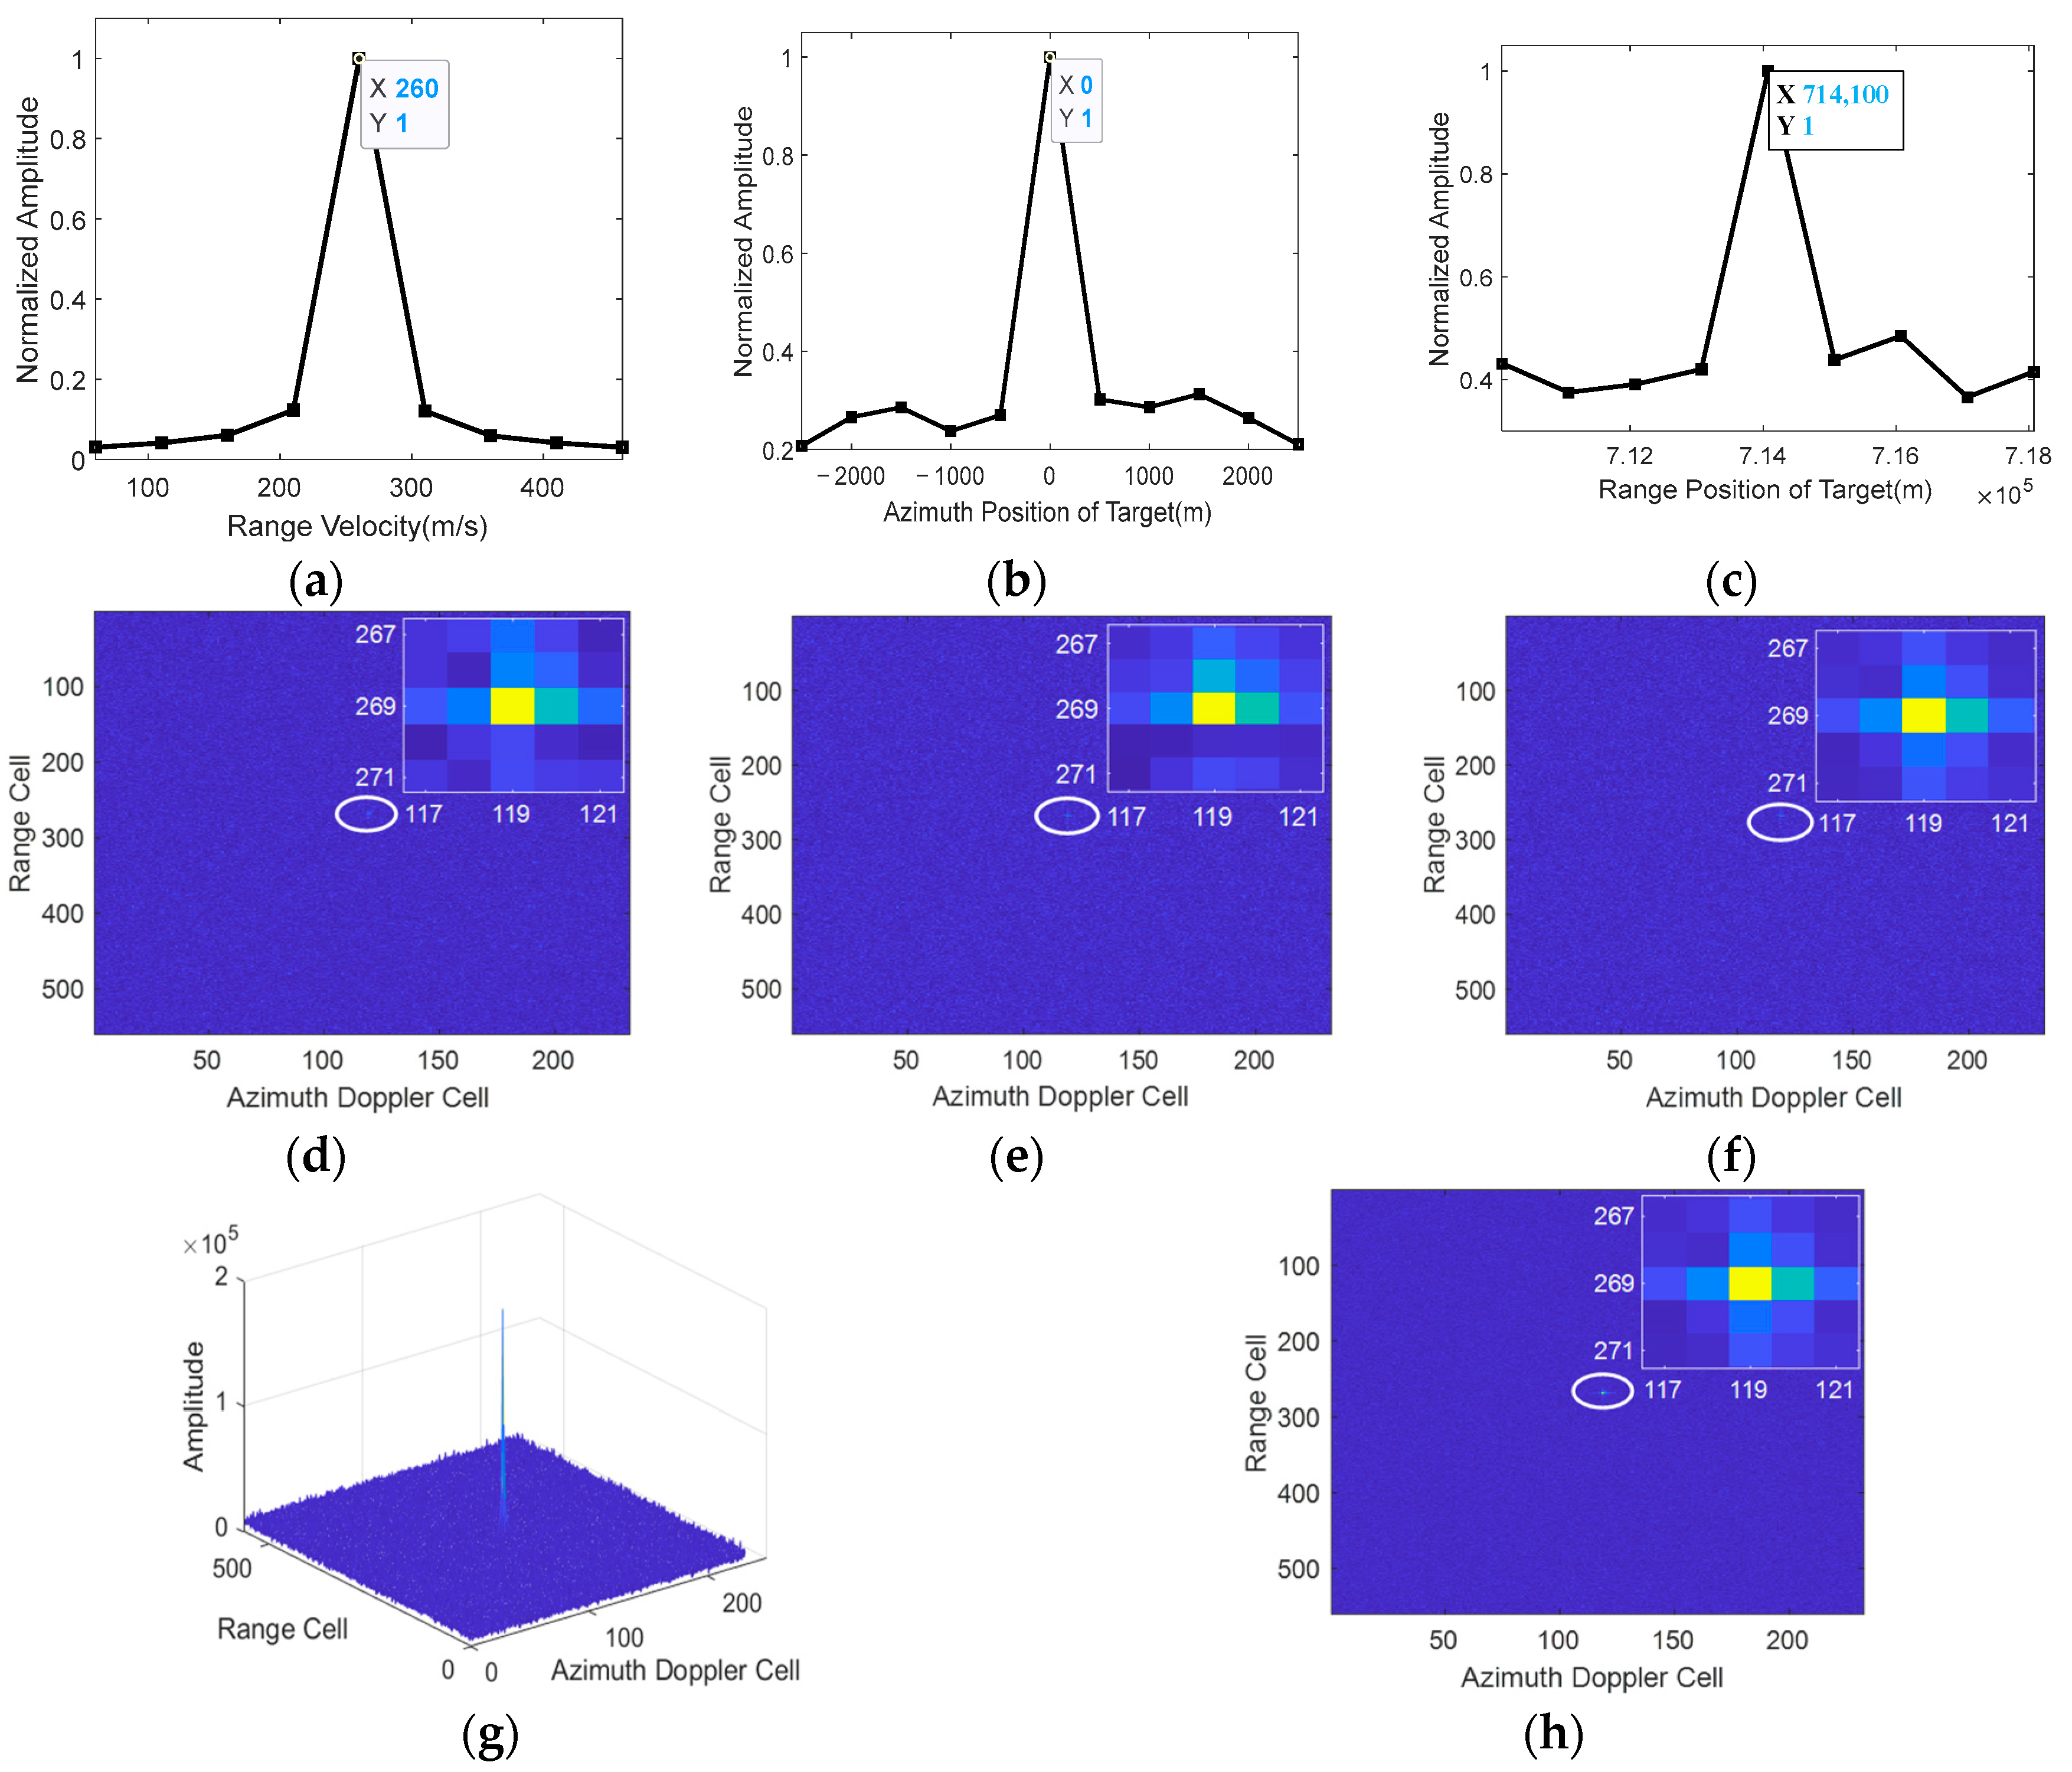
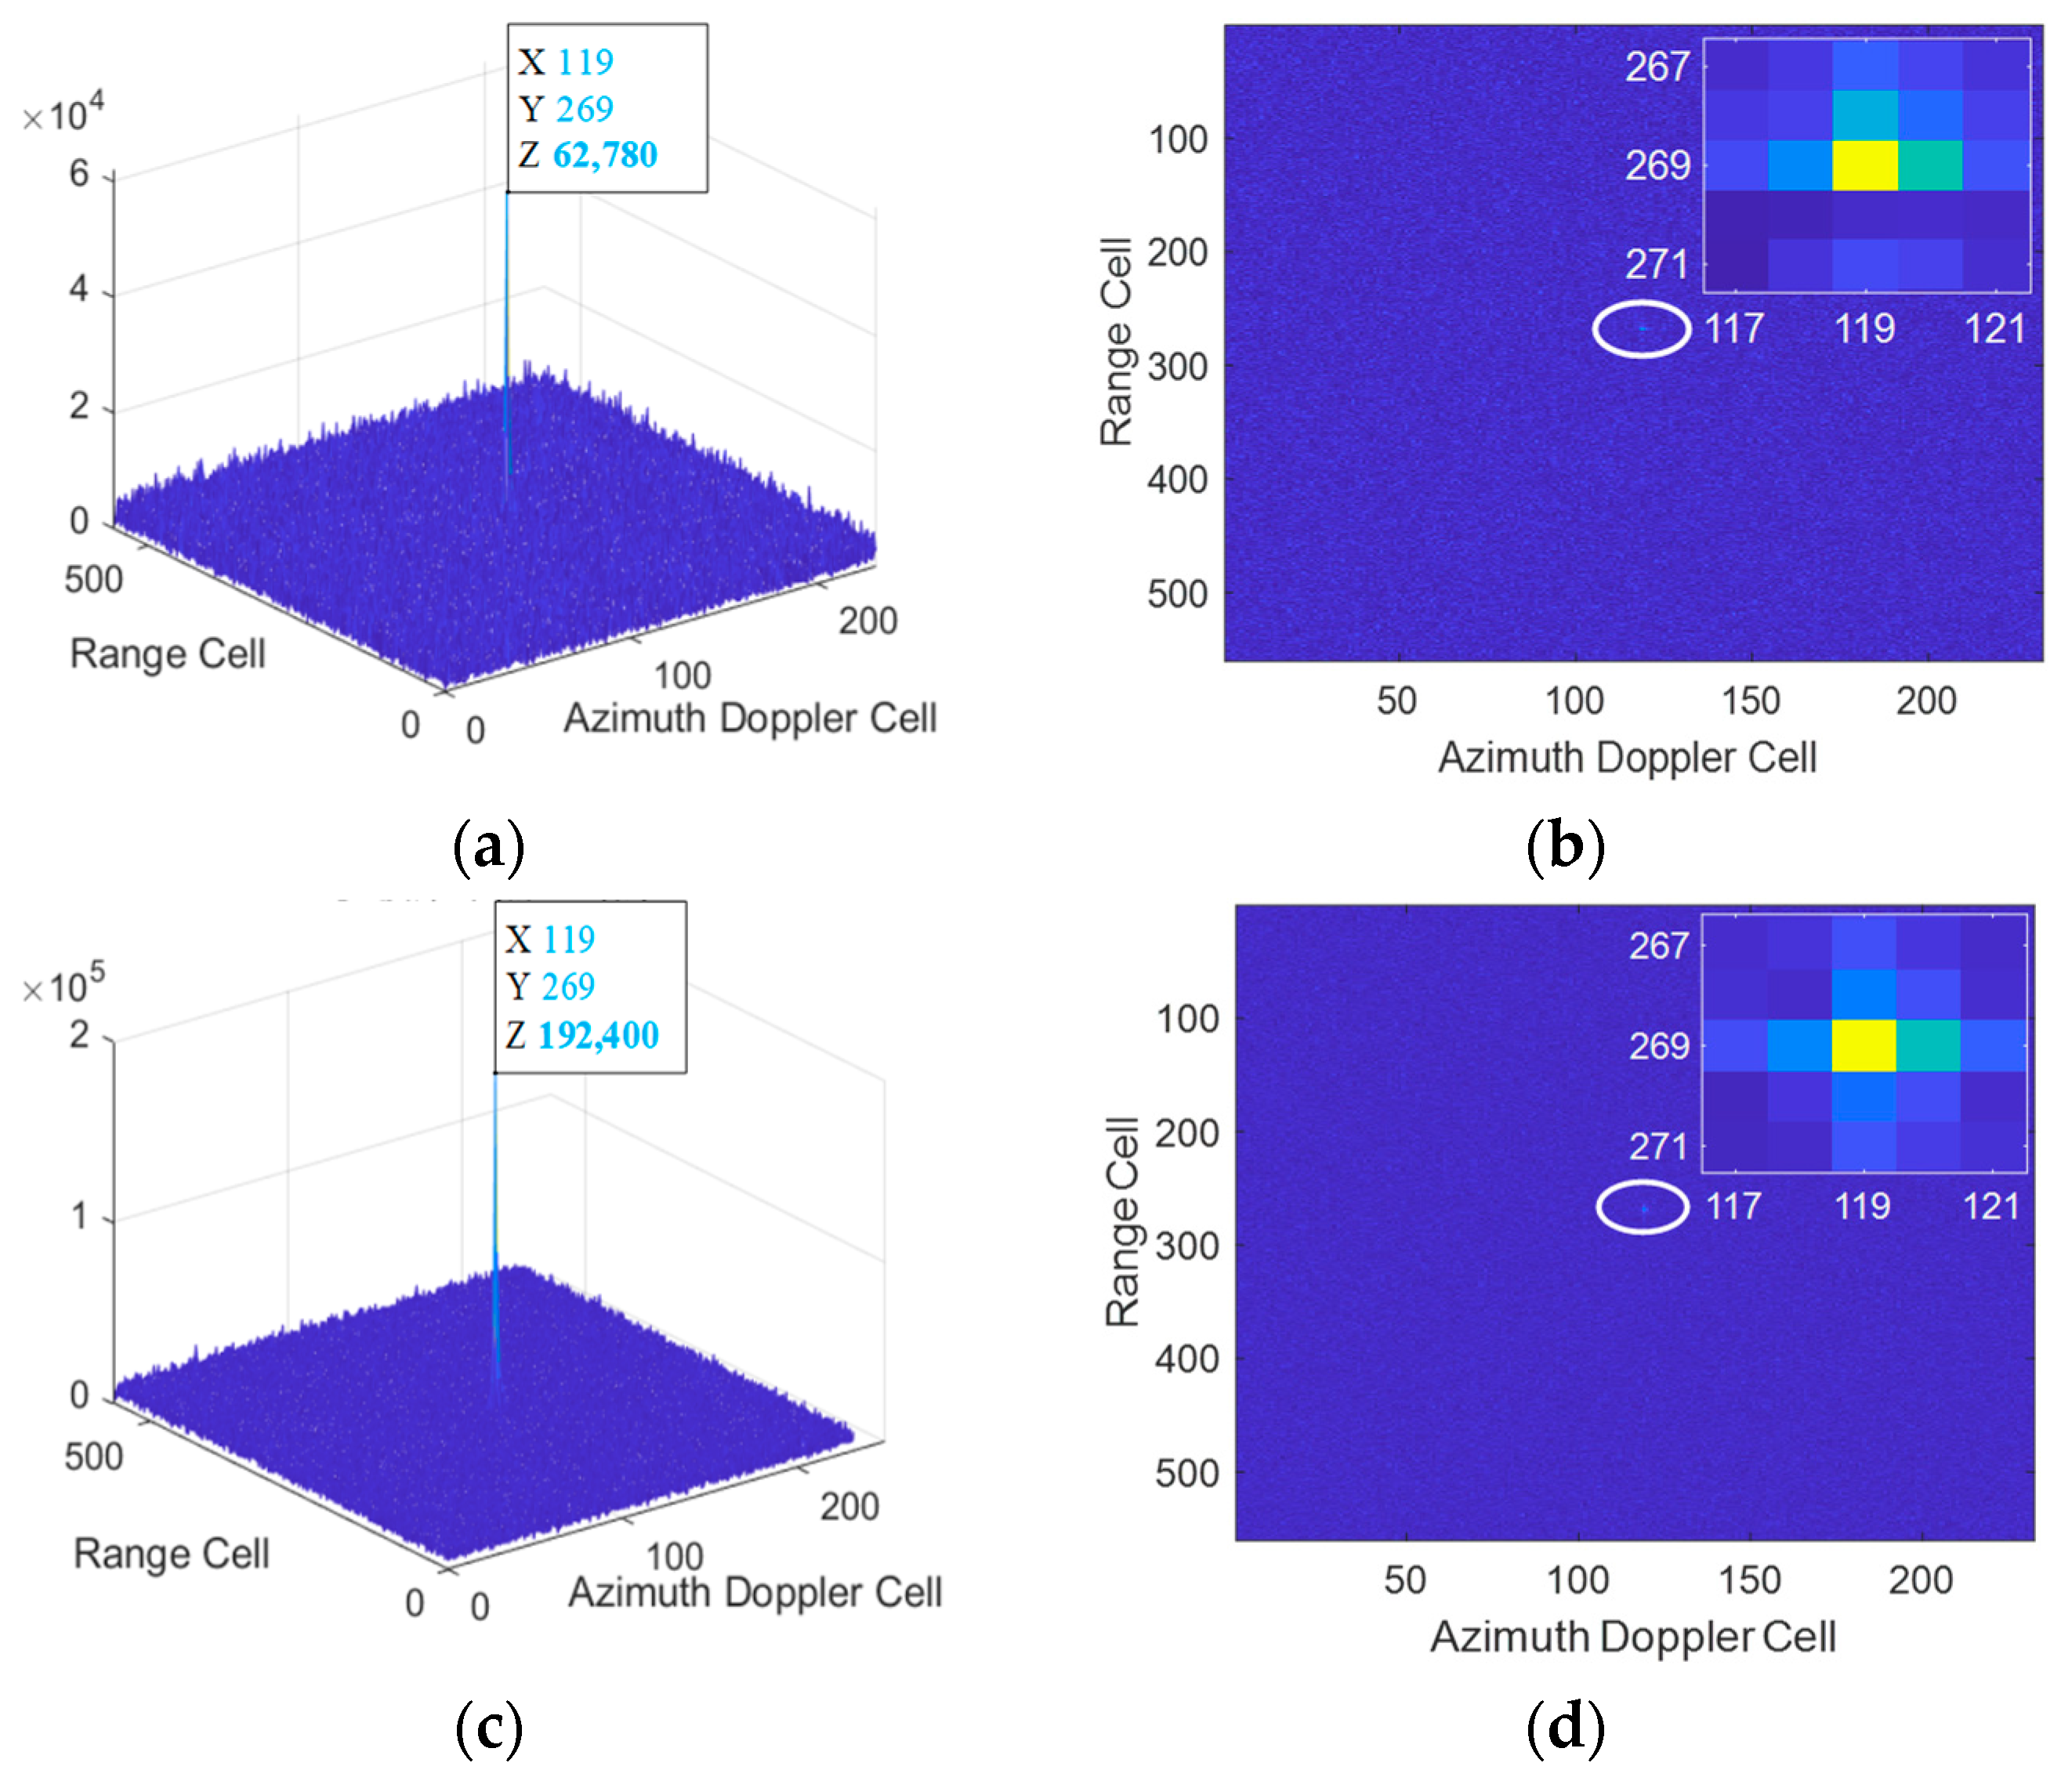
Figure 11 illustrates the results of the SP operation. Figure 11a–c, respectively, show the estimated range velocity, target azimuth position, and target range position in the X Y V domain. Figure 11d–f, respectively, show that after SP processing, the positions of the targets in different beams are all at the same range cell (i.e., 269th). Figure 11g,h, respectively, show the final focusing 3D and 2D results of the proposed algorithm. It can be seen from the result that after the proposed algorithm, not only the RM, DFM, and BM are compensated, but also multiple beams can be combined to realize the joint integration. The simulation results also verify the above theoretical analysis.

5.2. Multi-Target Simulation Experimental Results

In order to verify the detection performance of the proposed algorithm in multi-target situations, the following simulation experiment is conducted. The simulation radar parameters are the same as those in Section 5.1 of the manuscript. Two moving targets are considered, which are denoted as Target 1 and 2. The moving parameters of these two targets are given in Table 5.
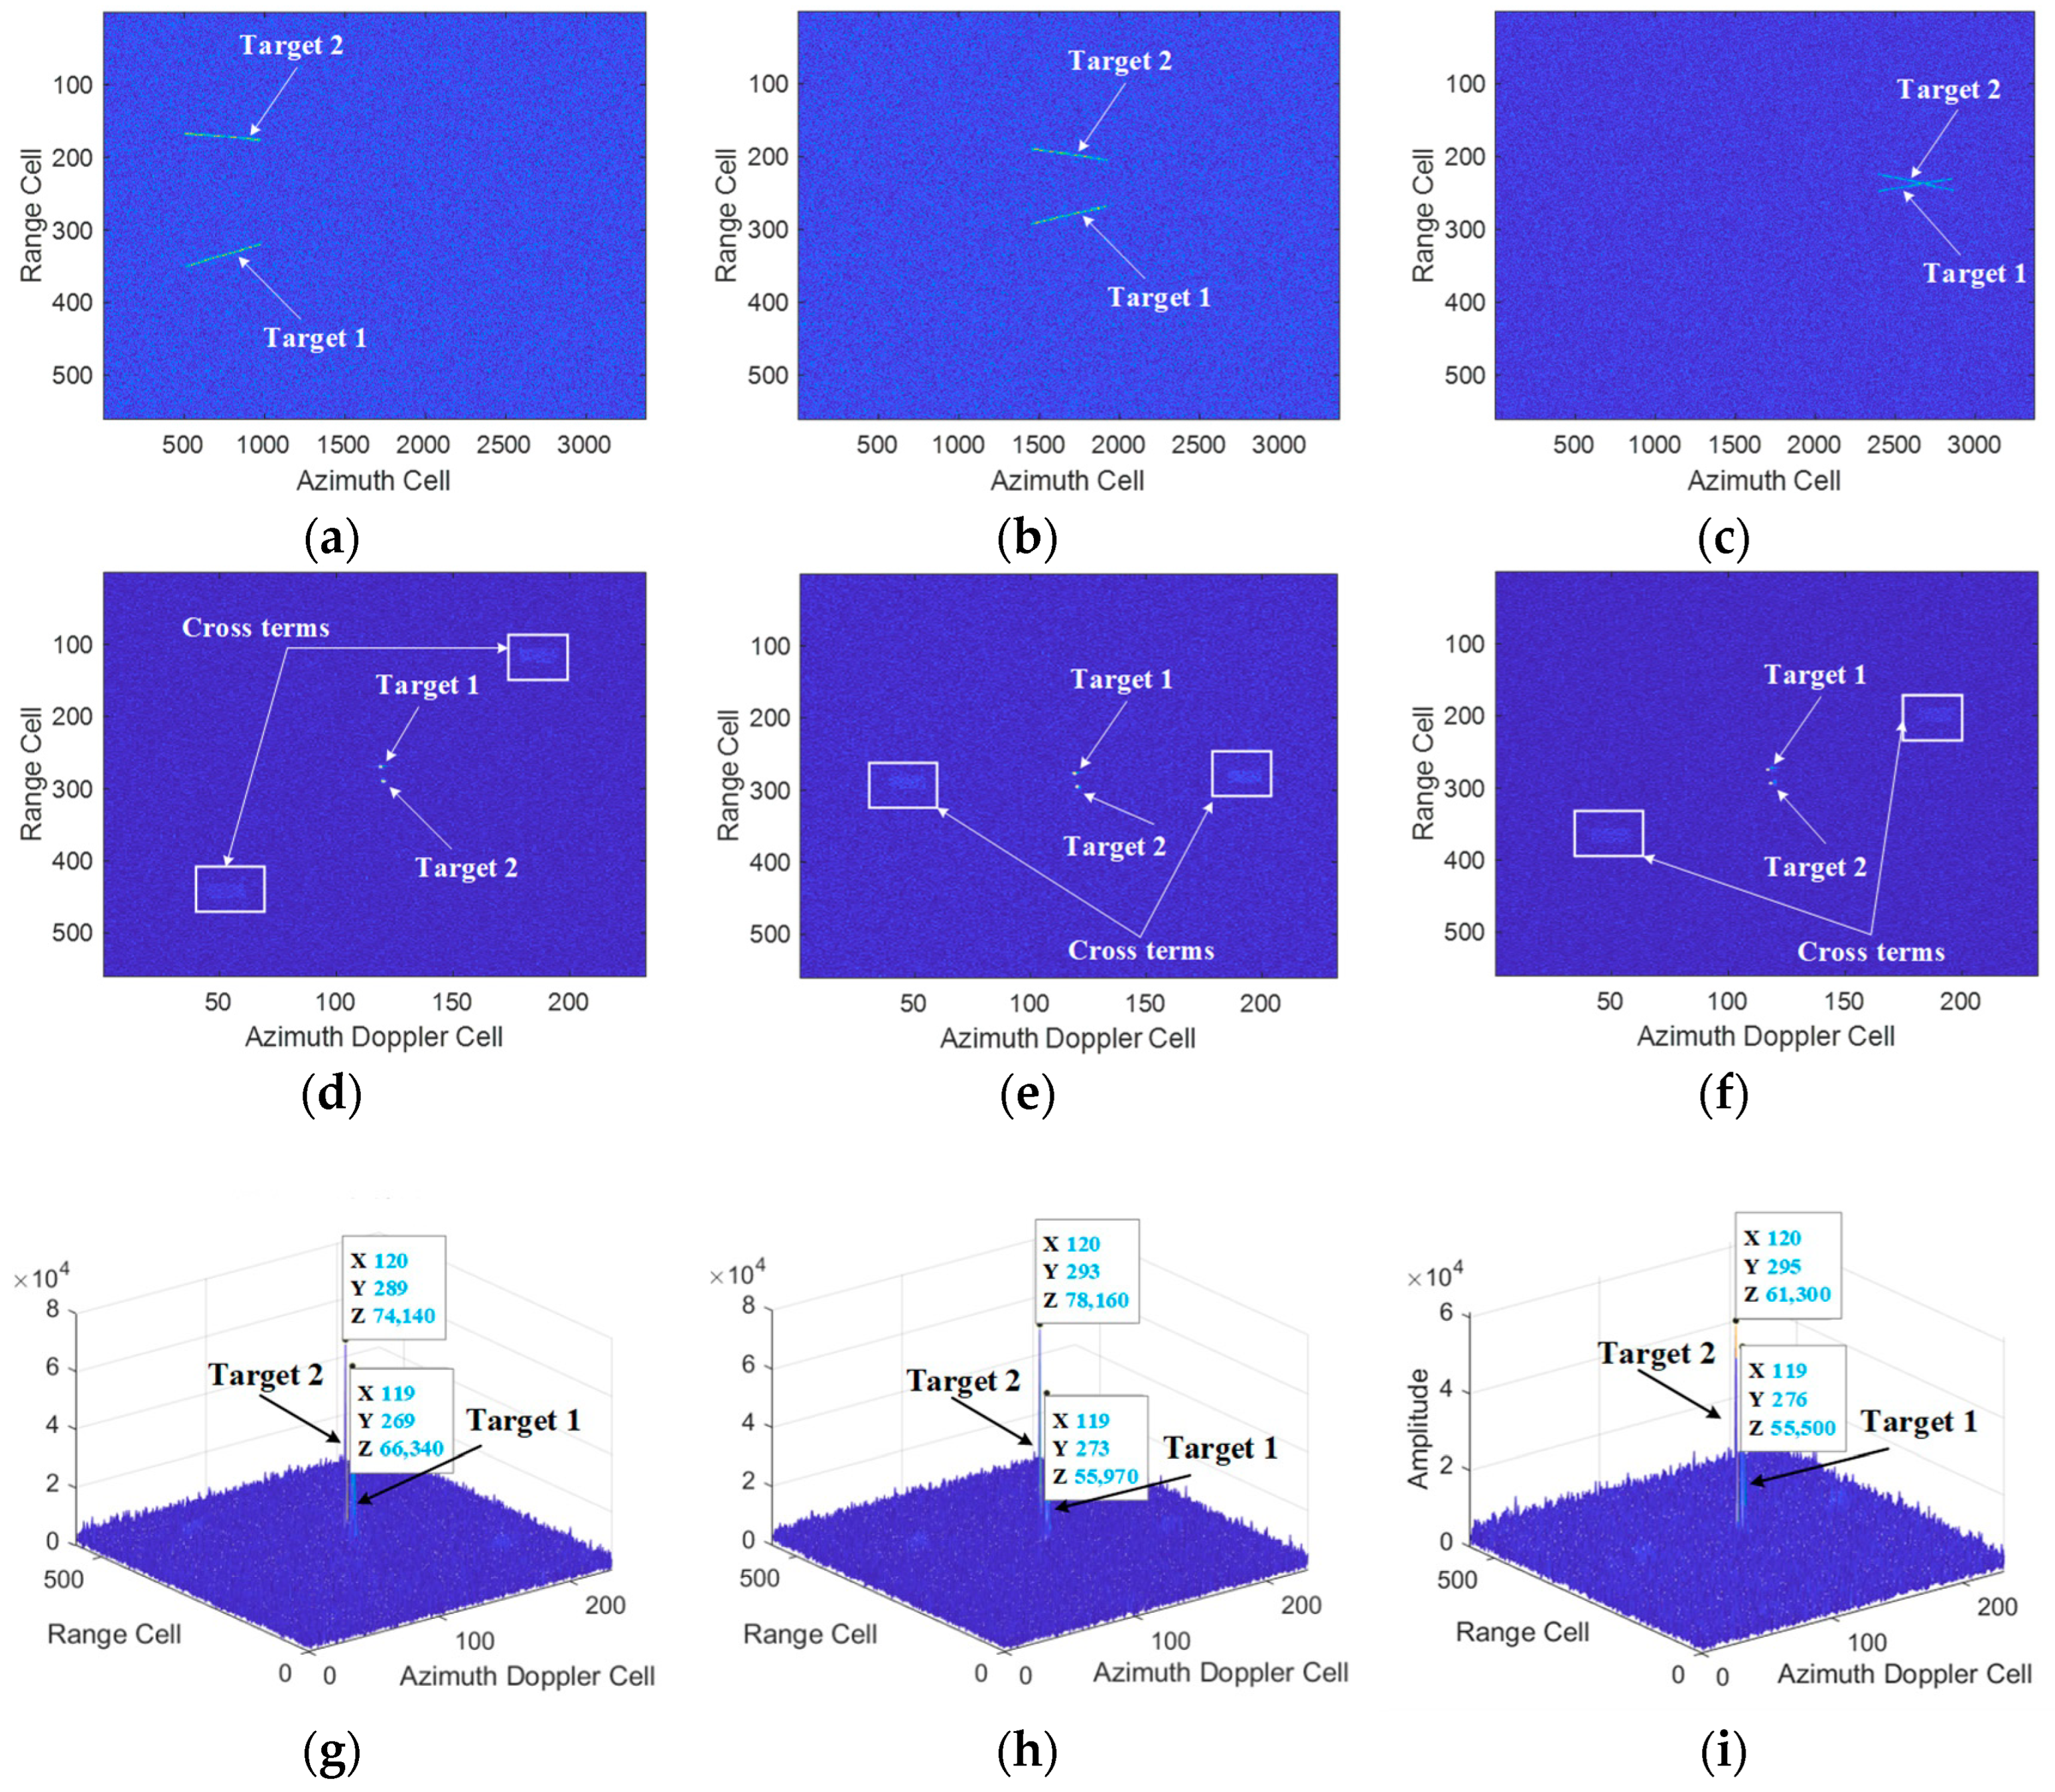
The simulated results of the multi-target situation are provided in Figure 12. The two trajectories of Target 1 and Target 2 after range compression are shown in Figure 12a–c, and the trajectories show that the two targets have an obvious RM phenomenon. After MBPCF, SOKT, and MSWPD processing, the two targets achieve coherent integration within the beam, and their 2D results are shown in Figure 12d–f. As shown in the figure, with regard to the cross terms, the influences of both the RM and DFM remain. Therefore, the cross terms are still defocused, which helps us to distinguish the cross terms. In this case, the cross terms do not affect the auto terms. The auto terms can be identified as clear peaks, which represent Target 1 and Target 2, respectively. Figure 12g–i indicate the 3D results; one can see that Target 1 from different beams is focused in the range–Doppler domain. At the same time, it can also be found that all the positions are in the same azimuth–Doppler unit (i.e., the 119th) but in different ranges (i.e., the 269th, 273th, and 276th). Similarly, the focus positions of Target 2 are in the same azimuth–Doppler unit (i.e., the 120th) but in different ranges (i.e., the 289th, 293th, and 295th).
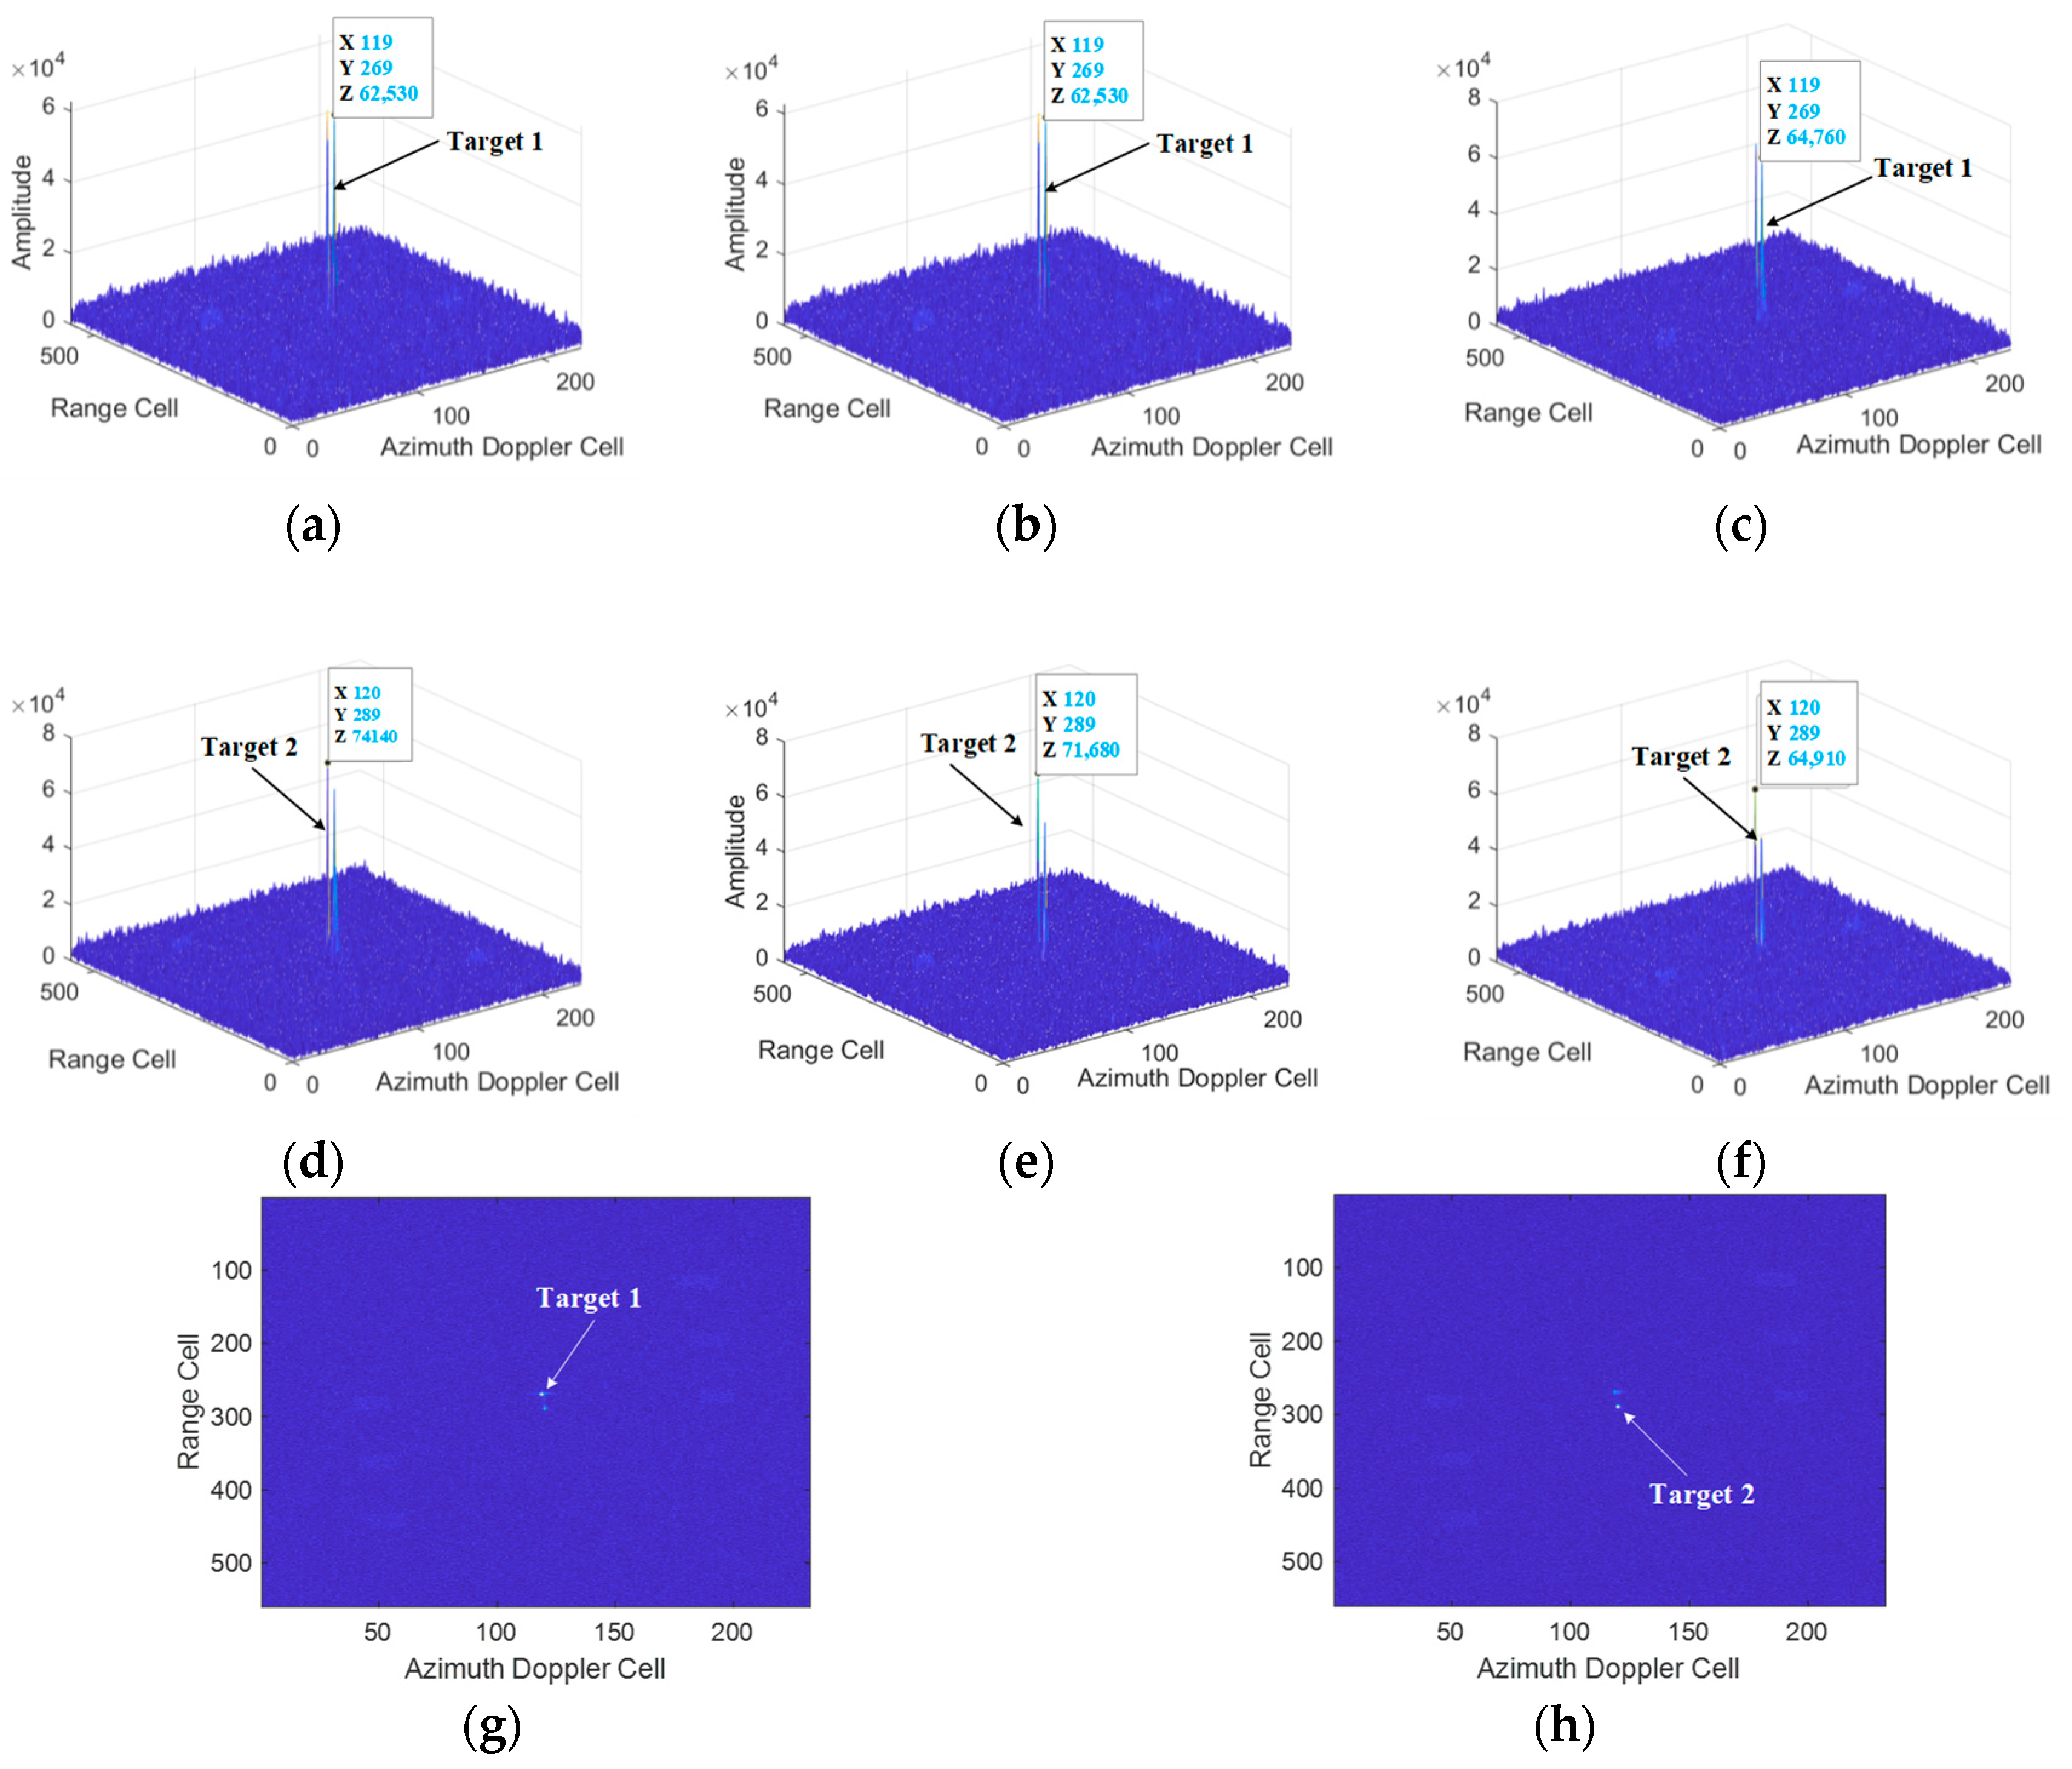
Figure 13 shows the result of the target after the SP operation. From Figure 13a–c, one can see that the positions of Target 1 in different beams are all at the same range cell (i.e., 269th). Similarly, Target 2 in different beams has the same range position (i.e., 289th) after SP operation, as shown in Figure 13d–f. Figure 13g,h, respectively, show the final focusing result of Target 1 and Target 2. It can be seen from the results that the proposed method can be applied to multi-target focusing.

5.3. Comparisons with the Existing Methods

Figure 14 shows the results of single-beam and multi-beam joint processing using the proposed method. The setting of radar and target parameters are the same as those in Section 5.1. Figure 14a,b show the 3D and 2D results after single-beam processing, and Figure 14c,d show the 3D and 2D results after multi-beam joint processing. Through calculation, it is found that the SNR gain after single-beam processing is 27.5279   dB , while the SNR gain after multi-beam joint processing is 29.8466   dB . The simulation experiment shows that the SNR gain is obviously improved after multi-beam joint processing.
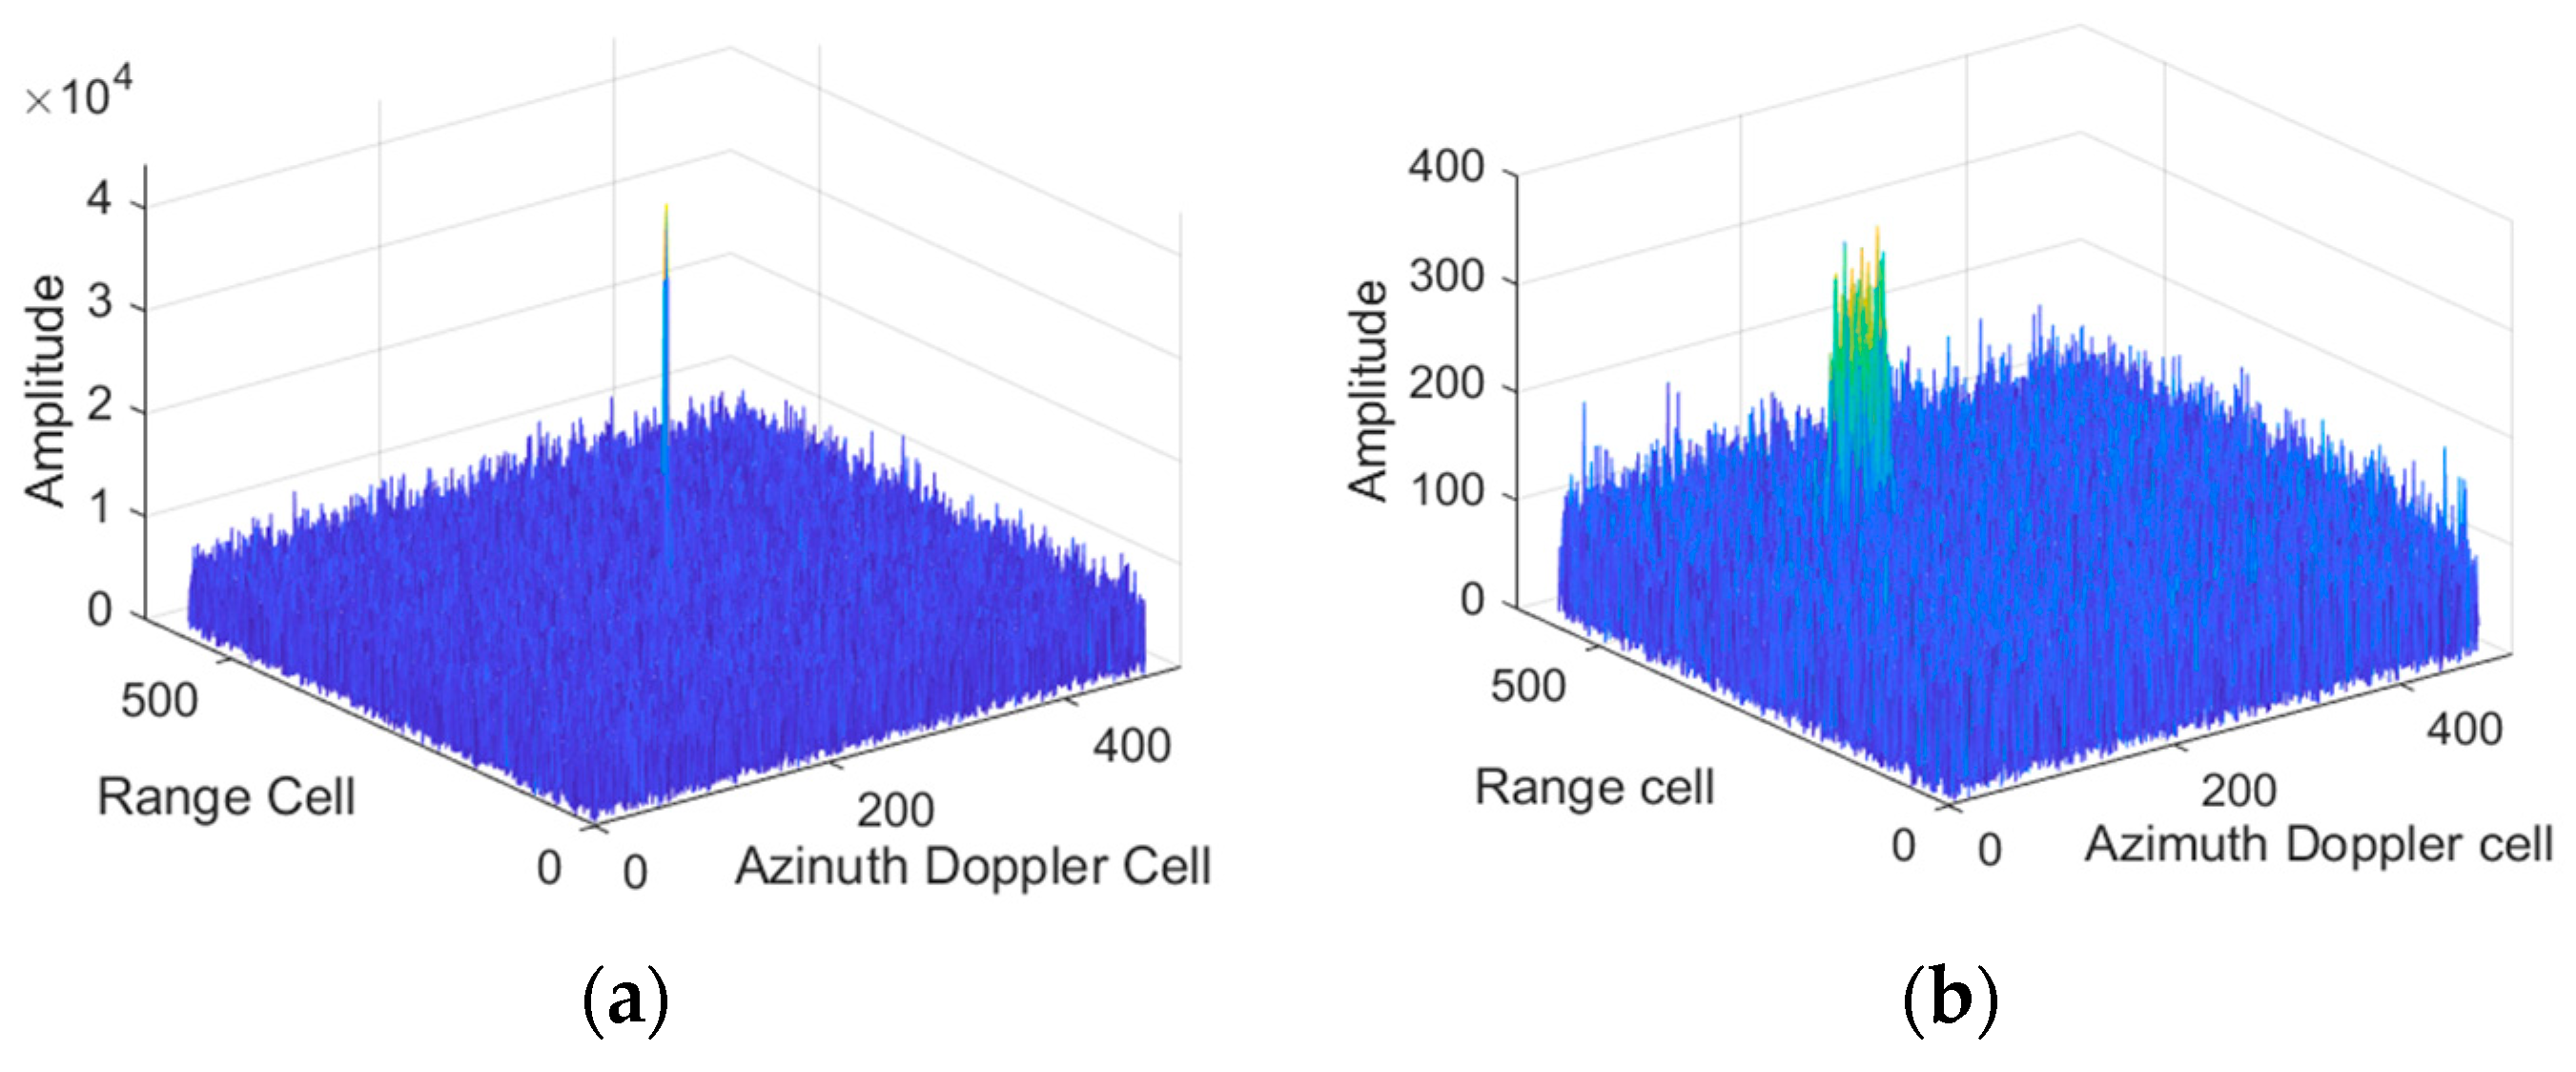
Figure 15 shows the integration results of different methods. The settings of radar and target parameters are the same as those in Section 5.1. Figure 15a,b, respectively, show the coherent integration results of the ACCF method and MTD method [59]. It can be seen from the figure that the ACCF method can achieve coherent integration of a moving target, and the SNR gains are 22.6861   dB , without considering the cross-beam phenomenon, the energy accumulation effect of ACCF is not as good as the proposed algorithm. However, in Figure 15b, not only without considering the multi-beam situation but also ignoring RM and DFM phenomena, the integration performance of the MTD method is seriously deteriorated, and the SNR gains are 16.5477   dB .
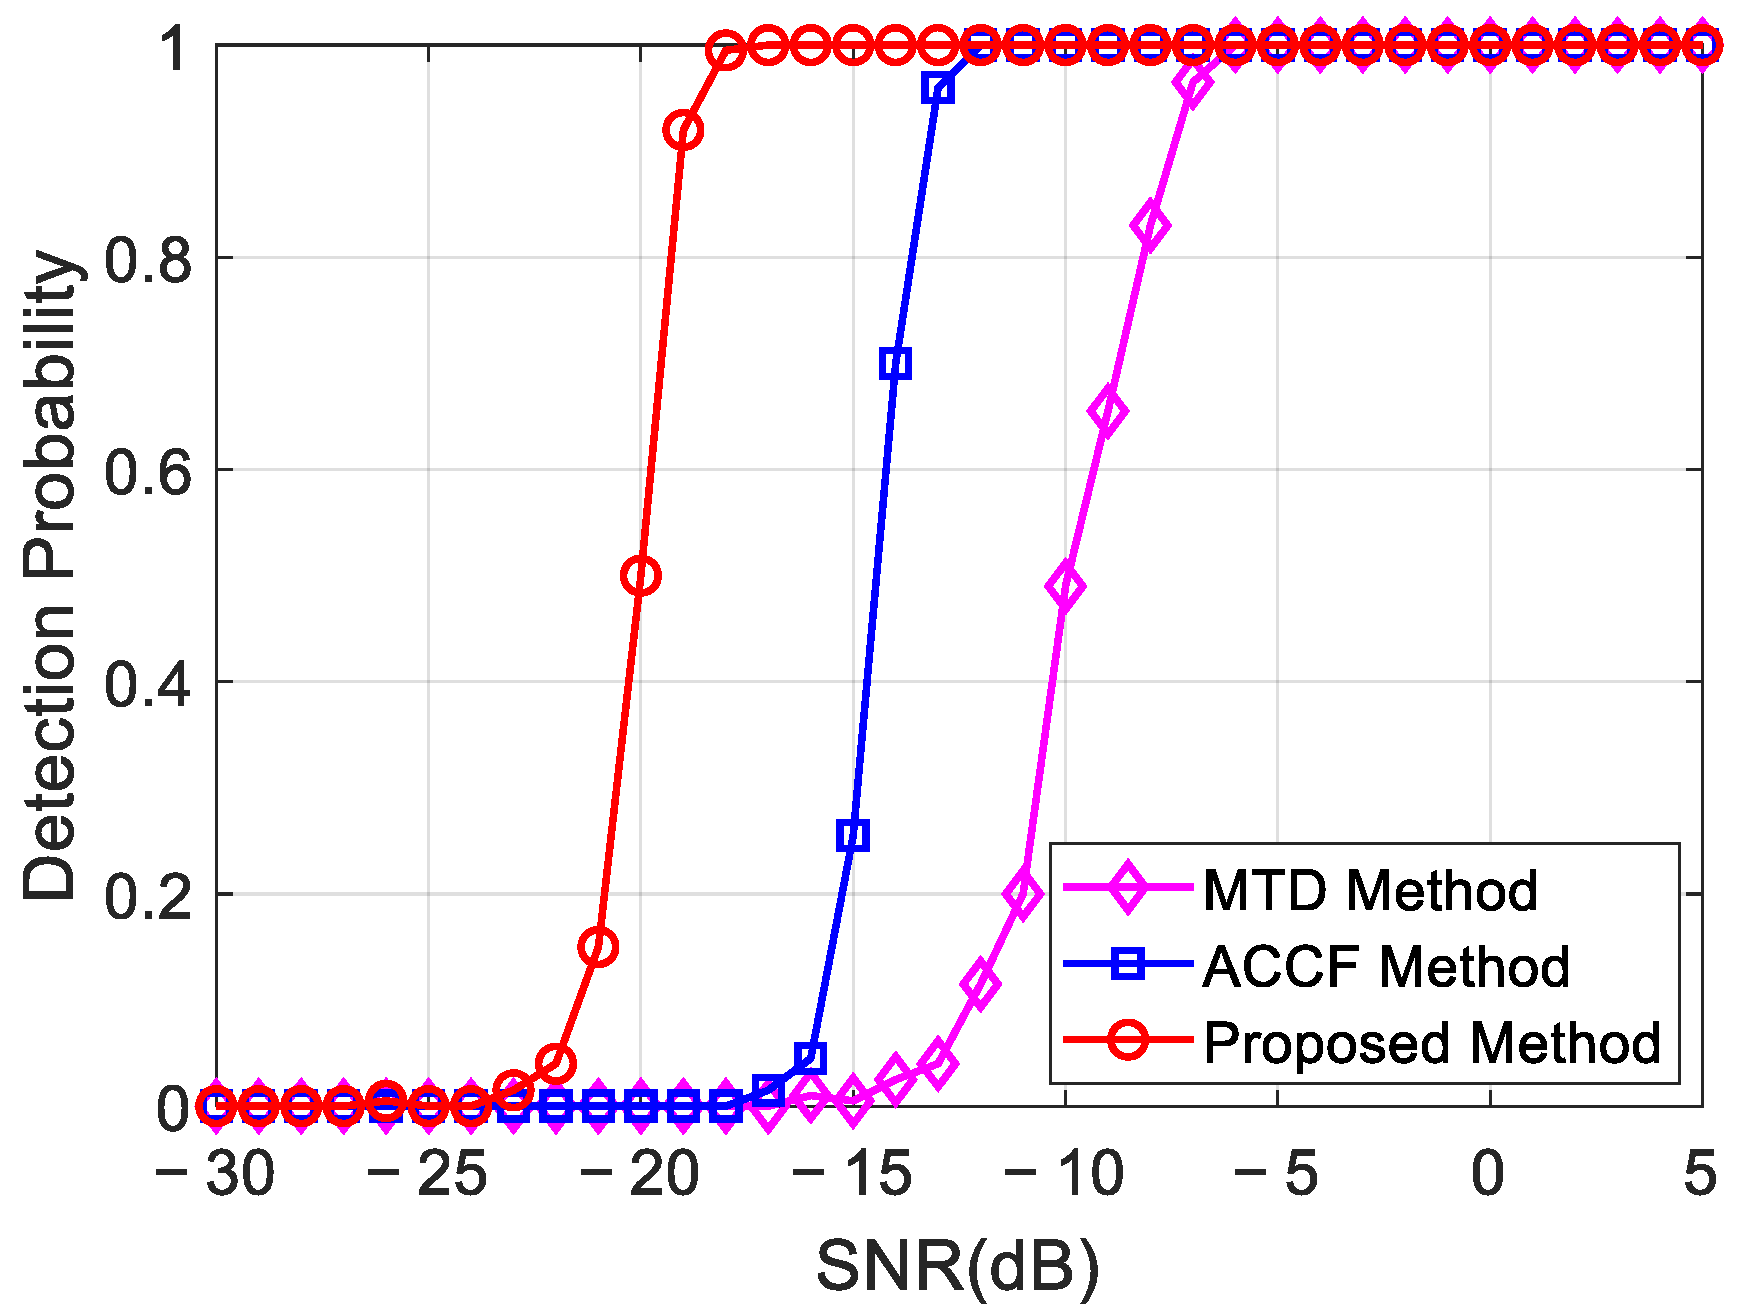
In order to evaluate the anti-noise performance of the proposed method, the target detection and parameter estimation performance comparison will be discussed in this section. The settings of radar and target parameters are the same as those in Section 5.1. Figure 16 shows the target detection probability curves of different methods under different SNRs, in which the detection probabilities of the proposed method and the other three coherent integration methods (including the ACCF method and MTD method) are calculated with 200 runs at each SNR (the false alarm rate is set to 10 4 ). As can be seen from Figure 14, the detection ability of the proposed method is the best among all methods. Moreover, the MTD method can not deal with the RM and DFM; they suffer a rapid deterioration in detection performance.

6. The Results of Synthesized Data

In this section, owing to the lack of radar-measured data in a multi-beam mode, the results of the synthesized data based on the measured clutter data are provided to confirm the effectiveness of the proposed method, as shown in Figure 17. The measured clutter data are obtained from the C-band RADARSAT-1 Vancouver scene. The parameters of the simulated target are set the same as those in Section 5.1, and the basic parameters of the C-band radar used in RADARSAT-1 are shown in Table 6. Detailed parameters of these C-band real data are provided in [60].
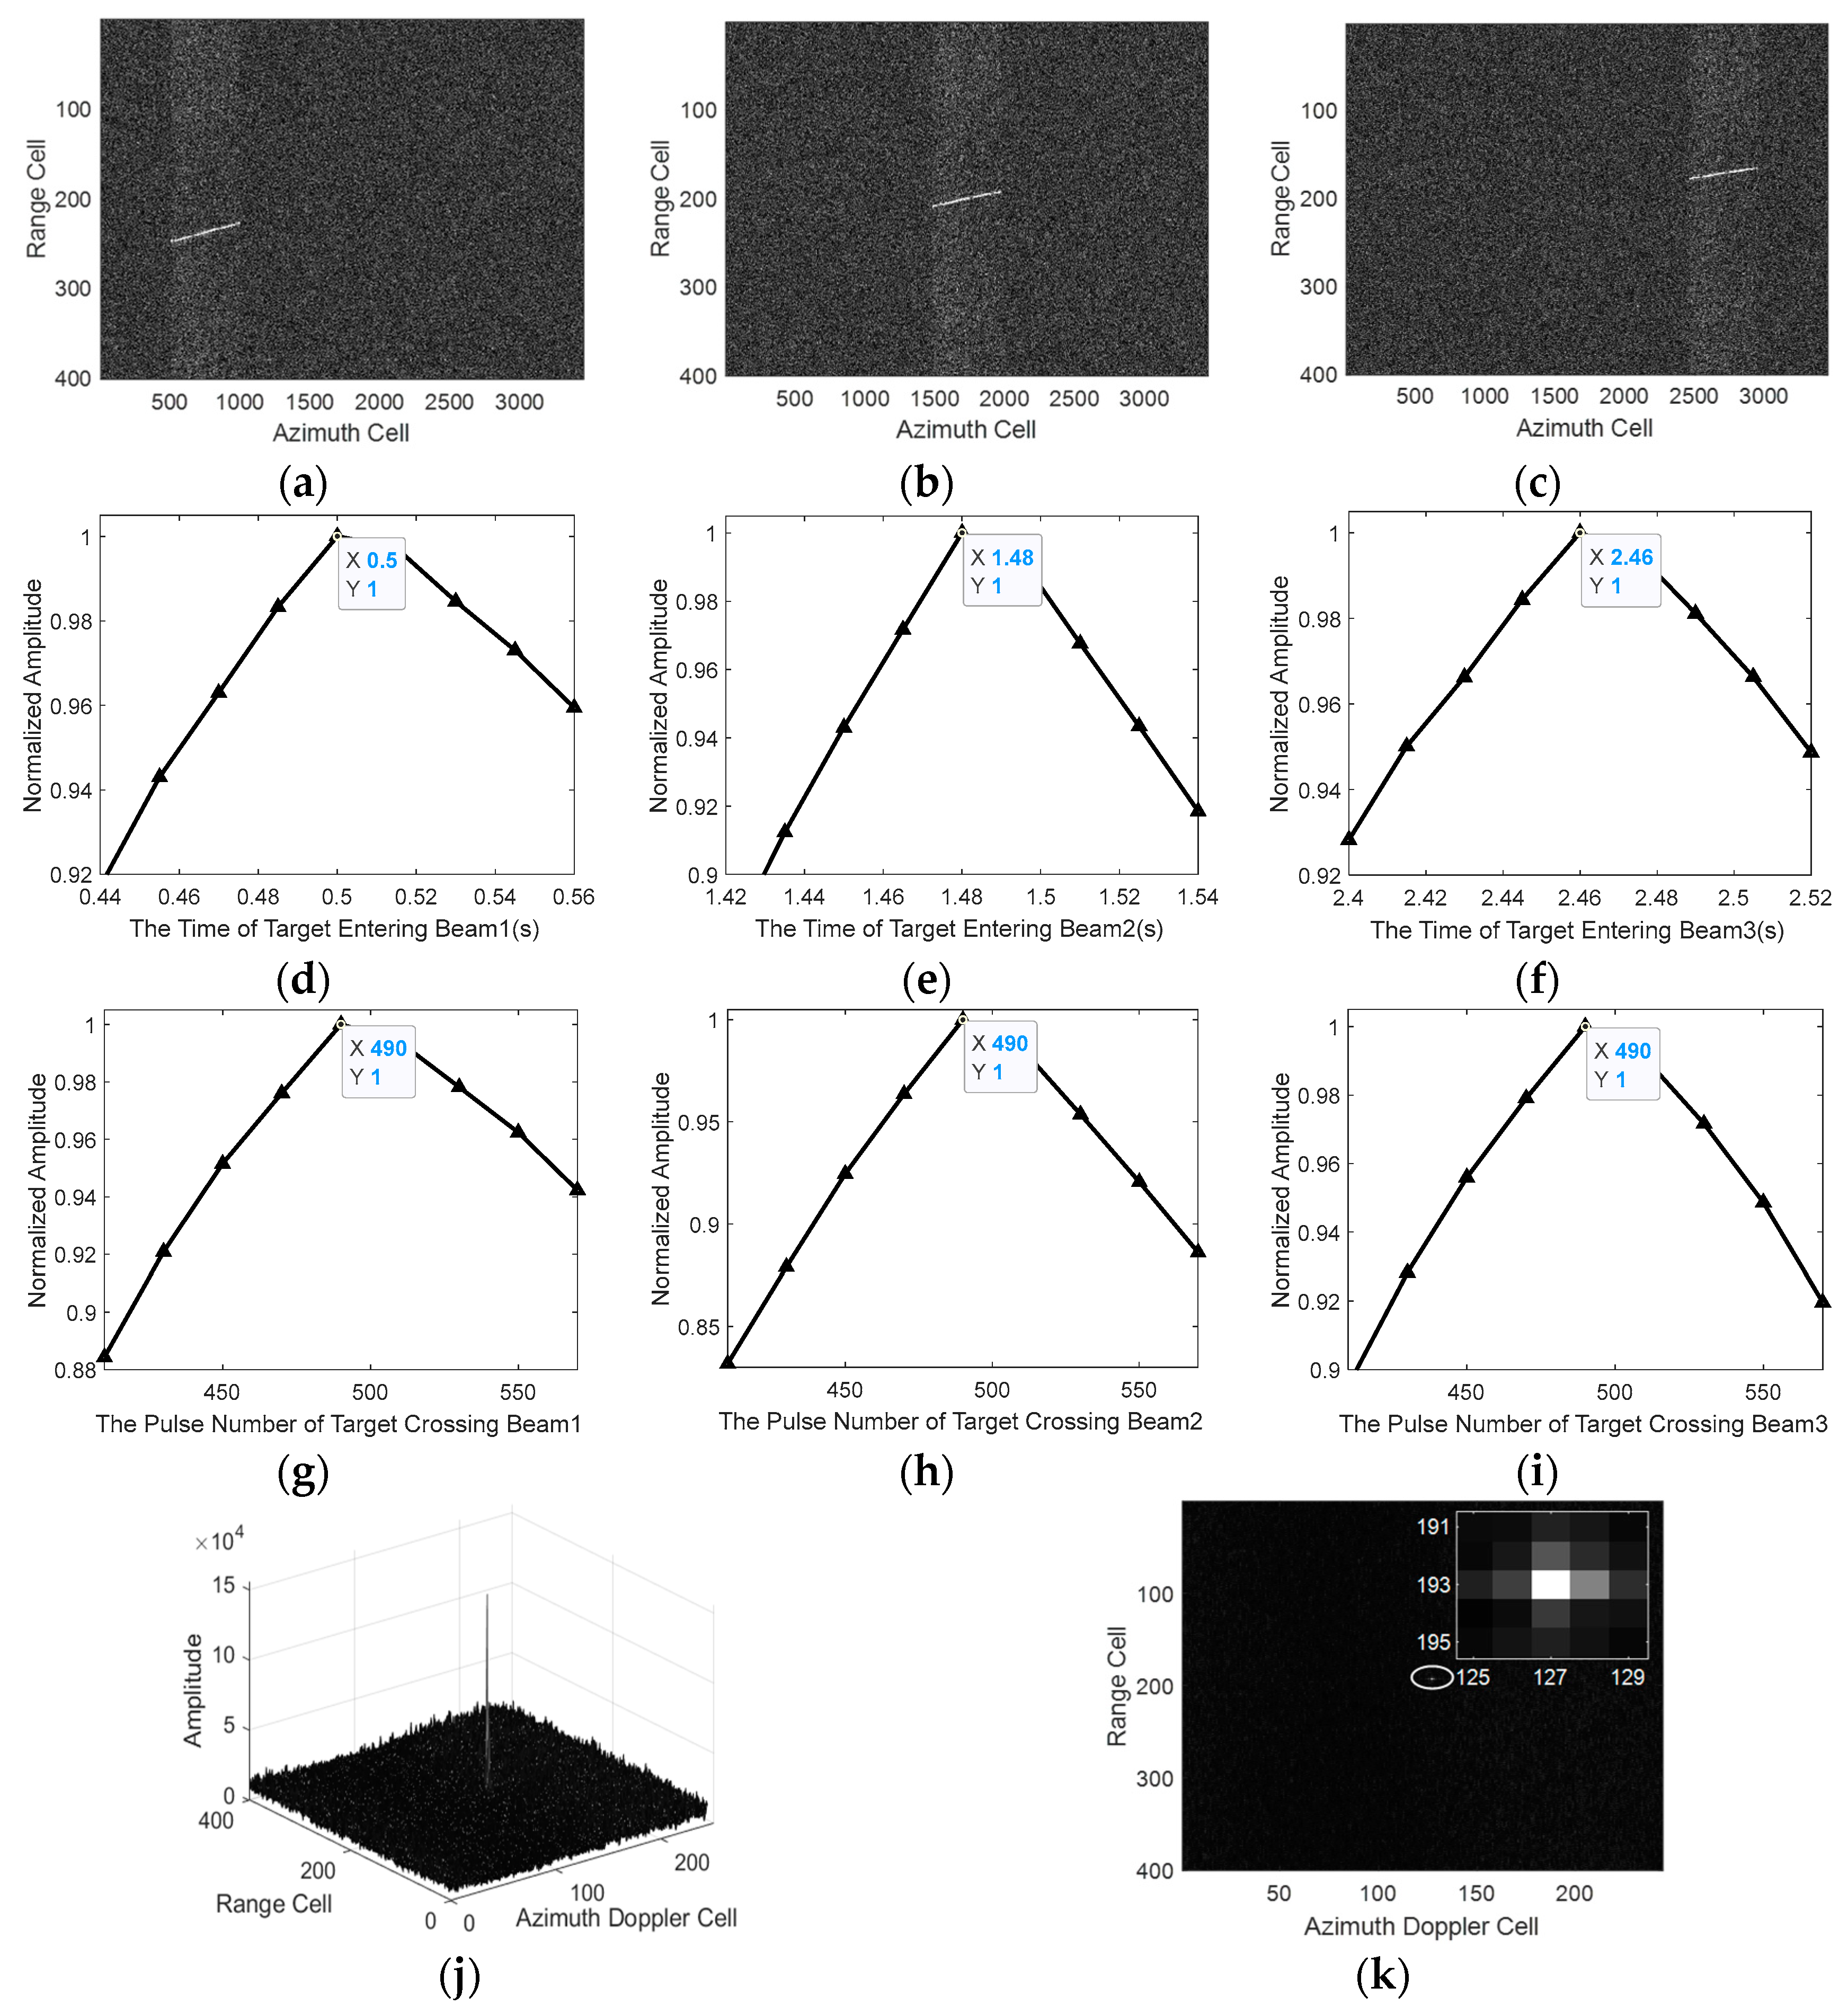
Figure 17 depicts the processing results of synthesized data based on the spaceborne real data. Figure 17a–c indicate the motion trajectories of the moving target after range compression. After the SOKT and MSWPD operation, one can find that the times of the target entering different beams are shown in Figure 17d–f. At the same time, the integration times of the target in different beams are also correctly estimated, as shown in Figure 17g–i. Figure 17j,k show the 3D and 2D results of multi-beam joint integration after SP operation. A well-focused result can be obtained after the proposed method is performed. According to the result in Figure 17, the proposed method can be used in the measured clutter background.

7. Conclusions

In this paper, we provide a new multi-beam-based long-time integration technique for moving targets. The following are the benefits of the suggested approach: (1) The geometric model diagram of the multi-beam radar system is produced, and the echo signal is obtained based on the motion characteristics of the moving target. (2) The suggested MBPCF can realize phase compensation between different beams. The MSWPD can accurately estimate time information, remove the RM and DFM, and achieve coherent integration in the beam. (3) Multi-beam joint-integration processing is completed using the SP operation. In conclusion, the results based on simulated data and synthetic data also show the feasibility of the proposed algorithm.

Author Contributions

Conceptualization, R.H., D.L. and J.W.; data curation, R.H. and D.L.; formal analysis, R.H. and D.L.; funding acquisition, D.L., J.W., Z.C. and Q.L.; investigation, D.L.; methodology, R.H., D.L. and J.W.; project administration, D.L. and J.W.; supervision, D.L. and Q.L.; validation, R.H., D.L. and J.W.; writing—original draft, R.H.; writing—review and editing, D.L., J.W., X.K., Q.L., Z.C. and X.Y. All authors have read and agreed to the published version of the manuscript.

Funding

This research was funded by the National Natural Science Foundation of China, under Grant 61971075, 62201099, and Grant 62001062; Key Laboratory of Cognitive Radio and Information Processing, Ministry of Education, under Grant CRKL220202; Basic scientific research project, under Grant JCKY2022110C171; the Opening Project of the Guangxi Wireless Broadband Communication and Signal Processing Key Laboratory, under Grant GXKL06200214 and Grant GXKL06200205; the Engineering Research Center of Mobile Communications, Ministry of Education, under Grant cqupt-mct-202103; the Natural Science Foundation of Chongqing, China under Grant cstc2021jcyj-bshX0085; the Fundamental Research Funds for the Central Universities Project, under Grant 2023CDJXY-037; the Sichuan Science and Technology Program, under Grant 2022SZYZF02.

Data Availability Statement

Data sharing is not applicable to this article.

Conflicts of Interest

The authors declare no conflict of interest.

Appendix A

Assume that the receiving antenna is a uniform linear array (ULA) with an interval of d . Then, according to the signal-processing results of the uniform array, the received signal of the m th array element is:
x m ( t ) = s ( t ) exp ( j m ϕ d ) , m = 0 , 1 , , M 1
where ϕ d represents the beam pointing phase, and its expression is:
ϕ d = 2 π d sin θ d / λ
where θ d denotes the beam angle. After summing the output results of M array elements, the result is:
X ( ϕ ) = m = 0 M 1 x m ( t ) e j m ϕ = s ( t ) 1 e j M ( ϕ ϕ d ) 1 e j ( ϕ ϕ d ) = s ( t ) sin [ M 2 ( ϕ ϕ d ) ] sin [ 1 2 ( ϕ ϕ d ) ] exp [ j M 1 2 ( ϕ ϕ d ) ]
Then, the Equation (A2) is substituted into the Equation (A3), and after demodulation and pulse compression, the echo signal model can be obtained:
s ( t , t m ) = A sin c { B [ t 2 R s ( t ˜ m ) c ] } × n = 1 N w n ( t ˜ m ) × exp [ j 4 π λ R s ( t ˜ m ) ] × sin { π M d λ [ sin ( θ ( t ˜ m ) ) sin ( θ d ( n ) ) ] } sin { π d λ [ sin ( θ ( t ˜ m ) ) sin ( θ d ( n ) ) ] } × exp { j π ( M 1 ) d λ [ sin ( θ ( t ˜ m ) ) sin ( θ d ( n ) ) ] }
According to the relationship between the sine value of the angle and the angle, when the angle is small, the following equation can be approximately established:
sin ( θ ( t ˜ m ) ) θ ( t ˜ m ) sin ( θ d ( n ) ) θ d ( n )
If d = λ / 2 , at the same time, the Equation (A5) is substituted into the Equation (A4), then the following is obtained:
s ( t , t m ) = A sin c { B [ t 2 R s ( t ˜ m ) c ] } × n = 1 N w n ( t ˜ m ) × exp [ j 4 π λ R s ( t ˜ m ) ] × sin { π M 2 [ θ ( t ˜ m ) θ d ( n ) ] } sin { π 2 [ θ ( t ˜ m ) θ d ( n ) ] } × exp { j π ( M 1 ) 2 [ θ ( t ˜ m ) θ d ( n ) ] }
Let A ˜ = A × sin { π M 2 [ θ ( t ˜ m ) θ d ( n ) ] } sin { π 2 [ θ ( t ˜ m ) θ d ( n ) ] } , then, Equation (A6) can be rewritten as:
s ( t , t m ) = A ˜ sin c { B [ t 2 R s ( t ˜ m ) c ] } × n = 1 N w n ( t ˜ m ) × exp [ j 4 π λ R s ( t ˜ m ) ] × exp [ j π ( M 1 ) 2 θ ( t ˜ m ) ] × exp [ j π ( M 1 ) 2 θ d ( n ) ]
In the second exponential term in Equation (A7), it should be noted that the tangential motion of the target will not affect the subsequent processing of the echo, so we will incorporate this term into A ˜ terms, namely:
A ˜ = A × sin { π M 2 [ θ ( t ˜ m ) θ d ( n ) ] } sin { π 2 [ θ ( t ˜ m ) θ d ( n ) ] } × exp [ j π ( M 1 ) 2 θ ( t ˜ m ) ]
The received baseband signal in the range- and azimuth-time domain is written as follows:
s b a s e , n ( t , t ˜ m ) = A ˜ × w n ( t ˜ m ) × sin c { B [ t 2 R s ( t ˜ m ) c ] } × exp [ j 4 π λ R s ( t ˜ m ) ] × exp [ j π ( M 1 ) 2 θ d ( n ) ]

Appendix B

It can be known from Equation (3) that the radial velocity offset Δ b 1 , v a caused by the azimuth velocity v a in the total integration time T is:
Δ b 1 , v a = | X N v p X r , N v a + X N v a R 0 , N |
Then, from Equation (19), in the range–Doppler domain, the range–dimensional position offset Δ R v a caused by the azimuth velocity v a is:
Δ R v a = ( Δ b 1 , v a 2 ) η
Use relevant radar parameters and target motion parameters in Section 5 to make simulation calculations. There are:
Δ R v a = | X N v p X r , N v a + X r , N v a R 0 , N | / 2 × Δ T 2 = 0.9054   m < c 2 B = 5   m
Therefore, the azimuth velocity v a has no effect on the offset of range in the range–Doppler domain. To fully explain the influence of v a on range dimension position, Figure A1 shows the offset of the range caused by different total integration times T and different v a . Figure A1a shows the relationship between the T and the offset of the range dimension position; Figure A1b shows the relationship between the v a and the offset of the range dimension position. From Figure A1, under the condition of setting simulation experiment parameters, one can see that the above conclusion holds.
Figure A1. Simulated results of example C: (a) the range offset caused by T and (b) the range offset caused by v a .
Remotesensing 15 04429 g0a1

References

  1. Chen, X.; Guan, J.; Huang, Y.; Liu, N.; He, Y. Radon-Linear canonical ambiguity function-based detection and estimation method for marine target with micromotion. IEEE Trans. Geosci. Remote Sens. 2015, 53, 2225–2240. [Google Scholar] [CrossRef]
  2. Huang, P.; Liao, G.; Yang, Z.; Xia, X.G.; Ma, J.; Zheng, J. Ground maneuvering target imaging and high-order motion parameter estimation based on second-order keystone and generalized Hough-HAF transform. IEEE Trans. Geosci. Remote Sens. 2017, 55, 320–335. [Google Scholar] [CrossRef]
  3. Zuo, L.; Li, M.; Zhang, X.; Wang, Y.; Wu, Y. An efficient method for detecting slow-moving weak targets in sea clutter based on time-frequency iteration decomposition. IEEE Trans. Geosci. Remote Sens. 2013, 51, 3639–3672. [Google Scholar] [CrossRef]
  4. Zheng, J.; Chen, R.; Yang, T.; Liu, X.; Liu, H.; Su, T.; Wan, L. An efficient strategy for accurate detection and localization of UAV swarms. IEEE Internet Things J. 2021, 8, 15372–15381. [Google Scholar] [CrossRef]
  5. Noviello, C.; Fornaro, G.; Martorella, M. Focused SAR estimation. IEEE Trans. Geosci. Remote Sens. 2015, 53, 3460–3470. [Google Scholar] [CrossRef]
  6. Mu, H.; Zhang, Y.; Jiang, Y.; Ding, C. CV-GMTINet: GMTI using a deep complex-valued convolutional neural network for multichannel SAR-GMI system. IEEE Trans. Geosci. Remote Sens. 2022, 60, 5201115. [Google Scholar] [CrossRef]
  7. Yuan, H.; Li, H.; Zhang, Y.; Wang, Y.; Liu, Z.; Wei, C.; Yao, C. High-resolution refocusing for defocused ISAR images by complex-valued Pix2pixHD network. IEEE Geosci. Remote Sens. Lett. 2022, 19, 4027205. [Google Scholar] [CrossRef]
  8. Zhang, Y.; Yuan, H.; Li, H.; Wei, C.; Yao, C. Complex-valued graph neural network on space target classification for defocused ISAR images. IEEE Geosci. Remote Sens. Lett. 2022, 19, 4512905. [Google Scholar] [CrossRef]
  9. Yu, L.; Chen, C.; Wang, J.; Wang, P.; Men, Z. Refocusing high-resolution SAR images of complex moving vessels using co-evolutionary particle swarm optimization. Remote Sens. 2020, 12, 3302. [Google Scholar] [CrossRef]
  10. Sun, Z.; Li, X.; Yi, W.; Cui, G.; Kong, L. A coherent detection and velocity estimation algorithm for the high-speed target based on the modified location rotation transform. IEEE J. Sel. Top. Appl. Earth Obs. Remote Sens. 2018, 11, 2346–2361. [Google Scholar] [CrossRef]
  11. Zheng, J.; Yang, T.; Liu, H.; Su, T. Efficient data transmission strategy for IIoTs with arbitrary geometrical array. IEEE Trans. Ind. Inform. 2021, 17, 3460–3468. [Google Scholar] [CrossRef]
  12. Xing, M.; Su, J.; Wang, G.; Bao, Z. New parameter estimation and detection algorithm for high speed small target. IEEE Trans. Aerosp. Electron. Syst. 2011, 47, 214–224. [Google Scholar] [CrossRef]
  13. Liu, J.; Zhou, S.; Liu, W.; Zheng, J.; Liu, H.; Li, J. Tunable adaptive detection in colocated MIMO radar. IEEE Trans. Signal Process. 2018, 66, 1080–1092. [Google Scholar] [CrossRef]
  14. Xu, J.; Peng, Y.; Xia, X. Focus-before-detection radar signal processing: Part I—Challenges and methods. IEEE Trans. Aerosp. Electron. Syst. 2017, 32, 48–59. [Google Scholar] [CrossRef]
  15. Huang, X.; Zhang, L.; Zhang, J.; Li, S. Efficient angular chirp-Fourier transform and its application to high-speed target detection. Signal Process. 2019, 164, 234–248. [Google Scholar] [CrossRef]
  16. Huang, X.; Zhang, L.; Li, S.; Zhao, Y. Radar highspeed small target detection based on keystone transform and linear canonical transform. Signal Process. 2018, 82, 203–215. [Google Scholar] [CrossRef]
  17. Arii, M. Efficient motion compensation of a moving object on SAR imagery based on velocity correlation function. IEEE Trans. Geosci. Remote Sens. 2014, 52, 936–946. [Google Scholar] [CrossRef]
  18. Zaugg, E.; Long, D. Theory and application of motion compensation for LFM-CW SAR. IEEE Trans. Geosci. Remote Sens. 2008, 46, 2990–2998. [Google Scholar] [CrossRef]
  19. Hough, P. Method and Means for Recognizing Complex Patterns. U.S. Patent No. 3,069,654, 18 December 1962. [Google Scholar]
  20. Cai, L.; Rotation, S. Scale and translation invariant image watermarking using Radon transform and Fourier transform. In Proceedings of the IEEE 6th Circuits and Systems Symposium on Emerging Technologies: Frontiers of Mobile and Wireless Communication (IEEE Cat. No.04EX710), Shanghai, China, 31 May–2 June 2004; Volume 1, p. 281. [Google Scholar]
  21. Ye, Q.; Huang, R.; He, X.; Zhang, C. A SR-based radon transform to extract weak lines from noise images. In Proceedings of the ICIP 2003 International Conference on Image Processing (Cat. No.03CH37429), Barcelona, Spain, 14–17 September 2003; Volume 1, p. 1. [Google Scholar]
  22. Mohanty, N. Computer tracking of moving point targets in space. IEEE Trans. Pattern Anal. Mach. Intell. 1981, 3, 606–611. [Google Scholar] [CrossRef]
  23. Reed, I.; Gagliardi, R.; Shao, H. Application of three dimensional filtering to moving target detection. IEEE Trans. Aerosp. Electron. Syst. 1983, 19, 898–905. [Google Scholar] [CrossRef]
  24. Larson, R.; Peschon, J. A dynamic programming approach to trajectory estimation. IEEE Trans. Autom. Control 1966, 3, 537–540. [Google Scholar] [CrossRef]
  25. Carlson, B.; Evans, E.; Wilson, S. Search radar detection and track with the Hough transform. I. System concept. IEEE Trans. Aerosp. Electron. Syst. 1994, 30, 102–108. [Google Scholar] [CrossRef]
  26. Carlson, B.; Evans, E.; Wilson, S. Search radar detection and track with the Hough transform. II. Detection statistics. IEEE Trans. Aerosp. Electron. Syst. 1994, 30, 109–115. [Google Scholar] [CrossRef]
  27. Perry, R.; Dipietro, R.; Fante, R. SAR imaging of moving targets. IEEE Trans. Aerosp. Electron. Syst. 1999, 35, 188–199. [Google Scholar] [CrossRef]
  28. Huang, P.; Liao, G.; Yang, Z.; Xia, X.G.; Ma, J.T.; Ma, J. Long-time coherent integration for weak maneuvering target detection and high-order motion parameter estimation based on keystone transform. IEEE Trans. Signal Process. 2016, 64, 4013–4026. [Google Scholar] [CrossRef]
  29. Kirkland, D. Imaging moving targets using the second-order keystone transform. IET Radar Sonar Navig. 2011, 5, 902–910. [Google Scholar] [CrossRef]
  30. Li, G.; Xia, X.; Peng, Y. Doppler keystone transform: An approach suitable for parallel implementation of SAR moving target imaging. IEEE Trans. Geosci. Remote Sens. 2008, 5, 573–577. [Google Scholar] [CrossRef]
  31. Sun, G.; Xing, M.; Xia, X.; Wu, Y.; Bao, Z. Robust ground moving-target imaging using deramp–keystone processing. IEEE Trans. Geosci. Remote Sens. 2013, 51, 966–982. [Google Scholar] [CrossRef]
  32. Chen, X.; Guan, J.; Liu, N.; Zhou, W.; He, Y. Detection of a low observable sea-surface target with micromotion via the Radon-linear canonical transform. IEEE Trans. Geosci. Remote Sens. Lett. 2014, 11, 1225–1229. [Google Scholar] [CrossRef]
  33. Li, X.; Cui, G.; Yi, W.; Kong, L. Coherent integration for maneuvering target detection based on Radon-Lv’s distribution. IEEE Trans. Signal Process. Lett. 2015, 22, 1467–1471. [Google Scholar] [CrossRef]
  34. Oveis, A.; Sebt, M.; Ali, M. Coherent method for ground-moving target indication and velocity estimation using Hough transform. IET Radar Sonar Navig. 2017, 11, 646–655. [Google Scholar] [CrossRef]
  35. Zheng, B.; Su, T.; Zhu, W.; He, X.; Liu, Q.H. Radar high-speed target detection based on the scaled inverse Fourier transform. IEEE J. Sel. Top. Appl. Earth Obs. Remote Sens. 2015, 8, 1108–1119. [Google Scholar] [CrossRef]
  36. Zheng, J.; Su, T.; Liu, H.; Liao, G.; Liu, Z.; Liu, Q. Radar high-speed target detection based on the frequency-domain deramp-keystone transform. IEEE J. Sel. Top. Appl. Earth Obs. Remote Sens. 2016, 9, 285–294. [Google Scholar] [CrossRef]
  37. Li, X.; Cui, G.; Yi, W.; Kong, L. A fast maneuvering target motion parameters estimation algorithm based on ACCF. IEEE Trans. Signal Process. Lett. 2015, 22, 270–274. [Google Scholar] [CrossRef]
  38. Almeida, L. The fractional Fourier transform and time-frequency representations. IEEE Trans. Signal Process. 1994, 42, 3084–3091. [Google Scholar] [CrossRef]
  39. Xu, J.; Yu, J.; Peng, Y.; Xia, X. Radon-Fourier transform for radar target detection (I): Generalized Doppler filter bank. IEEE Trans. Aerosp. Electron. Syst. 2011, 47, 1186–1202. [Google Scholar] [CrossRef]
  40. Xu, J.; Yu, J.; Peng, Y.; Xia, X. Radon-Fourier transform for radar target detection (II): Blind speed sidelobe suppression. IEEE Trans. Aerosp. Electron. Syst. 2011, 47, 2473–2489. [Google Scholar] [CrossRef]
  41. Xu, J.; Yu, J.; Peng, Y.; Xia, X. Radon-Fourier transform for radar target detection (III): Optimality and fast implementations. IEEE Trans. Aerosp. Electron. Syst. 2012, 48, 991–1004. [Google Scholar]
  42. Chen, X.; Guan, J.; Liu, N.; He, Y. Maneuvering target detection via radon-fractional Fourier transform-based long-time coherent integration. IEEE Trans. Signal Process. 2014, 62, 939–953. [Google Scholar] [CrossRef]
  43. Xu, J.; Xia, X.; Peng, S.; Yu, J.; Peng, Y.; Qian, L. Radar maneuvering target motion estimation based on generalized Radon-Fourier transform. IEEE Trans. Signal Process. 2012, 60, 6190–6201. [Google Scholar]
  44. Porat, B.; Friedlander, B. Asymptotic statistical analysis of the high-order ambiguity function for parameter estimation of polynomial-phase signals. IEEE Trans. Inf. Theory 1996, 42, 995–1001. [Google Scholar] [CrossRef]
  45. Lv, X.; Bi, G.; Wan, C.; Xing, M. Lv’s distribution: Principle, implementation, properties, and performance. IEEE Trans. Signal Process. 2011, 59, 3576–3591. [Google Scholar] [CrossRef]
  46. Huang, P.; Liao, G.; Yang, Z.; Xia, X.; Ma, J.; Zhang, X. A fast SAR imaging method for ground moving target using a second-order WVD transform. IEEE Trans. Geosci. Remote Sens. 2016, 54, 1940–1956. [Google Scholar] [CrossRef]
  47. Li, D.; Zhan, M.; Su, J.; Liu, H.; Zhang, X.; Liao, G. Performances analysis of coherently integrated CPF for LFM signal under low SNR and its application to ground moving target imaging. IEEE Trans. Geosci. Remote Sens. 2017, 55, 6402–6419. [Google Scholar] [CrossRef]
  48. Rao, X. Research on Techniques of Long Time Coherent Integration Detection for Air Weak Moving Target. Doctoral Thesis, Xidian University, Xi’an, China, 2015. [Google Scholar]
  49. Zhan, M.; Huang, P.; Zhu, S.; Liu, X.; Liao, G.; Sheng, J.; Li, S. A modified keystone transform matched filtering method for space-moving target detection. IEEE Trans. Geosci. Remote Sens. 2022, 60, 5105916. [Google Scholar] [CrossRef]
  50. Huang, P.; Xia, X.; Liu, X.; Liao, G. Refocusing and motion parameter estimation for ground moving targets based on improved axis rotation-time reversal transform. IEEE Trans. Comput. Imaging 2018, 4, 479–494. [Google Scholar] [CrossRef]
  51. Huang, P.; Liao, G.; Yang, Z.; Xia, X.; Ma, J.; Zhang, X. An approach for refocusing of ground moving target without motion parameter estimation. IEEE Trans. Geosci. Remote Sens. 2017, 55, 336–350. [Google Scholar] [CrossRef]
  52. Tian, J.; Cui, W.; Xia, X.; Wu, S. Parameter estimation of ground moving targets based on SKT-DLVT processing. IEEE Trans. Comput. Imaging 2016, 2, 13–26. [Google Scholar] [CrossRef]
  53. Wan, J.; Zhou, Y.; Zhang, L.; Chen, Z. Ground moving target focusing and motion parameter estimation method via MSOKT for synthetic aperture radar. IET Signal Process. 2019, 13, 528–537. [Google Scholar] [CrossRef]
  54. Zhu, S.; Liao, G.; Qu, Y.; Zhou, Z. Ground moving targets imaging algorithm for synthetic aperture radar. IEEE Trans. Geosci. Remote Sens. 2011, 49, 462–477. [Google Scholar] [CrossRef]
  55. Zhu, D.; Li, Y.; Zhu, Z. A keystone transform without interpolation for SAR ground moving-target imaging. IEEE Trans. Geosci. Remote Sens. Lett. 2007, 4, 18–22. [Google Scholar] [CrossRef]
  56. Zhou, F.; Wu, R.; Xing, M.; Bao, Z. Approach for single channel SAR ground moving target imaging and motion parameter estimation. IET Radar Sonar Navig. 2007, 1, 59–66. [Google Scholar] [CrossRef]
  57. Li, D.; Zhan, M.; Liu, H.; Liao, G. A robust translational motion compensation method for ISAR imaging based on keystone transform and fractional Fourier transform under low SNR environment. IEEE Trans. Aerosp. Electron. Syst. 2017, 53, 2140–2156. [Google Scholar] [CrossRef]
  58. Xin, Z.; Liao, G.; Yang, Z.; Huang, P. A fast ground moving target focusing method based on first-order discrete polynomial-phase transform. Digit. Signal Process. 2017, 60, 287–295. [Google Scholar] [CrossRef]
  59. Richards, M. Fundamentals of Radar Signal Processing, 2nd ed.; McGraw-Hill Education: New York City, NY, USA, 2014. [Google Scholar]
  60. Cumming, I.; Wong, F. Digital Processing of Synthetic Aperture Radar Data: Algorithms and Implementation; Artech House: Norwood, MA, USA, 2005. [Google Scholar]
Figure 1. The geometric model of a multi-beam radar system.
Remotesensing 15 04429 g001
Figure 2. Schematic diagram of RM, DFM, and BM phenomenon: (a) schematic diagram of BM distribution in an angle-time domain; (b) schematic diagram of RM, DFM, and BM distribution in a range-azimuth domain.
Remotesensing 15 04429 g002
Figure 3. Schematic diagram of azimuth–Doppler-spectrum in several different situations: (a) Case 1; (b) Case 2; (c) Case 3.
Remotesensing 15 04429 g003
Figure 4. Simulated results of Example A: (a) the echoes of the target in different beams; (b) the result after MBPCF operation; (c) the trajectory of the target after pulse compression; (d) the range–Doppler map of the target; (e) the result after SOKT and MSWPD processing; (f) the result after focusing.
Remotesensing 15 04429 g004
Figure 5. The process diagram of multi-beam joint integration by SP.
Remotesensing 15 04429 g005
Figure 6. Flowchart of the proposed algorithm.
Remotesensing 15 04429 g006
Figure 7. Simulated results of Example B: (a) the trajectory of the target after pulse compressed; (b) the range-Doppler map of the target; (c) the trajectory after SOKT processing; (d) the range-Doppler map of the target after Doppler-spectrum compression operation; (e) the trajectory after Doppler-spectrum compression and SOKT processing.
Remotesensing 15 04429 g007
Figure 8. Simulation results: (a) the echoes of the target in different beams; (b) the result after MBPCF operation; (c) the trajectory of the target after the pulse compressed in beam 1; (d) the trajectory of the target after the pulse compressed in beam 2; (e) the trajectory of the target after the pulse compressed in beam 3; (f) the range-Doppler map of the target in beam 1; (g) the range-Doppler map of the target in beam 2; (h) the range-Doppler map of the target in beam 3; (i) the range-Doppler map after Doppler-spectrum compression in beam 1; (j) the range-Doppler map after Doppler-spectrum compression in beam 2; (k) the range-Doppler map after Doppler-spectrum compression in beam 3.
Remotesensing 15 04429 g008
Figure 9. Simulation results: (a) the trajectory after SOKT processing in beam 1; (b) the trajectory after SOKT processing in beam 2; (c) the trajectory after SOKT processing in beam 3; (d) the trajectory after Doppler-spectrum compression and SOKT processing in beam 1; (e) the trajectory after Doppler-spectrum compression and SOKT processing in beam 2; (f) the trajectory after Doppler-spectrum compression and SOKT processing in beam 3.
Remotesensing 15 04429 g009
Figure 10. Simulation results: (a) the entering time estimation of the target in beam 1; (b) the entering time estimation of the target in beam 2; (c) the entering time estimation of the target in beam 3; (d) estimation of pulse number for the target to cross beam1; (e) estimation of pulse number for the target to cross beam 2; (f) estimation of pulse number for the target to cross beam 3; (g) the result after MSWPD processing in beam 1; (h) the result after MSWPD processing in beam 2; (i) the result after MSWPD processing in beam 3; (j) coherent integration result of the target in beam 1; (k) coherent integration result of the target in beam 2; and (l) coherent integration result of the target in beam 3.
Remotesensing 15 04429 g010
Figure 11. Simulation results: (a) the estimation of range velocity; (b) the estimation of azimuth position; (c) the estimation of the range position; (d) coherent integration result of target in beam 1 after SP; (e) coherent integration result of target in beam 2 after SP; (f) coherent integration result of target in beam 3 after SP; (g) multi-beam joint integration processing 3D result; (h) multi-beam joint integration processing 2D result.
Remotesensing 15 04429 g011
Figure 12. Multi-objective simulation results: (a) the trajectory of two targets after pulse compressed in beam 1; (b) the trajectory of two targets after pulse compressed in beam 2; (c) the trajectory of two targets after pulse compressed in beam 3; (d) the 2D result after MBPCF, SOKT, and MSWPD processing in beam 1; (e) the 2D result after MBPCF, SOKT, and MSWPD processing in beam 2; (f) the 2D result after MBPCF, SOKT, and MSWPD processing in beam 3; (g) the 3D result after MBPCF, SOKT, and MSWPD processing in beam 1; (h) the 3D result after MBPCF, SOKT, and MSWPD processing in beam 2; (i) the 3D result after MBPCF, SOKT, and MSWPD processing in beam 3.
Remotesensing 15 04429 g012
Figure 13. Multi-objective simulation results: (a) coherent integration result of Target 1 in beam 1 after SP; (b) coherent integration result of Target 1 in beam 2 after SP; (c) coherent integration result of Target 1 in beam 3 after SP; (d) coherent integration result of Target 2 in beam 1 after SP; (e) coherent integration result of Target 2 in beam 2 after SP; (f) coherent integration result of Target 2 in beam 3 after SP; (g) multi-beam joint-integration processing of 2D result of Target 1; (h) multi-beam joint integration processing of 2D result of Target 2.
Remotesensing 15 04429 g013
Figure 14. The comparison between single-beam and multi-beam joint-focusing results: (a) single-beam processing 3D result; (b) single-beam processing 2D result; (c) multi-beam processing 3D result; (d) multi-beam processing 2D result.
Remotesensing 15 04429 g014
Figure 15. The results of different methods: (a) the result of the ACCF method and (b) the result of the MTD method.
Remotesensing 15 04429 g015
Figure 16. Detection probability curves.
Remotesensing 15 04429 g016
Figure 17. Results of synthesized data: (a) the trajectory of the target after the pulse is compressed in beam 1; (b) the trajectory of the target after the pulse is compressed in beam 2; (c) the trajectory of the target after the pulse is compressed in beam 3; (d) the entering time estimation of the target in beam 1; (e) the entering time estimation of the target in beam 2; (f) the entering time estimation of the target in beam 3; (g) estimation of the pulse number for the target to cross beam 1; (h) estimation of the pulse number for target to cross beam 2; (i) estimation of the pulse number for target to cross beam 3; (j) multi-beam joint-integration processing 3D result; (k) multi-beam joint-integration processing 2D result.
Remotesensing 15 04429 g017
Table 1. The comparison of the computational complexity of different methods.
MethodsComputational Complexity
The proposed method O { N b [ N r N a log 2 N a + C t i n C T ( N r N a log 2 N a + N r N a log 2 N r ) ] + C x C y C v ( N r N a log 2 N a ) }
ACCF O { N b [ N r N a log 2 N a + C t i n C T ( N r N a log 2 N a + N r N a log 2 N r ) ] + C x C y C v ( N r N a log 2 N a ) }
MTD O { N b [ N r N a log 2 N a + C t i n C T ( N r N a log 2 N r ) ] + C x C y C v ( N r N a log 2 N a ) }
Table 2. Various parameters of a radar system.
Parameter NameParameter Value
Carrier Frequency 2   GHz
Range Bandwidth 30   MHz
Average Power 3500   W
System Loss 6.8   dB
Noise Temperature 290   K
Noise Coefficient 2.5   dB
Pulse Repetition Frequency 1000   Hz
Half-Power Beam-Width 0.004   rad
Gap-Width of Beam 0.004   rad
Azimuth Angle of Antenna 90 °
Pitch Angle of Antenna 35 °
Total Integration Time 2.35   s
Table 3. Various motion parameters of a radar platform.
Parameter NameParameter Value
Radar Platform Speed 7617   m / s
Radar Platform Height 500   km
The Number of Beams 3
Table 4. Various motion parameters of a moving target.
Parameter NameParameter Value
Range Velocity 260   m / s
Azimuth velocity 190   m / s
Range Position 714.1   km
Azimuth Position 0   m
Time of Entering First Beam 0.5   s
Time of Leaving Last Beam 2.85   s
Table 5. Various motion parameters of two moving targets.
Range VelocityAzimuth Velocity
Target 1 260   m / s 190   m / s
Target 2 170   m / s 250   m / s
Table 6. The basic parameters of the C-band radar.
Parameter NameParameter Value
Carrier Frequency 5.3   GHz
Range Bandwidth 30.116   MHz
Pulse Repetition Frequency 1256.98   Hz
Disclaimer/Publisher’s Note: The statements, opinions and data contained in all publications are solely those of the individual author(s) and contributor(s) and not of MDPI and/or the editor(s). MDPI and/or the editor(s) disclaim responsibility for any injury to people or property resulting from any ideas, methods, instructions or products referred to in the content.