Article

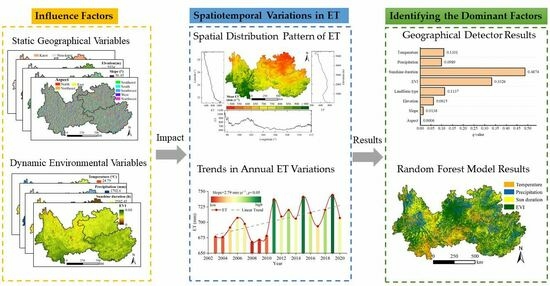
Spatiotemporal Variations in Evapotranspiration and Their Driving Factors in Southwest China between 2003 and 2020

1
School of Geography and Environmental Sciences, Guizhou Normal University, Guiyang 550025, China
2
China Meteorological Administration Economic Transformation of Climate Resources Key Laboratory, Chongqing Institute of Meteorological Sciences, Chongqing 401147, China
3
College of Water Sciences, Beijing Normal University, Beijing 100875, China
*
Author to whom correspondence should be addressed.
Remote Sens. 2023, 15(18), 4418; https://doi.org/10.3390/rs15184418
Submission received: 26 June 2023 / Revised: 2 August 2023 / Accepted: 5 September 2023 / Published: 8 September 2023

Abstract

:
The widespread distribution of karst landforms has led to a shortage of water resources in Southwest China. Understanding the spatiotemporal variations in and driving factors of evapotranspiration (ET) in this area is crucial for understanding and predicting severe water resource shortage. This study conducted trend analysis using meteorological data from 2003 to 2020 as well as remote sensing products such as Penman–Monteith–Leuning equation version 2 (PML-V2) ET. The factors influencing the spatial distribution pattern of average ET were identified using a geographical detector. Partial correlation analysis was performed to characterize the relationships between ET and the factors governing its variations, determined using the random forest model. The results demonstrated the following: (1) The average ET decreased with increasing latitude and altitude, primarily affected by the landform type in terms of longitude and displaying “W”-shaped fluctuations. Overall, the annual ET exhibited a significant (p < 0.05) increasing trend, with 72.63% of its area under the increasing trend. (2) The results of the geographic detector indicated sunshine duration as the strongest explanatory factor of the spatial distribution of ET, followed by enhanced vegetation index (EVI), landform type, precipitation, elevation, slope, and aspect. Instead of an individual factor, the interplay between multiple factors more considerably influenced the spatial distribution pattern of ET. (3) The EVI exhibited an overall increasing trend, with a significant increase over 73.59% of the study area and a positive correlation with ET. Thus, the increase in EVI had the strongest impact on ET in the study area, which was further confirmed by the results of the random forest model for 42.92% of the study area. Thus, the present findings clarify the spatiotemporal variations in and driving factors of ET in Southwest China and can serve as a benchmark for policies aiming to develop and manage water resources in this region.

Graphical Abstract

1. Introduction

Land evapotranspiration (ET) is a vital process involved in biogeochemical cycles and serves as a nexus of the water, energy, and carbon cycles affecting the climate system. Globally, land ET returns ~60% of the annual land precipitation to the atmosphere [1]. Thus, variations in ET can impact precipitation and the dynamic water resources available to inland water bodies such as lakes and rivers [2,3]. Additionally, it can cause fluctuations in the availability of surface water in terrestrial regions [4,5]. Therefore, understanding the spatiotemporal variations, mechanisms, and interactions of historical ET is crucial for solving a wide range of problems related to hydrology, geographical ecology, and water resource management, especially in water-scarce regions such as arid and semiarid regions with low precipitation [6], and karst areas with abundant precipitation but characterized by geological peculiarities that cause water scarcity [7].
Recently, extensive research has been conducted on the variations in ET and its driving forces. Existing research indicates a global upward trend in terrestrial ET [8,9,10,11], primarily caused by vegetation greening [10] and climate change [8]. Furthermore, ET varies across multiple climatic regions owing to climate change [12]. The trend of ET in typical semiarid regions exhibited a diminishing trend from 1984 to 2013, which was primarily attributed to a considerable decline in relative air humidity [6]. Prior research conducted on 110 humid watersheds in China from 1982 to 2016 revealed an increasing trend in ET in the majority of these watersheds, primarily influenced by temperature variations [13]. In regions with typical underlying surface characteristics, such as the climate-sensitive Qinghai–Tibet Plateau, the fundamental factors influencing the increasing trend in ET were global warming and increasing precipitation over the past 30 years [14,15]. On the Loess Plateau with extensive vegetation restoration, vegetation greening is the primary driver of rises in ET relative to climate change [16,17]. Thus, the driving factors governing the spatiotemporal variations in ET vary across regions with distinct climate zones and varying underlying surface characteristics. Nonetheless, the factors affecting ET can be classified into two categories: climate conditions (e.g., water and energy supply) and land surface characteristics (e.g., terrain, landform, and vegetation) [7,18,19].
To date, several scholars have conducted research to determine the variations in ET and its driving factors across various climatic regions as well as areas with typical natural geographical features. Consequently, a wealth of knowledge related to this has been accumulated. However, Southwest China covers a widespread distribution of thin soil layers with a strong permeability of bedrock in its karst topography. Although the karst region spans over a humid area, it is deficient in water resources [20,21]. Moreover, the majority of research in this area focuses on potential ET [22,23], and only a few studies focus on actual ET in this region. According to the limited research on actual ET, it has been found that in Southwest China, the overall ET generally increases as the latitude decreases, with the cloud cover percentage acting as the most important factor [24]. In particular, karst landforms are widely distributed throughout Southwest China, and their proportion has a significant influence on ET in the basin, making them the most influencing factor affecting the elasticity of actual ET in that region [7]. A recent case study on the karst basins in Southwest China reported that ET increased substantially after vegetation restoration [25]. Although these studies provide a basic understanding of the variations in and factors of ET in Southwest China, further research is required to optimize the water resource management in this region. Therefore, it is still worthwhile to answer the question of what the latest spatiotemporal variations in ET are in Southwest China, and what are the dominant factors influencing the spatial distribution pattern of and temporal variations in ET.
The key to correctly answering the above questions lies in selecting appropriate methods to identify the dominant factors that determine the spatial distribution of and temporal variation in ET. This study utilized the Geographic Detector to assess the impact of different environmental factors on the spatial distribution pattern of ET. The Geographic Detector had been widely employed in detecting the spatial heterogeneity of ET and similar research elements (e.g., soil moisture) [26,27]. The principle of this method is straightforward: it determines whether the independent variable has an influence on the dependent variable and the magnitude of the impact by detecting whether the spatial distribution of the dependent variable and the independent variable is consistent [28]. The identification of driving factors behind the dynamic variations in ET has received much attention, leading to the development of various methods. Although some studies have used partial correlation and multiple linear regression analysis to quantify the driving factors of ET, there are commonly issues of multicollinearity among these factors, and the relationship between the factors and ET may not be linear [25,29]. Therefore, these methods are not perfect. With the advancement of artificial intelligence technology, machine learning algorithms have been increasingly employed to explore complex nonlinear relationships in Earth science. Recently, random forest regression analysis has made valuable contributions in identifying the complex relationship between ET variations and driving factors, showing promising application prospects [30]. However, random forest is not easily interpretable as it functions like a black box with limited control. To provide comprehensive visibility of ET variations and the driving factors, we complementarily used partial correlation analysis to explain the relationships between ET and the various driving factors.
Therefore, this study aims to: (1) investigate the spatial distribution pattern of ET in Southwest China from 2003 to 2020 and the factors influencing this distribution pattern, and (2) analyze the trends in ET variations and identify the main driving factors behind ET variations. In order to answer these two questions, we first analyze the spatial distribution pattern of multi-year average ET in three dimensions: longitude, latitude, and altitude. Based on the geographic detector, the main controlling factors of the spatial heterogeneity of multi-year mean ET were quantified. Secondly, we use trend analysis and partial correlation analysis to analyze the dynamic variations in ET and their driving factors and the relationship between them. Finally, based on random forest regression analysis, the dominant factors leading to the dynamic variations in ET in Southwest China are further determined.

2. Materials and Methods
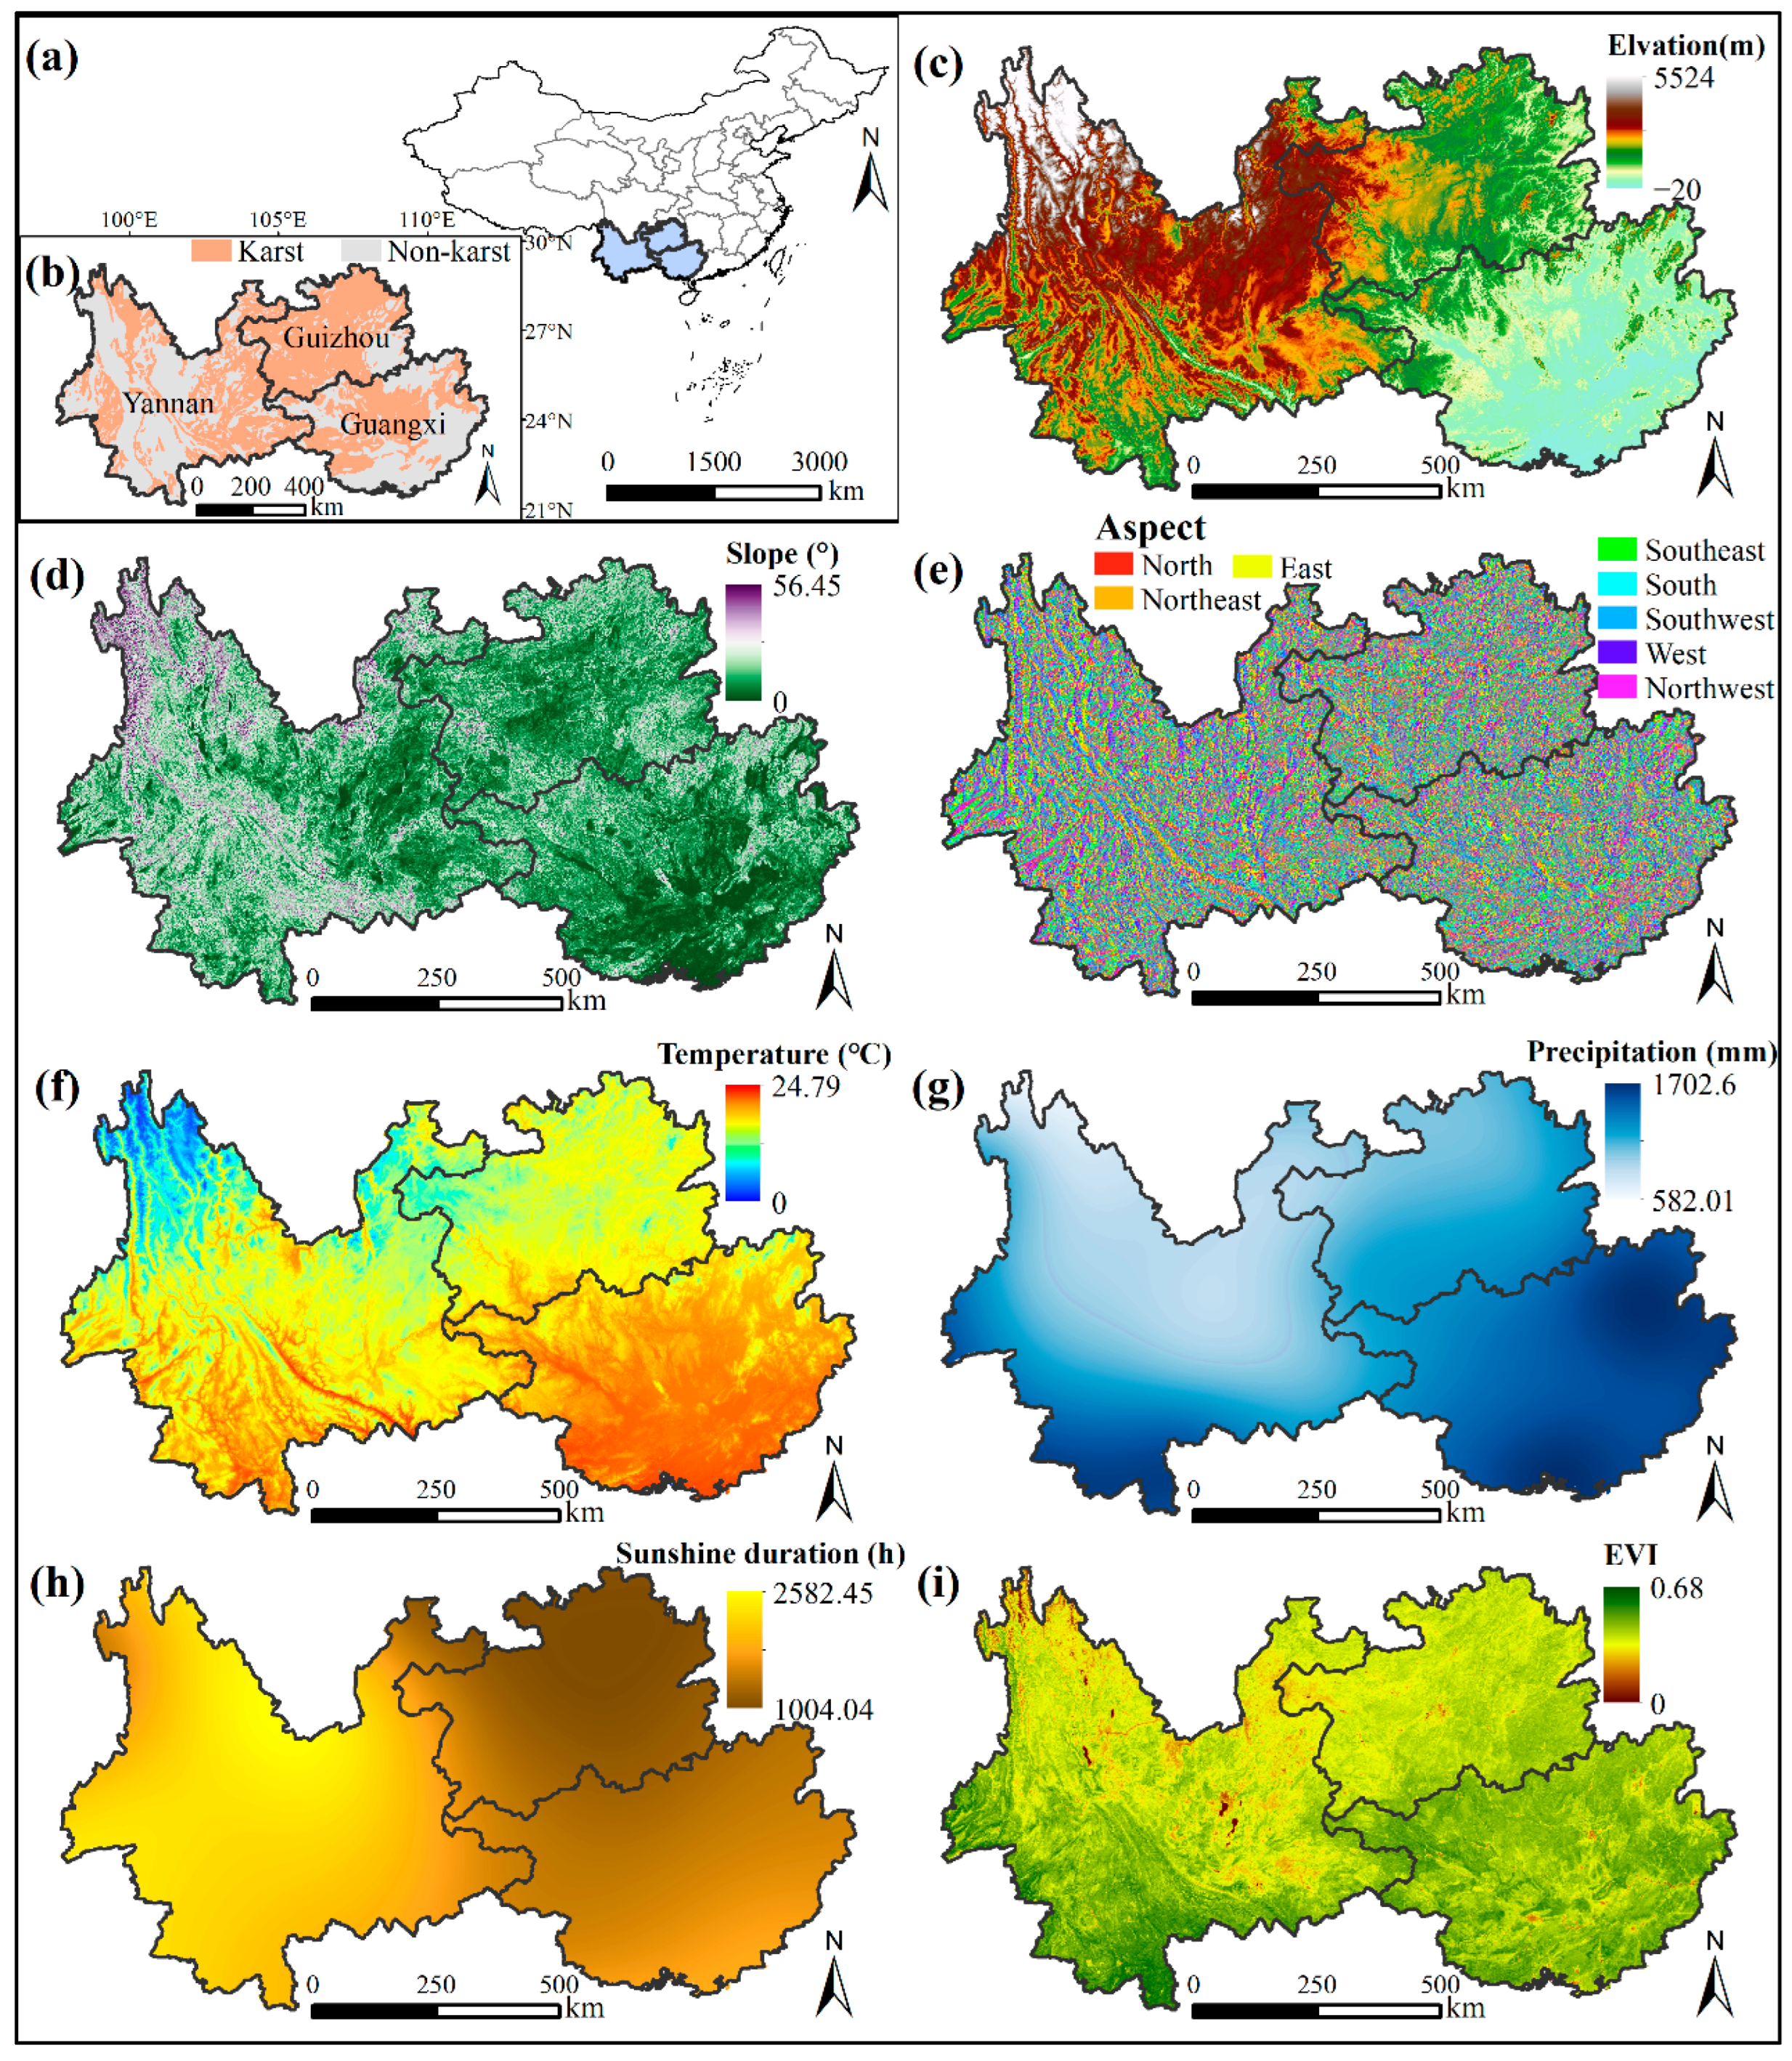
2.1. Study Area

This study focused on the region of Southwest China, including the provinces of Yunnan, Guizhou, and Guangxi (Figure 1a). The total area of the study region is ~796,773 km2, among which 35% is covered by karst landforms—a mixture of pure and impure carbonate rock formations (Figure 1b). Notably, this is one of the largest contiguous karst areas in the world. Owing to early intensive human activity, the eco-sensitive karst landforms have been subjected to ecological degradation. However, considerable efforts have been made through ecological engineering to mitigate this degradation, eventually affording progressive improvements in local environmental conditions [31,32]. The average elevation of the study area is 1276 m, which tends to increase in the northwest and decrease over the southeast region. Specifically, Yunnan and Guizhou constitute the major regions of the Yunnan–Guizhou Plateau, and Guangxi is a hilly area of relatively low elevation (Figure 1c). Owing to the complex terrain, the slope and aspect of this region exhibit high spatial heterogeneity (Figure 1d,e). The study area is dominated by a monsoon climate with adequate precipitation and temperature. The annual average temperature and total annual precipitation are 17.6 °C and 1021 mm, respectively (Figure 1f,g). However, this region receives less sunlight, with the lowest sunshine duration in China, i.e., the annual sunshine duration is only 1713 h (Figure 1h). Consequently, vegetation growth is affected by climatic elements such as light, temperature, and water, displaying a high spatial density of vegetation in the south and sparse vegetation cover in the north (Figure 1i). Although the study area receives abundant rainfall, it experiences limited vegetation growth with deficient water resources available for human production and domestic usage owing to climate change and geological factors. Thus, it has been identified as one of the areas that is most vulnerable to drought and water shortage in China.

2.2. Data Acquisition and Processing

2.2.1. PML-V2 ET Data Product

This study used an ET data product based on the Penman–Monteith–Leuning equation version 2 (PML-V2), with 8-day and 500 m resolutions [33]. Developed on the PML model [34], the PML-V2 model simulates the coupled vegetation transpiration and gross primary production processes according to the stomatal conductance theory, which improves the accuracy of estimating ET [35]. The product has undergone extensive validation in terms of flux towers and water balance [36], and several studies have applied this product in multiple regions, establishing its reliability [15,37]. Herein, the 8-day-interval ET data were converted into an annual time scale using the Google Earth engine to obtain the PML-V2 ET annual product for Southwest China from 2003 to 2020 (https://developers.google.cn/earth-engine/datasets/catalog/CAS_IGSNRR_PML_V2_v017 accessed on 4 September 2023).

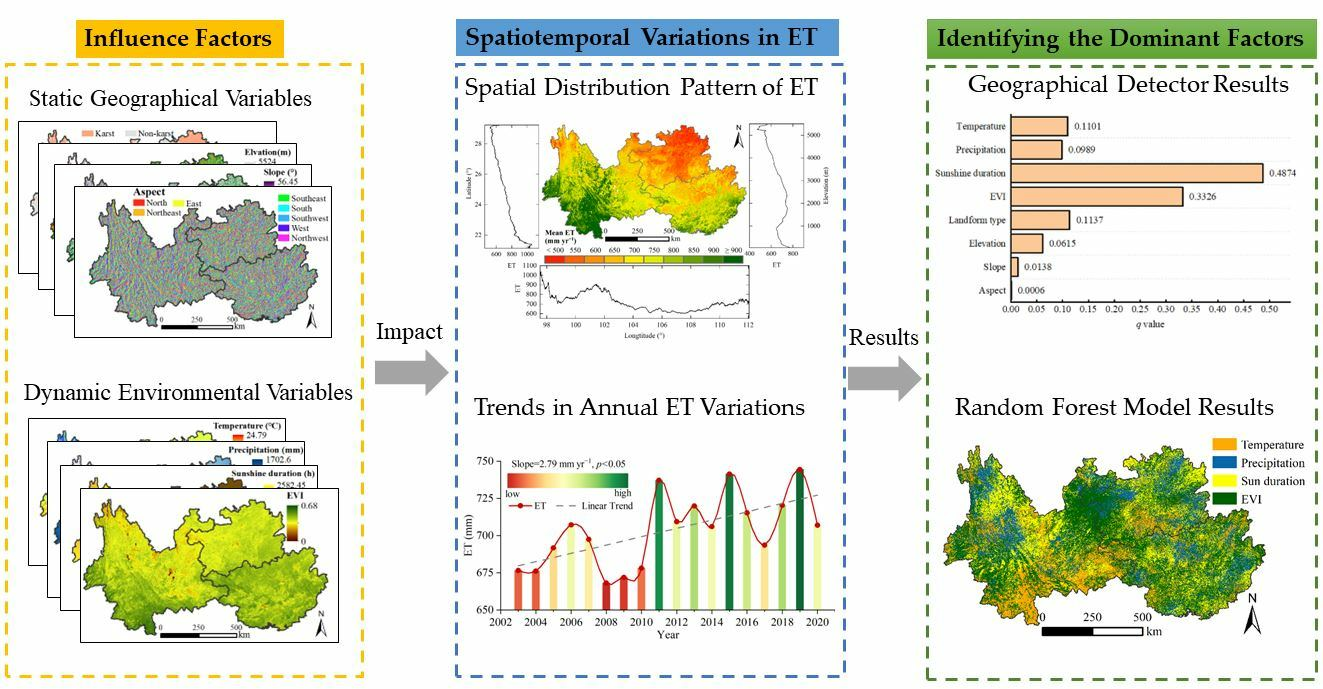
2.2.2. Static Geographical Variables

Based on the characteristics of the factors affecting the spatial distribution patterns of ET, they can be classified into static geographical variables and dynamic environmental variables. Static geographical variables refer to variables with a fixed value at a specific time and location. Notably, the values of these variables do not exhibit considerable temporal fluctuations and primarily vary with spatial location. Considering the widespread distribution of karst landforms and the complex mountain topography in Southwest China, we selected four static geographical variables: landform, altitude, slope, and aspect (Figure 1b–e). The landform data were obtained from the Chinese Academy of Geological Sciences (https://geocloud.cgs.gov.cn/ accessed on 4 September 2023). The elevation data were sourced from the United States Geological Survey (USGS) Shuttle Radar Topography Mission Version 3.0 digital elevation model (SRTM3 DEM) product (https://earthexplorer.usgs.gov/ accessed on 4 September 2023). The slope and aspect data were calculated using the DEM data extracted using the “slope” and “aspect” tools in the ArcGIS 10.8 software.

2.2.3. Dynamic Environmental Variables

Dynamic environmental variables are environmental variables undergoing temporal variations and affecting the interannual fluctuations in ET. Based on the characteristics of climate change and vegetation restoration in the study area, we selected four representative dynamic environmental variables: annual average temperature, annual total precipitation, annual total sunshine duration, and annual average EVI (Figure 1f–i). The meteorological data were acquired from 280 stations located in Southwest China and its surrounding regions, as accessed from the China Meteorological Data Service Centre (http://www.data.cma.cn accessed on 4 September 2023). The station data for precipitation and sunshine duration were interpolated in space using the thin-plate spline method implemented in ANUSPLIN 4.2 software, considering longitude and latitude as independent variables [38]. As temperature and altitude are highly correlated, DEM was considered a covariate to interpolate temperature using the same method.
The EVI data were extracted from the MOD13A1 and MYD13A1 products (https://lpdaac.usgs.gov accessed on 4 September 2023), generated based on the L1-level data from Terra and Aqua satellites. These two products offer the same temporal and spatial resolutions, i.e., 16-day and 500 m, respectively. To eliminate cloud contamination and obtain high-quality EVI data, the cloud-contaminated pixels in MOD13A1 and MYD13A1 were filled in with high-quality pixels from each other. Furthermore, the maximum value synthesis method was employed to generate monthly EVI data with less cloud contamination. The remaining cloud-contaminated pixels that could not be eliminated were reconstructed following the HANTS method [39] and merged with quality control files to obtain higher-quality monthly EVI data without cloud contamination. Finally, the EVI for each month was averaged to obtain the annual data.

2.3. Data Analysis Methods

2.3.1. Trend Analysis

The trend of temporal variations in ET and its driving factors was estimated using the Theil–Sen estimator, and a significance test of the trend was conducted using the Mann–Kendall (MK) non-parametric test. In principle, the Theil–Sen estimator is a slope estimator based on a non-parametric median. In comparison, the MK non-parametric test is less sensitive to missing data, irregular data distribution, and outliers, providing a solid foundation of statistical theory for testing the significance level. Previous studies have widely combined these two methods for estimating the trend of temporal variations in ET, its associated factors, and their significance tests [40,41,42].
S e n = M e d i a n x j x i j i ,   2003 i < j 2020
In the above equation, Sen indicates the slope and xi and xj denote the data values at instant i and j, respectively.
The Z-statistic for the MK test was determined as follows:
Z = s 1 n ( n + 1 ) ( 2 n + 5 ) / 18   for   s > 0   0                 for   s = 0 s + 1 n ( n + 1 ) ( 2 n + 5 ) / 18   for   s < 0
where
S = i = 1 n 1 j = i + 1 n sgn x i x j
sgn x i x j = 1 , i f x i x j > 0   0 , i f x i x j = 0   1 , i f x i x j < 0  
The Z-statistic represents the standard normal distribution, where |Z| > 1.96 indicates significance at the 95% confidence level. Finally, the two results of Sen and Z were compiled in ArcGIS 10.8 software. As such, the combined results can be classified into four classes: significant decreasing (Sen < 0, |Z| > 1.96), nonsignificant decreasing (Sen < 0, |Z| ≤ 1.96), nonsignificant increasing (Sen ≥ 0, |Z| ≤ 1.96), and significant increasing (Sen ≥ 0, |Z| > 1.96).

2.3.2. Geographical Detector

Spatial heterogeneity is a fundamental characteristic of geographic phenomena. The geographic detector model is a set of statistical methods that detects spatial stratified heterogeneity and reveals its key factors [28]. In principle, we assumed that if an independent variable (among those depicted in Figure 1b–i) exerts a considerable effect on the dependent variable (ET), then the spatial distribution of the independent and dependent variables should be similar. Therefore, to detect the spatial heterogeneity in ET and its driving factors, the geographic detector “GD” package developed by Song [43] was applied in R. Specifically, the geographical detector comprises four detectors for risk, factors, ecological balance, and interaction. Herein, we selected the factor and interaction detectors.
The factor detector characterized the relative significance of these factors toward the spatial distribution of ET based on q values, q ∈ [0, 1]. Specifically, a high value of q indicates a stronger influence of an independent variable on a dependent variable (ET) and yields a spatial distribution with higher homogeneity. q can be evaluated as follows:
q = 1 h = 1 L N h σ h 2 / N σ 2
where h = 1, …, L is a stratification of dependent or independent variables; Nh and N denote the numbers of units in layer h and the study area, respectively; and σh2 and σ2 represent the variances in layer h and the study area, respectively.
The interaction detector identified the influence of interaction between multiple factors, i.e., whether two factors can strengthen or weaken the explanatory power for ET or whether the influences of these two factors on ET are independent of each other.

2.3.3. Partial Correlation Analysis

The relationships between the variables in multivariate correlation analysis may not be accurately characterized with simple correlation coefficients because of the complex relationships between the variables and the influence of multiple variables [44]. Therefore, partial correlation coefficients were computed between ET and each dynamic environmental variable to measure the spatiotemporal magnitude and direction of the linear relationship with ET while controlling the influence of the remaining three variables [25,45]. The partial correlation coefficient was calculated as follows:
R x y , z = R x y R x z R y z 1 R x z 2 1 R y z 2
where x, y, and z denote three distinct variables; Rxy,z denotes the partial correlation between the factors x and y while controlling the influence of factor z; Rxy represents the linear correlation coefficient between factors x and y; and Rxz and Ryz represent equivalent meanings. A significance level of p < 0.05 was constructed. The partial correlation coefficient R and p-value of significance were reclassified into four categories: significant negative correlation (R < 0, p < 0.05), nonsignificant negative correlation (R < 0, p ≥ 0.05), nonsignificant positive correlation (R ≥ 0, p ≥ 0.05), and significant positive correlation (R ≥ 0, p < 0.05).

2.3.4. Random Forest Model

The random forest model is a powerful non-parametric machine learning algorithm proposed by Breiman in 2001, and can be used for classification and regression. The model exhibits a simple and easy-to-explain structure, and its high stability prevents overfitting [30]. The random forest model can evaluate the significance of each independent variable because it is not concerned with multicollinearity and can quantitatively analyze the contribution of each independent variable to the dependent variable [46,47]. Therefore, it has been widely employed in interdisciplinary research related to ecology and remote sensing [48,49].
Herein, we used the “randomForest” package in R language to conduct a random forest regression analysis on ET with four dynamic environmental variables—temperature, precipitation, sunshine duration, and EVI as the independent variables. Accordingly, the percentage increase in the mean-squared error (%IncMSE) was computed to quantify the relative significance of the independent variables. In the random forest model, %IncMSE is defined as the reduction in model accuracy in cases of excluding a variable. Therefore, a higher value of %IncMSE implies the significance of a given independent variable.

3. Results

3.1. Temporal and Spatial Distribution of ET

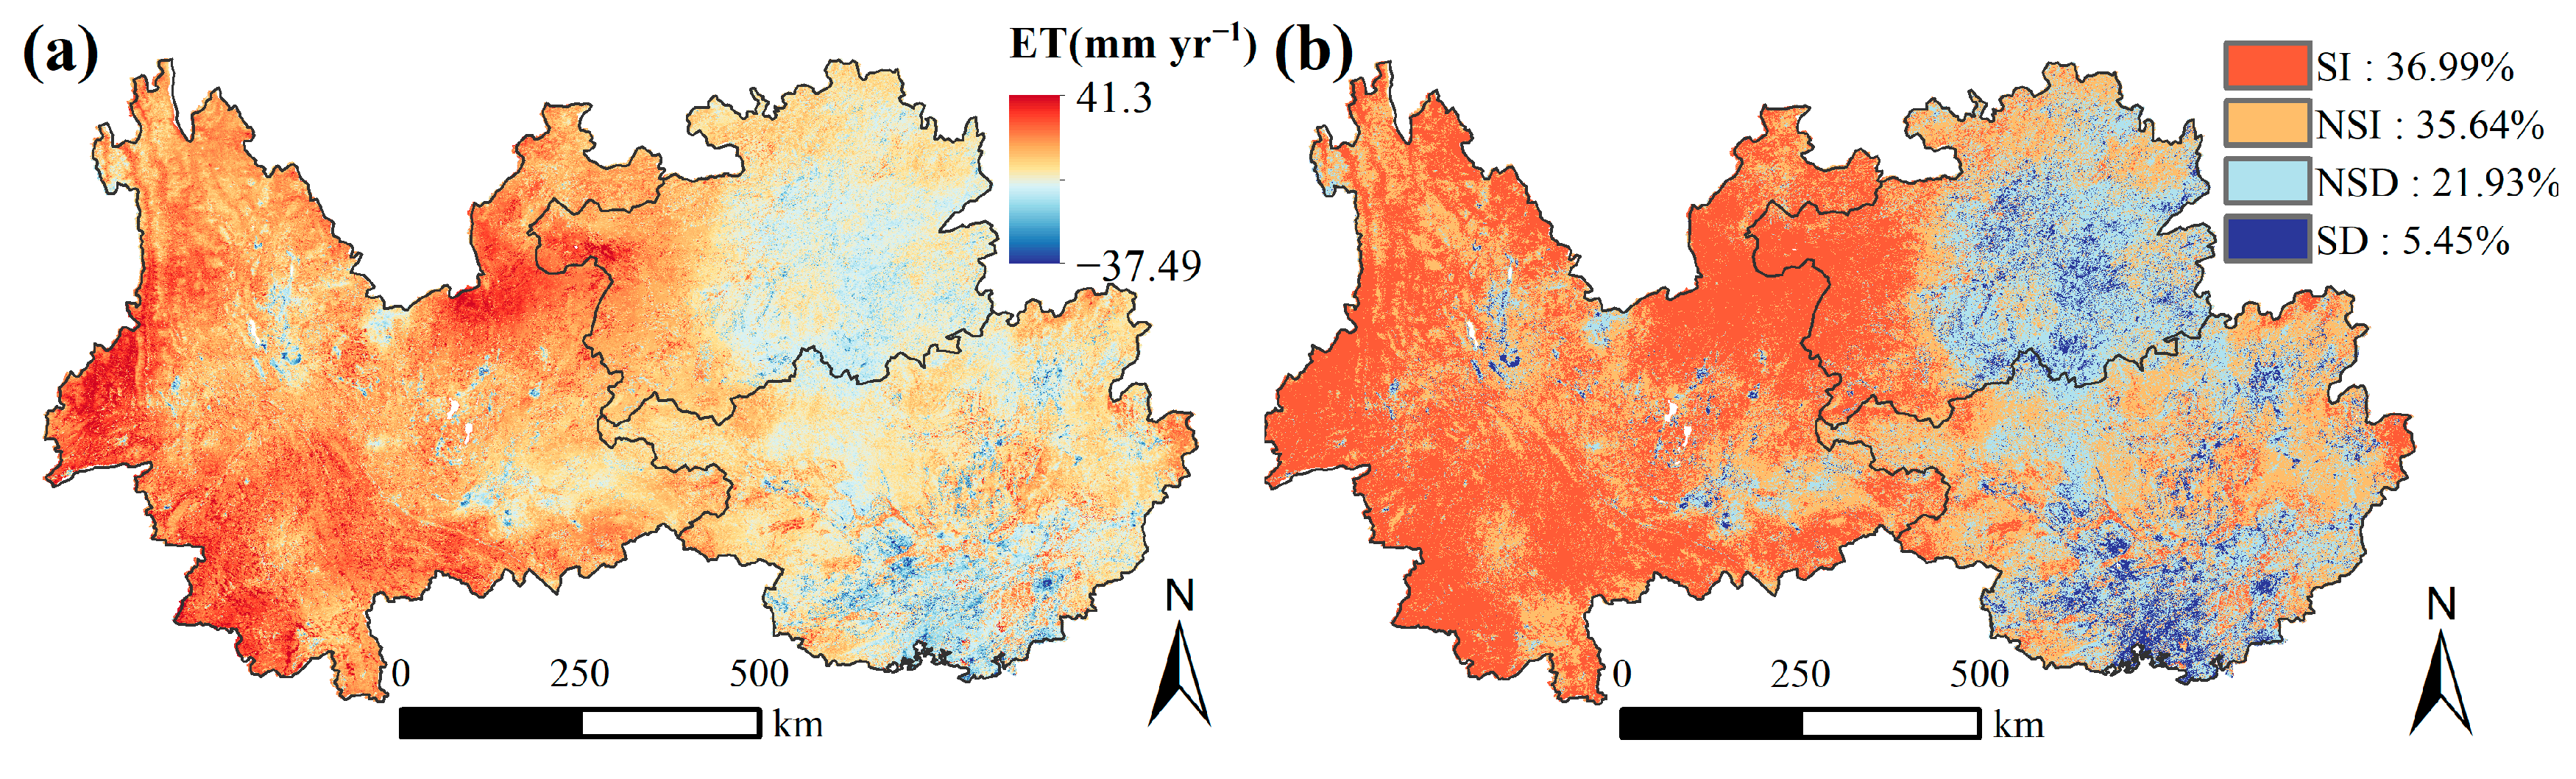
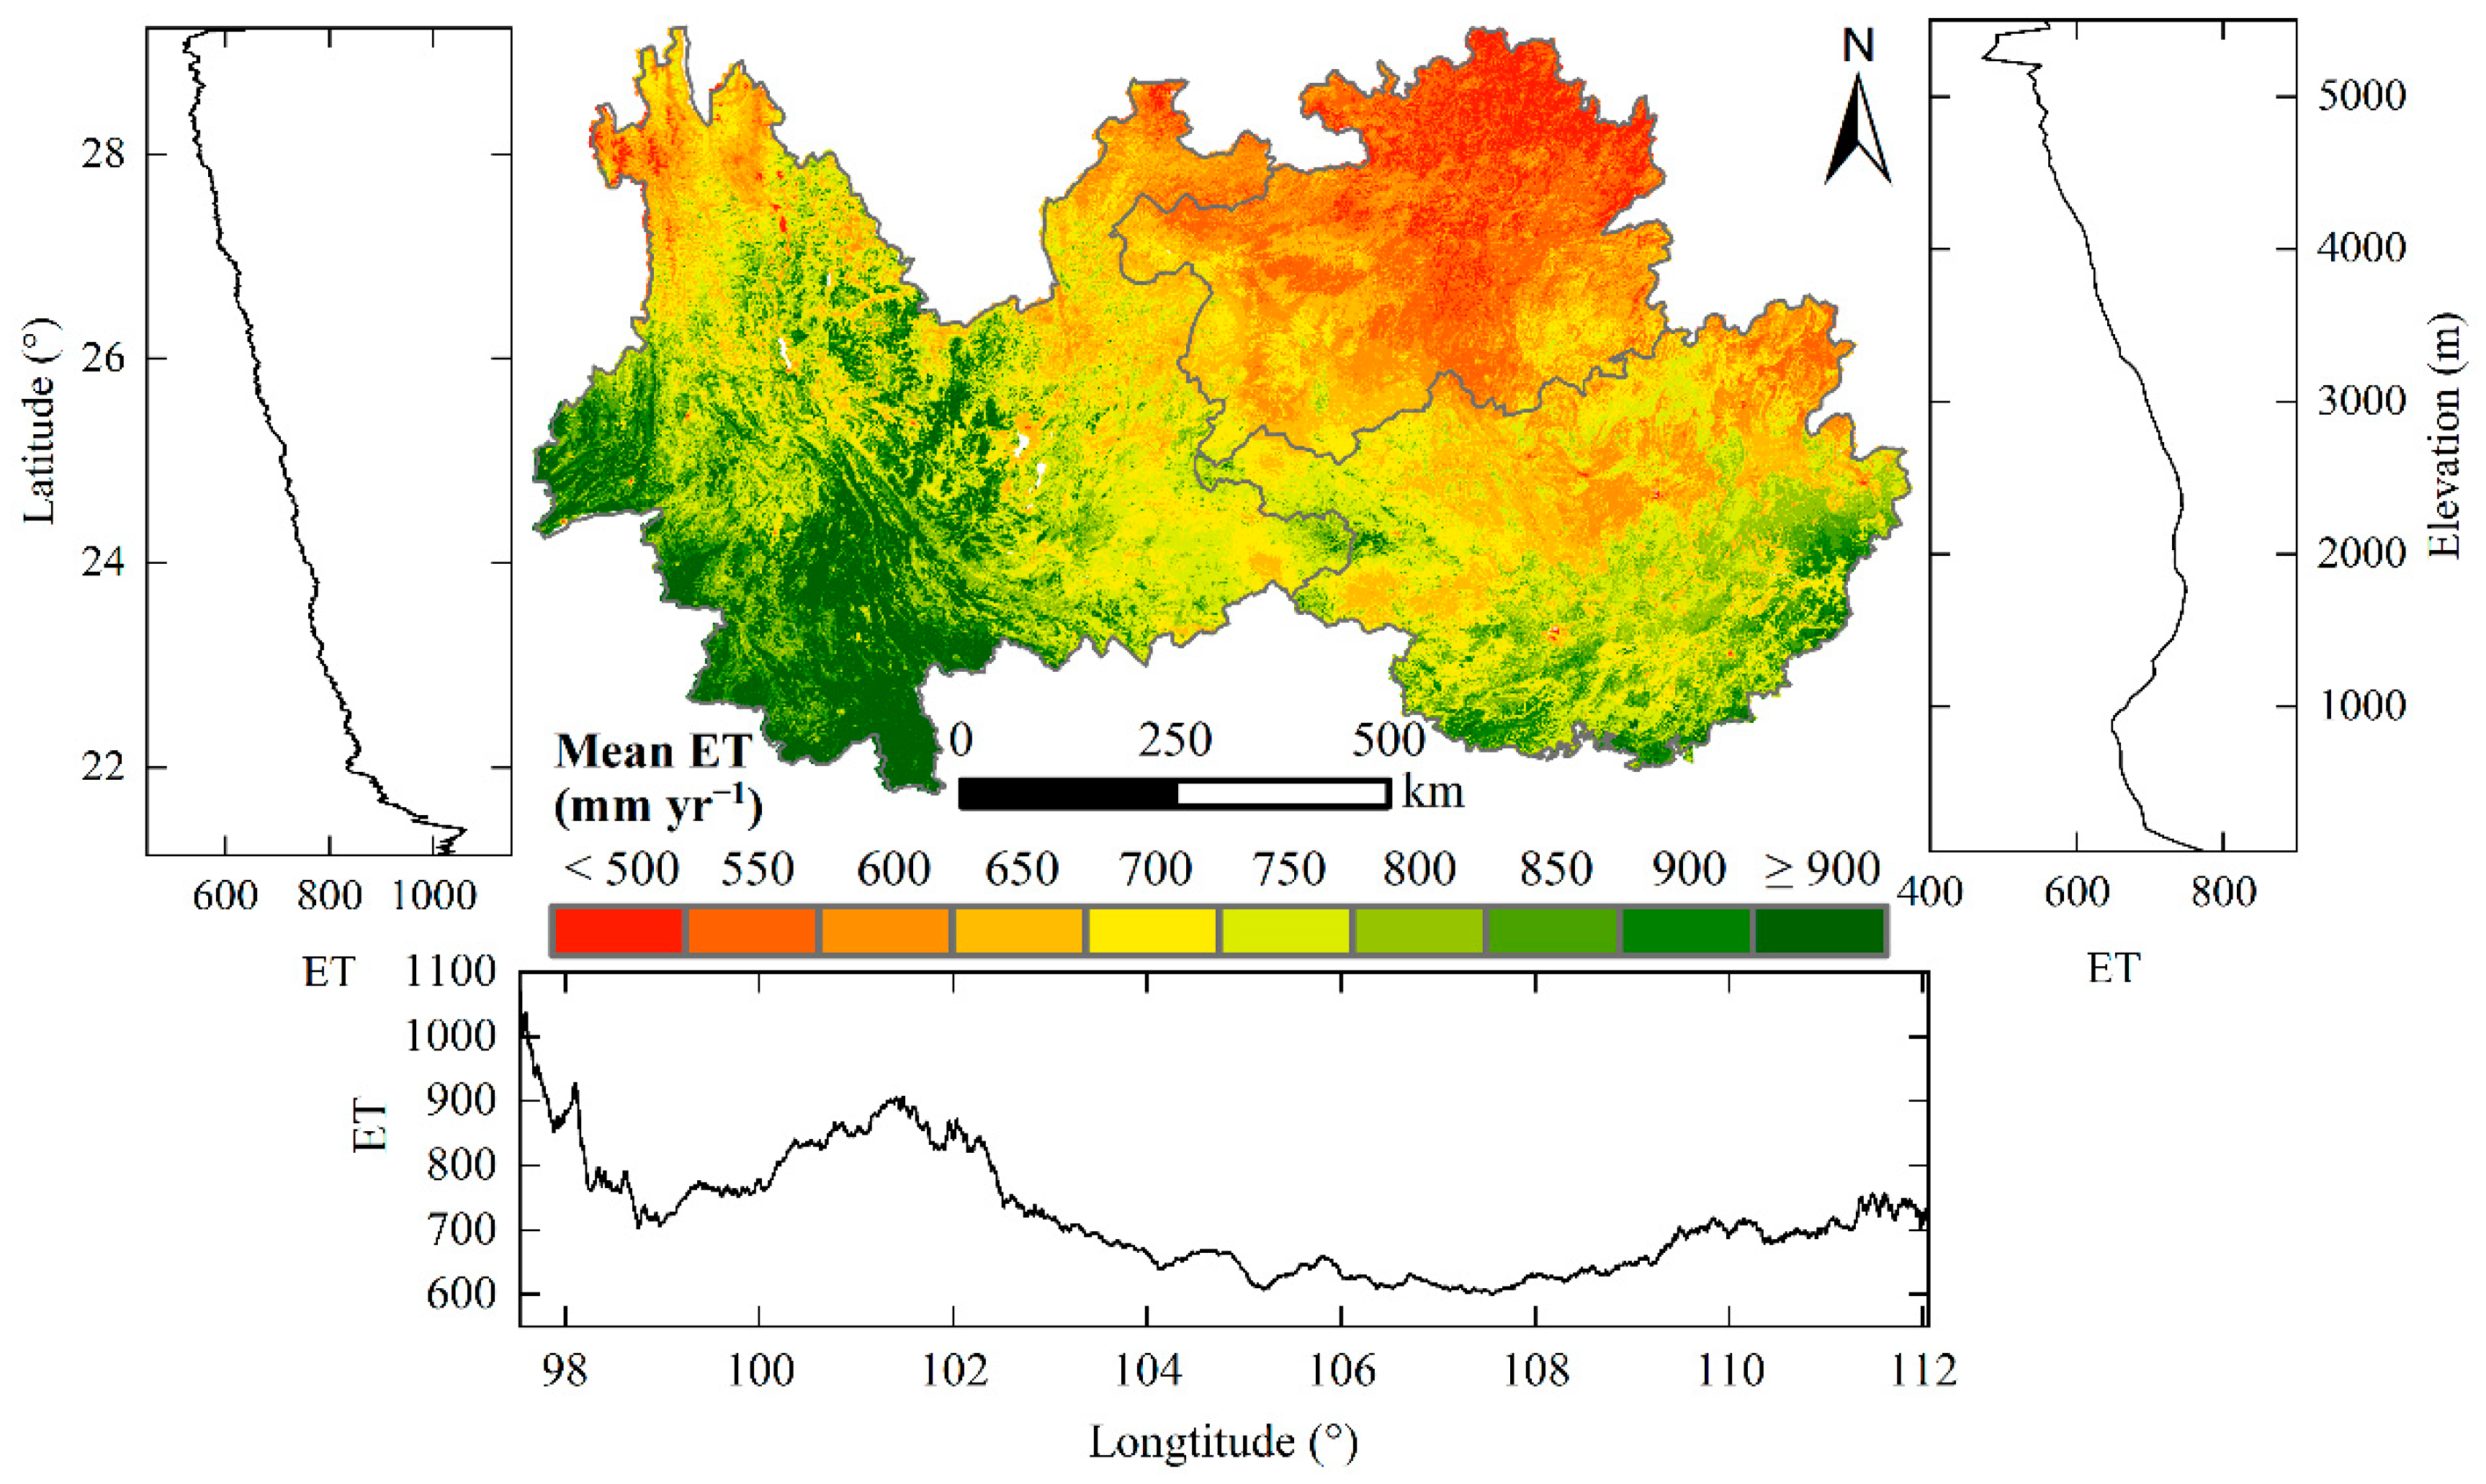
3.1.1. Spatial Distribution Pattern of ET

The multi-year mean ET in Southwest China exhibited significant spatial heterogeneity from 2003 to 2020 (Figure 2). Throughout the research period, the average ET in the study area amounted to 703.48 mm. Areas with ET values exceeding 800 mm constituted 45.17% of the total area, primarily located in southern Yunnan and Guangxi. Conversely, regions with ET values below 600 mm accounted for 22% of the total area, mainly distributed in Guizhou.
To analyze the spatial distribution patterns of ET, we considered three geospatial dimensions: longitude, latitude, and elevation. The spatial patterns revealed a prevalence of high ET values in the southern regions and lower values in the northern areas. Furthermore, ET displayed an overall increase with decreasing latitude, as illustrated in the statistical plots on the left panel of Figure 2. The spatial distribution of ET exhibited W-shaped fluctuations with increasing longitude, as depicted in the bottom panel of Figure 2. Upon comparing the landform types of the study area (Figure 1b) with the spatial distribution of ET, it becomes evident that the landform types have a considerable influence. Notably, the longitude corresponding to the ET low valley is characterized by abundant karst landforms. This observation is supported by statistical analysis, which demonstrates that ET in non-karst landforms is considerably higher than that in karst landforms, with respective values of 751.13 mm and 661.32 mm. Additionally, elevation plays a crucial role in shaping the spatial distribution of temperature, precipitation, and EVI (Figure 1c,f,g,i), impacting the distribution of ET. This relationship causes a decline in ET with increasing altitude, as illustrated in the right panel of Figure 2.

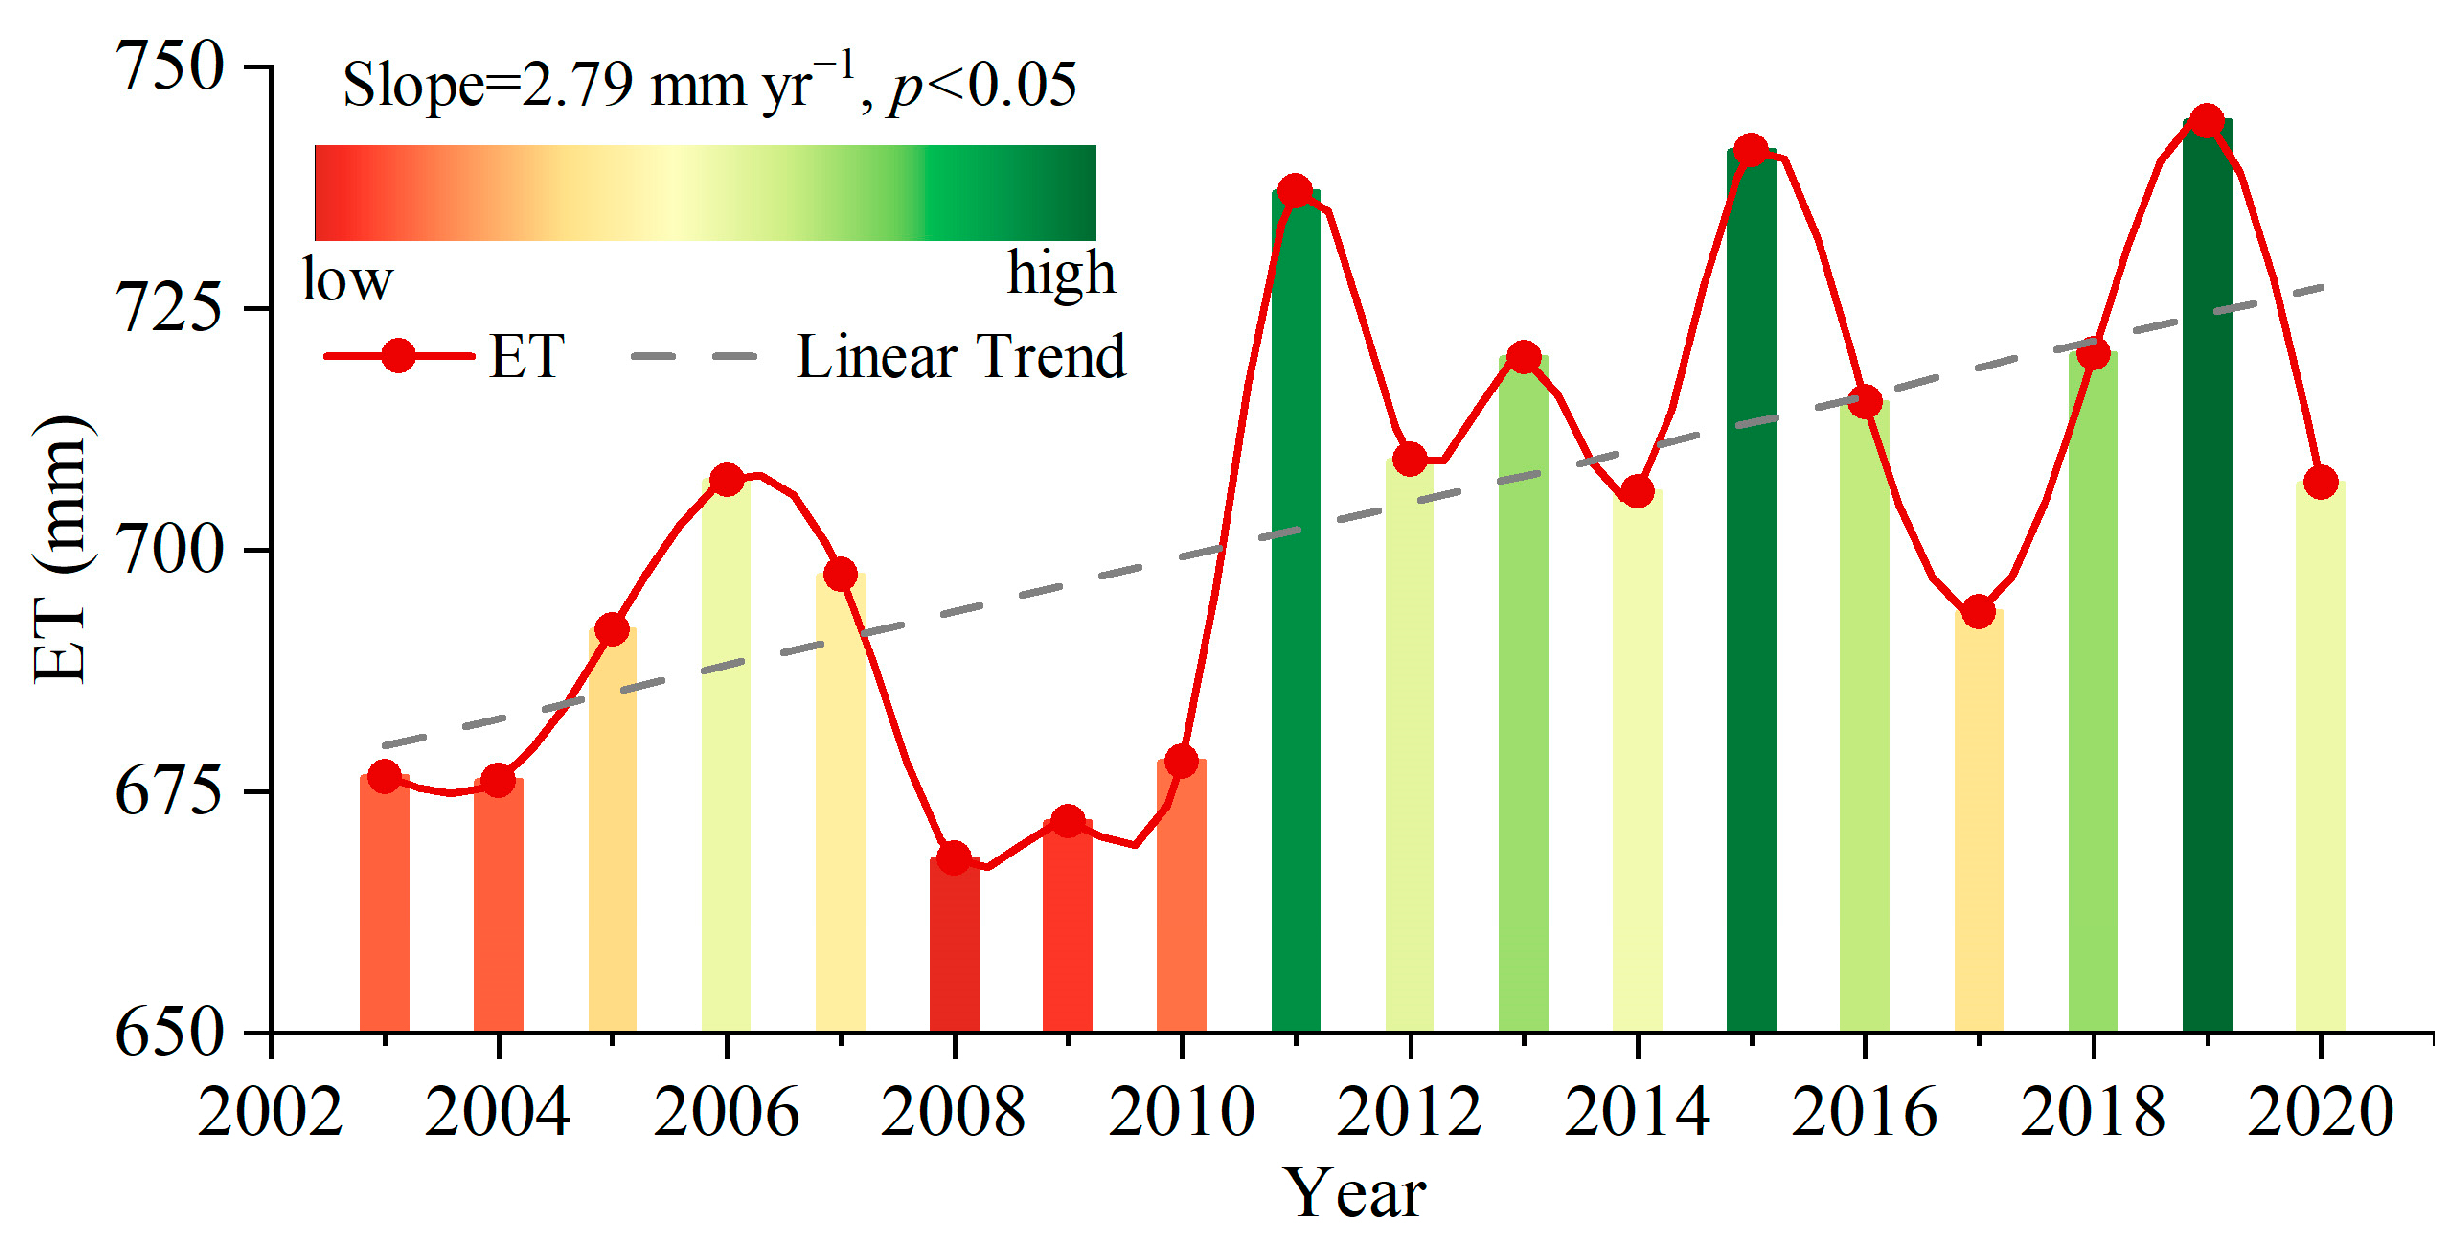
3.1.2. Trends in Annual ET Variations

The annual ET in the study area ranged from 668 to 744 mm between 2003 and 2020, exhibiting a statistically significant linear increase of 2.79 mm per year (p < 0.05) (Figure 3). Over the past two decades, ET has undergone considerable fluctuations. Notably, during the period of 2008–2010, a significant low valley in ET was observed, which may have been caused by severe droughts and snow disasters in Southwest China during that time [50,51].
Figure 4a presents the pixel-based variation rates of ET from 2003 to 2020, ranging from −37.49 to 41.3 mm per year. The western regions exhibited relatively stronger variations in ET compared to the eastern regions. Furthermore, the analysis revealed that 72.63% of the study area showed an increasing trend in ET, while 27.37% showed a decreasing trend. Among them, the significant increase regions accounted for 36.99% of the total area, the significant decrease regions accounted for 5.44%, and the remaining 57.57% of the areas did not exhibit any significant variations in ET (Figure 4b).

3.2. Analysis of Geographical Detector Results

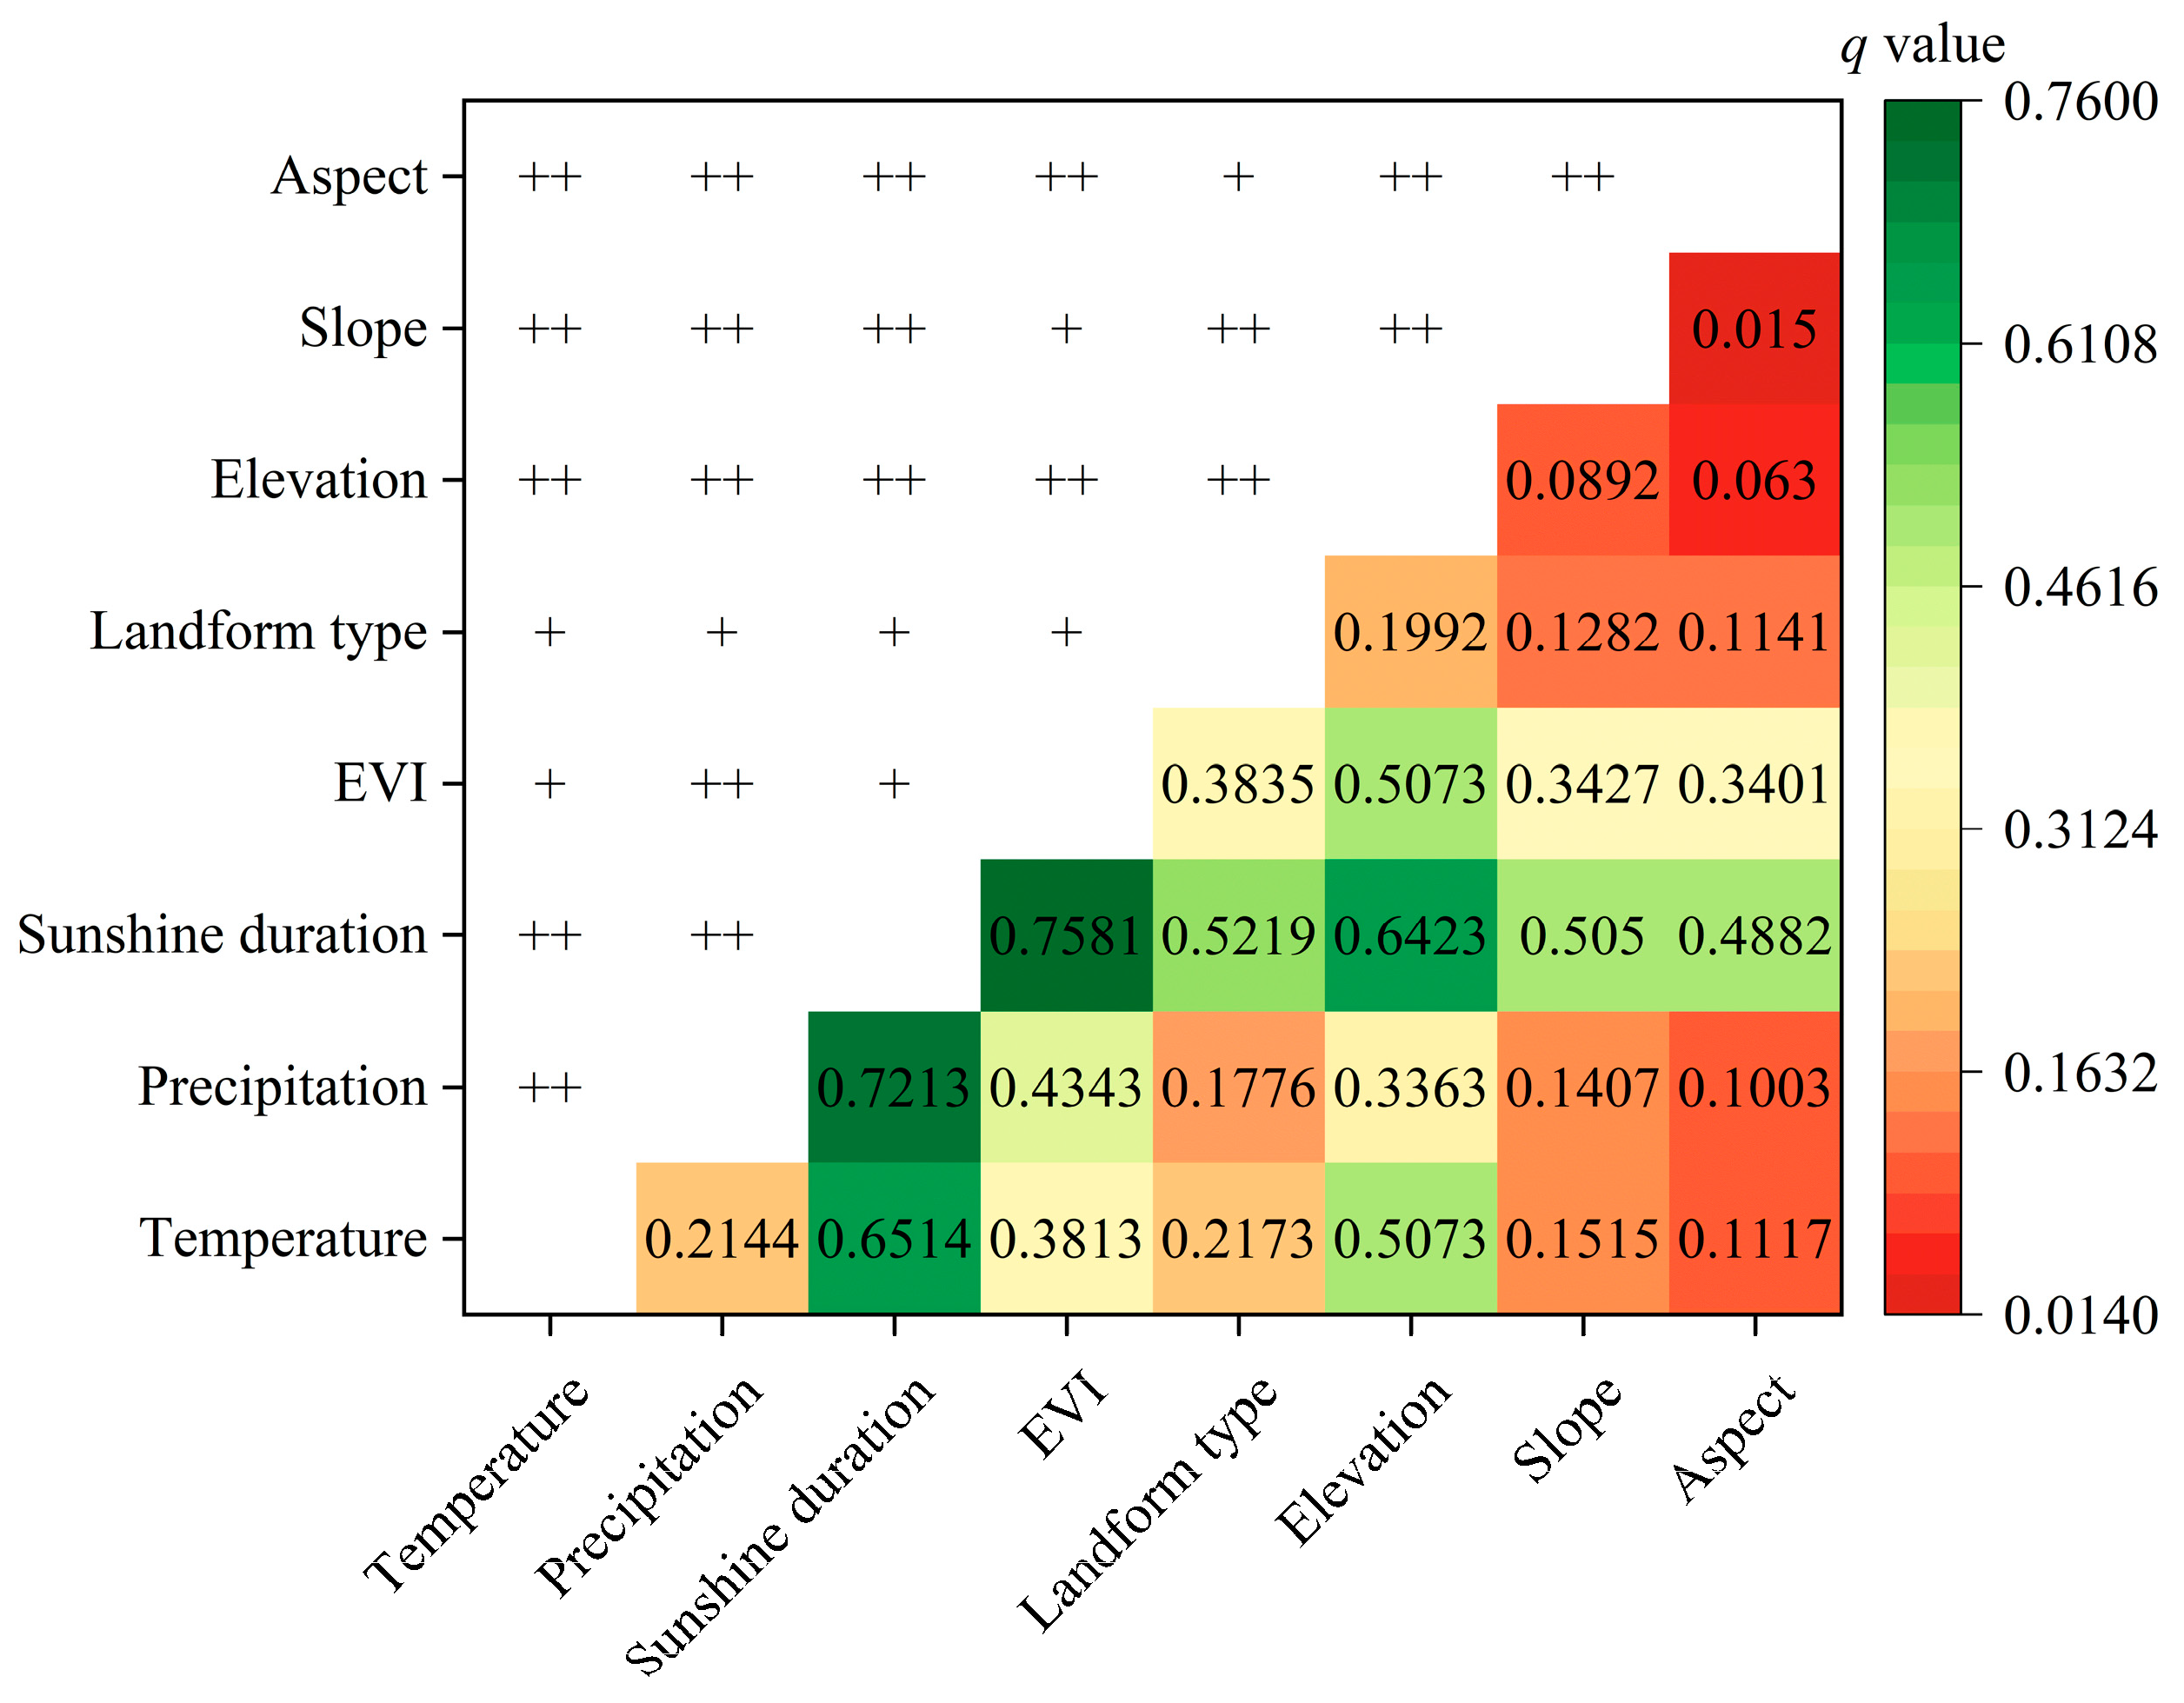
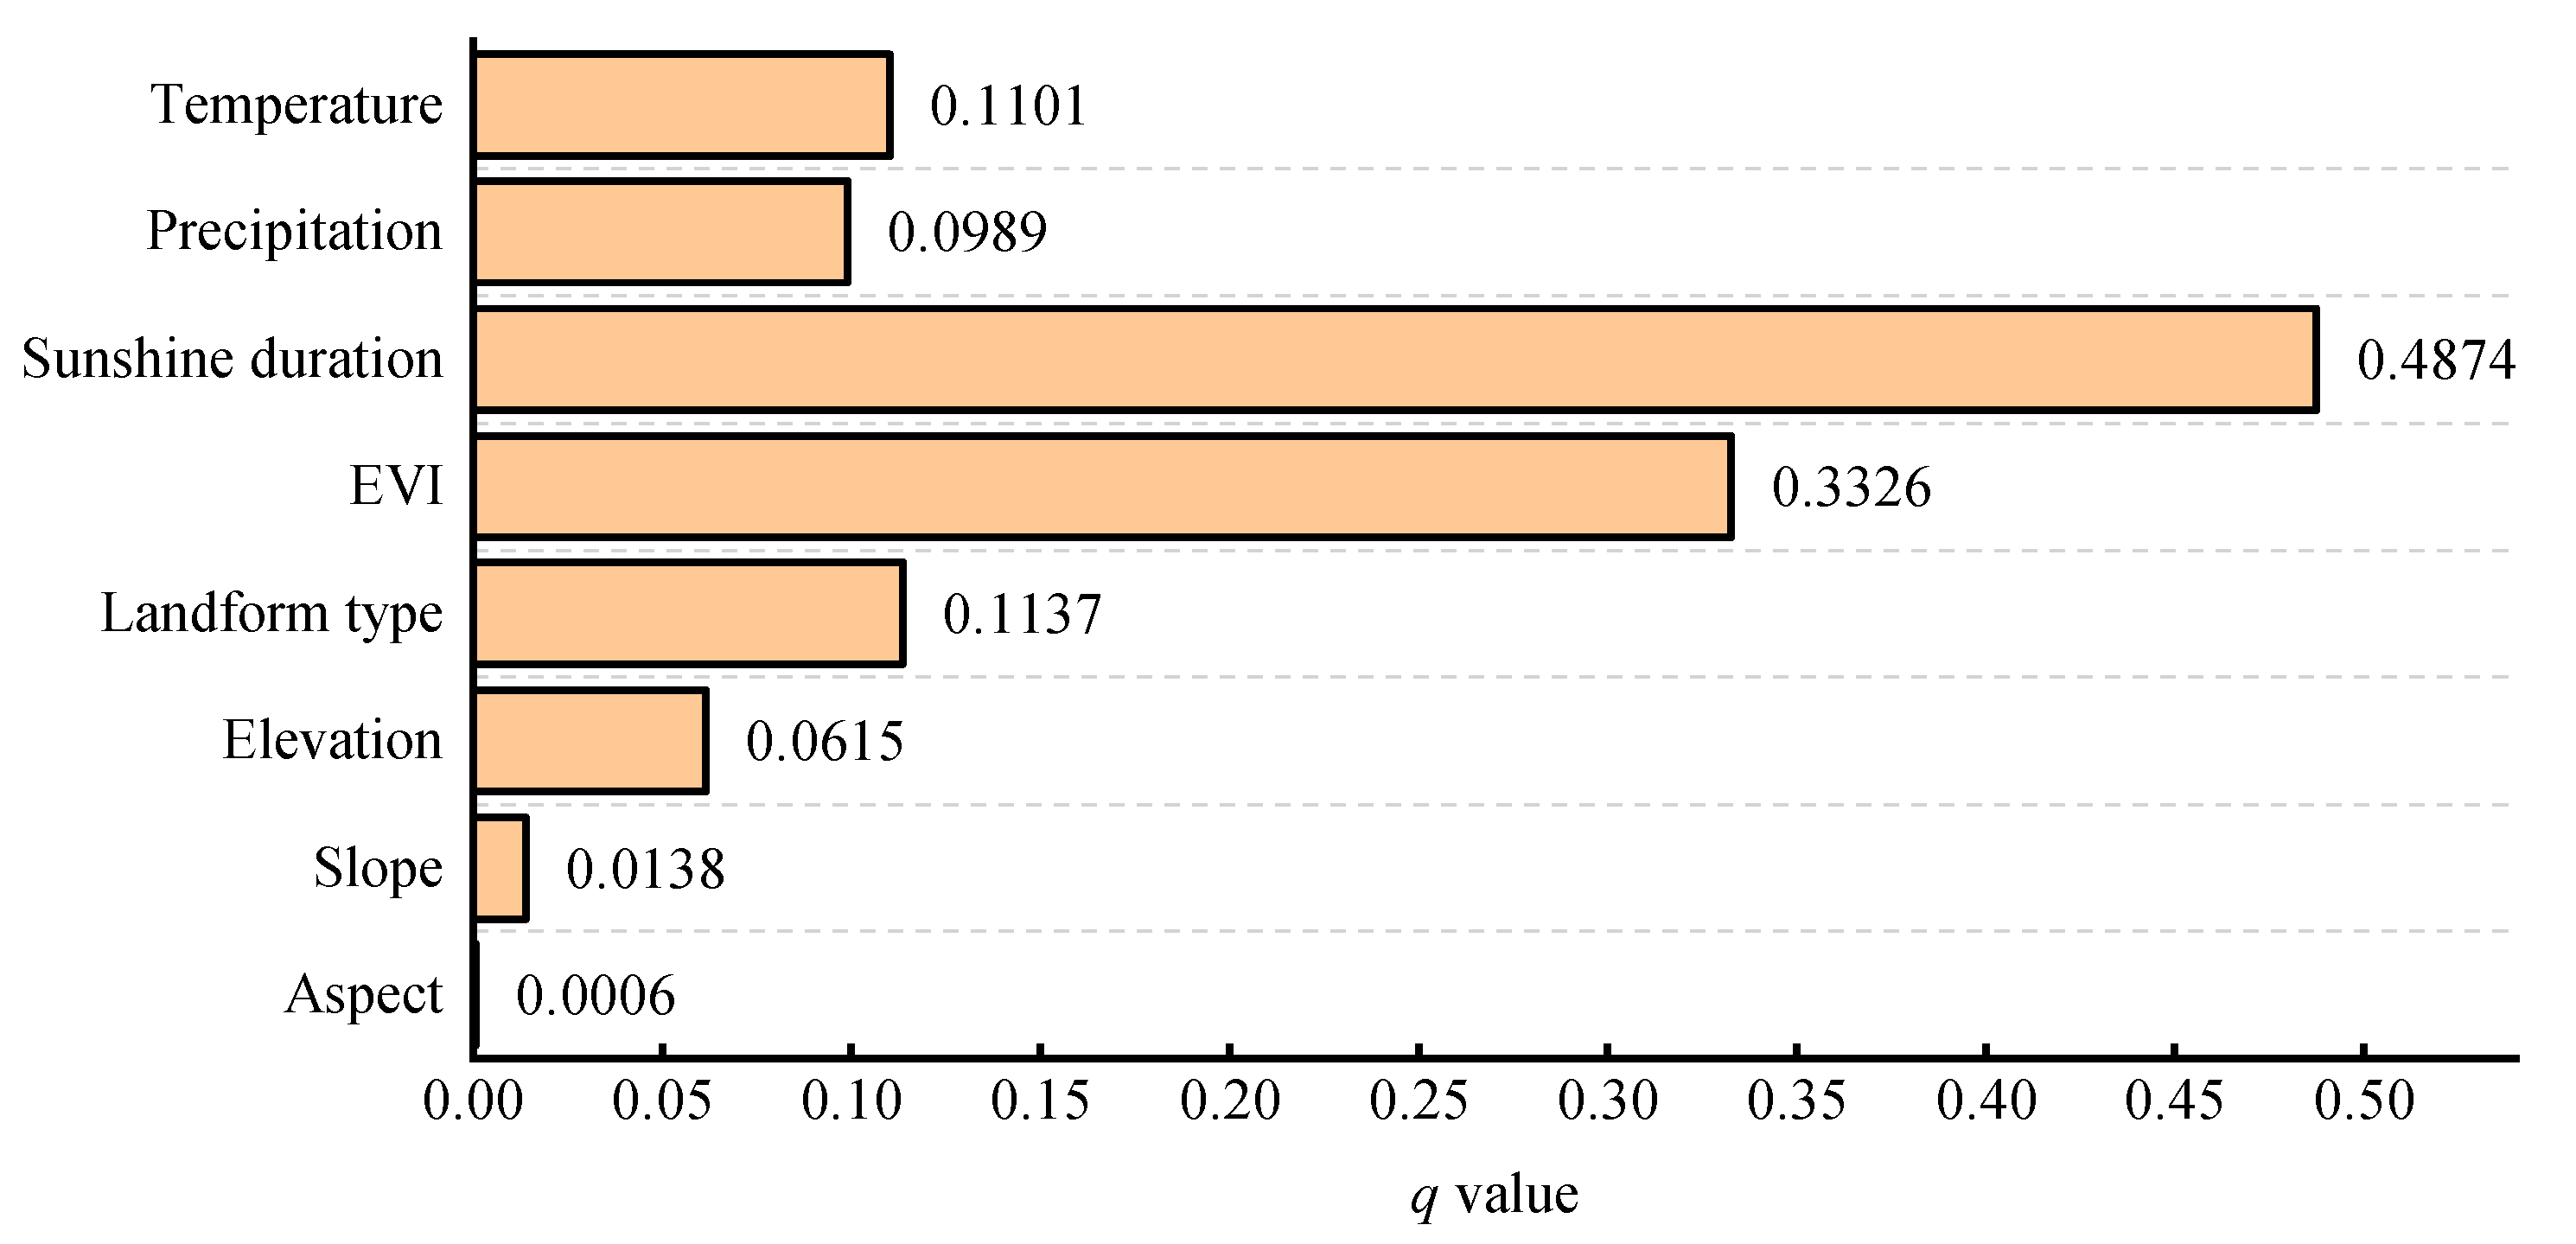
3.2.1. Independent Effects of Each Influencing Factor on Spatial Distribution Pattern of ET

Figure 5 depicts the application of factor detection in the geographical detector to quantify the influence of each contributing factor on the spatial distribution of ET. The results demonstrate that all the examined determinants (p < 0.05) significantly influenced the spatial distribution of ET in Southwest China. Specifically, sunshine duration and EVI exhibited a high explanatory power, with q values exceeding 0.3. Landform type, temperature, precipitation, and elevation demonstrated a moderate impact on ET, as indicated by their respective q values ranging from 0.05 to 0.3. Conversely, the impact of slope and aspect on ET was relatively small, with q values below 0.05. Among the four static geographical variables considered, landform type emerged as the primary determinant influencing ET.

3.2.2. Effects of Interaction between Influencing Factors on Spatial Distribution Pattern of ET

The interaction between any two factors exhibited a higher explanatory power (q value) on the spatial distribution pattern of the multi-year mean ET than any single factor. Furthermore, most of the interaction effects between any two factors demonstrated nonlinear enhancements (Figure 6). For instance, while the single-factor q values for elevation and temperature were 0.0615 and 0.1101, respectively, their interaction considerably increased their impact on the spatial distribution of ET, yielding a q value of 0.5073. Among all the factor interactions, the interaction between sunshine duration and other influencing factors appears relatively strong, with q values ranging from 0.4882 to 0.7581. Notably, the interaction between sunshine duration and EVI displays the highest q value of 0.7581. This finding highlights the primary role of sunshine duration in determining the spatial distribution pattern of ET. Additionally, although landform type exhibits a higher single-factor influence ranking than elevation, the interaction between elevation and other factors proves stronger. These results indicate that the driving factors influencing the spatial distribution of ET are interdependent, and their explanatory power is enhanced through interaction.

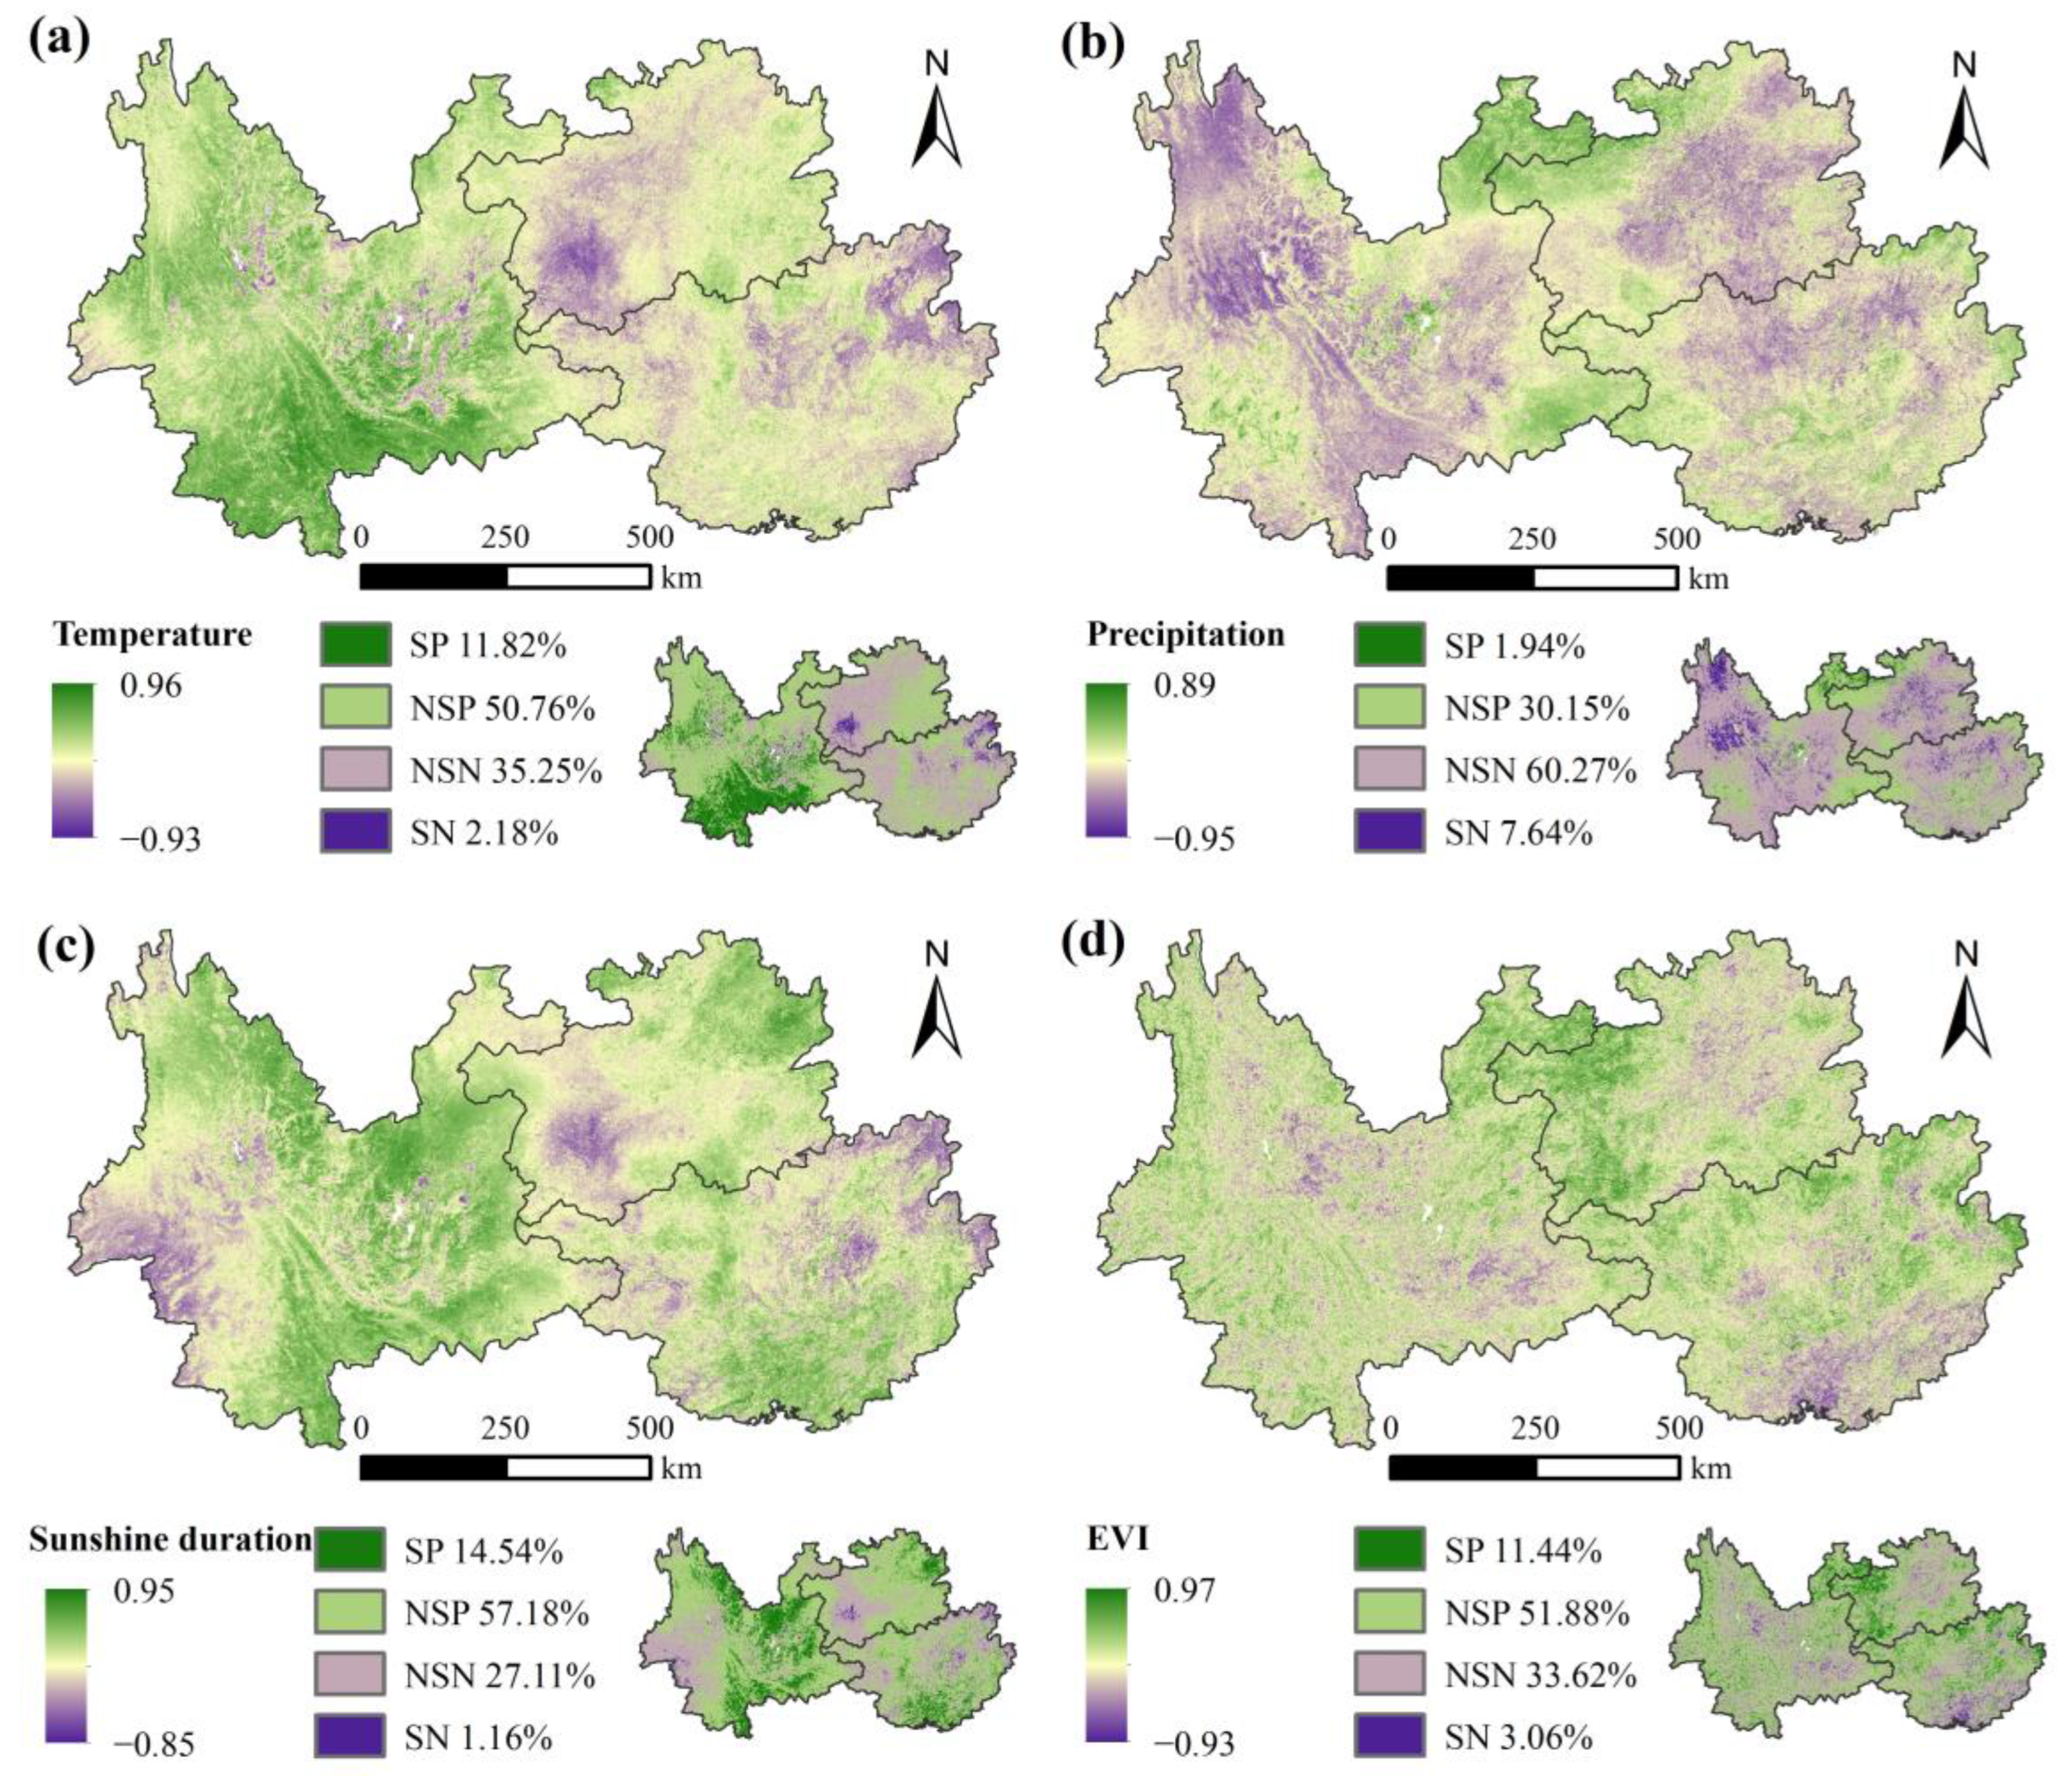
3.3. Partial Correlation Analysis Results

To quantitatively analyze the relationships between dynamic environmental factors and ET, we calculated the partial correlation coefficients between ET and temperature, precipitation, sunshine duration, and EVI for each pixel. Figure 7 depicts considerable spatial differences in the partial correlation between different factors and ET. Overall, ET was found to exhibit positive correlations with temperature, sunshine duration, and EVI, encompassing 62.57%, 71.72%, and 63.32% of the total study area, respectively. The positive correlation between ET and temperature was mainly distributed in Yunnan. Conversely, the positive correlation between ET and sunshine duration was primarily observed in the eastern part of Yunnan, southern Guangxi, and northeastern Guizhou. The positive correlation between ET and EVI was mainly concentrated at the junction of Guizhou, Yunnan, and Guangxi. Conversely, precipitation displayed a negative correlation with ET, accounting for 67.91% of the total study area, and was mainly distributed in eastern Guizhou, northern Guangxi and the central part of Yunnan spanning northward and southward.

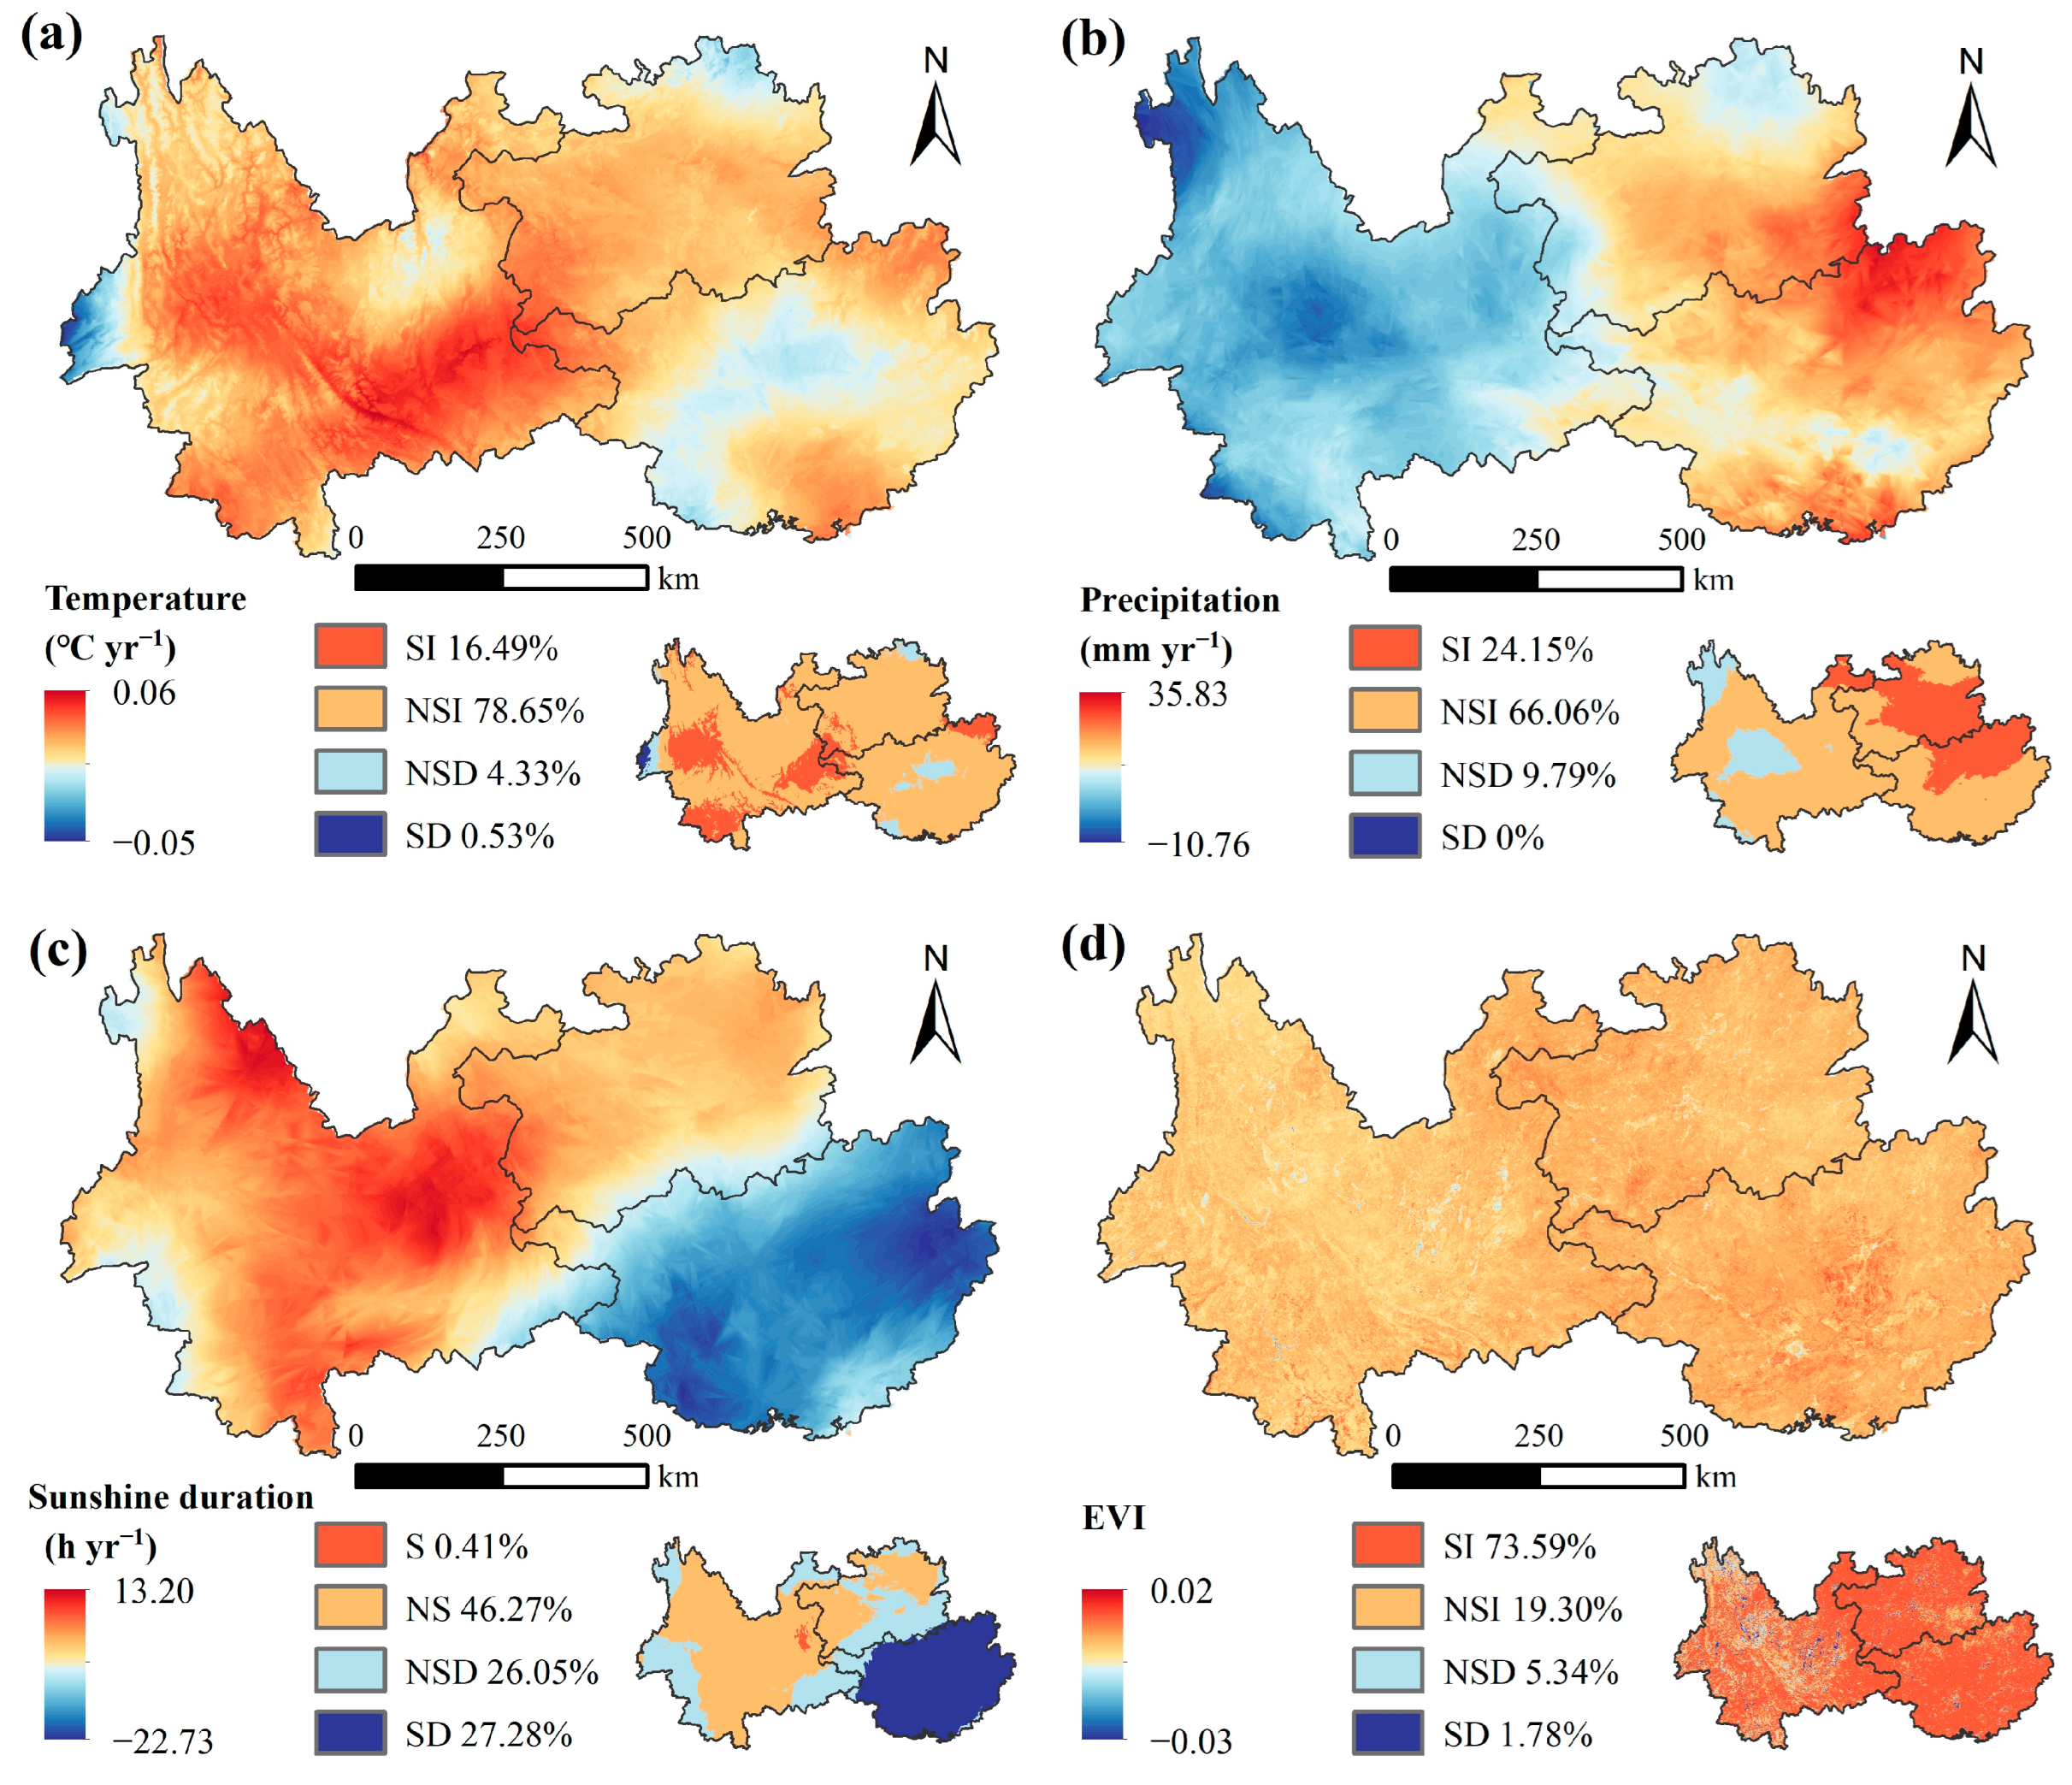
3.4. Analysis of Random Forest Model Results

Figure 8a illustrates the spatial distribution patterns of the dominant factors influencing ET variation, as indicated by the maximum %IncMSE value among temperature, precipitation, sunshine duration, and EVI at each pixel. EVI accounted for 42.92% of the entire study area and was the factor with the largest proportion of ET fluctuations, particularly at the Yunnan–Guizhou border. These regions aligned with areas where EVI increased (Figure A1d). Furthermore, EVI was generally found to exhibit a positive correlation with ET (Figure 7d). Therefore, it can be concluded that the increase in EVI was the main driver of the increase in ET. Sunshine duration, temperature, and precipitation accounted for similar proportions in the study area, comprising 22.03%, 16.51%, and 18.54%, respectively. Primarily, the factor of temperature induced alterations in ET in the southern part of Yunnan, while precipitation and sunshine duration considerably affected the scattered regions. Regarding landform types, EVI dominated the largest proportion of both karst and non-karst landform areas, although the proportion was relatively higher in karst landform areas.

4. Discussion

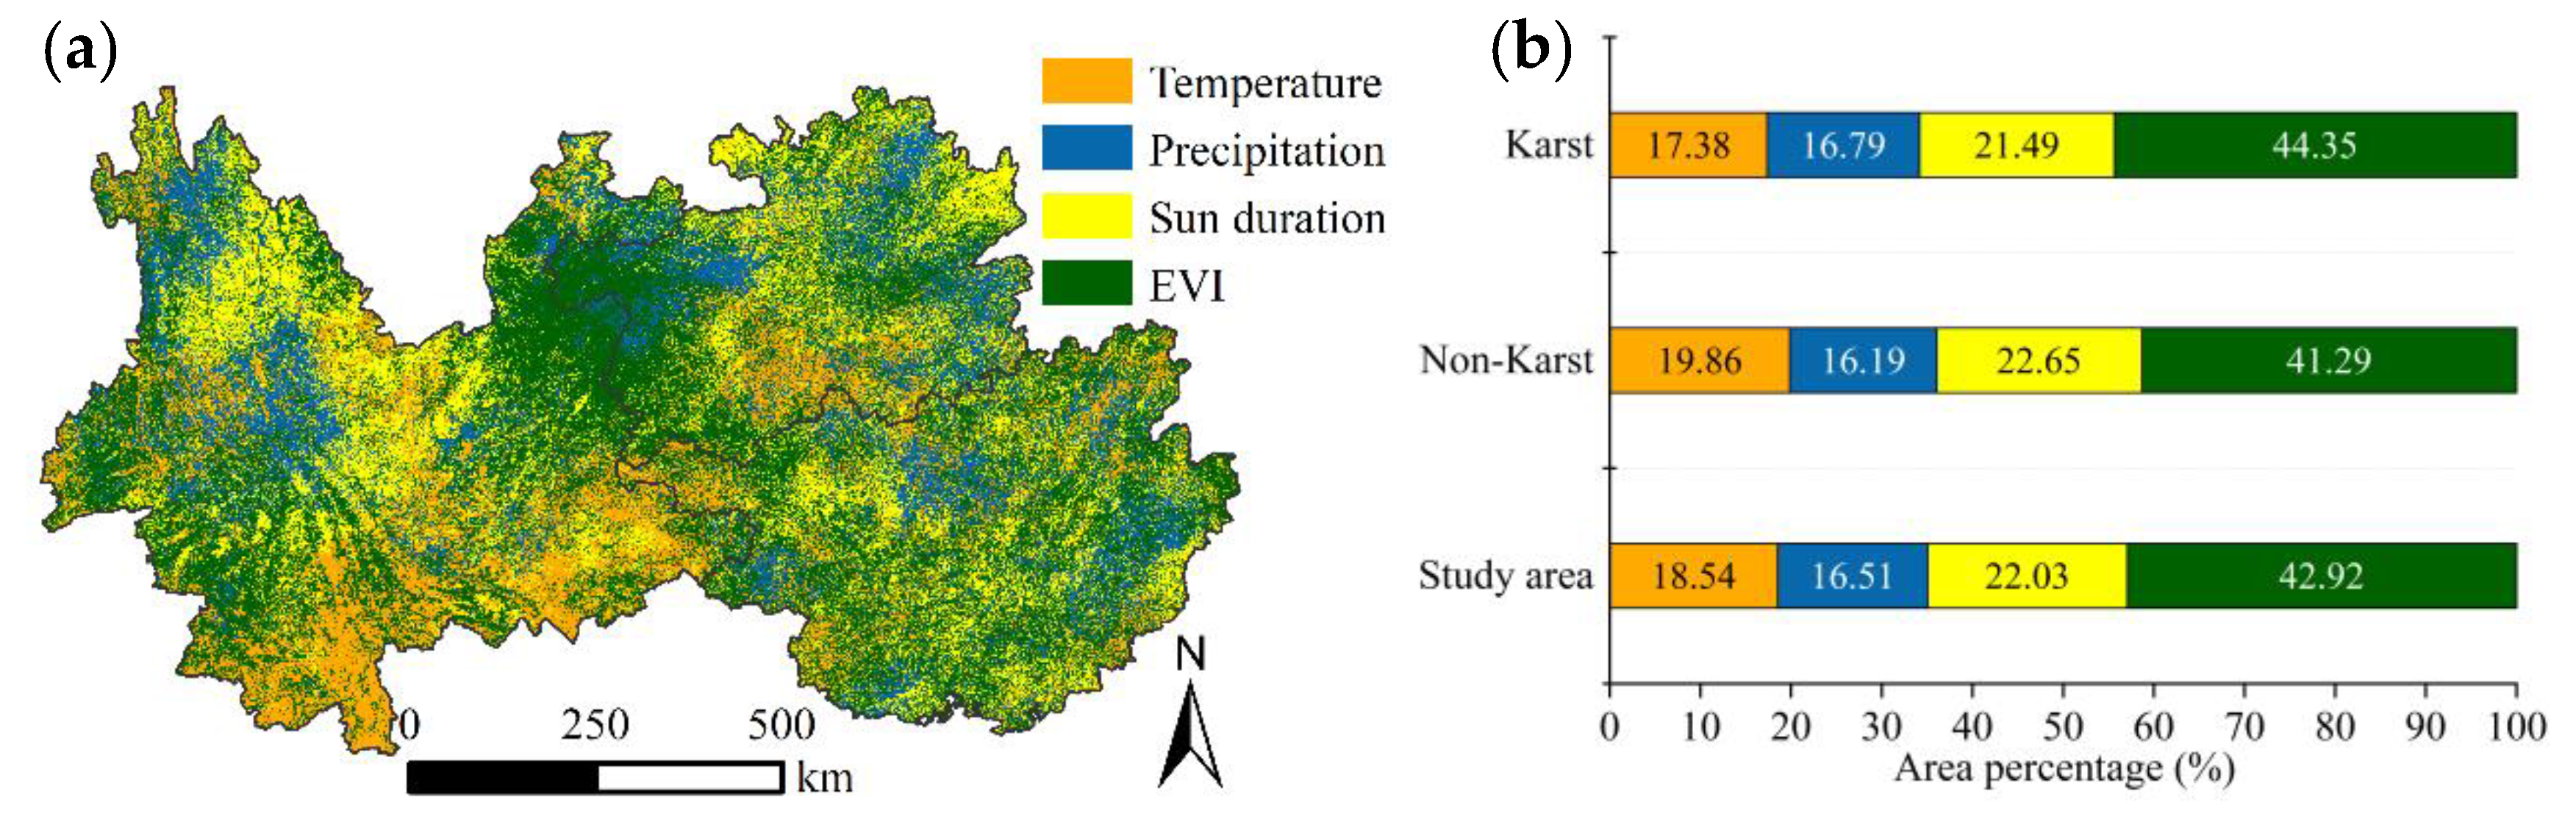
4.1. Key Factors Affecting Spatial Distribution Pattern of ET in Southwest China

Previous studies primarily focused on investigating the temporal attribution of ET variations, with limited research examining the spatial distribution patterns of ET. The analysis of ET spatial distribution patterns gradually gained traction following the introduction of geographic detectors [26]. The results obtained from the geographic detector herein demonstrate that sunshine duration exerted the greatest influence on the spatial distribution pattern of ET in Southwest China, which aligned with our expectations. A strong correlation exists between net radiation and sunshine duration, and empirical equations incorporating sunshine duration were often used to estimate net radiation [52]. Moreover, net radiation is a vital factor for estimating ET according to several empirical statistical models [53,54] as well as the Penman–Monteith formula [55]. Therefore, sunshine duration considerably impacted the spatial distribution of ET, wherein a greater sunshine duration corresponded to longer periods of sunlight and higher net radiation. In areas characterized by cloudiness and high precipitation, specifically in Guizhou where sunshine duration was considerably low (Figure 1h), net radiation emerged as the primary limiting factor for ET [56]. Conversely, regions with relatively higher sunshine duration, such as Yunnan, experienced higher ET rates. Consequently, this explains why sunshine duration held a substantial influence on the spatial distribution of ET in Southwest China. These findings found support in previous research conducted at flux stations within the study area [57]. The second most influential factor shaping the spatial distribution of ET was EVI. This was attributable to regions exhibiting vigorous vegetation growth where plant transpiration and interception evaporation became the dominant contributors to ET [58], resulting in higher ET values, particularly in southern Yunnan. Conversely, regions with lower EVI, such as eastern and northern Yunnan, demonstrated comparatively lower ET rates. Thus, EVI considerably contributed to the spatial distribution pattern of ET.
Among the static environmental factors, landform types exerted the primary influence on the spatial distribution pattern of ET. This relationship is further illustrated by the W-shaped distribution of ET with longitude (bottom panel in Figure 2). Non-karst and karst landforms exhibit considerable differences in their underlying surface characteristics. In the study area, karst landforms are predominantly found in regions affected by severe rocky desertification, characterized by shrub vegetation and relatively low vegetation cover [59], resulting in lower ET. Conversely, non-karst areas exhibit deeper underlying vegetation and ecological preservation, with a higher prevalence of forests and greater vegetation cover. The control of the vegetation canopy by plants enhances transpiration and interception evaporation, affording higher ET rates. Altitude, as another static environmental factor, influences the spatial distribution of ET as the second most influential factor. Southwest China’s complex terrain contributes to similar spatial distribution patterns of temperature, precipitation, EVI, and altitude. Altitude plays a decisive role in shaping the spatial distribution of these factors [60] and indirectly affects the spatial distribution of ET. Our interaction detection results indicate that the combined effect of multiple factors enhances the explanatory power of ET spatial distribution. Among all the interaction factors, the interaction between sunshine duration and EVI emerges as the strongest interactive factor. Areas with favorable water and heat conditions generally exhibit robust vegetation growth, ample sunshine duration, and increased ET through plant transpiration and precipitation interception. Furthermore, the interaction between sunshine duration and other factors enhances the explanatory power of ET spatial distribution. These findings further underscore the substantial impact of sunshine duration on the spatial distribution pattern of ET. Although the landform type holds a stronger explanatory power for the spatial distribution pattern of ET compared to elevation as an individual factor, the interaction between the elevation and other factors demonstrates greater strength in the results of detecting interaction among multiple factors. This may be attributable to the limited impact of landform type on meteorological elements, whereas elevation exerts stronger control over the distribution of other dynamic environmental factors [60]. Thus, the interaction between elevation and other factors strongly governs the spatial distribution pattern of ET.

4.2. Dominant Factors of ET Variations in Southwest China

During 2003–2019, global ET exhibited a significant linear-growth trend primarily attributed to global warming [61]. Similarly, in China, from 2000 to 2019, ET experienced a statistically significant increase mainly owing to increased precipitation and wind speed [62]. Our study examined ET fluctuations in Southwest China from 2003 to 2020 and observed a significant overall increase, consistent with global and national trends. However, our research revealed that the primary factors altering ET in Southwest China differ from those at the global and national scales. Utilizing the random forest model, we identified EVI as the dominant factor influencing ET variations in Southwest China, followed by sunshine duration. Over the past two decades, extensive large-scale ecological engineering projects have been implemented in Southwest China, resulting in significant vegetation recovery [31,32]. The results of this study also confirmed that the EVI representing vegetation growth significantly increased in an area of 73.59% during this period (Figure A1d). Vegetation recovery contributes to increased transpiration and precipitation interception, leading to higher ET rates [25,63]. This observation is further supported by the overall positive correlation between ET and EVI (Figure 7d). Compared to the non-karst regions, a greater number of pixels was observed in the karst geomorphic area dominated by ET fluctuations. This can be attributed to the higher investment in ecological engineering to address issues such as rocky desertification in the karst region, resulting in more effective vegetation recovery and a higher rate of EVI increase [64,65]. In summary, EVI emerged as the dominant factor increasing ET in the study area.
Furthermore, sunshine duration constituted a relatively significant proportion, accounting for 22.03% of the temporal variations in ET within the study area. This proportion exceeded that of temperature and precipitation, which were the primary factors of ET variations. Sunshine duration exhibited an overall positive correlation with ET. However, as the study period witnessed a general reduction in sunshine duration, and this reduction was significant across 27.28% of the study area, it negatively impacted ET in the research area. Although the sunshine duration persisted as the most influential factor for explaining the spatial distribution of average ET over multiple years, it primarily influenced local variations in ET rather than dominating its temporal variations.

4.3. Potential Inaccuracies, Limitations, and Implications

The main source of uncertainty in this study lies in the accuracy of the ET and driving factor data. ET estimation relies on complex models and various input data, introducing potential uncertainties in the spatial distribution and temporal variations, thereby impacting the accuracy of ET [66,67]. However, the PML-V2 ET product employed in this study has undergone validation in previous research, encompassing site-scale flux tower measurements and regional-scale water balance assessments. These validations have consistently demonstrated that the PML-V2 ET product exhibits similar or higher accuracy compared to other products [68,69,70,71]. For instance, validation using 95 global flux sites revealed a strong correlation between ET and the flux station measurements, with correlation coefficients of 0.83. The validation results from 26 flux stations in China exhibited a correlation coefficient of 0.87 [36]. Furthermore, the PML-V2 ET product offers a spatial resolution of 500 m, making it suitable for studying regions characterized by significant spatial heterogeneity. Therefore, the utilization of the PML-V2 ET product in this study substantially reduces the associated uncertainties.
To further mitigate the uncertainty arising from the influence factor data, we employed the thin-plate spline method to generate station data for temperature, precipitation, and sunshine duration. This method is particularly suitable for mountainous areas [72]. Additionally, the EVI data utilized in this study were obtained from Terra and Aqua satellites, and subjected to a rigorous cloud-pollution removal strategy, rendering it more applicable to cloudy and foggy regions in Southwest China. Given the specific characteristics of the study area, we employed appropriate data processing methods to reduce the uncertainty inherent in our research results to a certain extent.
Although we strictly controlled the quality of the data, there is still ample room for improving data accuracy, especially in the highly spatially heterogeneous areas of Southwest China with diverse underlying surfaces. In the future, the reliability of research results could be enhanced by estimating or utilizing higher-resolution and higher-precision data products. Additionally, while we examined the most common meteorological factors, vegetation index, terrain, and landform factors to analyze their impact on ET, these are not the sole factors influencing ET. Relevant studies have indicated that leaf area index [73], soil moisture [74], and other meteorological variables (such as relative humidity, wind speed, atmospheric pressure, etc.) [62] may significantly affect ET. Therefore, future research incorporating additional factors to analyze the spatiotemporal variation in ET is necessary to obtain more comprehensive conclusions.
Our research results indicate that the spatial distribution pattern of ET in Southwest China was primarily influenced by sunshine duration, while vegetation recovery emerged as the dominant factor driving the temporal variation in ET. The implications of these findings for conducting studies on ET in Southwest China suggest the need to consider regional sunshine duration when engaging in plant cultivation or water resource management to determine appropriate planting or management strategies. ET and vegetation growth exhibit a close relationship. In areas with limited sunshine duration and without considering water resource constraints, such as in Guizhou, shade-tolerant species should be prioritized for plant growth, while regions with longer sunshine duration should be utilized for cultivating sun-loving plants to facilitate plant growth. The rapid vegetation restoration in Southwest China, coupled with ecological engineering, may exert significant pressure on surface water resources through transpiration and interception evaporation, particularly in karst areas where water storage is challenging [75]. Therefore, water-efficient plants should be implanted in these areas to reduce water consumption, while enhancing the ability to control desertification and improve soil and water conservation.

5. Conclusions

Based on the PML-V2 ET product, this study revealed the spatial distribution pattern of average ET and the key factors affecting ET in Southwest China from 2003 to 2020. In particular, we analyzed the trend of past ET variations and identified the dominant factors causing such variations in the study region. The results indicated that the average annual ET decreased with increasing latitude and altitude, displaying “W”-shaped fluctuations in the longitudinal direction because of the karst landform. The attribution results of the geographical detector suggested that sunshine duration has the most important impact on the spatial distribution of average annual ET, followed by EVI. Among the four static geographical factors, landform type has the greatest impact on the spatial distribution of ET. However, the factors affecting the spatial distribution of ET were not independent, and their interplay with each other strengthens their explanatory power for ET. During the study period, ET exhibited a significant linear-growth trend and 70.03% of the study area displayed an upward trend. Based on the relative significance ranking of dynamic environmental factors using the random forest model, EVI was classified as the dominant factor inducing fluctuations in ET across the study area, accounting for 42.92% of the total area. This finding can be attributed to the significantly increasing trend of EVI in the study area, which was positively correlated with ET. Therefore, vegetation restoration increased ET in the study area. The present findings provide a new understanding of the key factors of spatial and temporal variations in ET in the humid and water-deficient regions of Southwest China. Overall, this study provides theoretical guidance for the ecological restoration and management of water resources in this region.

Author Contributions

Conceptualization, X.Z. and J.Z.; methodology, J.Z.; software, J.Z. and Y.A.; writing—original draft preparation, J.Z.; writing—review and editing, X.Z., Y.A. and J.Z.; funding acquisition, S.Y. and X.Z. All authors have read and agreed to the published version of the manuscript.

Funding

This research was funded by the Joint Fund of the National Natural Science Foundation of China and Karst Science Research Center of Guizhou Province (U1812401), and the National Natural Science Foundation of China (42175193), and the National Key Research and Development Program of China (2021YFB3901400).

Data Availability Statement

Publicly available datasets were analyzed in this study. The data source and access links are indicated in the text.

Acknowledgments

We are very grateful to the scientists and institutions who made the remote sensing products, such as PML-V2 ET, EVI, SRTM3 DEM, and provided meteorological data. We thank the reviewers and the editor for their constructive comments and suggestions, which have significantly improved this paper.

Conflicts of Interest

The authors declare no conflict of interest.

Appendix A

Figure A1. Spatial distribution of (a) temperature, (b) precipitation, (c) sunshine duration, and (d) EVI variation trends from 2003 to 2020. SI: significant increase; NSI: nonsignificant increase; NSD: nonsignificant decrease; SD: significant decrease.
Remotesensing 15 04418 g0a1

References

  1. Oki, T.; Kanae, S. Global Hydrological Cycles and World Water Resources. Science 2006, 313, 1068–1072. [Google Scholar] [CrossRef] [PubMed]
  2. Liu, Z. Causes of changes in actual evapotranspiration and terrestrial water storage over the Eurasian inland basins. Hydrol. Process. 2022, 36, e14482. [Google Scholar] [CrossRef]
  3. Yao, F.; Wang, J.; Yang, K.; Wang, C.; Walter, B.A.; Crétaux, J.-F. Lake storage variation on the endorheic Tibetan Plateau and its attribution to climate change since the new millennium. Environ. Res. Lett. 2018, 13, 064011. [Google Scholar] [CrossRef]
  4. Zhang, Y.; He, B.; Guo, L.; Liu, J.; Xie, X. The relative contributions of precipitation, evapotranspiration, and runoff to terrestrial water storage changes across 168 river basins. J. Hydrol. 2019, 579, 124194. [Google Scholar] [CrossRef]
  5. Cao, G.; Han, D.; Song, X. Evaluating actual evapotranspiration and impacts of groundwater storage change in the North China Plain. Hydrol. Process. 2014, 28, 1797–1808. [Google Scholar] [CrossRef]
  6. Yang, Z.; Zhang, Q.; Hao, X.; Yue, P. Changes in Evapotranspiration Over Global Semiarid Regions 1984–2013. J. Geophys. Res. Atmos. 2019, 124, 2946–2963. [Google Scholar] [CrossRef]
  7. Liu, M.; Xu, X.; Wang, D.; Sun, A.Y.; Wang, K. Karst catchments exhibited higher degradation stress from climate change than the non-karst catchments in southwest China: An ecohydrological perspective. J. Hydrol. 2016, 535, 173–180. [Google Scholar] [CrossRef]
  8. Zhang, K.; Kimball, J.S.; Nemani, R.R.; Running, S.W.; Hong, Y.; Gourley, J.J.; Yu, Z. Vegetation Greening and Climate Change Promote Multidecadal Rises of Global Land Evapotranspiration. Sci. Rep. 2015, 5, 15956. [Google Scholar] [CrossRef]
  9. Jung, M.; Reichstein, M.; Ciais, P.; Seneviratne, S.I.; Sheffield, J.; Goulden, M.L.; Bonan, G.; Cescatti, A.; Chen, J.; de Jeu, R.; et al. Recent decline in the global land evapotranspiration trend due to limited moisture supply. Nature 2010, 467, 951–954. [Google Scholar] [CrossRef]
  10. Zhang, Y.; Peña-Arancibia, J.L.; McVicar, T.R.; Chiew, F.H.S.; Vaze, J.; Liu, C.; Lu, X.; Zheng, H.; Wang, Y.; Liu, Y.Y.; et al. Multi-decadal trends in global terrestrial evapotranspiration and its components. Sci. Rep. 2016, 6, 19124. [Google Scholar] [CrossRef]
  11. Zeng, Z.; Piao, S.; Lin, X.; Yin, G.; Peng, S.; Ciais, P.; Myneni, R.B. Global evapotranspiration over the past three decades: Estimation based on the water balance equation combined with empirical models. Environ. Res. Lett. 2012, 7, 014026. [Google Scholar] [CrossRef]
  12. Tabari, H.; Hosseinzadeh Talaee, P. Sensitivity of evapotranspiration to climatic change in different climates. Glob. Planet. Chang. 2014, 115, 16–23. [Google Scholar] [CrossRef]
  13. Zhang, D.; Liu, X.; Zhang, L.; Zhang, Q.; Gan, R.; Li, X. Attribution of Evapotranspiration Changes in Humid Regions of China from 1982 to 2016. J. Geophys. Res. Atmos. 2020, 125, e2020JD032404. [Google Scholar] [CrossRef]
  14. Mingyue, C.; Junbang, W.; Shaoqiang, W.; Hao, Y.; Yingnian, L. Temporal and Spatial Distribution of Evapotranspiration and Its Influencing Factors on Qinghai-Tibet Plateau from 1982 to 2014. J. Resour. Ecol. 2019, 10, 213–224. [Google Scholar]
  15. Ma, N.; Zhang, Y. Increasing Tibetan Plateau terrestrial evapotranspiration primarily driven by precipitation. Agric. For. Meteorol. 2022, 317, 108887. [Google Scholar] [CrossRef]
  16. Gao, X.; Sun, M.; Luan, Q.; Zhao, X.; Wang, J.; He, G.; Zhao, Y. The spatial and temporal evolution of the actual evapotranspiration based on the remote sensing method in the Loess Plateau. Sci. Total Environ. 2020, 708, 135111. [Google Scholar] [CrossRef]
  17. Jin, Z.; Liang, W.; Yang, Y.; Zhang, W.; Yan, J.; Chen, X.; Li, S.; Mo, X. Separating Vegetation Greening and Climate Change Controls on Evapotranspiration trend over the Loess Plateau. Sci. Rep. 2017, 7, 8191. [Google Scholar] [CrossRef]
  18. Trancoso, R.; Larsen, J.R.; McAlpine, C.; McVicar, T.R.; Phinn, S. Linking the Budyko framework and the Dunne diagram. J. Hydrol. 2016, 535, 581–597. [Google Scholar] [CrossRef]
  19. McVicar, T.R.; Roderick, M.L.; Donohue, R.J.; Van Niel, T.G. Less bluster ahead? Ecohydrological implications of global trends of terrestrial near-surface wind speeds. Ecohydrology 2012, 5, 381–388. [Google Scholar] [CrossRef]
  20. Zhou, Q.; Zhu, A.X.; Yan, W.; Sun, Z. Impacts of forestland vegetation restoration on soil moisture content in humid karst region: A case study on a limestone slope. Ecol. Eng. 2022, 180, 106648. [Google Scholar] [CrossRef]
  21. Du, H.; Zeng, F.; Song, T.; Liu, K.; Wang, K.; Liu, M. Water depletion of climax forests over humid karst terrain: Patterns, controlling factors and implications. Agric. Water Manag. 2021, 244, 106541. [Google Scholar] [CrossRef]
  22. Jiang, S.Z.; Liang, C.; Cui, N.B.; Zhao, L.; Du, T.S.; Hu, X.T.; Feng, Y.; Guan, J.; Feng, Y. Impacts of climatic variables on reference evapotranspiration during growing season in Southwest China. Agric. Water Manag. 2019, 216, 365–378. [Google Scholar] [CrossRef]
  23. Feng, Y.; Cui, N.; Zhao, L.; Gong, D.; Zhang, K. Spatiotemporal variation of reference evapotranspiration during 1954–2013 in Southwest China. Quat. Int. 2017, 441, 129–139. [Google Scholar] [CrossRef]
  24. Li, H.; Wang, S.; Bai, X.; Tang, H.; Cao, Y.; Wang, M.; Wu, L. Inversion and spatiotemporal evolution of actual evapotranspiration in southwest China for the past 50 years. Acta Ecol. Sin 2018, 38, 8835–8848. [Google Scholar]
  25. Liu, Y.; Lian, J.; Luo, Z.; Chen, H. Spatiotemporal variations in evapotranspiration and transpiration fraction following changes in climate and vegetation in a karst basin of southwest China. J. Hydrol. 2022, 612, 128216. [Google Scholar] [CrossRef]
  26. Ersi, C.; Bayaer, T.; Bao, Y.; Bao, Y.; Yong, M.; Zhang, X. Temporal and Spatial Changes in Evapotranspiration and Its Potential Driving Factors in Mongolia over the Past 20 Years. Remote Sens. 2022, 14, 1856. [Google Scholar] [CrossRef]
  27. Luo, M.; Meng, F.; Wang, Y.; Sa, C.; Duan, Y.; Bao, Y.; Liu, T. Quantitative detection and attribution of soil moisture heterogeneity and variability in the Mongolian Plateau. J. Hydrol. 2023, 621, 129673. [Google Scholar] [CrossRef]
  28. Wang, J.-F.; Zhang, T.-L.; Fu, B.-J. A measure of spatial stratified heterogeneity. Ecol. Indic. 2016, 67, 250–256. [Google Scholar] [CrossRef]
  29. Sun, S.; Song, Z.; Chen, X.; Wang, T.; Zhang, Y.; Zhang, D.; Zhang, H.; Hao, Q.; Chen, B. Multimodel-based analyses of evapotranspiration and its controls in China over the last three decades. Ecohydrology 2020, 13, e2195. [Google Scholar] [CrossRef]
  30. Ahmadi, A.; Daccache, A.; Snyder, R.L.; Suvočarev, K. Meteorological driving forces of reference evapotranspiration and their trends in California. Sci. Total Environ. 2022, 849, 157823. [Google Scholar] [CrossRef]
  31. Tong, X.; Brandt, M.; Yue, Y.; Horion, S.; Wang, K.; Keersmaecker, W.D.; Tian, F.; Schurgers, G.; Xiao, X.; Luo, Y.; et al. Increased vegetation growth and carbon stock in China karst via ecological engineering. Nat. Sustain. 2018, 1, 44–50. [Google Scholar] [CrossRef]
  32. Qiao, Y.; Jiang, Y.; Zhang, C. Contribution of karst ecological restoration engineering to vegetation greening in southwest China during recent decade. Ecol. Indic. 2021, 121, 107081. [Google Scholar] [CrossRef]
  33. Zhang, Y.; Kong, D.; Gan, R.; Chiew, F.H.S.; McVicar, T.R.; Zhang, Q.; Yang, Y. Coupled estimation of 500 m and 8-day resolution global evapotranspiration and gross primary production in 2002–2017. Remote Sens. Environ. 2019, 222, 165–182. [Google Scholar] [CrossRef]
  34. Leuning, R.; Zhang, Y.; Rajaud, A.; Cleugh, H.; Tu, K. A simple surface conductance model to estimate regional evaporation using MODIS leaf area index and the Penman-Monteith equation. Water Resour. Res. 2008, 44, W10419. [Google Scholar] [CrossRef]
  35. Gan, R.; Zhang, Y.; Shi, H.; Yang, Y.; Eamus, D.; Cheng, L.; Chiew, F.H.S.; Yu, Q. Use of satellite leaf area index estimating evapotranspiration and gross assimilation for Australian ecosystems. Ecohydrology 2018, 11, e1974. [Google Scholar] [CrossRef]
  36. He, S.; Zhang, Y.; Ma, N.; Tian, J.; Kong, D.; Liu, C. A daily and 500 m coupled evapotranspiration and gross primary production product across China during 2000–2020. Earth Syst. Sci. Data 2022, 14, 5463–5488. [Google Scholar]
  37. Li, C.; Zhang, Y.; Shen, Y.; Yu, Q. Decadal water storage decrease driven by vegetation changes in the Yellow River Basin. Sci. Bull. 2020, 65, 1859–1861. [Google Scholar] [CrossRef] [PubMed]
  38. Hutchinson, M.F.; Xu, T. Anusplin version 4.2 user guide. In Centre for Resource and Environmental Studies; The Australian National University: Canberra, Australia, 2004; Volume 54. [Google Scholar]
  39. Zhou, J.; Jia, L.; Menenti, M. Reconstruction of global MODIS NDVI time series: Performance of Harmonic ANalysis of Time Series (HANTS). Remote Sens. Environ. 2015, 163, 217–228. [Google Scholar] [CrossRef]
  40. Wu, G.; Lu, X.; Zhao, W.; Cao, R.; Xie, W.; Wang, L.; Wang, Q.; Song, J.; Gao, S.; Li, S.; et al. The increasing contribution of greening to the terrestrial evapotranspiration in China. Ecol. Model. 2023, 477, 110273. [Google Scholar] [CrossRef]
  41. Gocic, M.; Trajkovic, S. Analysis of changes in meteorological variables using Mann-Kendall and Sen’s slope estimator statistical tests in Serbia. Glob. Planet. Chang. 2013, 100, 172–182. [Google Scholar] [CrossRef]
  42. Tegos, A.; Tyralis, H.; Koutsoyiannis, D.; Hamed, K. An R function for the estimation of trend significance under the scaling hypothesis-application in PET parametric annual time series. Open Water J. 2017, 4, 6. [Google Scholar]
  43. Song, Y.; Wang, J.; Ge, Y.; Xu, C. An optimal parameters-based geographical detector model enhances geographic characteristics of explanatory variables for spatial heterogeneity analysis: Cases with different types of spatial data. GIScience Remote Sens. 2020, 57, 593–610. [Google Scholar] [CrossRef]
  44. Hussien, K.; Kebede, A.; Mekuriaw, A.; Beza, S.A.; Erena, S.H. Spatiotemporal trends of NDVI and its response to climate variability in the Abbay River Basin, Ethiopia. Heliyon 2023, 9, e14113. [Google Scholar] [CrossRef] [PubMed]
  45. Adeyeri, O.E.; Ishola, K.A. Variability and Trends of Actual Evapotranspiration over West Africa: The Role of Environmental Drivers. Agric. For. Meteorol. 2021, 308–309, 108574. [Google Scholar] [CrossRef]
  46. Wang, Q.; Wang, X.; Zhou, Y.; Liu, D.; Wang, H. The dominant factors and influence of urban characteristics on land surface temperature using random forest algorithm. Sustain. Cities Soc. 2022, 79, 103722. [Google Scholar] [CrossRef]
  47. Liu, Q.; Liu, L.; Zhang, Y.; Wang, Z.; Wu, J.; Li, L.; Li, S.; Paudel, B. Identification of impact factors for differentiated patterns of NDVI change in the headwater source region of Brahmaputra and Indus, Southwestern Tibetan Plateau. Ecol. Indic. 2021, 125, 107604. [Google Scholar] [CrossRef]
  48. Zhang, J.; Yang, S.; Yang, S.; Fan, L.; Zhou, X. Spatio-Temporal Variations of Ecosystem Water Use Efficiency and Its Drivers in Southwest China. Land 2023, 12, 397. [Google Scholar] [CrossRef]
  49. Peng, D.; Zhou, Q.; Tang, X.; Yan, W.; Chen, M. Changes in soil moisture caused solely by vegetation restoration in the karst region of southwest China. J. Hydrol. 2022, 613, 128460. [Google Scholar] [CrossRef]
  50. Sun, X.; Lai, P.; Wang, S.; Song, L.; Ma, M.; Han, X. Monitoring of Extreme Agricultural Drought of the Past 20 Years in Southwest China Using GLDAS Soil Moisture. Remote Sens. 2022, 14, 1323. [Google Scholar] [CrossRef]
  51. Ding, Y.; Wang, Z.; Song, Y.; Zhang, J. The unprecedented freezing disaster in January 2008 in southern China and its possible association with the global warming. Acta Meteorol. Sin. 2008, 22, 538–558. [Google Scholar]
  52. Allen, R.G.; Pereira, L.S.; Raes, D.; Smith, M. Crop evapotranspiration-Guidelines for computing crop water requirements-FAO Irrigation and drainage paper 56. Fao Rome 1998, 300, D05109. [Google Scholar]
  53. Carter, C.; Liang, S. Comprehensive evaluation of empirical algorithms for estimating land surface evapotranspiration. Agric. For. Meteorol. 2018, 256–257, 334–345. [Google Scholar] [CrossRef]
  54. Mobilia, M.; Schmidt, M.; Longobardi, A. Modelling Actual Evapotranspiration Seasonal Variability by Meteorological Data-Based Models. Hydrology 2020, 7, 50. [Google Scholar] [CrossRef]
  55. Monteith, J.L. Evaporation and environment. In Symposia of the Society for Experimental Biology; Cambridge University Press (CUP): Cambridge, UK, 1965; pp. 205–234. [Google Scholar]
  56. Hou, W.; Gao, J.; Wu, S.; Dai, E. Interannual Variations in Growing-Season NDVI and Its Correlation with Climate Variables in the Southwestern Karst Region of China. Remote Sens. 2015, 7, 11105–11124. [Google Scholar] [CrossRef]
  57. Song, Q.-H.; Braeckevelt, E.; Zhang, Y.-P.; Sha, L.-Q.; Zhou, W.-J.; Liu, Y.-T.; Wu, C.-S.; Lu, Z.-Y.; Klemm, O. Evapotranspiration from a primary subtropical evergreen forest in Southwest China. Ecohydrology 2017, 10, e1826. [Google Scholar] [CrossRef]
  58. Miralles, D.G.; De Jeu, R.A.M.; Gash, J.H.; Holmes, T.R.H.; Dolman, A.J. Magnitude and variability of land evaporation and its components at the global scale. Hydrol. Earth Syst. Sci. 2011, 15, 967–981. [Google Scholar] [CrossRef]
  59. Li, Y.-b.; Shao, J.-a.; Yang, H.; Bai, X.-y. The relations between land use and karst rocky desertification in a typical karst area, China. Environ. Geol. 2009, 57, 621–627. [Google Scholar] [CrossRef]
  60. Ma, Y.-J.; Li, X.-Y.; Liu, L.; Yang, X.-F.; Wu, X.-C.; Wang, P.; Lin, H.; Zhang, G.-H.; Miao, C.-Y. Evapotranspiration and its dominant controls along an elevation gradient in the Qinghai Lake watershed, northeast Qinghai-Tibet Plateau. J. Hydrol. 2019, 575, 257–268. [Google Scholar] [CrossRef]
  61. Pascolini-Campbell, M.; Reager, J.T.; Chandanpurkar, H.A.; Rodell, M. A 10 per cent increase in global land evapotranspiration from 2003 to 2019. Nature 2021, 593, 543–547. [Google Scholar] [CrossRef]
  62. Fu, J.; Gong, Y.; Zheng, W.; Zou, J.; Zhang, M.; Zhang, Z.; Qin, J.; Liu, J.; Quan, B. Spatial-temporal variations of terrestrial evapotranspiration across China from 2000 to 2019. Sci. Total Environ. 2022, 825, 153951. [Google Scholar] [CrossRef]
  63. Shao, R.; Shao, W.; Gu, C.; Zhang, B. Increased Interception Induced by Vegetation Restoration Counters Ecosystem Carbon and Water Exchange Efficiency in China. Earth’s Future 2022, 10, e2021EF002464. [Google Scholar] [CrossRef]
  64. Wang, K.; Zhang, C.; Chen, H.; Yue, Y.; Zhang, W.; Zhang, M.; Qi, X.; Fu, Z. Karst landscapes of China: Patterns, ecosystem processes and services. Landsc. Ecol. 2019, 34, 2743–2763. [Google Scholar] [CrossRef]
  65. Zhang, X.; Yue, Y.; Tong, X.; Wang, K.; Qi, X.; Deng, C.; Brandt, M. Eco-engineering controls vegetation trends in southwest China karst. Sci. Total Environ. 2021, 770, 145160. [Google Scholar] [CrossRef] [PubMed]
  66. Ferguson, C.R.; Sheffield, J.; Wood, E.F.; Gao, H. Quantifying uncertainty in a remote sensing-based estimate of evapotranspiration over continental USA. Int. J. Remote Sens. 2010, 31, 3821–3865. [Google Scholar] [CrossRef]
  67. Vinukollu, R.K.; Meynadier, R.; Sheffield, J.; Wood, E.F. Multi-model, multi-sensor estimates of global evapotranspiration: Climatology, uncertainties and trends. Hydrol. Process. 2011, 25, 3993–4010. [Google Scholar] [CrossRef]
  68. Chang, X.; Wang, Z.; Wei, F.; Xiao, P.; Shen, Z.; Lv, X.; Shi, Y. Determining the Contributions of Vegetation and Climate Change to Ecosystem WUE Variation over the Last Two Decades on the Loess Plateau, China. Forests 2021, 12, 1442. [Google Scholar] [CrossRef]
  69. Chen, J.; Gao, X.; Ji, Y.; Luo, Y.; Yan, L.; Fan, Y.; Tan, D. China’s Greening Modulated the Reallocation of the Evapotranspiration Components during 2001–2020. Remote Sens. 2022, 14, 6327. [Google Scholar]
  70. Guo, X.; Wu, Z.; He, H.; Xu, Z. Evaluating the Potential of Different Evapotranspiration Datasets for Distributed Hydrological Model Calibration. Remote Sens. 2022, 14, 629. [Google Scholar] [CrossRef]
  71. Chao, L.; Zhang, K.; Wang, J.; Feng, J.; Zhang, M. A Comprehensive Evaluation of Five Evapotranspiration Datasets Based on Ground and GRACE Satellite Observations: Implications for Improvement of Evapotranspiration Retrieval Algorithm. Remote Sens. 2021, 13, 2414. [Google Scholar] [CrossRef]
  72. Qing-ling, S.; Xian-feng, F.; Yong, G.; Bao-lin, L. Topographical effects of climate data and their impacts on the estimation of net primary productivity in complex terrain: A case study in Wuling mountainous area, China. Ecol. Inform. 2015, 27, 44–54. [Google Scholar] [CrossRef]
  73. Wang, L.; Good, S.P.; Caylor, K.K. Global synthesis of vegetation control on evapotranspiration partitioning. Geophys. Res. Lett. 2014, 41, 6753–6757. [Google Scholar] [CrossRef]
  74. Babaeian, E.; Paheding, S.; Siddique, N.; Devabhaktuni, V.K.; Tuller, M. Short- and mid-term forecasts of actual evapotranspiration with deep learning. J. Hydrol. 2022, 612, 128078. [Google Scholar] [CrossRef]
  75. Xiao, Y.; Xiao, Q.; Sun, X. Ecological Risks Arising from the Impact of Large-scale Afforestation on the Regional Water Supply Balance in Southwest China. Sci. Rep. 2020, 10, 4150. [Google Scholar] [CrossRef] [PubMed]
Figure 1. (a) Location of the study area in China. (b) Spatial distribution patterns of landform types, (c) elevation, (d) slope, (e) aspect, (f) average annual temperature, (g) total annual precipitation, (h) total annual sunshine duration, (i) average annual enhanced vegetation index (EVI) in the study area.
Remotesensing 15 04418 g001
Figure 2. Spatial distribution pattern of ET annual average in the study area from 2003 to 2020. Statistics of longitude, latitude, and elevation are presented in the bottom, left, and right panels, respectively.
Remotesensing 15 04418 g002
Figure 3. Temporal trends in ET in the study area from 2000 to 2019.
Remotesensing 15 04418 g003
Figure 4. Spatial distribution of (a) ET trends and (b) their significance test in the study area from 2003–2020. SI: significant increase; NSI: nonsignificant increase; NSD: nonsignificant decrease; SD: significant decrease.
Remotesensing 15 04418 g004
Figure 5. q values of various factors influencing spatial distribution pattern of multi-year mean ET in the study area.
Remotesensing 15 04418 g005
Figure 6. Influence of interplay between factors on multi-year mean ET. “+” and “++” indicate the bivariate enhancement and nonlinear enhancement of two factors, respectively.
Remotesensing 15 04418 g006
Figure 7. Partial correlation coefficient between (a) temperature, (b) precipitation, (c) sunshine duration, (d) EVI, and ET. SP: significant positive correlation; NSP: nonsignificant positive correlation; NSN: nonsignificant negative correlation; SN: significant negative correlation.
Remotesensing 15 04418 g007
Figure 8. (a) Spatial distribution of factors inducing variations in ET. (b) Proportion of the study area accounting for the factors dominating ET fluctuations.
Remotesensing 15 04418 g008
Disclaimer/Publisher’s Note: The statements, opinions and data contained in all publications are solely those of the individual author(s) and contributor(s) and not of MDPI and/or the editor(s). MDPI and/or the editor(s) disclaim responsibility for any injury to people or property resulting from any ideas, methods, instructions or products referred to in the content.

