

Spatio-Temporal Knowledge Graph-Based Research on Agro-Meteorological Disaster Monitoring

 , , and
Abstract
:
1. Introduction
- (1)
- This paper constructs an agro-meteorological disaster monitoring spatio-temporal knowledge graph, facilitating the fusion of multi-source data and knowledge for pre-disaster monitoring and warning, as well as post-disaster impact analysis.
- (2)
- Compared to coarse-grained monitoring at the provincial or county levels, this paper achieves finer-scale monitoring at the level of farmland patches using remote sensing techniques, with warning information sent to specific farmland managers.
- (3)
- This paper realizes the integration of remote sensing data into knowledge inference and calculation processes.
2. Materials and Methods
2.1. Study Area
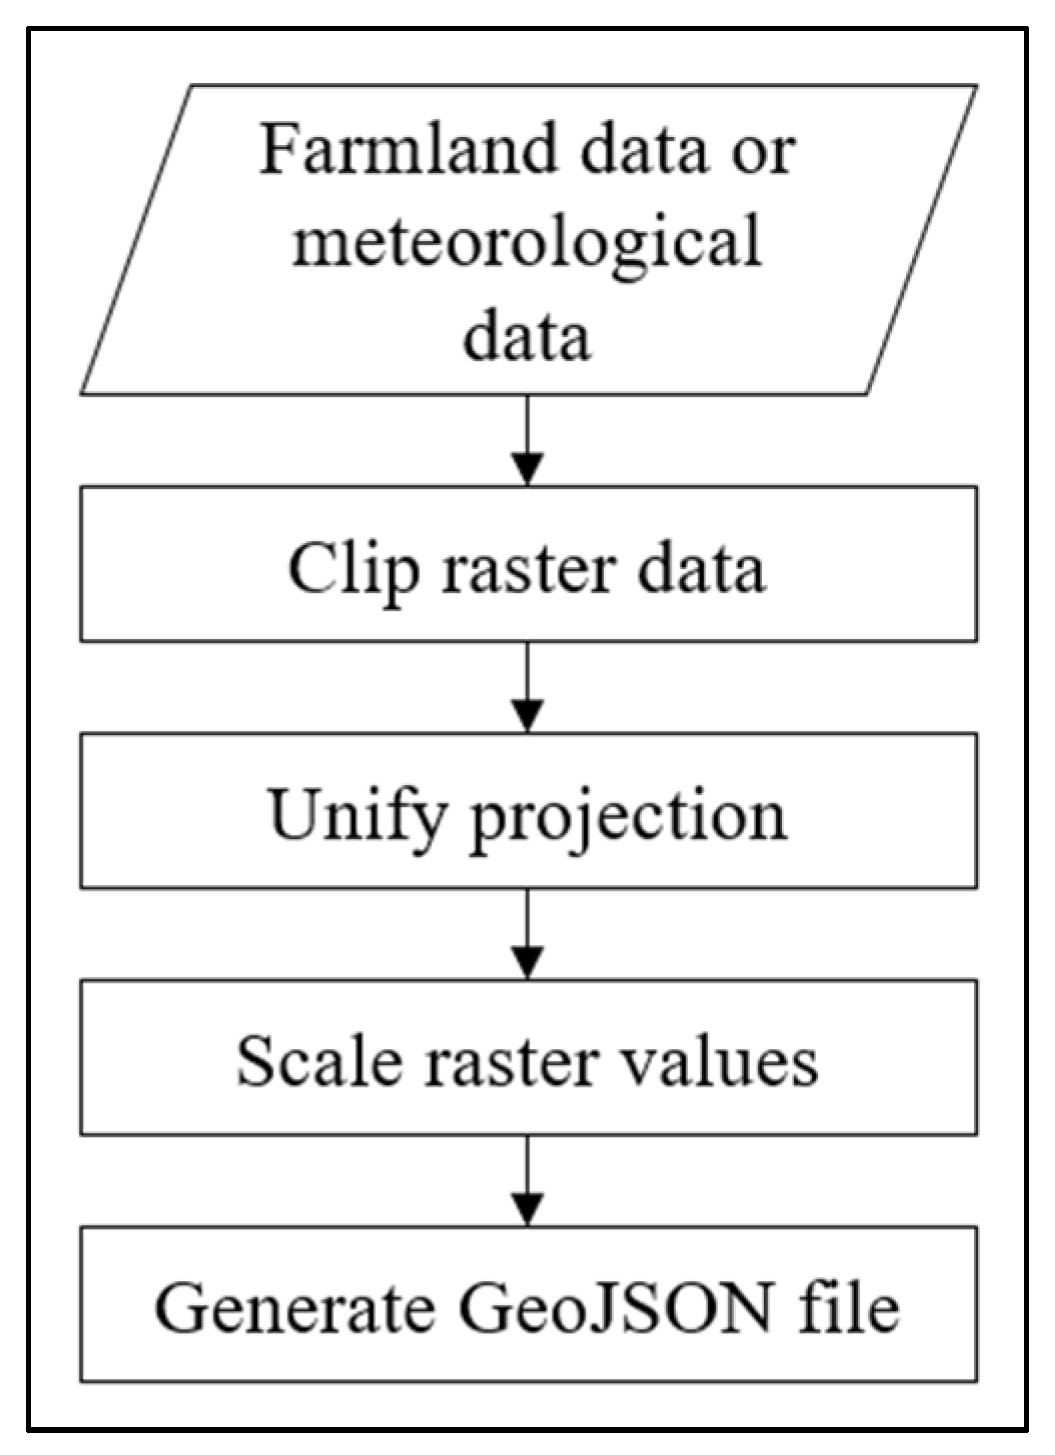
2.2. Data Source
2.3. Spatio-Temporal Knowledge Graph Construction
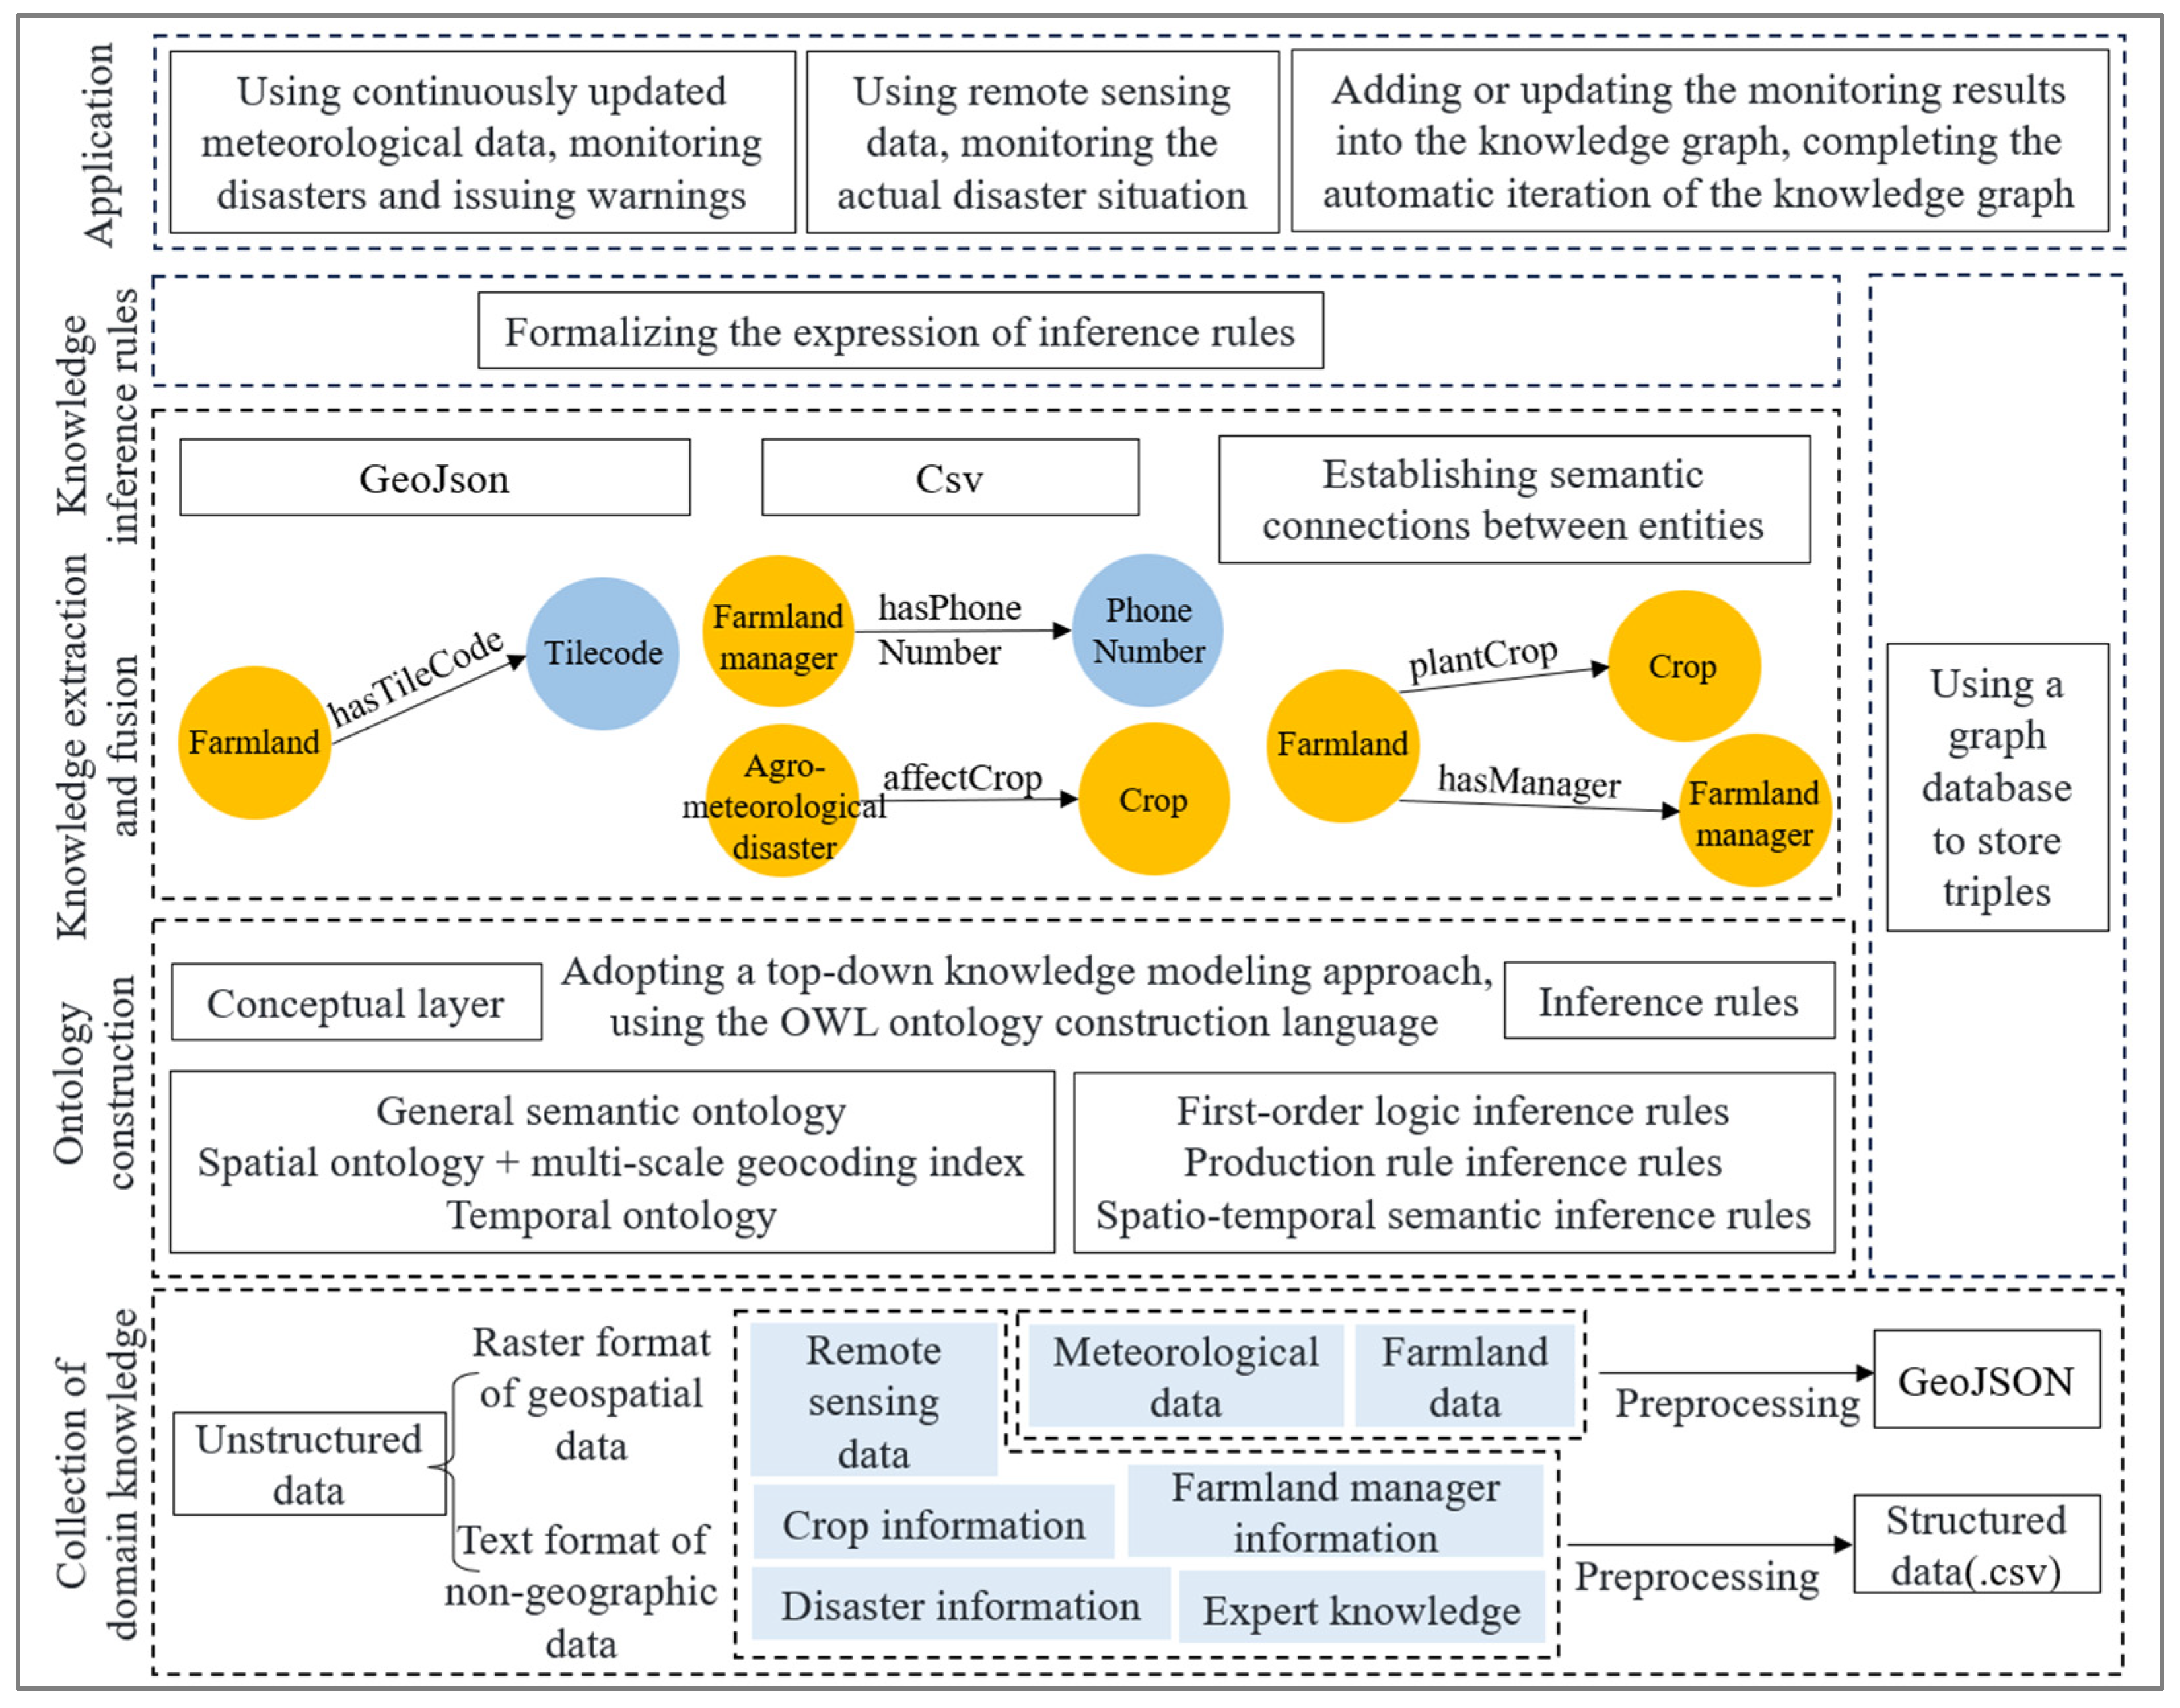
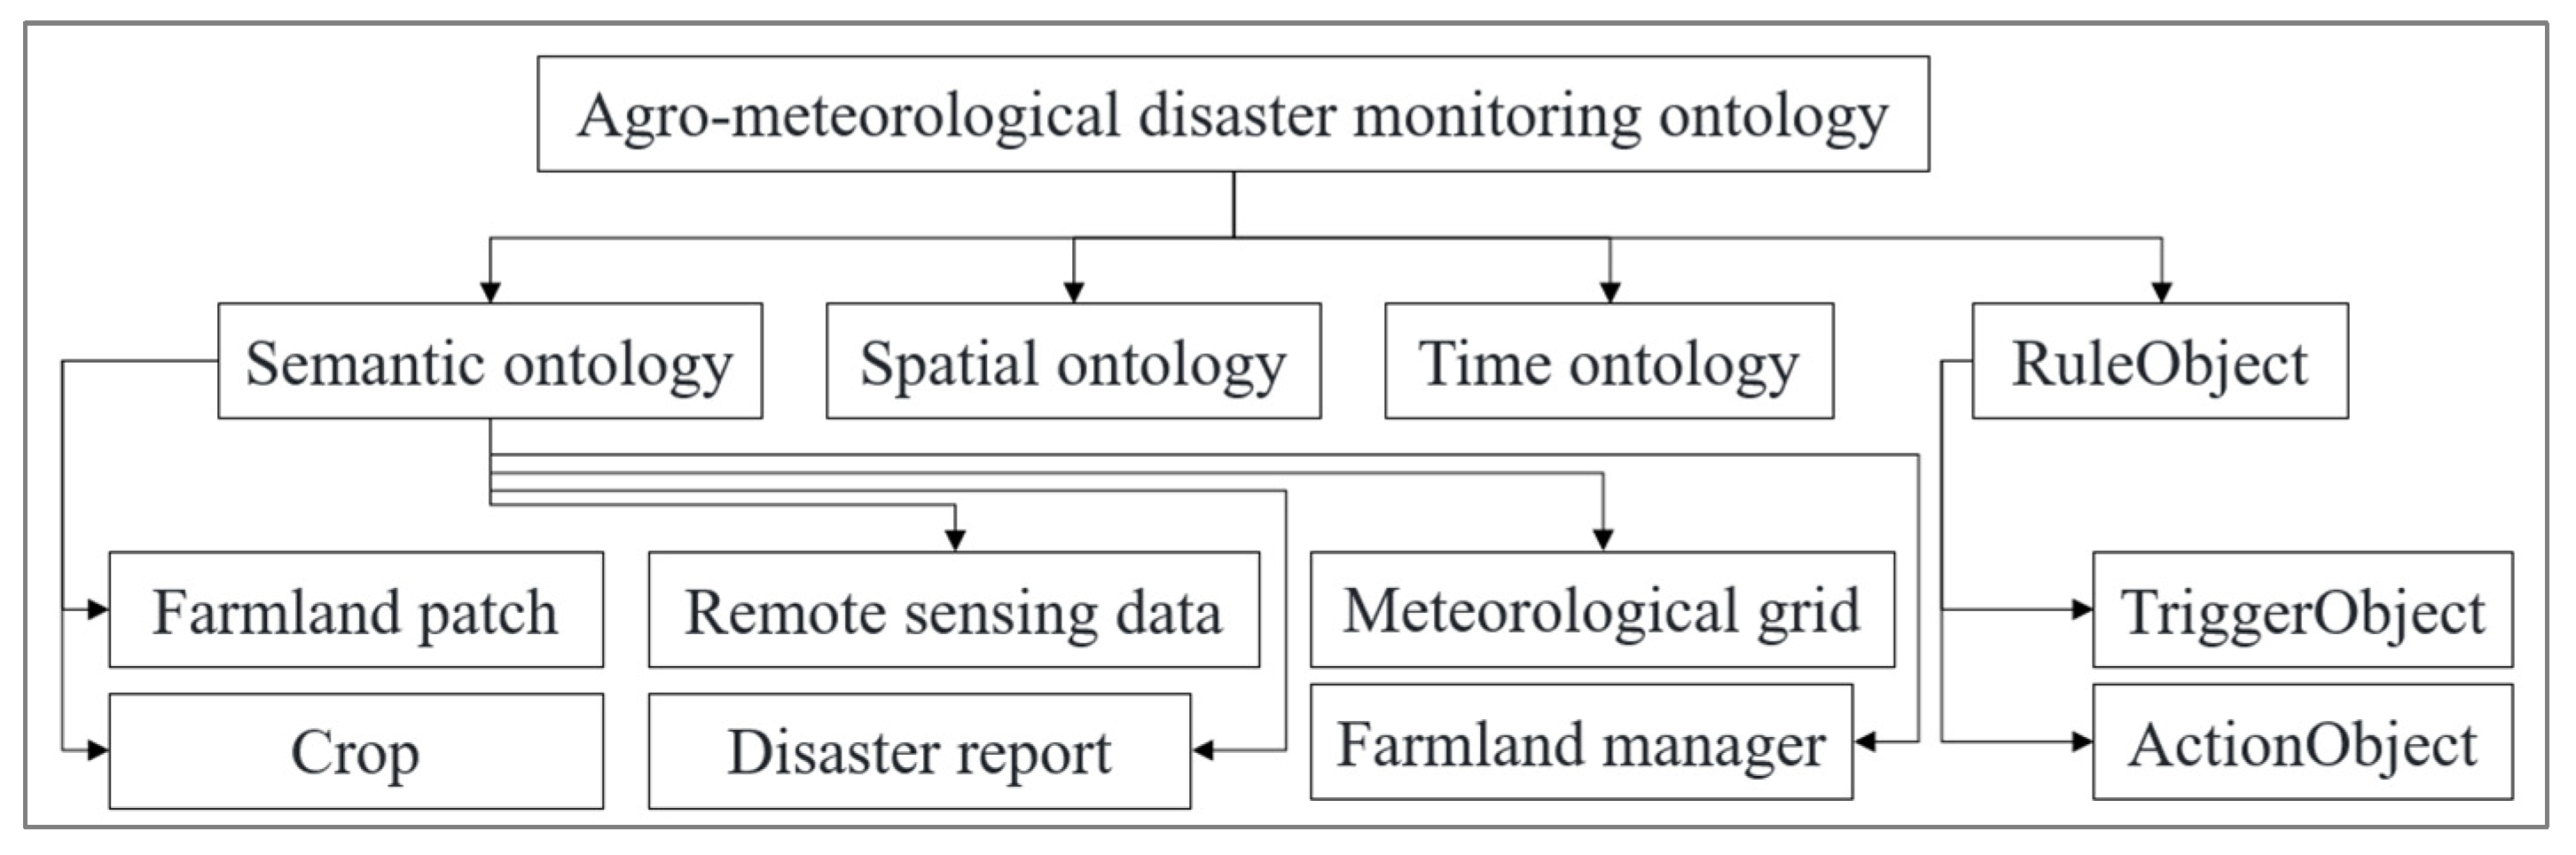
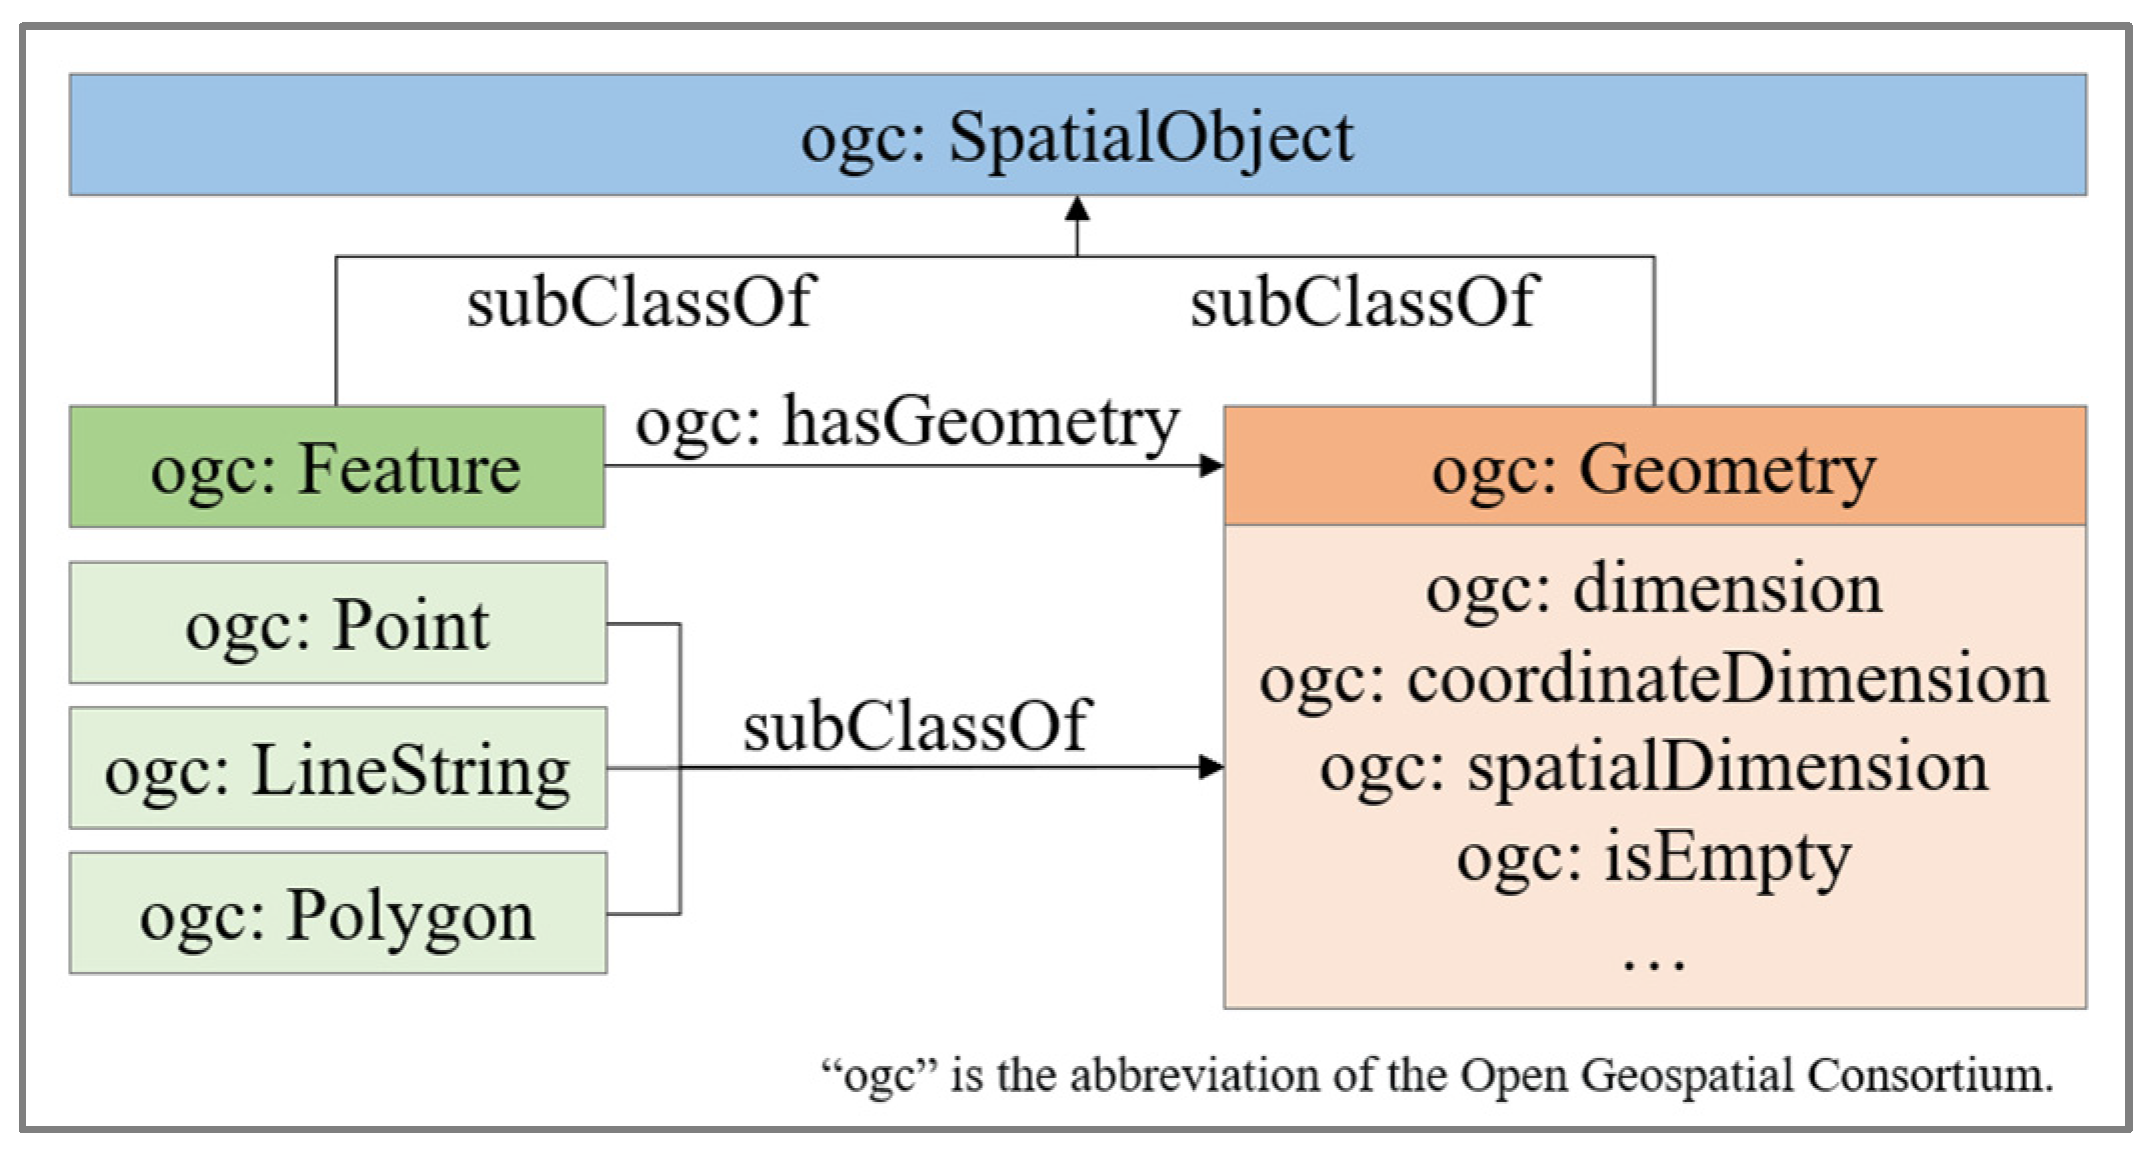
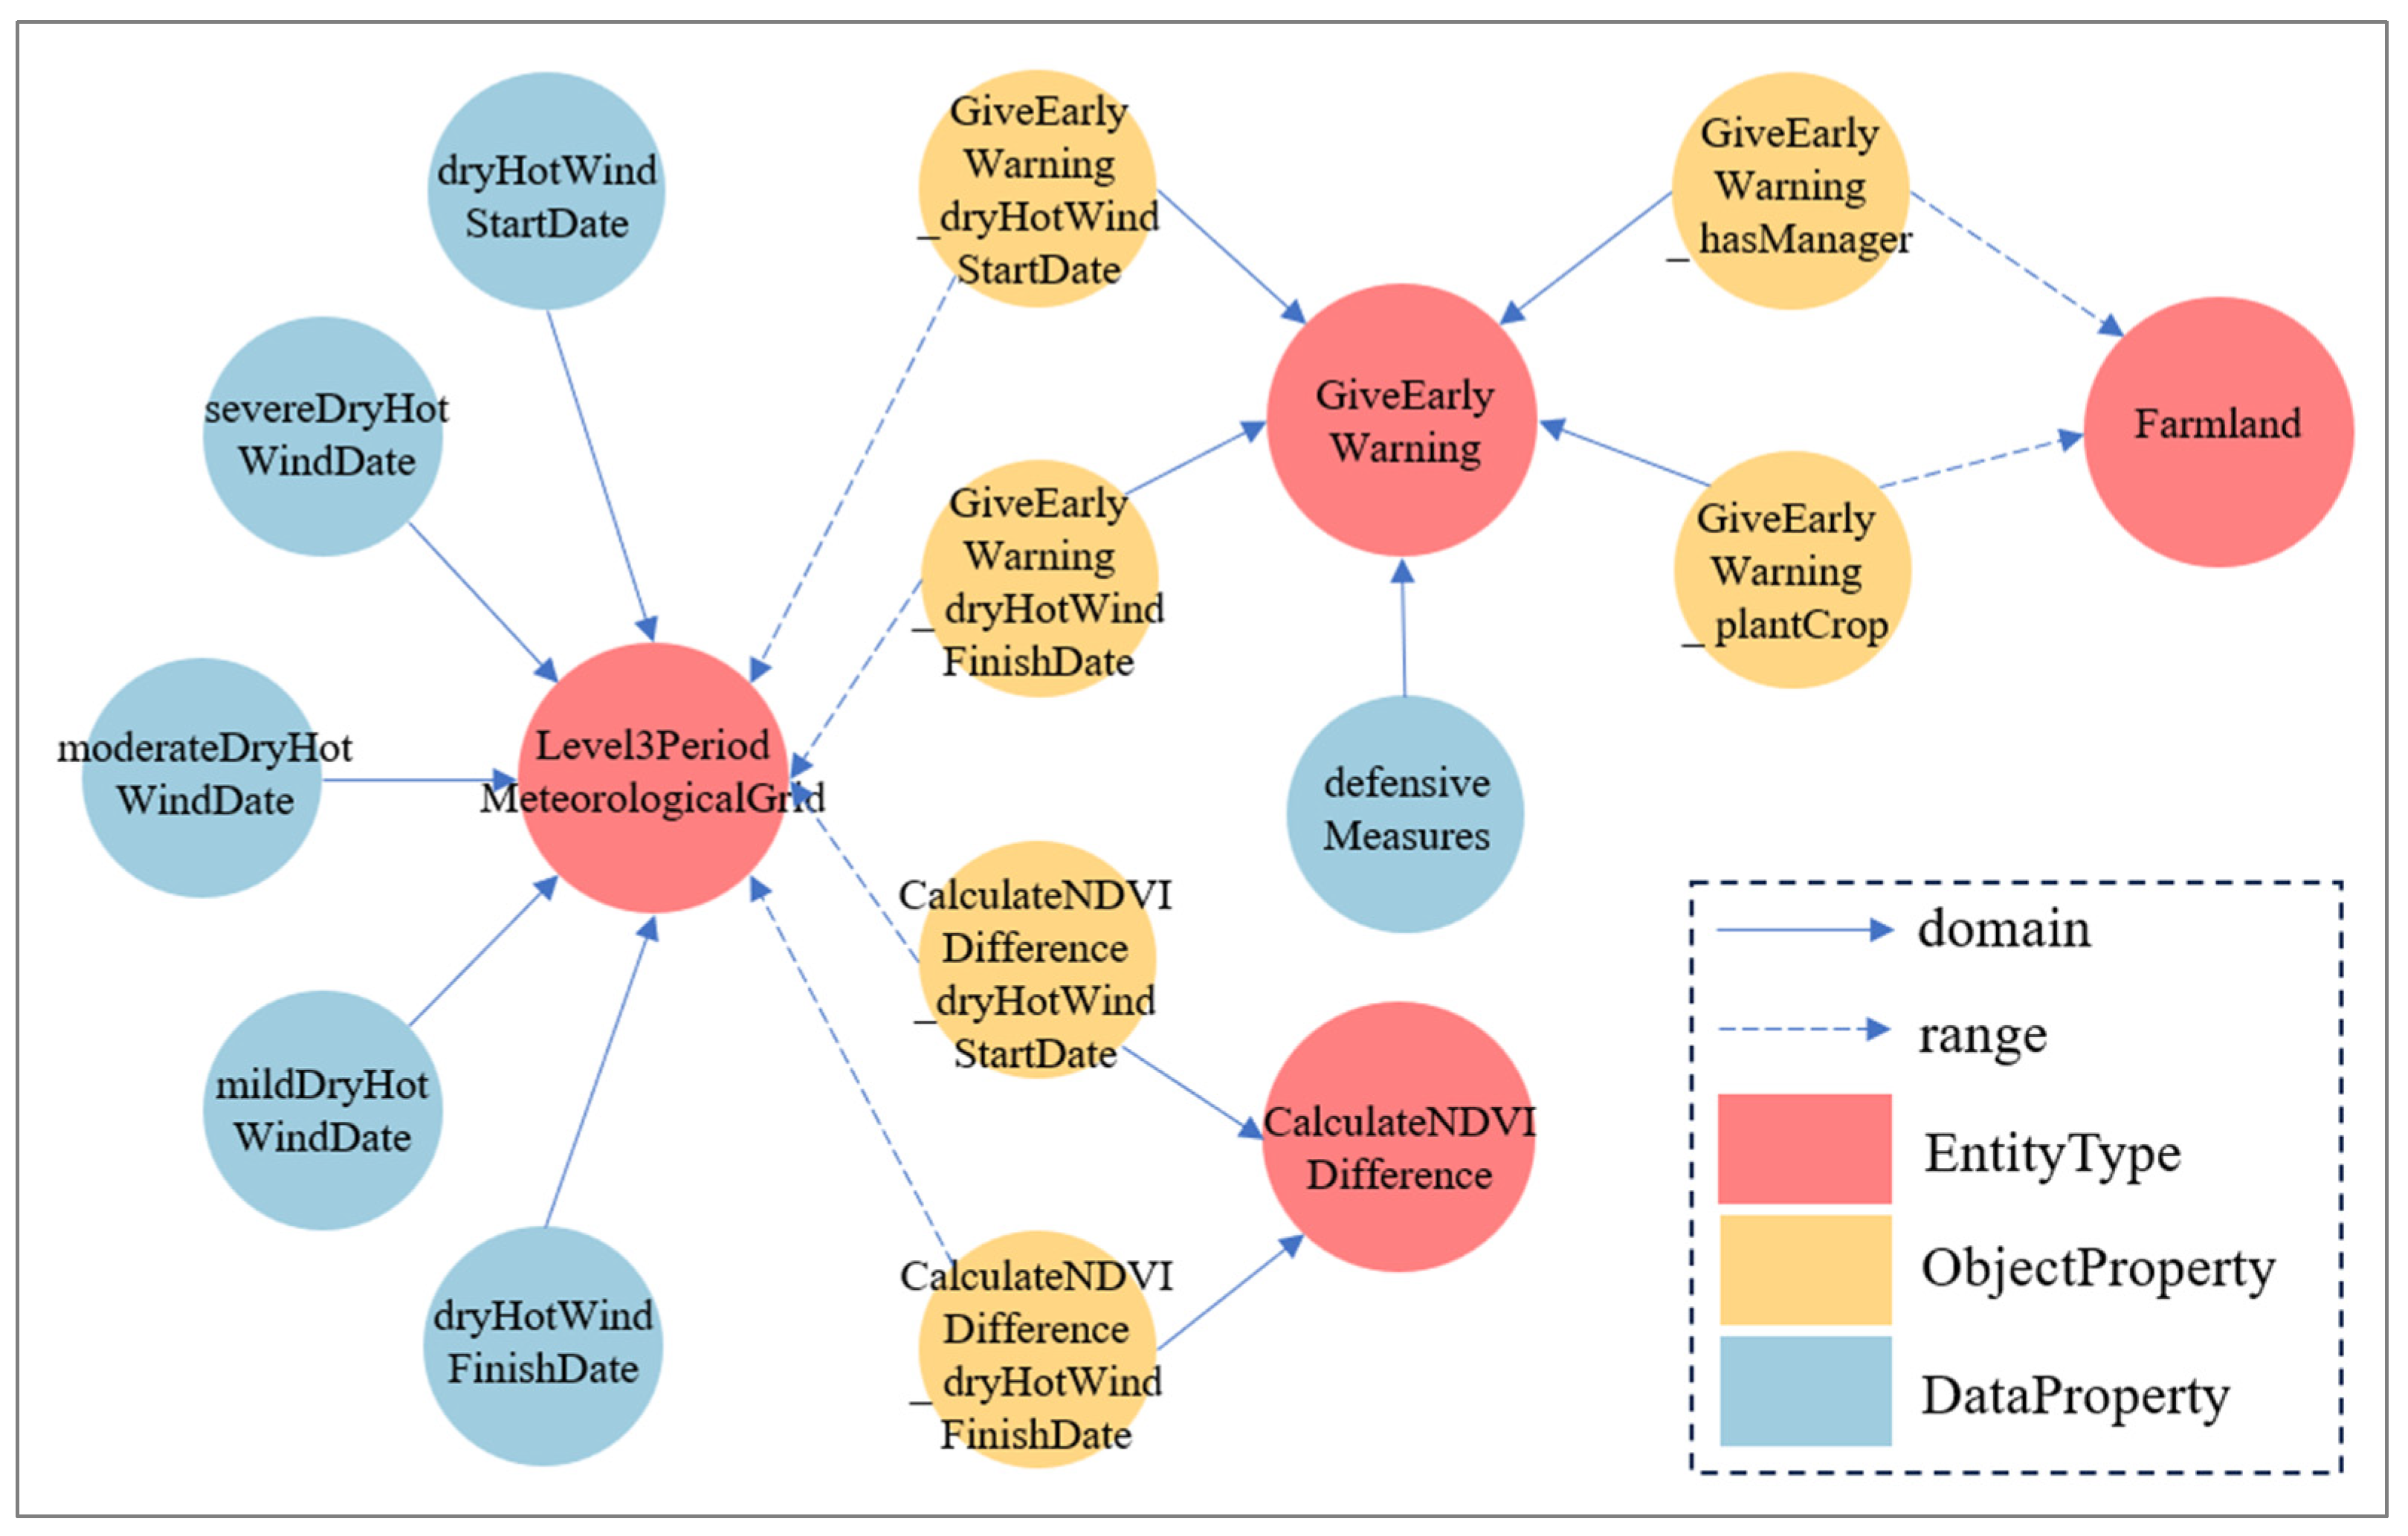
2.3.1. Ontology Construction
2.3.2. Knowledge Extraction
2.3.3. Knowledge Fusion
2.3.4. Monitoring Reasoning Engine
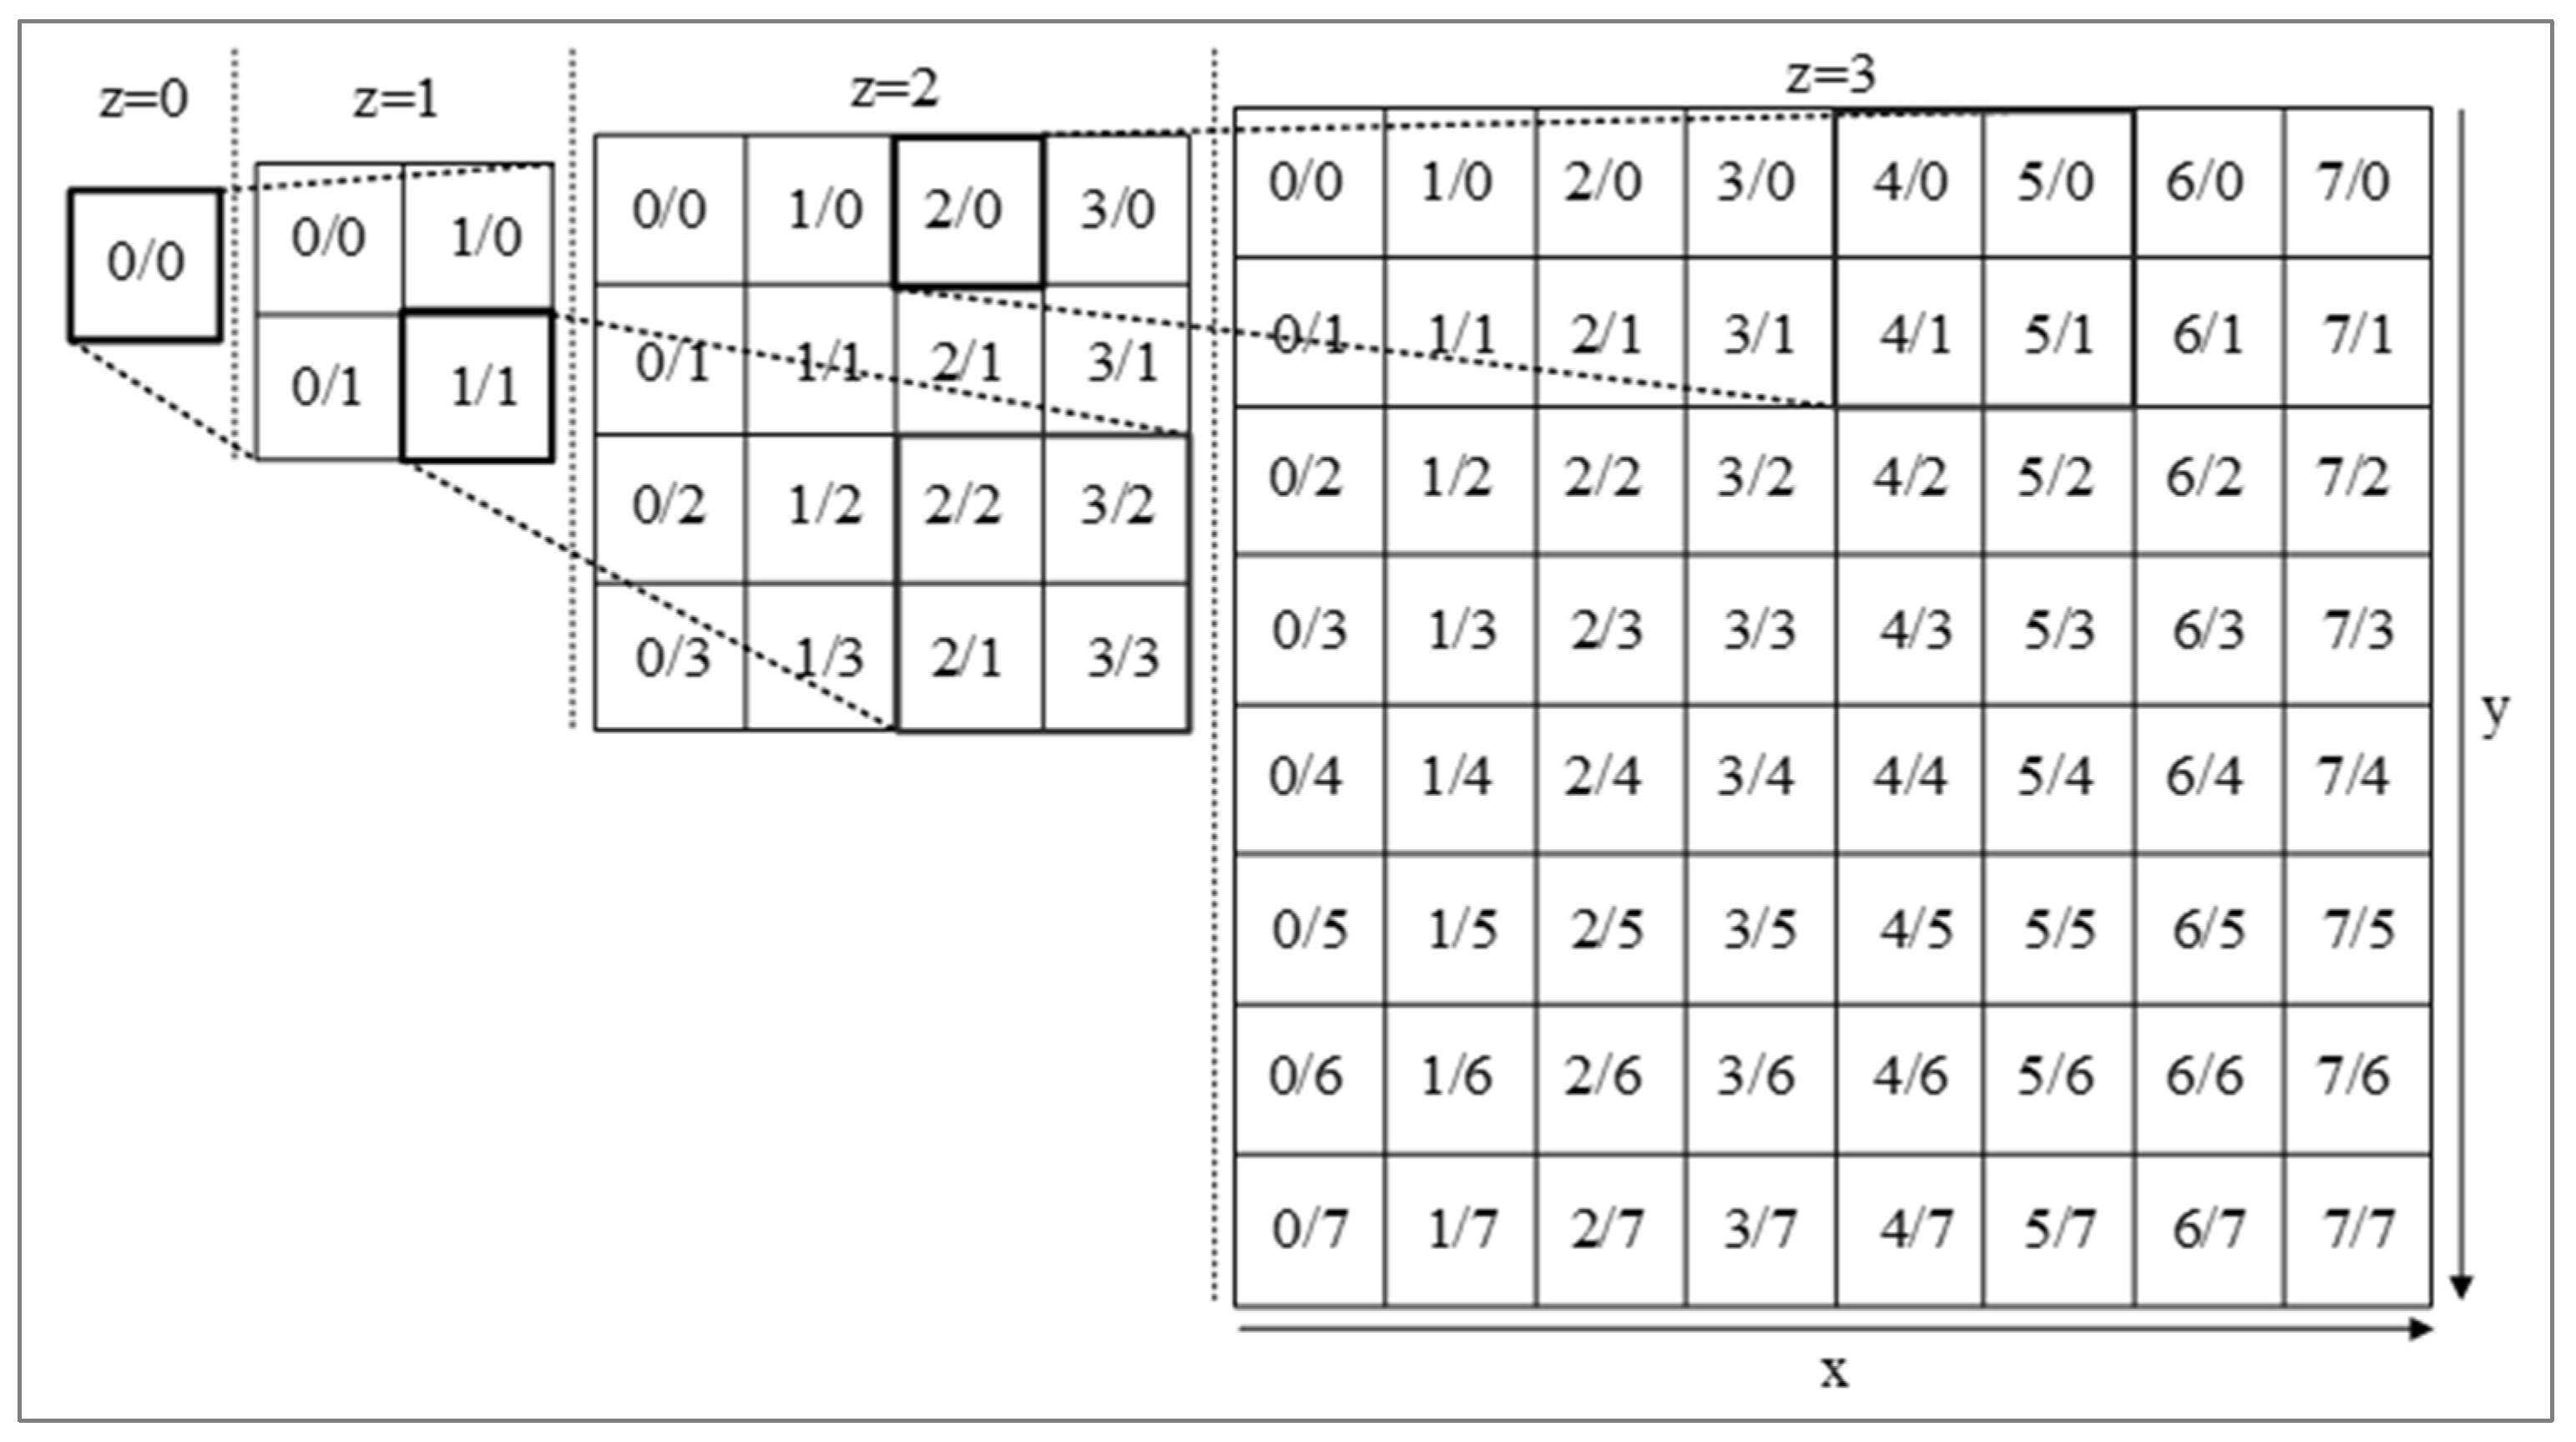
2.3.5. Knowledge Storage
3. Results
3.1. Spatio-Temporal Knowledge Graph
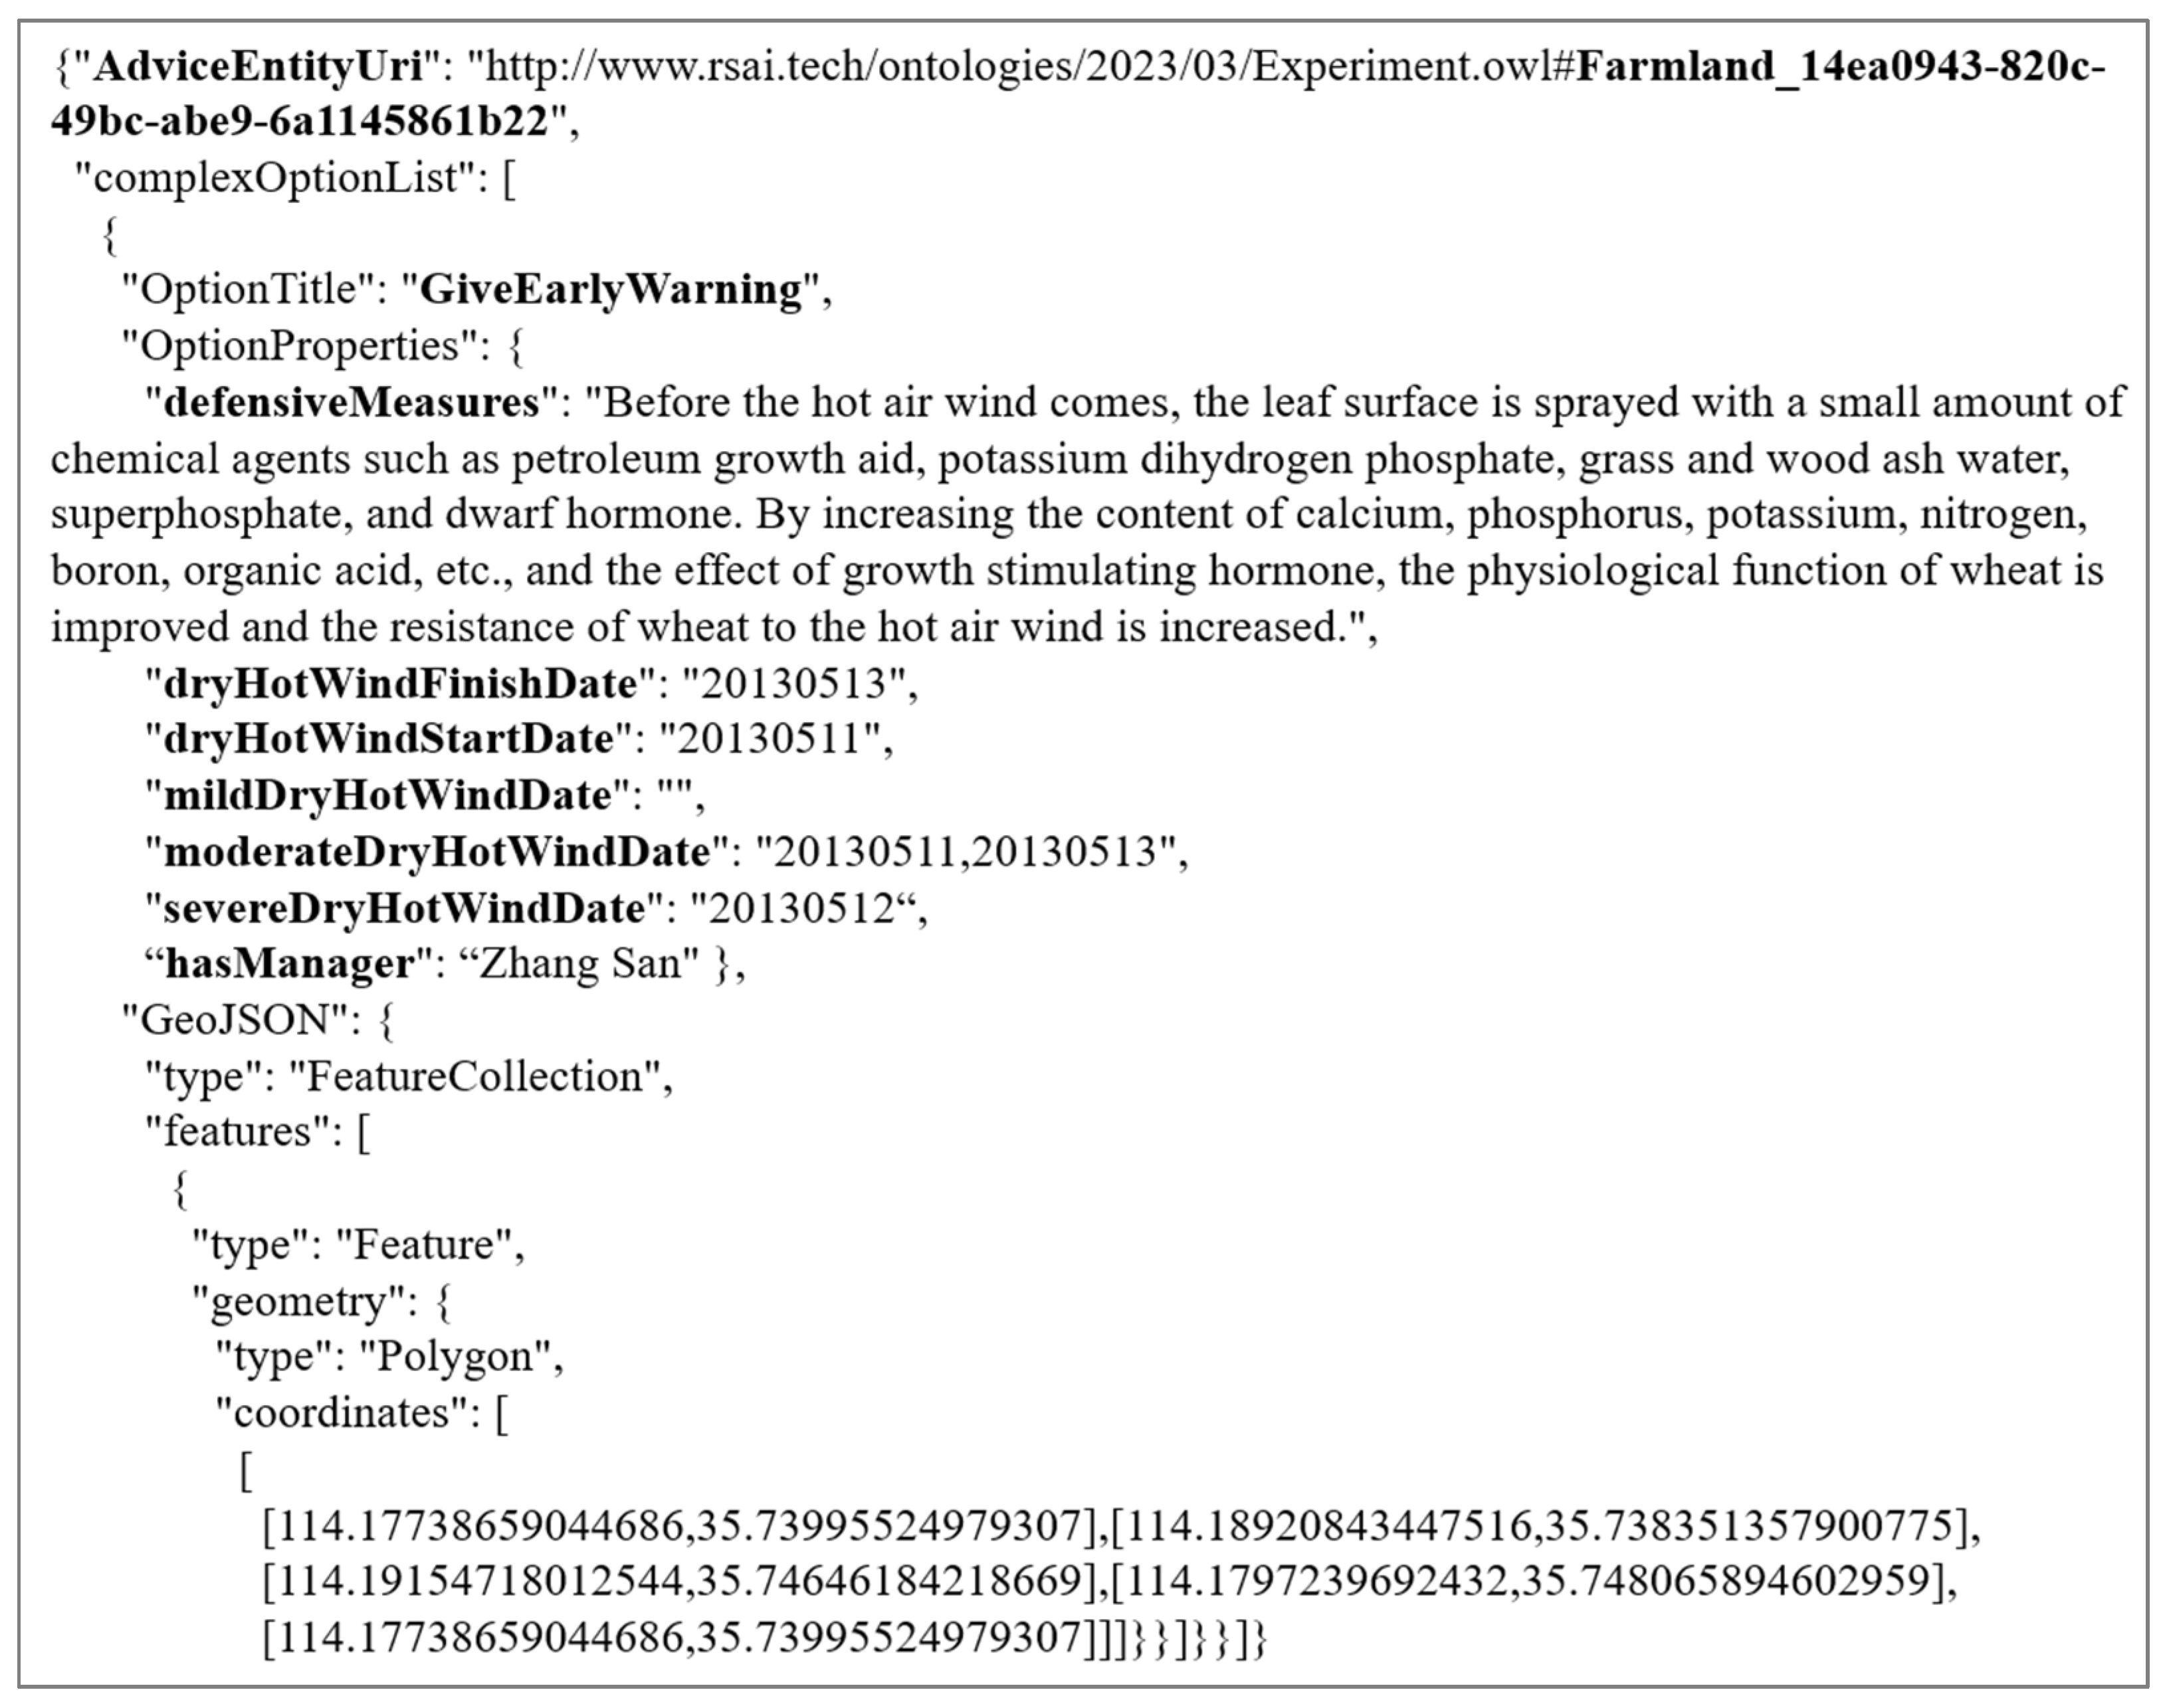
3.2. Pre-Disaster Monitoring Results
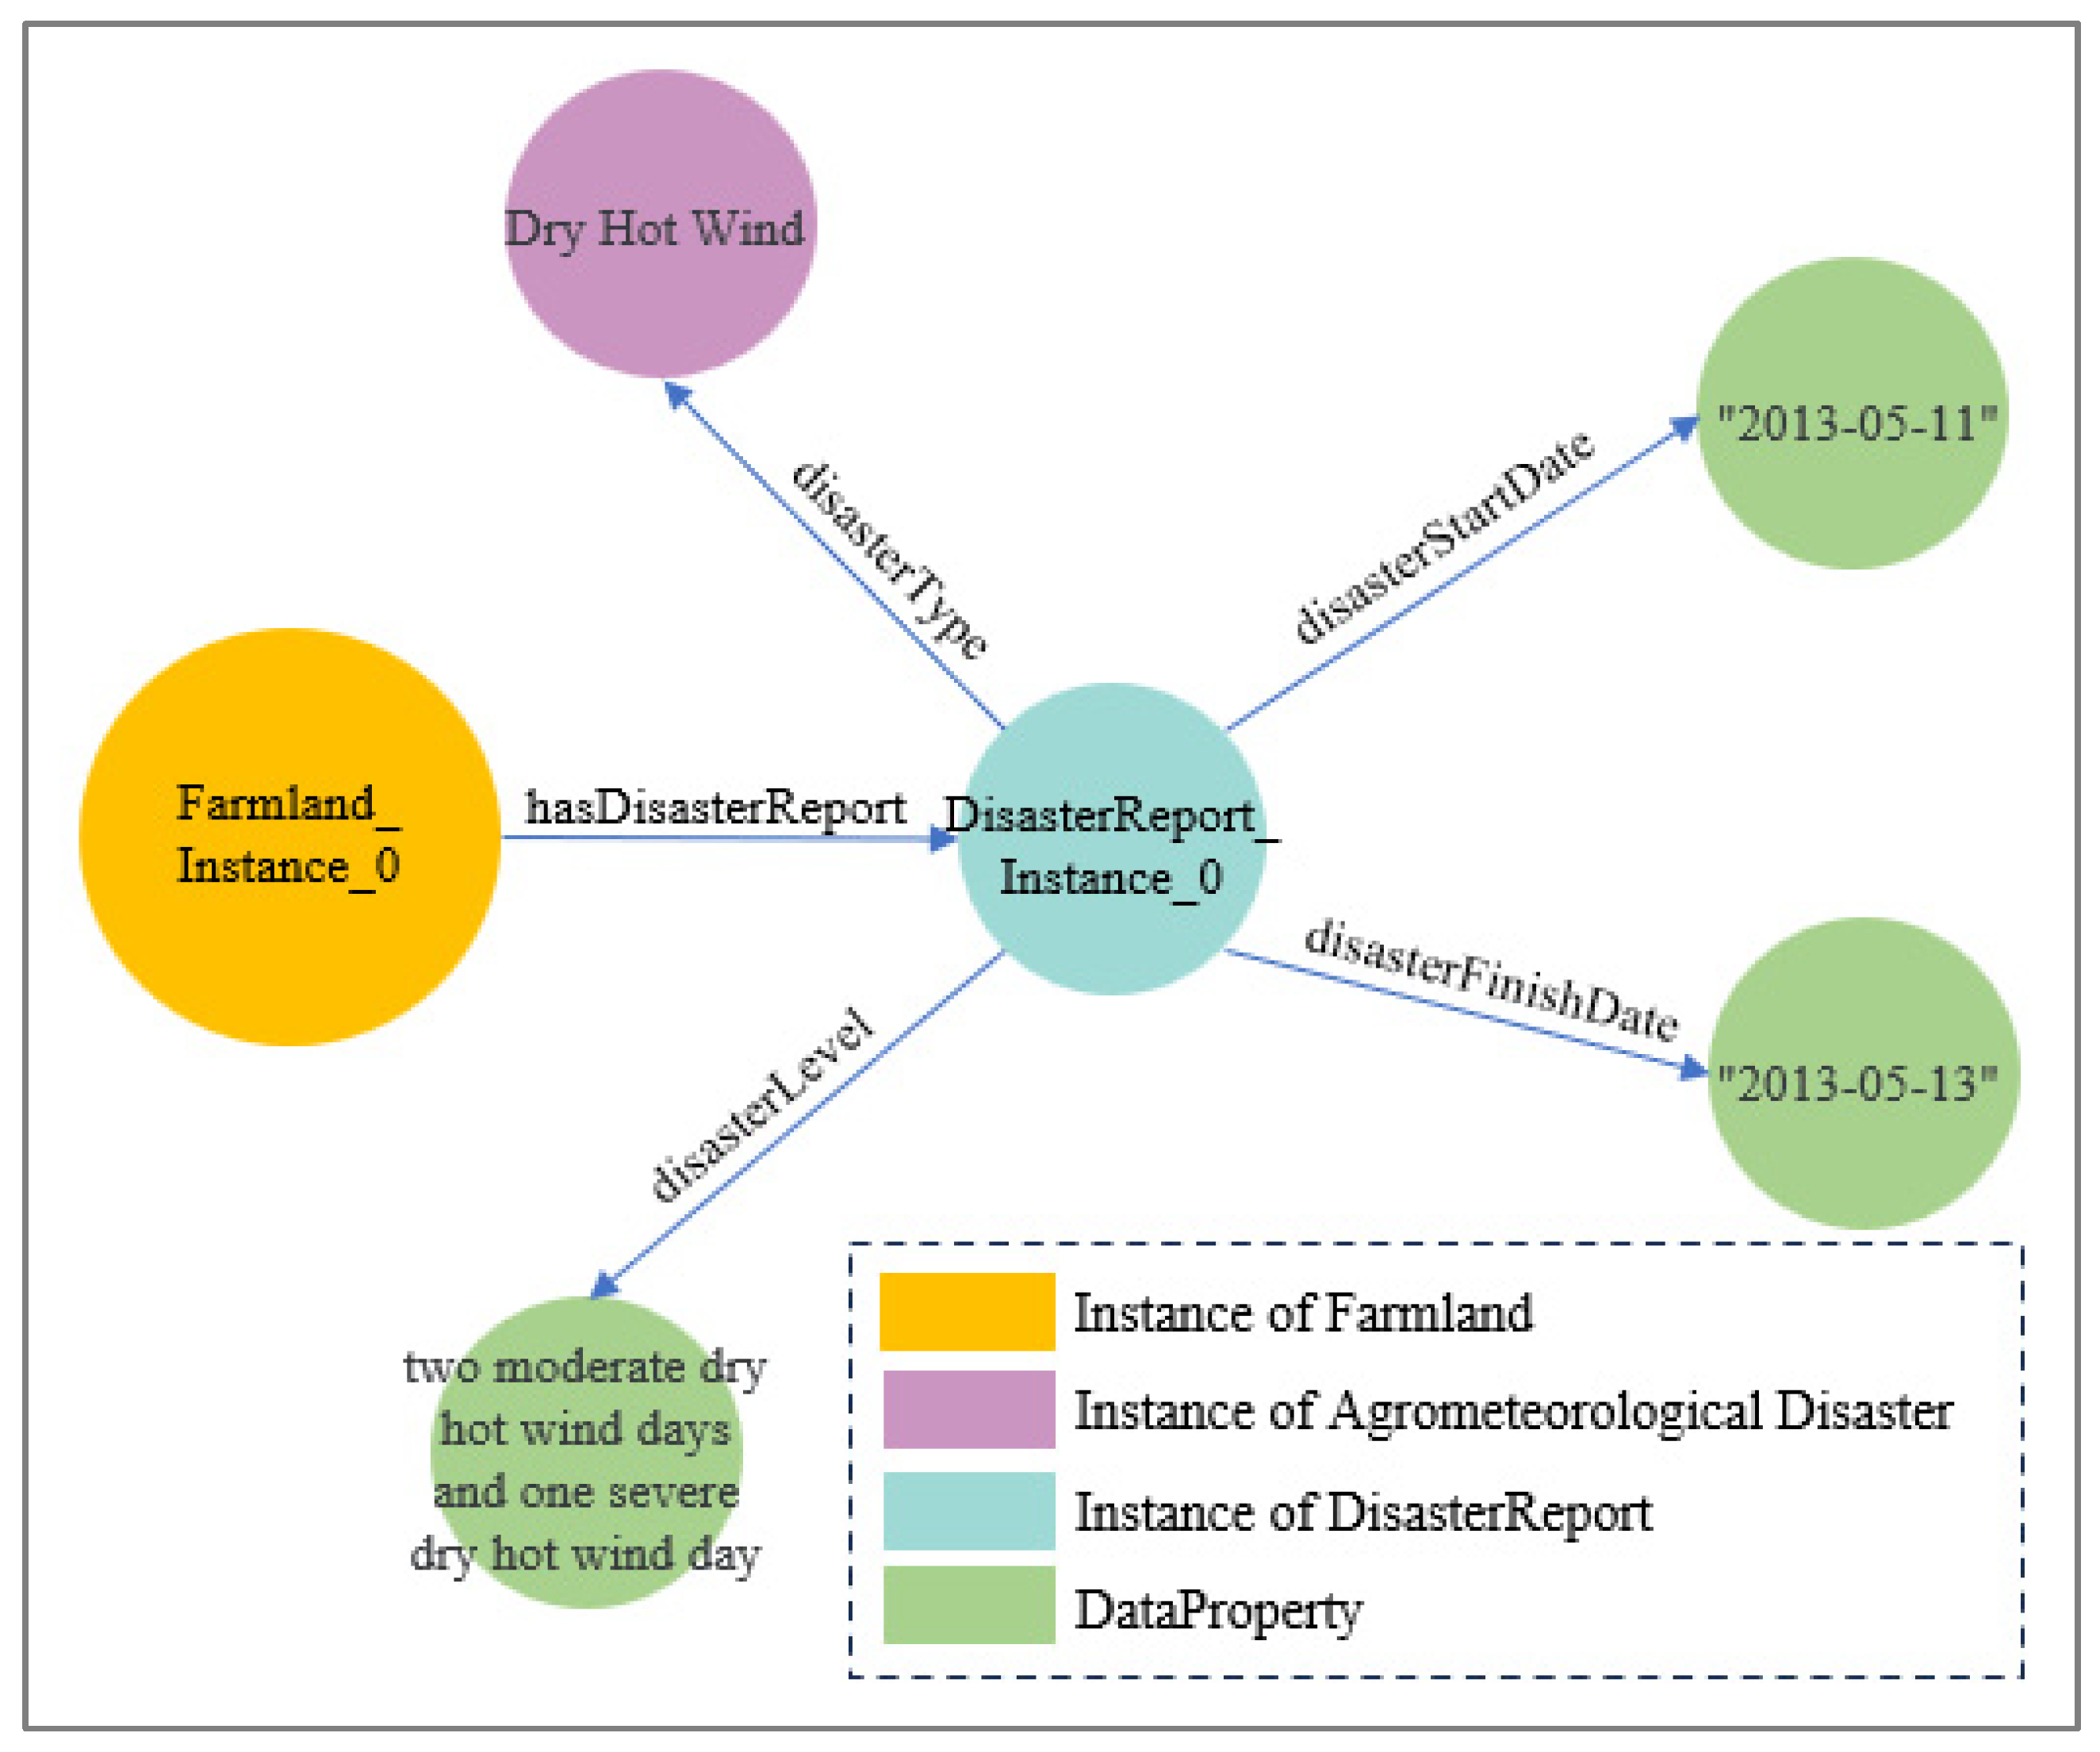
3.3. Post-Disaster Monitoring Results
3.4. Query Results
4. Discussion
5. Conclusions
- (1)
- This paper constructs a spatio-temporal knowledge graph for agro-meteorological disaster monitoring, integrating multiple heterogeneous data sources such as meteorological data, remote sensing data, farmland data, and agricultural knowledge. This enables the integration and intelligent analysis of pre-disaster meteorological disaster monitoring and post-disaster impact analysis driven by data and knowledge cooperation.
- (2)
- This paper uses remote sensing techniques to refine the granularity of meteorological disaster monitoring and warning to the farmland patch level, providing a new approach for fine-grained agricultural management.
- (3)
- This paper incorporates MODIS remote sensing image data directly into knowledge reasoning and computation. MODIS remote sensing data are involved in the daily monitoring process, making full use of the advantages of long-term continuous observation of crop remote sensing data. It explores the synergistic development path of the participation of remote sensing in spatio-temporal knowledge computation and reasoning.
- (4)
- The knowledge graph is supplemented with the results of monitoring, early warning, and evaluation analysis in each iteration as disaster information, achieving automatic iterative updating of the knowledge graph. Over the long term, it naturally becomes an agro-meteorological disaster database.
- (1)
- Regarding historical data, although dry hot wind meteorological disasters occur frequently, have a wide impact range, affect multiple crops, and cause significant losses, detailed and comprehensive statistical data have not yet been formed. In line with the research method proposed in this paper, historical dry hot wind meteorological disaster data could be extracted from national-level historical meteorological data over the past few years, forming a historical dry hot wind disaster database. Using this database, the spatial-temporal patterns of dry hot wind disasters and the relationship between meteorological conditions and NDVI differences can be explored.
- (2)
- Looking towards the future, once issues such as real-time acquisition of meteorological and remote sensing data are resolved, the method proposed in this paper can be directly applied to agro-meteorological disaster monitoring tasks. Additionally, since the warning in this paper relies on meteorological data, the accuracy of meteorological forecast data directly impacts the effectiveness of agro-meteorological disaster warnings. By incorporating the “spatio-temporal patterns of dry hot wind meteorological disasters” mentioned in point (1) as an auxiliary for monitoring and warning, the accuracy of warnings can be improved.
Author Contributions
Funding
Data Availability Statement
Conflicts of Interest
References
- Cheng, C. Climate and Agriculture in China; China Meteorological Press: Beijing, China, 1991. [Google Scholar]
- National Public Service Platform for Standards Information. Available online: https://std.samr.gov.cn/db/search/stdDBDetailed?id=F42D1753A8CC5CAAE05397BE0A0A115E (accessed on 7 August 2023).
- China Meteorological Administration. Available online: https://www.cma.gov.cn/2011xzt/20120816/20130625/2013062506/201307/t20130701_218101.html (accessed on 7 August 2023).
- Lou, W.; Zhu, X.; Zhou, S.; Xue, G.; Cai, J.; Ji, Z. Monitoring and early warning system for agro-ecological and agriculture meteorological disaster in Shaoxing City. Trans. CSAE 2007, 23, 182–186. [Google Scholar] [CrossRef]
- Mo, J.; Zhong, S.; Chen, Y.; Kuang, Z.; He, Y.; Li, L. Development and application of monitoring and early warning system for main agro-meteorological disasters in Guangxi Province. J. Nat. Disasters 2013, 22, 150–157. [Google Scholar] [CrossRef]
- Sun, Z.; Wang, Y.; Zhang, L.; Guo, W. Design and realization of intelligent service system for monitoring and warning of meteorological disasters in facility agriculture in North China. Trans. CSAE 2018, 34, 149–156. [Google Scholar] [CrossRef]
- Xiao, J.; Yao, Y.; Jin, Z.; Li, R.; Yuan, D.; Zhang, H.; Wang, Z. Design and implementation of agro-meteorological service platform based on WebGIS. Meteorol. Environ. Sci. 2017, 40, 132–139. [Google Scholar] [CrossRef]
- Li, Y.; Wei, Y.; Liu, R.; Fang, W.; Cheng, L. Remote sensing monitoring of a dry hot wind disaster in Wheat-Growing Area of Henan Province. Chin. J. Agrometeorol. 2014, 35, 593–599. [Google Scholar] [CrossRef]
- Zhong, S.; Chen, Y.; Liu, J.; Sun, M.; Ding, M.; Kuang, Z. Monitoring and Evaluation Method on Sugarcane Frost Injury Using Multi-sources Remote Sensing Images. Sci. Technol. Eng. 2018, 18, 189–193. [Google Scholar] [CrossRef]
- Lu, F.; Zhu, Y.; Zhang, X. Spatio-temporal knowledge graph: Advances and perspectives. J. Geo-Inf. Sci. 2023, 25, 1091–1105. [Google Scholar] [CrossRef]
- Qi, C.; Song, Q.; Zhang, P.; Yuan, H. Cn-MAKG: China Meteorology and Agriculture Knowledge Graph Construction Based on Semi-structured Data. In Proceedings of the 2018 IEEE/ACIS 17th International Conference on Computer and Information Science (ICIS), Singapore, 6–8 June 2018; pp. 692–696. [Google Scholar] [CrossRef]
- Liu, X.; Bai, X.; Wang, L.; Ren, B.; Lu, S.; Li, L. Review and Trend Analysis of Knowledge Graphs for Crop Pest and Diseases. IEEE Access 2019, 7, 62251–62264. [Google Scholar] [CrossRef]
- Chen, J.; Xu, X.; Zhang, Y.; Zhou, Y.; Wang, H.; Tan, C. Research Progress of Multimodal Knowledge Graph in Agriculture. J. Agric. Big Data 2022, 4, 126–134. [Google Scholar] [CrossRef]
- Wang, D.; Zhou, F.; Li, Y.; Liu, W.; Wang, J.; Zhang, Q.; Cui, D. Study on the construction of knowledge map of sweet cherry industry in China. China Fruits 2023, 1, 104–108. [Google Scholar] [CrossRef]
- Wang, P.; Liu, T.; Du, P.; Yang, G. Analysis on mapping knowledge domain of disaster risk research in China from 2000 to 2017. J. Nat. Disasters 2019, 28, 169–177. [Google Scholar] [CrossRef]
- Ge, X.; Yang, Y.; Chen, J.; Li, W.; Huang, Z.; Zhang, W.; Peng, L. Disaster Prediction Knowledge Graph Based on Multi-Source Spatio-Temporal Information. Remote Sens. 2022, 14, 1214. [Google Scholar] [CrossRef]
- Ge, X.; Yang, Y.; Peng, L.; Chen, L.; Li, W.; Zhang, W.; Chen, J. Spatio-Temporal Knowledge Graph Based Forest Fire Prediction with Multi Source Heterogeneous Data. Remote Sens. 2022, 14, 3496. [Google Scholar] [CrossRef]
- Chen, L.; Ge, X.; Yang, L.; Li, W.; Peng, L. An Improved Multi-Source Data-Driven Landslide Prediction Method Based on Spatio-Temporal Knowledge Graph. Remote Sens. 2023, 15, 2126. [Google Scholar] [CrossRef]
- Huo, Z.; Shang, Y.; Wu, D.; Wu, L.; Fan, Y.; Wang, P.; Yang, J.; Wang, C. Review on Disaster of Hot Dry Wind for Wheat in China. J. Appl. Meteorol. Sci. 2019, 30, 129–141. [Google Scholar]
- Central Government Portal Website. Available online: https://www.gov.cn/jrzg/2013-05/13/content_2401555.htm (accessed on 7 August 2023).
- Dahebao Website. Available online: http://www.dahebao.cn/news/1409136?cid=1409136 (accessed on 7 August 2023).
- Xinxin Travel Weather Forecast. Available online: https://tianqi.cncn.com/yanjin/news-550549 (accessed on 7 August 2023).
- Copernicus Climate Change Service (C3S) Climate Data Store (CDS). Available online: https://cds.climate.copernicus.eu/cdsapp#!/dataset/reanalysis-era5-land?tab=form (accessed on 7 August 2023).
- US Government Computer. Available online: https://e4ftl01.cr.usgs.gov/MOLT/MOD09GA.061/ (accessed on 7 August 2023).
- Luo, Y.; Zhang, Z.; Li, Z.; Chen, Y.; Zhang, L.; Cao, J.; Tao, F. Identifying the spatio-temporal changes of annual harvesting areas for three staple crops in China by integrating multi-data sources. Environ. Res. Lett. 2020, 15, 074003. [Google Scholar] [CrossRef]
- National Earth System Science Data Center. Available online: http://www.geodata.cn/thematicView/GLASS.html?guid2=52092346086099 (accessed on 7 August 2023).
- GeoSPARQL. Available online: http://www.geosparql.org/ (accessed on 25 February 2022).
- O’Connor, M.J.; Das, A.K. A method for representing and querying temporal information in owl. In Proceedings of the International Joint Conference on Biomedical Engineering Systems and Technologies, Valencia, Spain, 20–23 January 2010; pp. 97–110. [Google Scholar]
- Shi, D. Introduction of Meteorological Support for Winter Wheat Production; China Meteorological Press: Beijing, China, 1994. [Google Scholar]
- SPARQL-Semantic Web Standards. Available online: https://www.w3.org/2001/sw/wiki/SPARQL (accessed on 7 August 2023).
- Li, D. Towards Geo-spatial Information Science in Big Data Era. Acta Geod. Et Cartogr. Sin. 2016, 45, 379–384. [Google Scholar] [CrossRef]


| Severity Levels of Dry Hot Wind Days | Daily Maximum Temperature_°C | Relative Humidity at 14:00_% | Wind Speed at 14:00_m/s |
|---|---|---|---|
| severe dry hot wind day | ≥35 | ≤25 | ≥3 |
| moderate dry hot wind day | ≥32 | ≤30 | ≥2 |
| mild dry hot wind day | ≥30 | ≤30 | ≥2 |
| Region | Dry Hot Wind Early Warning Records. |
|---|---|
| Henan Province | From 11 May to 13, 2013, Henan Province issued a red warning signal for three consecutive days due to the occurrence of dry hot wind [20]. |
| Hebi City | On 22 May 2019, at 8:05 am, an orange warning signal for dry hot wind was issued, and it was expected that dry hot wind would occur in the urban area on the same day [21]. |
| Yanjin County | On 22 May 2019, at 20:13, an orange warning signal for dry hot wind was issued again, and it was expected that dry hot wind would occur the next day [22]. |
| Wuyang County | On 22 May 2019, at 07:39, an orange warning signal for dry hot wind was issued, and it was expected that dry hot wind would occur within the next 24 h [21]. |
| Entity Types | Entity Properties | Data Properties | Meanings |
|---|---|---|---|
| Level1HourlyTemperatureGrid | T_C | xsd: double | Temperature_°C |
| Level1HourlyDewPointTemperatureGrid | DPT_C | xsd: double | Dew point temperature_°C |
| Level1HourlyRelativeHumidityGrid | RH_PCT | xsd: double | Relative humidity_% |
| Level1HourlyWindSpeedGrid | WS_MPS | xsd: double | Wind speed_m/s |
| Level2DailyMeteorologicalGrid | D_MAX_T_C | xsd: double | Daily maximum temperature_°C |
| 14_RH_PCT | xsd: double | Relative humidity at 14:00_% | |
| 14_WS_MPS | xsd: double | Wind speed at 14:00_m/s | |
| grid2DryHotWind | xsd: string | Severity levels of dry hot winds: “false”, “mild”, “moderate”, “severe” | |
| Level3PeriodMeteorologicalGrid | grid3DryHotWind | xsd: double | Is there an occurrence of dry hot winds? |
| dryHotWindStartDate | xsd: DateTime | Start date of dry hot winds | |
| dryHotWindFinishDate | xsd: DateTime | Finish date of dry hot winds | |
| severeDryHotWindDate | xsd: string | Dates of severe dry hot winds | |
| moderateDryHotWindDate | xsd: string | Dates of moderate dry hot winds | |
| mildDryHotWindDate | xsd: string | Dates of mild dry hot winds |
| Subject | Predicate | Object | Subject Type | Object Type |
|---|---|---|---|---|
| Dry Hot Wind | affectCrop | Wheat | Agro-meteorological disaster | Crop |
| Region | 1 Mild, 1 Moderate | 3 Moderate | 4 Moderate | 1 Moderate, 1 Severe | 2 Moderate, 1 Severe | 3 Moderate, 1 Severe | 1 Moderate, 2 Severe |
|---|---|---|---|---|---|---|---|
| Qi County | 148 | 86 | |||||
| Yanjin County | 240 | 358 | 4 | ||||
| Wuyang County | 49 | 168 | 249 | 20 |
| Region | 1 Mild, 1 Moderate, 1 Severe | 2 Moderate, 1 Severe |
|---|---|---|
| Qi County | 25 | 237 |
| Yanjin County | 517 | |
| Wuyang County | 271 | 295 |
| Region | 1 Mild, 1 Moderate | 3 Moderate | 4 Moderate | 1 Moderate, 1 Severe | 2 Moderate, 1 Severe | 3 Moderate, 1 Severe | 1 Moderate, 2 Severe |
|---|---|---|---|---|---|---|---|
| Qi County | 0.04 | 0.36 | |||||
| Yanjin County | 0.05 | 0.35 | 0.36 | ||||
| Wuyang County | 0.01 | 0.08 | 0.12 | 0.17 |
| Region | 1 Mild, 1 Moderate, 1 Severe | 2 Moderate, 1 Severe |
|---|---|---|
| Qi County | 0.08 | 0.12 |
| Yanjin County | 0.2 | |
| Wuyang County | 0.27 | 0.31 |
Disclaimer/Publisher’s Note: The statements, opinions and data contained in all publications are solely those of the individual author(s) and contributor(s) and not of MDPI and/or the editor(s). MDPI and/or the editor(s) disclaim responsibility for any injury to people or property resulting from any ideas, methods, instructions or products referred to in the content. |
© 2023 by the authors. Licensee MDPI, Basel, Switzerland. This article is an open access article distributed under the terms and conditions of the Creative Commons Attribution (CC BY) license (https://creativecommons.org/licenses/by/4.0/).
Share and Cite
Zhang, W.; Peng, L.; Ge, X.; Yang, L.; Chen, L.; Li, W. Spatio-Temporal Knowledge Graph-Based Research on Agro-Meteorological Disaster Monitoring. Remote Sens. 2023, 15, 4403. https://doi.org/10.3390/rs15184403
Zhang W, Peng L, Ge X, Yang L, Chen L, Li W. Spatio-Temporal Knowledge Graph-Based Research on Agro-Meteorological Disaster Monitoring. Remote Sensing. 2023; 15(18):4403. https://doi.org/10.3390/rs15184403
Chicago/Turabian StyleZhang, Wenyue, Ling Peng, Xingtong Ge, Lina Yang, Luanjie Chen, and Weichao Li. 2023. "Spatio-Temporal Knowledge Graph-Based Research on Agro-Meteorological Disaster Monitoring" Remote Sensing 15, no. 18: 4403. https://doi.org/10.3390/rs15184403
APA StyleZhang, W., Peng, L., Ge, X., Yang, L., Chen, L., & Li, W. (2023). Spatio-Temporal Knowledge Graph-Based Research on Agro-Meteorological Disaster Monitoring. Remote Sensing, 15(18), 4403. https://doi.org/10.3390/rs15184403