Article

Monitoring Thermokarst Lake Drainage Dynamics in Northeast Siberian Coastal Tundra

1
College of Geography and Environment, Shandong Normal University, Jinan 250014, China
2
College of Global Change and Earth System Science, Beijing Normal University, Beijing 100875, China
3
School of Geospatial Engineering and Science, Sun Yat-sen University, and Southern Marine Science and Engineering Guangdong Laboratory (Zhuhai), Zhuhai 519082, China
4
Key Laboratory of Comprehensive Observation of Polar Environment (Sun Yat-sen University), Ministry of Education, Zhuhai 519082, China
*
Author to whom correspondence should be addressed.
Remote Sens. 2023, 15(18), 4396; https://doi.org/10.3390/rs15184396
Submission received: 10 August 2023 / Revised: 2 September 2023 / Accepted: 6 September 2023 / Published: 7 September 2023
(This article belongs to the Special Issue Monitoring Cold-Region Water Cycles Using Remote Sensing Big Data)

Abstract

:
Thermokarst lakes in permafrost regions are highly dynamic due to drainage events triggered by climate warming. This study focused on mapping lake drainage events across the Northeast Siberian coastal tundra from 2000 to 2020 and identifying influential factors. An object-based lake analysis method was developed to detect 238 drained lakes using a well-established surface water dynamics product. The LandTrendr change detection algorithm, combined with continuous Landsat satellite imagery, precisely dated lake drainage years with 83.2% accuracy validated against manual interpretation. Spatial analysis revealed the clustering of drained lakes along rivers and in subsidence-prone Yedoma regions. The statistical analysis showed significant warming aligned with broader trends but no evident temporal pattern in lake drainage events. Our machine learning model identified lake area, soil temperature, summer evaporation, and summer precipitation as the top predictors of lake drainage. As these climatic parameters increase or surpass specific thresholds, the likelihood of lake drainage notably increases. Overall, this study enhanced the understanding of thermokarst lake drainage patterns and environmental controls in vulnerable permafrost regions. Spatial and temporal dynamics of lake drainage events were governed by complex climatic, topographic, and permafrost interactions. Integrating remote sensing with field studies and modeling will help project lake stability and greenhouse gas emissions under climate change.

1. Introduction

The polar amplification effect has rendered the cryosphere elements exceptionally susceptible to climate change, making them pivotal indicators of global warming [1]. Over the past few decades, long-term observational data have revealed that the circum-Arctic permafrost region has been undergoing accelerated and profound warming [2], consequently instigating permafrost degradation. The degradation of permafrost typically follows a gradual, top-down process. However, with the intensification of Arctic warming, there is a growing trend of rapid thawing processes, as exemplified by the formation of thermokarst landscapes [3,4]. Rapid permafrost thawing can cause the collapse of ice-filled areas, leading to surface subsidence, landslides, or thermokarst erosion, which exposes deeper permafrost layers [5,6]. This process contributes to the formation of characteristic thermokarst landforms, including lakes, wetlands, and hillslopes [7].
Thermokarst lakes are primarily found in lowland tundra regions, including the Yukon Delta, the North Slope of Alaska, and the coastlines of the Kara Sea, the Laptev Sea, and the East Siberian Sea [7]. These lakes vary in size from tens of meters to thousands of meters in diameter and are predominantly supplied with water from underground ice, snowmelt, and atmospheric precipitation [8]. The lifecycle of thermokarst lakes encompasses stages from their initial formation and subsequent expansion to eventual drainage and reformation within the drained lake basin [9]. The development of thermokarst lakes is a pivotal component of the Arctic hydrological cycle, creating an ever-evolving mosaic landscape of lakes and drained lake basins (DLBs), which collectively cover more than one-fifth of the northern permafrost zone [9].
The dynamics of lake drainage have profound implications for the hydrology, vegetation, ecosystems, and soil carbon dynamics in the region [10,11]. Lake drainage leads to a reduction in surface water storage, and the sudden drainage of large lakes can result in disastrous flood events [12]. Following drainage, the exposed DLBs become fertile grounds for the growth and succession of tundra vegetation, initiating rapid community succession [8,13]. The DLBs also serve as critical living areas for local indigenous communities, supporting agricultural and livestock activities [14]. Additionally, thermokarst lakes are considered major methane emission sources in permafrost areas, and therefore, their drainage processes greatly reduce regional methane emissions [6,15]. The exposure and re-freezing of lakebed sediments post drainage play a key role in maintaining the stability of permafrost [6]. Hence, monitoring thermokarst lake drainage events and identifying their key influencing factors are of great importance for understanding the geomorphological, ecological, hydrological, and landscape characteristics, as well as the carbon cycling in the permafrost region, particularly in the context of ongoing climate change.
Due to the remote and harsh climatic conditions in the Arctic region, traditional field monitoring methods are greatly limited. Satellite remote sensing technology serves as a crucial tool for achieving large-scale landscape dynamics monitoring and environmental disturbance detection in permafrost regions, providing essential data support for studying the dynamics of thermokarst lake drainage [16,17,18]. The phenomenon of lake drainage in the Arctic region has received considerable attention in the climate change research community since the beginning of this century. Smith et al. (2005) [19] used satellite images from the 1970s and 2000s to track changes in over 10,000 large lakes in the Western Siberia region, revealing an approximate 11% decrease in the lake area. Following that, researchers conducted regional surveys in the coastal plains and coastal lowland areas of Alaska, Canada, and Siberia, analyzing the widespread phenomenon of lake drainage [20,21,22,23,24,25]. Jones et al. (2011) [20] noted a 10.7% increase in the number of lakes but a 14.9% decrease in the total area of Alaska’s northern Seward Peninsula, partially attributed to larger lakes dividing into smaller ones. Chen et al. (2014) [21] found that 80.7% of lake area changes in Alaska’s Yukon Flats were linked to temperature and snowmelt, with the remaining 14.3% associated with long-term trends. In their analysis of lakes in four Arctic regions, Nitze et al. (2018) [22] reported a net loss of 1.44% in lake area between 1999 and 2014, with varying regional trends: −5.46% in Western Siberia, −0.62% in Alaska, −0.24% in Eastern Canada, and +3.67% in Eastern Siberia. Lindgren et al. (2021) [23] assessed lake changes in western Alaska, revealing area changes of −6.7%, −1.6%, −6.9%, and +2.7% in continuous, discontinuous, sporadic, and isolated permafrost zones, respectively.
The occurrence of lake drainage events exhibits strong spatial heterogeneity and randomness due to the complex feedback mechanisms among climate, ecology, and hydrological processes influencing lake drainage [20]. The most comprehensive assessment to date has covered only 10% of the entire northern permafrost region [22], so lake drainage dynamics across large areas of the Arctic remain poorly characterized. Particularly, limited studies have been conducted in the Northeast Siberian coastal tundra, leaving drainage patterns and drivers in this region unclear. Some remote sensing studies on lake drainage use satellite images for two time periods to analyze changes in water area [18,25,26], but this can result in statistical errors due to seasonal fluctuations. While some studies use long-time series of satellite remote sensing images for trend analysis to minimize the impact of seasonal and interannual fluctuations of water bodies [27,28,29], they are limited to identifying trends in surface water drying and lack the capability to specifically focus on individual lake drainage events. To conduct a comprehensive analysis of lake drainage events, we developed a hybrid algorithm by combining the Theil-Sen trend analysis method with the LandTrendr change detection algorithm in our previous studies [30,31]. This hybrid approach was employed to detect thermokarst lake drainage events in the northern Alaska permafrost region [31] and analyze the vegetation dynamics following lake drainage [32]. However, accurately identifying small, drained lakes (with an area of 1–10 hectares) remains a challenging task because the spectral characteristics of the lakes may be influenced by factors such as precipitation, runoff, and aquatic vegetation, causing interference in spectral–temporal trajectory segmentation. Furthermore, a more thorough comprehension of the spatial and temporal dynamics of lake drainage events necessitates further extensive observations and research to quantify the key climate and environmental factors influencing the drainage dynamics.
In view of this, this study utilized a well-established surface water dynamics product [33] and an improved object-based lake analysis method to identify drained thermokarst lakes in the Northeast Siberian coastal tundra region. Subsequently, a continuous time series of Landsat satellite images from 2000 to 2020 and the LandTrendr change detection algorithm [34,35] were applied to determine the main year of occurrence for each lake drainage event. Using the spatio-temporal distribution of the detected drained lakes, along with climatic and environmental parameters extracted from reanalysis data and permafrost-related data products, a machine learning model was developed to explore the key factors influencing lake drainage. The objectives are to (1) map spatio-temporal patterns of lake drainage events in the study region over the past two decades and to (2) identify key climatic and landscape variables associated with lake drainage. This study aims to enhance our understanding of the dynamics of thermokarst lake drainage in the region and fill the knowledge gap concerning the key influencing factors of lake drainage.

2. Materials and Methods
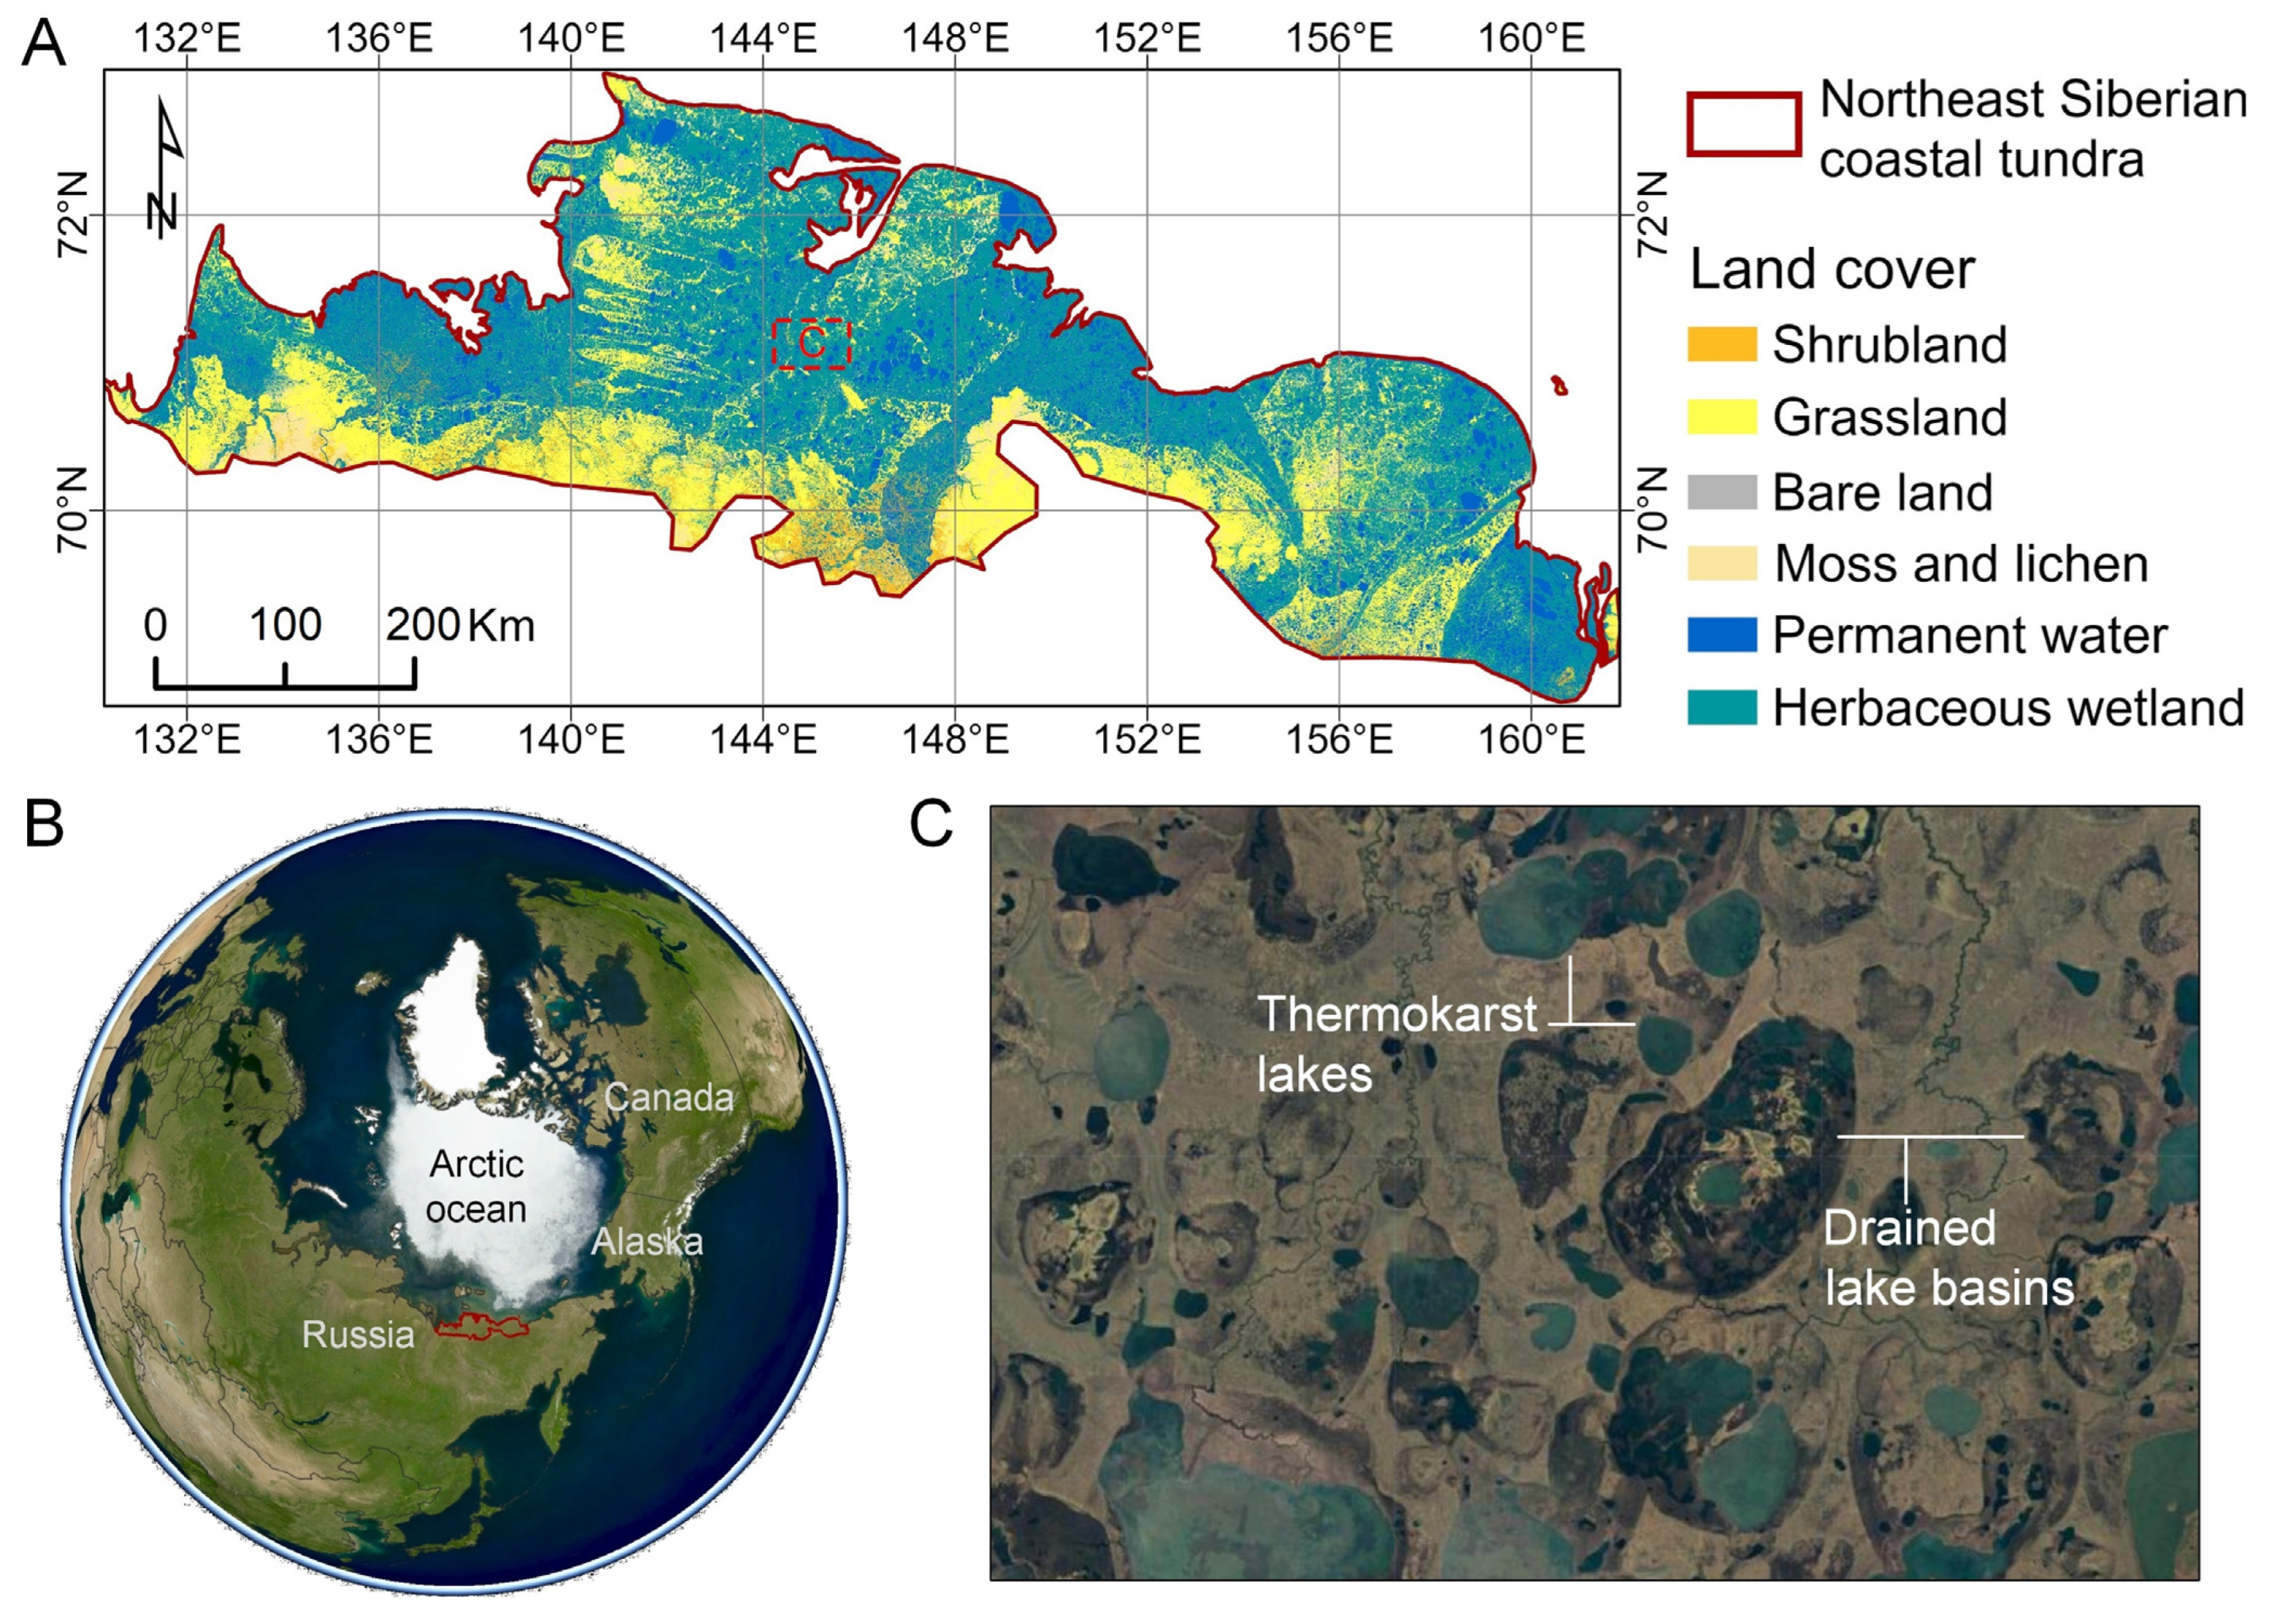
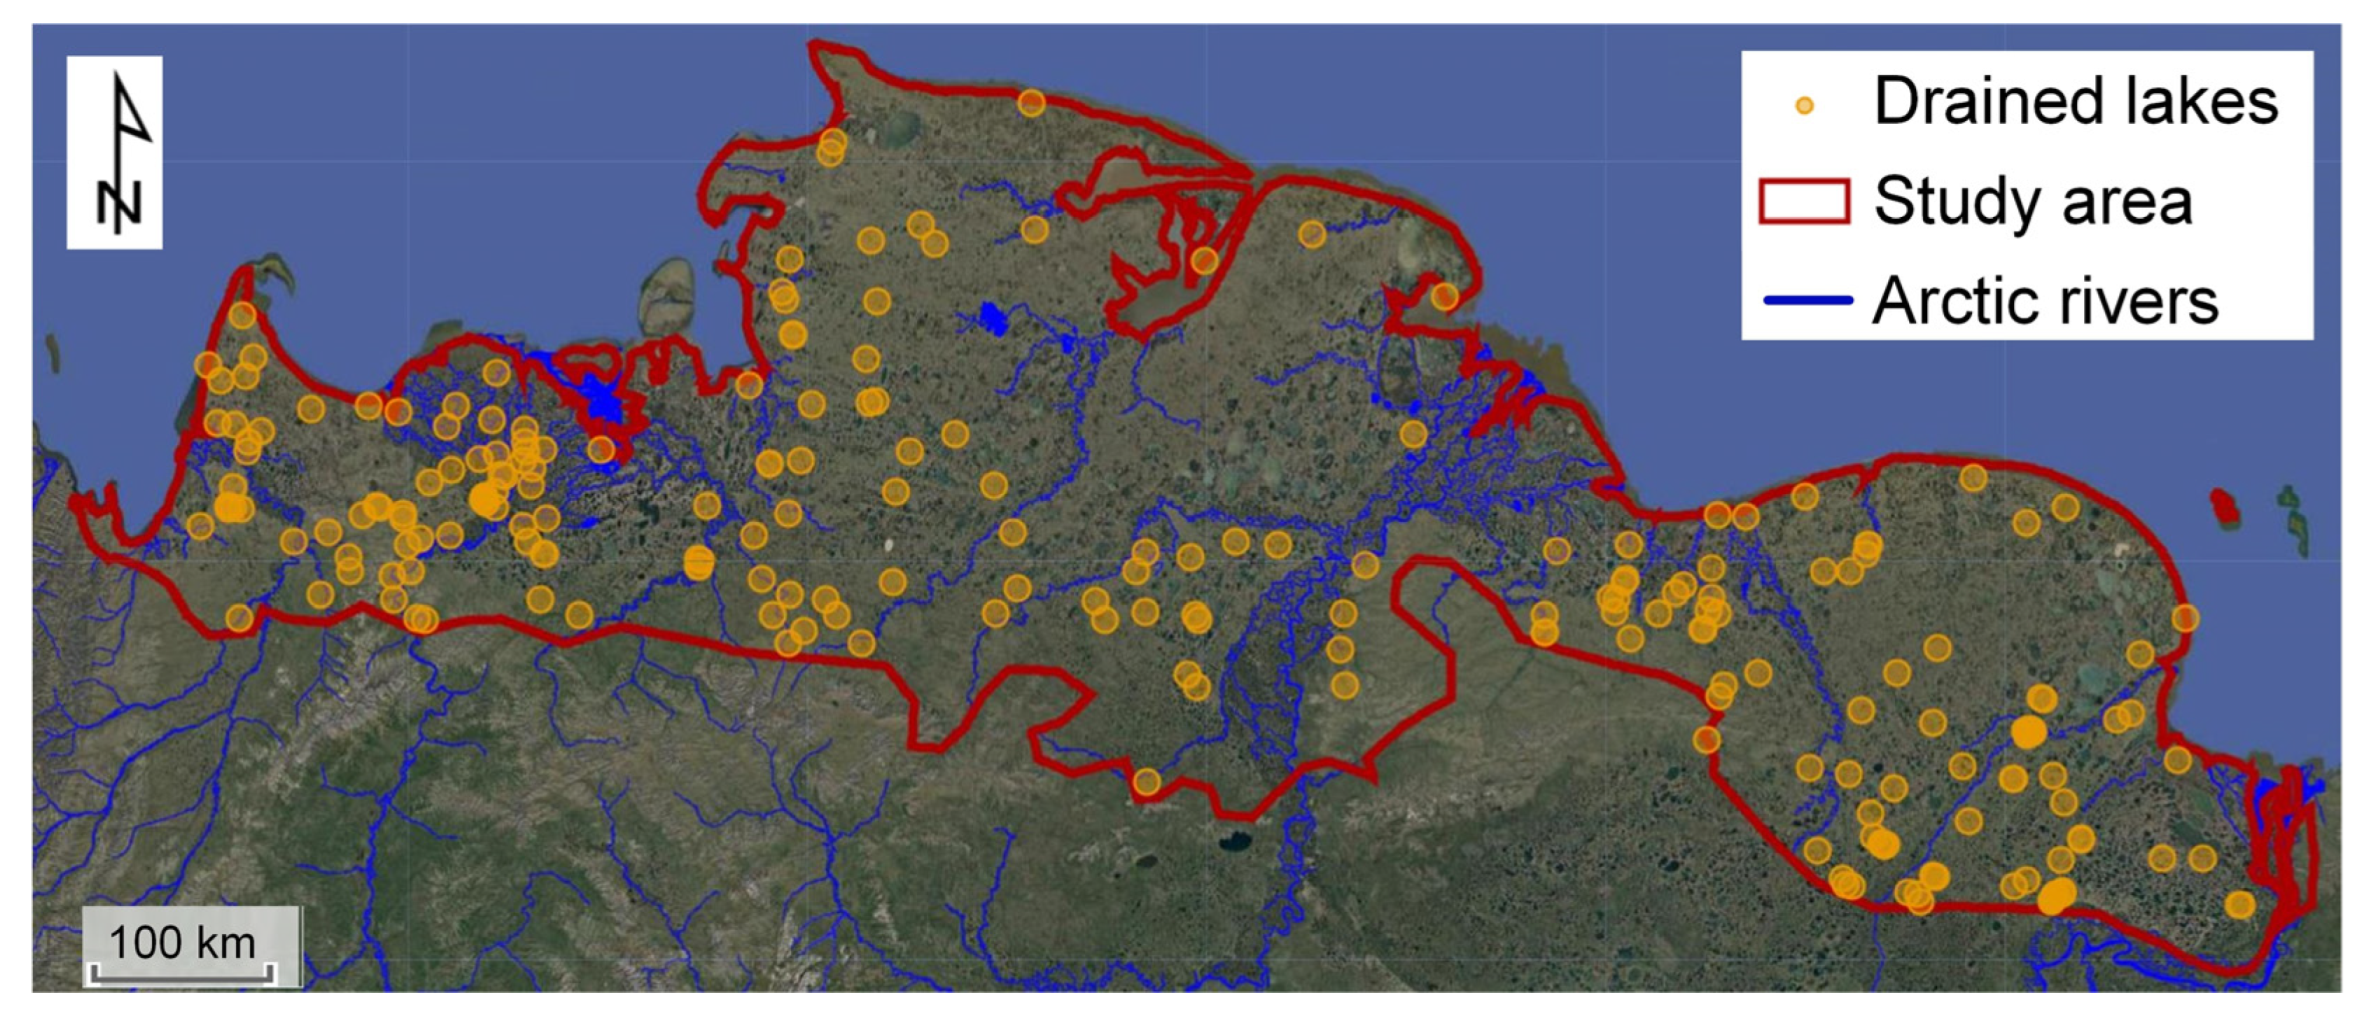
2.1. Study Area

The study area is the ecoregion known as the Northeast Siberian coastal tundra [36], covering an area of approximately 2.2 × 10⁵ km2 (Figure 1). It stretches along the Eastern Siberian and Laptev Seas, extending from the Lena River delta in the west to the Kolyma River delta in the east. The climate of this area is classified as a humid continental climate—cool summer subtype, with pronounced temperature variations on both a daily and seasonal basis, characterized by long, cold winters and short, cool summers. This Arctic Ocean coastline is adjacent to the coldest seas in the Northern Hemisphere, with ice covering it for at least nine months of the year. The average monthly temperatures in the region range from −34 to 9 °C, and the mean annual precipitation varies between 150 and 400 mm.
The study area is entirely within the continuous permafrost zone, with permafrost covering over 90% of the region. The landscape is characterized by flat tundra and numerous lakes, and in some areas, the underground ice layer pushes soil up in bumps. Influenced by the thermokarst processes associated with permafrost degradation, it exhibits a complex microtopography characterized by small hills, polygonal ridges, and marshy depressions. Vegetation mainly consists of typical Arctic grasses, sedges, dwarf shrubs, and mosses, with isolated stands of larch taiga in the southern sectors [37]. Extensive evidence of historical lake drainage is found in the area, manifesting itself in the form of overlapping DLBs (Figure 1C).

2.2. Data

Figure 2 illustrates a flowchart of the data and processing methods used in this study.

2.2.1. Landsat Satellite Images

We used the Google Earth Engine platform [38] to generate a long time series of annual composite images using Landsat-5, Landsat-7, and Landsat-8 surface reflectance data with a resolution of 30 m that have undergone geometric, radiometric, and atmospheric correction processes. Landsat image archives were filtered to obtain images with a cloud cover of less than 50% for each year between June and September from 2000 to 2020, in order to reduce the influence of snow, ice, and clouds. Quality Assessment Band (pixel_qa) was then applied to mask observation noises to enhance image quality. For Landsat-7 images with scan line corrector failure (SLC-off), a neighboring image strip-filling algorithm [39] was used to obtain complete coverage. We also applied statistical transformation functions [40] to process Landsat images from different sensors (TM, ETM+, and OLI) in order to enhance spectral continuity. The Automated Water Extraction Index (AWEI) was computed to monitor water dynamics, which is particularly effective in identifying open water bodies such as lakes and rivers in satellite images [41]. Due to the relatively flat terrain of the study area, we employed the non-shadow version of AWEI (AWEInsh), which is calculated using the following formula:
AWEInsh = 4 × (Green − SWIR1) − (0.25 × NIR + 2.75 × SWIR2),
The variables Green, NIR, SWIR1, and SWIR2 in the formula represent the reflectance values of the Landsat image bands corresponding to green, near-infrared, shortwave infrared 1, and shortwave infrared 2, respectively.
After the above preprocessing, we generated annual median composite images for the years 2000–2020, which were used for subsequent lake drainage year detection with the LandTrendr algorithm [34,35].

2.2.2. JRC Surface Water Dynamics Dataset

A well-established global surface water dynamics product published by the Joint Research Centre (JRC) of the European Commission [33] was utilized to aid in the identification of drained lakes in the Northeast Siberian coastal tundra region from 2000 to 2020. This dataset is derived from the Landsat images at 30 m resolution, employing an expert system to quantify the worldwide spatial and temporal distribution of surface water and providing statistical data on water extent and changes. Unlike other water maps that rely on only two time periods for change detection, the JRC product captures the seasonal and interannual dynamics of surface water, distinguishing between temporary and permanent water loss, which helps to mitigate errors arising from lake fluctuations.

2.2.3. ERA5-Land Reanalysis Dataset

We utilized ERA5-Land reanalysis data [42] to investigate climate factors associated with lake drainage, including variables such as air temperature, soil temperature, precipitation, and evaporation. Air temperature was obtained at a height of two meters above the ground, while soil temperature was averaged from the first layer (0–7 cm) and the second layer (7–30 cm) of the soil. Total precipitation includes snowfall, and total evaporation includes transpiration. To facilitate the comparison, we have reversed the sign of evaporation. ERA5-Land is an enhanced land component product of the fifth-generation European Reanalysis (ERA5) data released by the European Centre for Medium-Range Weather Forecasts. This dataset offers the highest spatial resolution available for the study area, with a resolution of 0.1°, and has undergone extensive evaluation using ground observations and reference datasets based on satellite data, demonstrating excellent performance in characterizing various land surface processes and environmental changes [42]. For analysis, we calculated the mean values of these climate parameters during the summer months (June to August) and for the entire year, as well as the Theil-Sen trend slope [30] values for the period 2000–2020.

2.2.4. Permafrost-Related Data Products
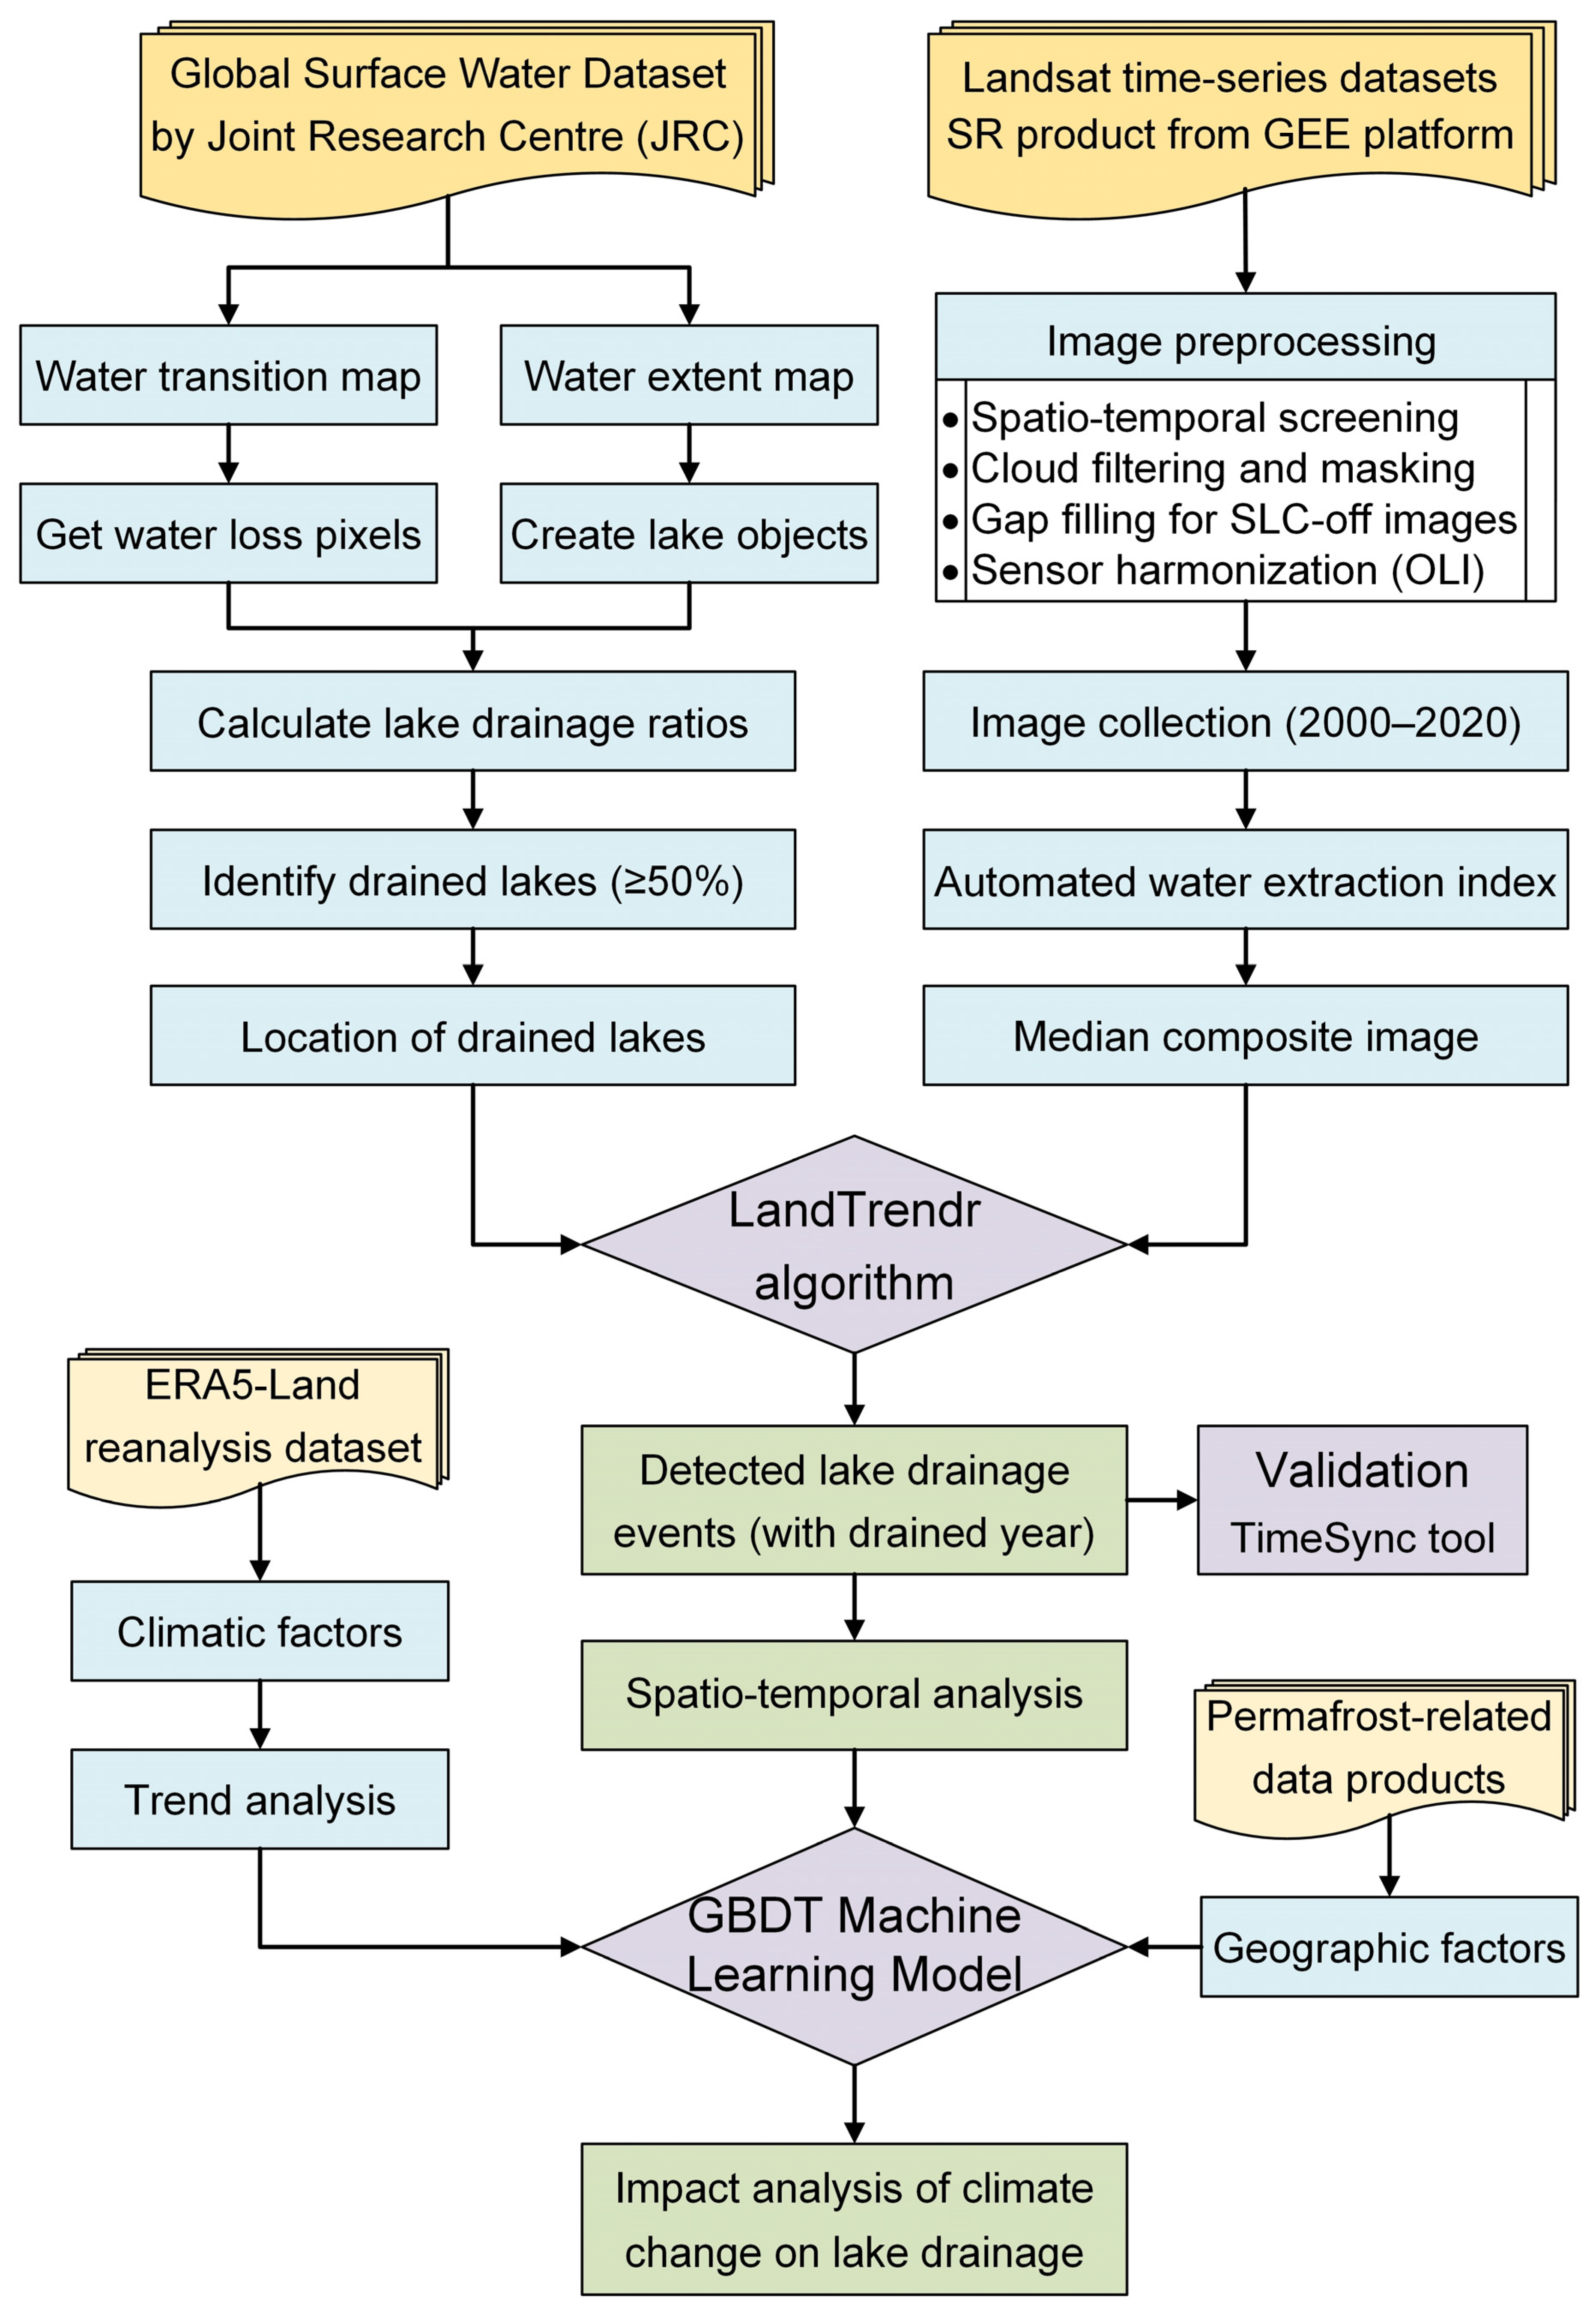
In addition to climate factors, we also investigated potential geographical factors that may influence lake drainage, including elevation, slope, ground ice content, distribution of thermokarst lakes, and presence of Yedoma deposits. These variables provide insights into permafrost-related characteristics and were extracted from available data products. Elevation and slope information was derived from the high-precision ArcticDEM mosaic product [43], created using high-resolution optical stereo imagery and photogrammetric techniques for accurate spatial measurements, providing detailed land surface information. Ground ice content was obtained from the circumpolar ground ice product [44] and classified into three levels based on volume percentage: high (>20%), moderate (10–20%), and low (0–10%). The distribution of thermokarst lakes was derived from the circumpolar thermokarst landscape distribution map [7], categorized into five grades based on fractional coverage: very high (60–100%), high (30–60%), moderate (10–30%), low (1–10%), and none (0–1%). Yedoma deposits represent permafrost formed during the Pleistocene epoch, characterized by high organic content and ice-rich deposits of partially decomposed ancient plant material (peat). We used the recently compiled Yedoma distribution map [45] to identify whether drained lakes were located in Yedoma regions.

2.3. Method

2.3.1. Object-Based Lake Analysis

By utilizing the JRC surface water dynamics dataset, we employed an improved object-based lake analysis method based on previous research [30,31,32] to identify drained lakes in the study area. Unlike pixel-based statistical approaches, our method allows for accurate identification and counting of drained lakes while supporting filtering based on initial lake area and drainage proportion. We initially utilized the object-based analysis functionality provided by the GEE cloud computing platform to create lake objects for all bodies of water in the study area based on the pixel connectivity relationships derived from the JRC water extent map. Differentiated colors in Figure 3A represent unique identifiers for each lake object. We then used pixels marked as “permanent water loss” in the JRC water transition map to identify potential drained lakes (Figure 3B). The initial lake area and drainage proportion were calculated for each lake object, and we filtered out lakes with an area greater than 1 hectare (0.01 km2, approximately equivalent to 11 Landsat pixels) and a drainage proportion higher than 50%. This threshold was set to minimize the influence of water body area fluctuations on the identification of drained lakes. Here, we did not impose a time span limitation on lake drainage because some lakes experienced gradual drainage over multiple years.

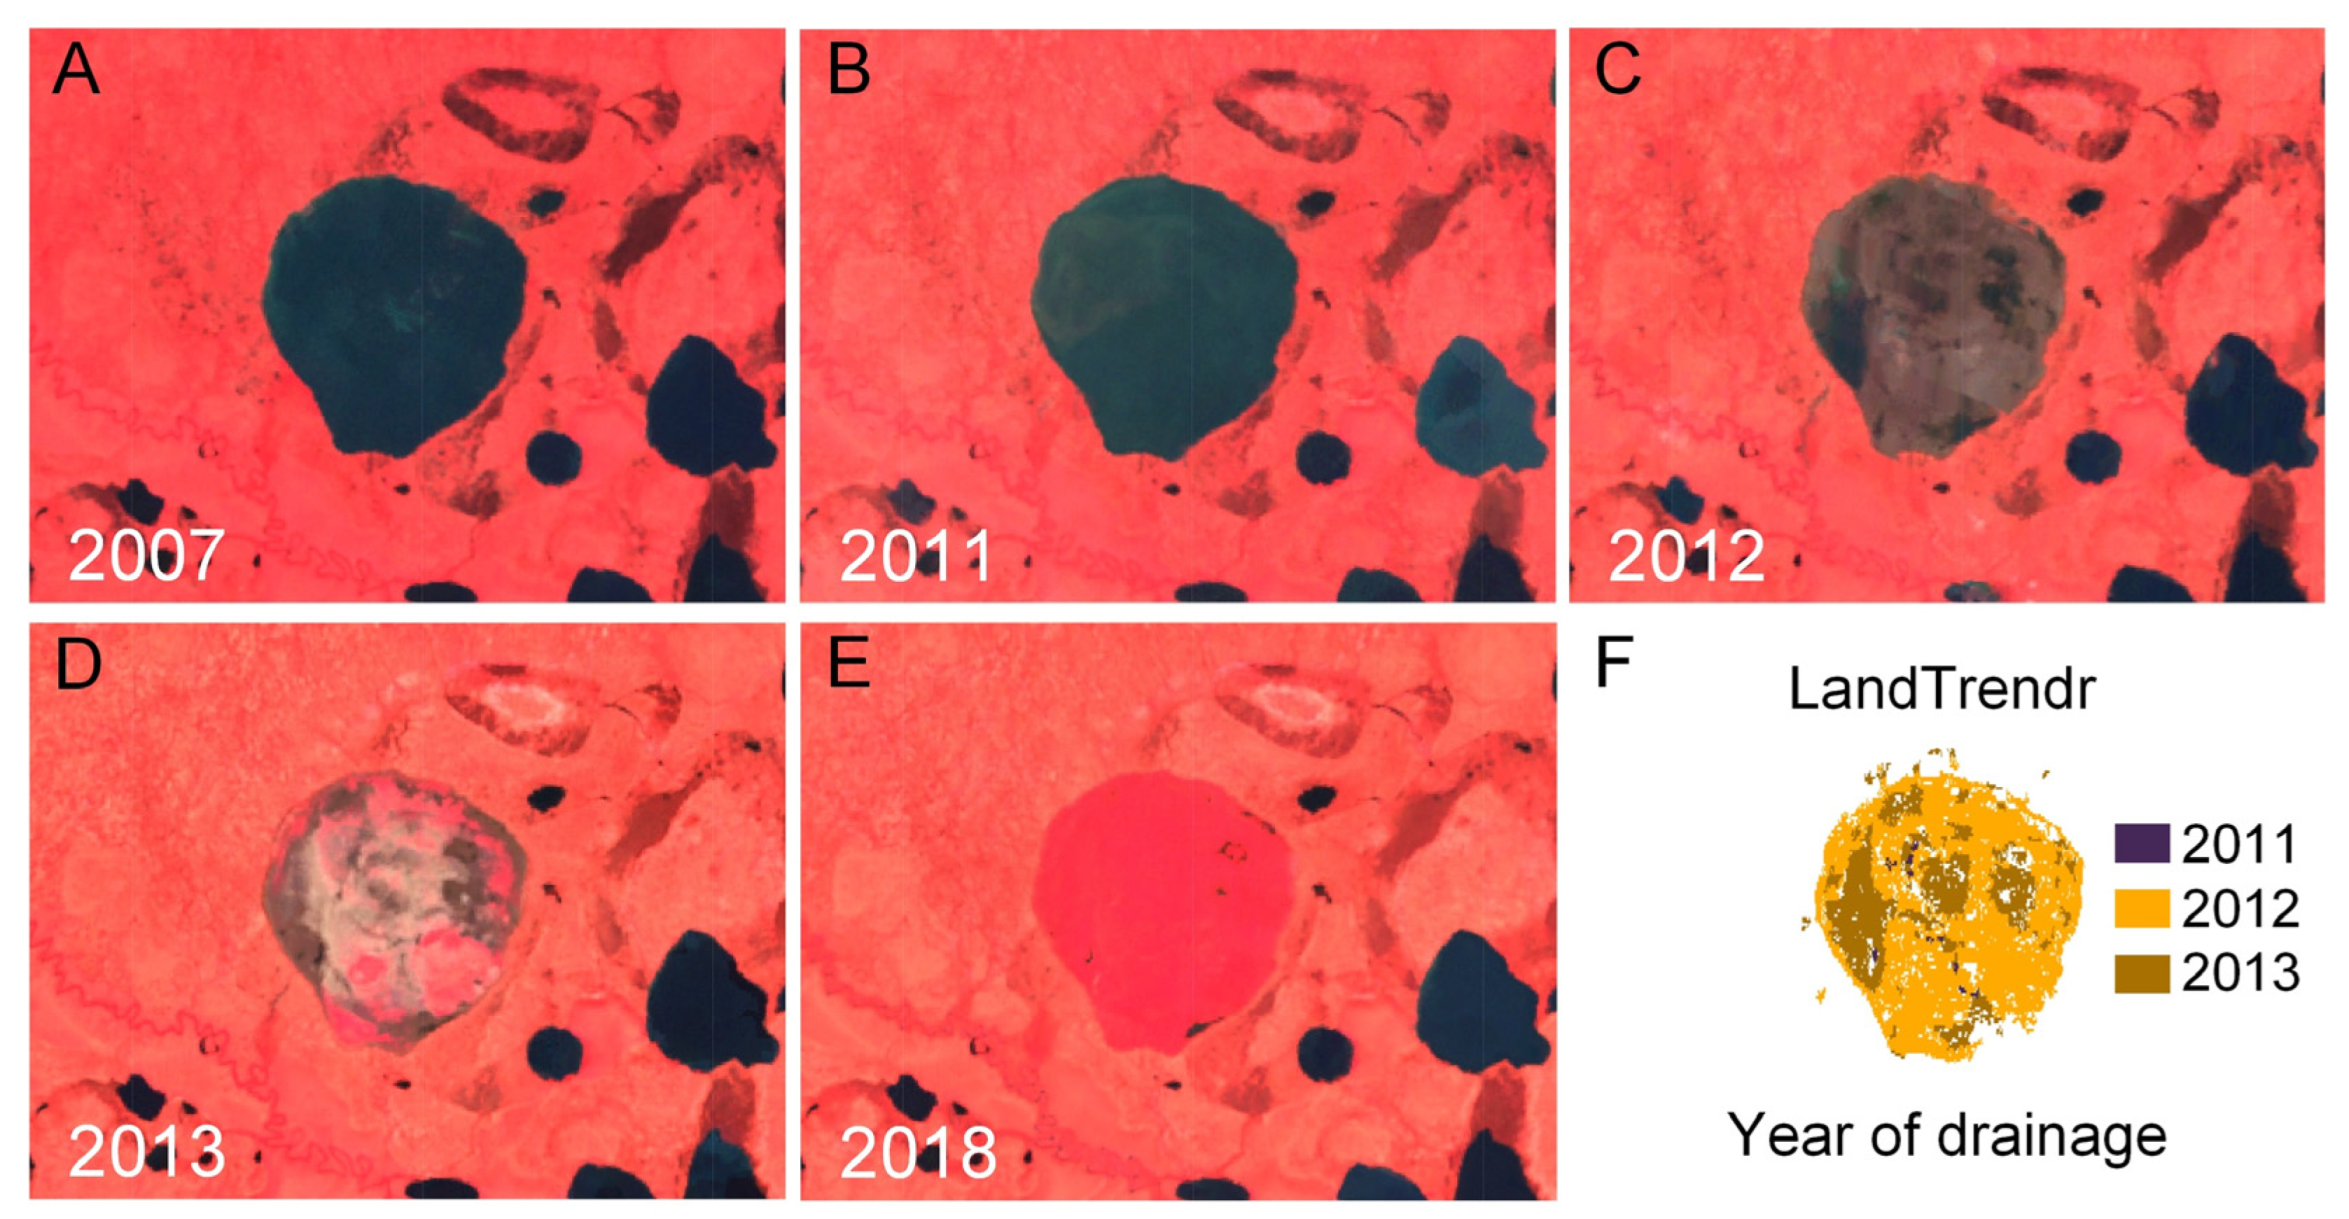
2.3.2. LandTrendr Change Detection Algorithm

After identifying drained lakes using the object-based lake analysis method, we used the LandTrendr change detection algorithm [34] to segment the time-series trajectories of AWEI band values, thereby determining the timing of each lake drainage event. The LandTrendr algorithm, fully integrated into the GEE platform in 2018 [35], was originally developed for forest disturbance and recovery detection in forestry applications, capturing surface change trends and disturbance information reflected in spectral trajectories. The LandTrendr algorithm characterizes spectral trajectory changes over time by strategically partitioning pixel reflectance data series into linear segments. It identifies optimal breakpoint positions to split the temporal sequence into successive fitted lines that together model the full trajectory (Figure 4). Leveraging the high-frequency and multi-temporal analysis capabilities of Landsat imagery, the algorithm has shown high accuracy in disturbance detection, extending its applicability beyond forestry to detect impervious surface dynamics [46], analyze agricultural land conversion patterns [47], assess mining subsidence and flooding [48], and identify lake drainage events [31]. Analysis of thermokarst lake distribution in the northern region of Alaska demonstrated that the LandTrendr algorithm effectively determines the occurrence year and duration of lake drainage events [31]. The control parameters of the Landtrendr algorithm used in this study are shown in Table 1.

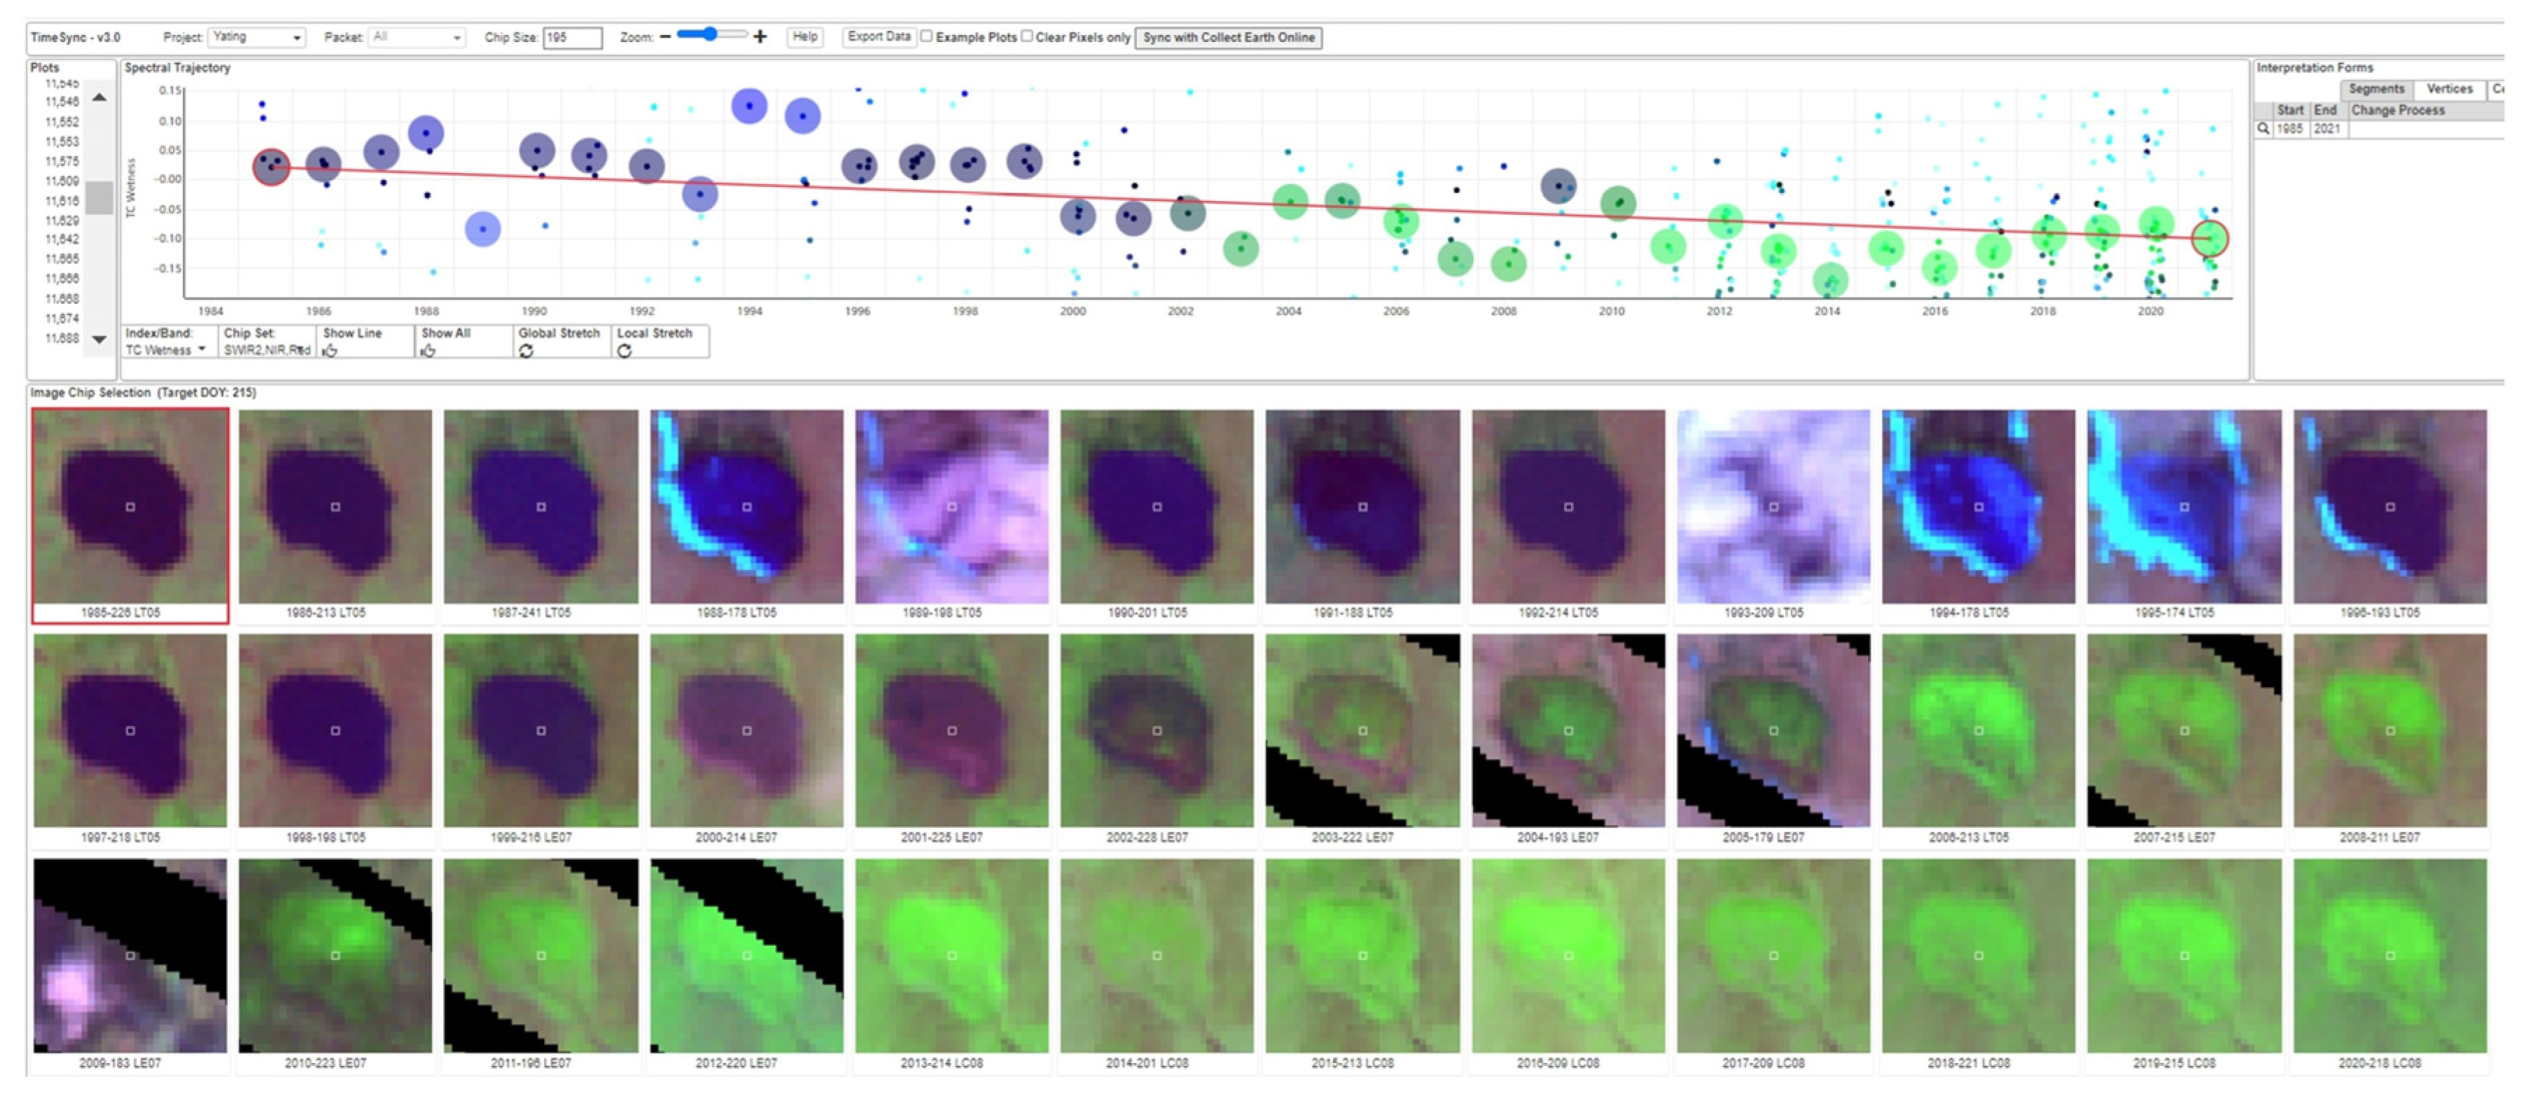
2.3.3. Validation with the TimeSync Tool

To validate the accuracy of the spatio-temporal distribution of the identified drained lakes, we employed the TimeSync tool [49] (https://timesync.forestry.oregonstate.edu/, accessed on 1 September 2023) for visual interpretation of each lake drainage event. TimeSync is a Landsat-based visualization and data collection tool that automates image filtering, generates time series of multispectral indices, fits curves, and aids in visual interpretation, enabling precise detection of small-scale disturbances at the regional level. The combination of LandTrendr and TimeSync provides a powerful approach to analyzing thermokarst lake dynamics, ensuring accurate identification and characterization of lake drainage events. Figure 5 illustrates the software interface of the TimeSync tool, which showcases spectral time-series trajectories and Landsat images for each year. This tool offers several advantages, including high processing efficiency, operational flexibility, and outstanding sampling capability.

2.3.4. GBDT Machine Learning Model

To investigate the key environmental factors influencing lake drainage in permafrost regions, we employed the Gradient Boosting Decision Tree (GBDT) machine learning method to construct a classification model. GBDT, a popular and powerful ensemble learning method, combines multiple decision trees to create powerful predictive models, known for high accuracy, robustness to outliers, and ability to handle complex data relationships [50]. Specifically, we utilized the CatBoost classification model [51], which efficiently handles categorical features and addresses issues like gradient bias and prediction shift, thus reducing overfitting and improving accuracy and generalization ability.
We use the CatBoost model to capture intricate non-linear interactions and potential dependencies between environmental factors and lake drainage, enabling the establishment of a prediction model for lake drainage occurrence under various environmental conditions. Furthermore, through the analysis of variable importance, we can identify the key environmental factors influencing lake drainage. We conducted model training using Python’s scikit-learn and CatBoost libraries [52], and we determined the optimal model hyperparameters (Table 2) through grid search and ten-fold cross-validation. Considering the issue of multicollinearity among explanatory variables, we calculated the Pearson correlation coefficient (r) between all variables and removed variables highly correlated (r > 0.5) with the most important variables identified in the preliminary analysis. We used Shapley values [53] to assess the relative importance of each explanatory variable, quantifying their contribution to the prediction of the response variable.

3. Results

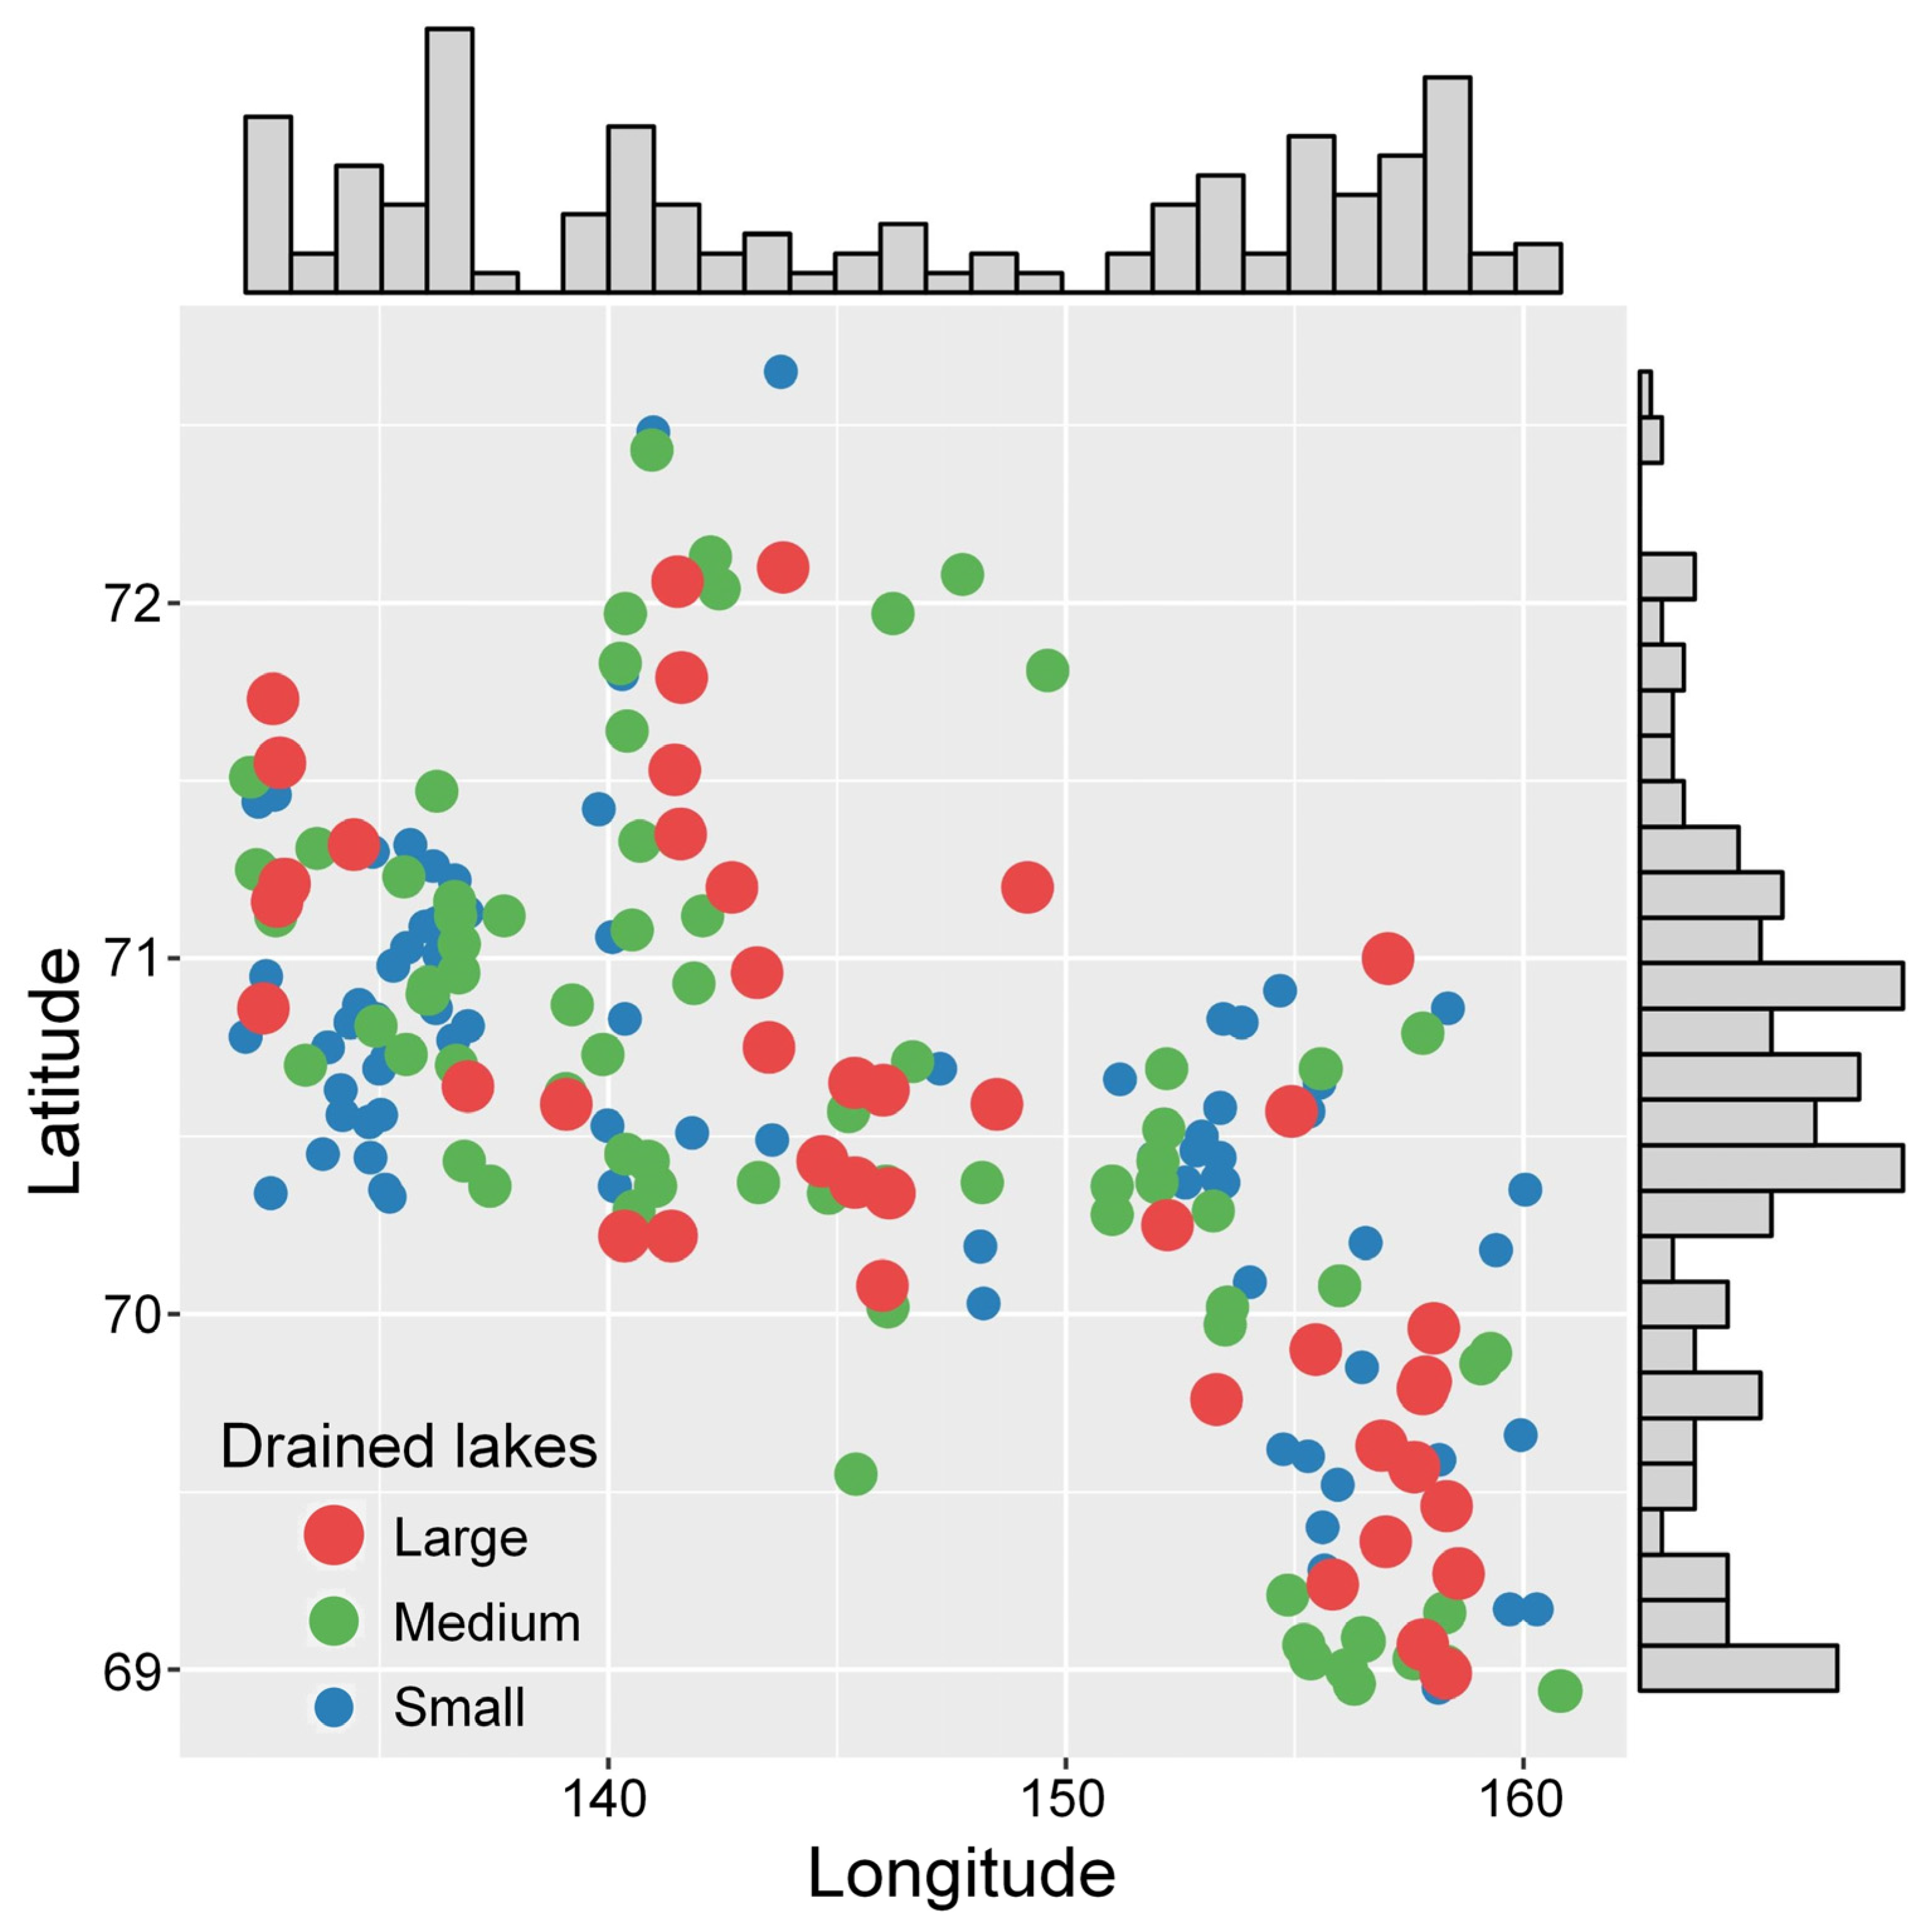
3.1. Spatial Distribution of Drained Lakes

Based on the object-based lake analysis method, we identified a total of 238 drained lakes in the study region over the period 2000–2020. Specific information about these 238 drained thermokarst lakes, including their location, size, drainage year, and drainage ratio, is available through the publicly accessible Thermokarst Lake Drainage Events Dataset on the Zenodo portal (https://zenodo.org/record/8304112, accessed on 1 September 2023). Among them, 66% were partially drained (50–80%), and 34% were fully drained (>80%). These drained lakes were categorized as small-sized (1–10 ha), medium-sized (10–100 ha), and large-sized (>100 ha), accounting for 48%, 34%, and 18% of the total, respectively (Figure 6). It is important to note that this proportion alone does not prove that smaller lakes are more susceptible to drainage events than larger lakes, as the distribution of existing lakes within the ecological region also needs to be considered. Statistics reveal that there are approximately 1.16 × 10⁵ lake objects with an area greater than 1 hectare in the study area, with small, medium, and large lakes accounting for 73%, 22%, and 5%, respectively. Therefore, between 2000 and 2020, the likelihood of drainage events occurring in small, medium, and large lakes in the area are 0.14%, 0.31%, and 0.76%, respectively, averaging 0.21%.
The water in thermokarst lakes is typically discharged through lateral or internal drainage channels [54]. In discontinuous permafrost zones, the melting of ice wedges and the expansion of taliks at the lake bottom lead to the development of internal erosion channels, facilitating lake drainage [54]. In contrast, our study area is entirely within the continuous permafrost zone, where lakes are primarily drained through lateral drainage channels. Lateral drainage in thermokarst lakes is often associated with seasonal fluctuations in lake water levels. For instance, extreme precipitation events, continuous rainfall, and shoreline snowmelt can result in rising water levels, basin overflow, and bank collapse, forming lateral drainage channels [9]. Furthermore, factors such as flooding, river erosion, and coastal erosion enhance hydrological connectivity and influence lake drainage dynamics [18,20,55].
The spatial density of drained lakes in this region was approximately 1.1 × 10⁻³ km−2, which closely matches the density of drained lakes (approximately 1.2 × 10⁻³ km−2) reported in previous studies in the northern Alaska permafrost region [31]. The spatial distribution of these drained lakes exhibits notable clustering patterns. Some drained lakes are located in close proximity to each other, indicating potential interconnected drainage systems. Specifically, our findings reveal that the high density of drained lakes is concentrated in low-lying areas along riverbanks (Figure 7). These areas are likely influenced by enhanced thermokarst activity due to water flow and sediment transport, leading to accelerated permafrost thawing. Furthermore, drained lakes exhibit clustering patterns around the boundaries of Yedoma regions, which contain ice-rich silt deposits highly vulnerable to thaw subsidence and thermokarst [45]. In contrast, drier elevated areas farther inland show lower densities of lake drainage events. The presence of these localized clusters suggests certain environmental conditions may facilitate the triggering and spread of lake drainage events, signifying hotspots of localized permafrost degradation. This could exert broader impacts on ecosystem dynamics and land surface stability. These spatial patterns provide valuable insights into the geographical factors influencing thermokarst development and lake drainage susceptibilities across the heterogeneous tundra landscape.

3.2. Drainage Year Detection and Validation

We applied the LandTrendr change detection algorithm to the time series of Landsat satellite images spanning the period from 2000 to 2020 to detect the main drainage year for each of the identified 238 drained lakes. Figure 8 illustrates an example of the year detection for a drained lake in the study area. The LandTrendr algorithm, utilizing the AWEI changes, accurately captures the temporal transition from water bodies to DLBs at a pixel level. To facilitate analysis, we aggregated the pixel-level detection results within the extent of each drained lake by calculating the mode, which represents the year with the highest proportion of drainage and serves as the main drainage year for the lake.
The overall accuracy of the detected drainage years was validated using the TimeSync interactive visualization tool. This validation process involved visually inspecting the imagery for clear evidence of lake drainage, such as visible changes in the lake boundaries and the presence of drained lake basins. All 238 drained lakes were manually inspected in TimeSync by comparing the automated LandTrendr results to the spectral trajectory curves and annual satellite images. The validation results indicate a close match between the visually identified drainage years and those detected using the LandTrendr algorithm, with an accuracy of approximately 83.2% in correctly identifying the drainage years. The LandTrendr algorithm successfully captured the main drainage year for the majority of the drained lakes in the study area, providing confidence in the temporal patterns of lake drainage events and facilitating further exploration of key influencing factors.

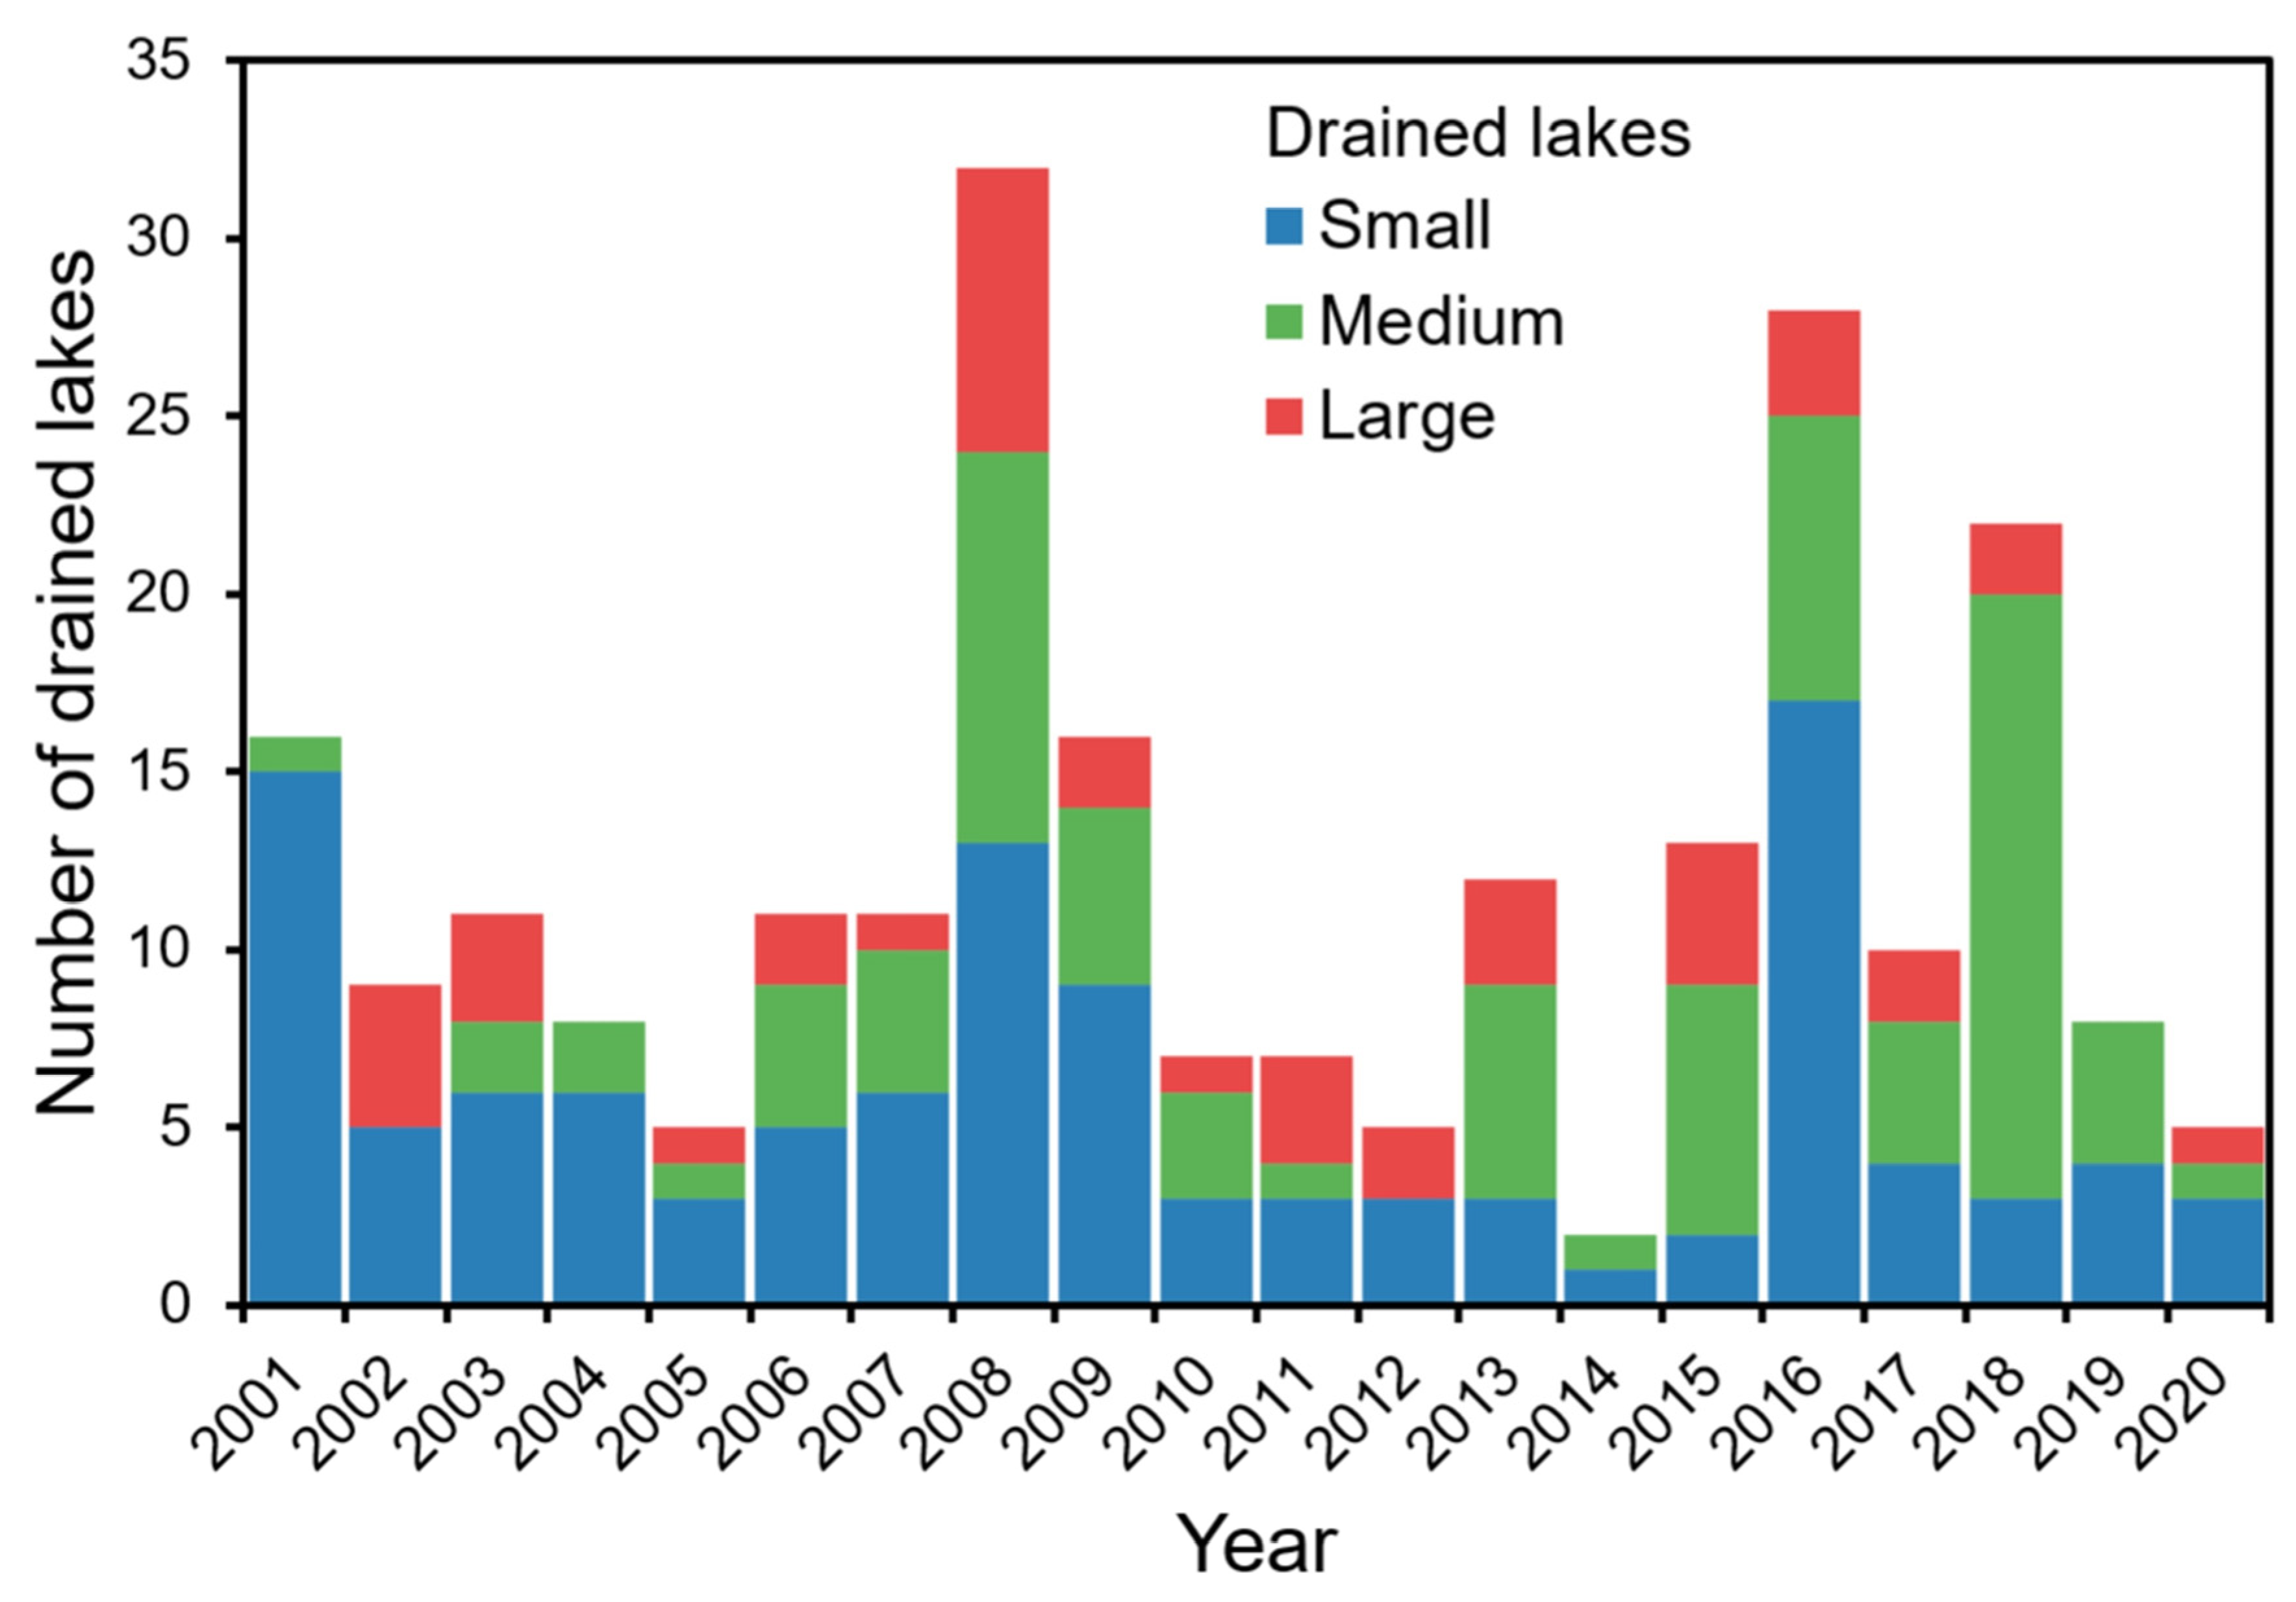
3.3. Temporal Patterns of Lake Drainage Events

Following visual validation and necessary corrections, the temporal distribution of the 238 identified lake drainage events is illustrated in Figure 9. The analysis revealed no statistically significant overall temporal trends between 2000 and 2020 (p > 0.05), and the number of lake drainage events per year exhibited a relatively random pattern. However, specific years, such as 2007 and 2016, showed higher numbers of lake drainage events, possibly indicating shared triggering factors related to climate and hydrological changes. The analysis shows that small lakes are the main contributors to drainage events, with a frequency range of 1–17 and an average of 5.7 events per year. Medium-sized lakes exhibit more dispersed drainage patterns, with high interannual variability in event counts within a frequency range of 0–17 and an average of 4.1 events per year. In contrast, large lakes experience relatively fewer drainage events (except in 2007, with a frequency range of 0–4 and an average of 2.1 events per year) and some years without events (2001, 2004, 2014, and 2019). Interestingly, certain years show asynchronous drainage timing among lakes of different sizes. For example, in 2007, there was a surge in drainage events for large lakes (eight events), while medium and small lakes also experienced higher drainage counts. Meanwhile, in 2018, medium-sized lakes experienced a spike in drainage events (17 events), while small and large lakes were slightly below the average level. These temporal patterns provide insights into the complex interannual variations of lake drainage, which do not adhere to straightforward linear trajectories. The combination of spatial and temporal information enables us to further investigate the driving factors and ecological implications of lake drainage occurrences.

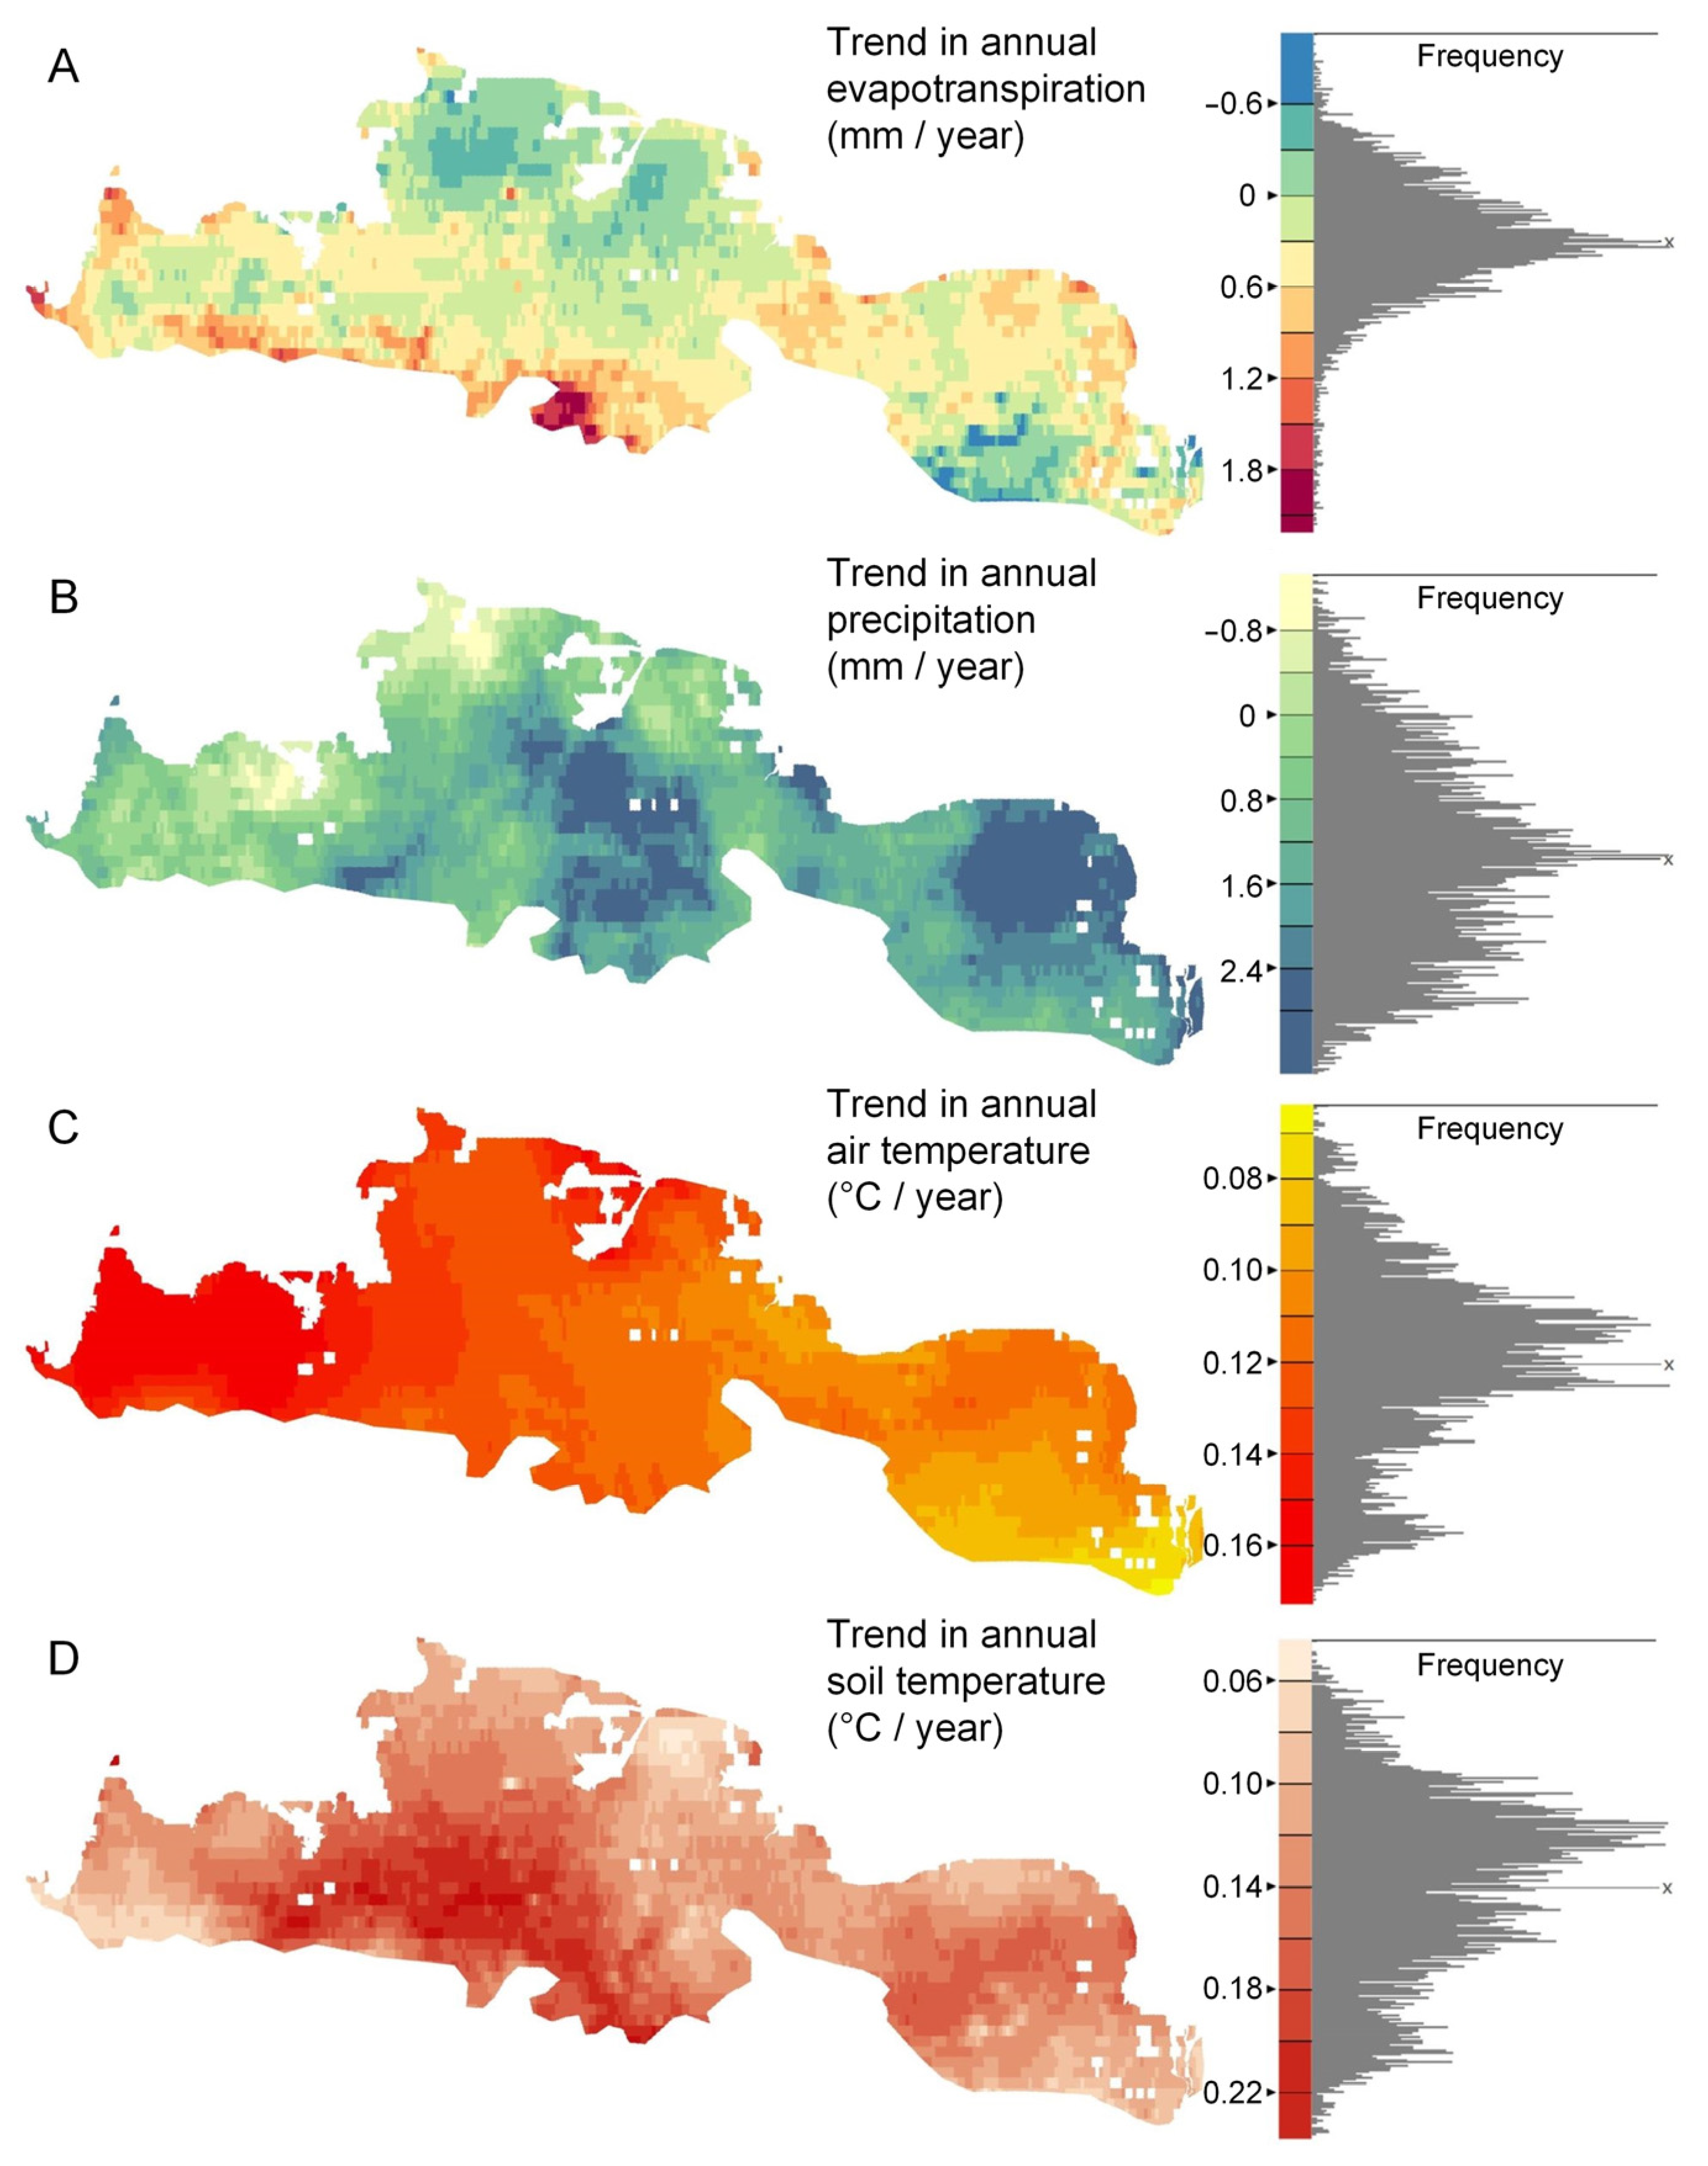
3.4. Statistical Analysis of Regional Climate Trends

To investigate the influence of climatic factors on lake drainage events, we analyzed climatic trends within the study area. Key climatic variables, such as air temperature, soil temperature, precipitation, and evaporation, were extracted from the ERA5-Land reanalysis data spanning from 2000 to 2020. We processed the data to calculate annual mean and summer average values and to assess trends for these parameters (Figure 10). The results reveal that from 2000 to 2020, there was a statistically significant warming trend (p < 0.001) in both annual mean air temperature and annual mean soil temperature, with increases of around 1.2 °C and 1.4 °C per decade, respectively. However, the summer mean air temperature and soil temperature exhibited relative stability, showing a slight positive trend of 0.6 °C and 0.7 °C per decade, respectively (not statistically significant, p > 0.05). Both precipitation and evaporation displayed considerable interannual variability without a clear overall trend, leading to substantial shifts in wetness patterns across different years. Notably, years with a high frequency of lake drainage events, such as 2007 and 2016, coincided with elevated levels of precipitation, evaporation, and soil temperature (Figure 10). This suggests that fluctuations in precipitation and evaporation may influence lake drainage, particularly when coupled with temperature changes.
To examine the spatial variations in climatic trends, we calculated the Sen’s slope for various climatic variables across the study area from 2000 to 2020. Figure 11 illustrates the spatial distribution of trends in temperature, precipitation, and evaporation, providing insights into the changes in climatic factors across the study area over time. The warming trend in air temperature within the study area primarily shows an increasing pattern from the southeast to the northwest, ranging from 0.6 to 1.7 °C per decade (mean ± variance of 1.2 ± 0.2). The warming trend in soil temperature is also evident (1.4 ± 0.4 °C per decade), with higher values concentrated in the southwestern part of the study area, where the trend slope can reach 2 °C per decade, reflecting a pronounced warming of the permafrost layer in these regions. Precipitation and evaporation also show overall increasing trends, but with greater variability, measuring 1.4 ± 0.9 and 0.3 ± 0.4 mm per year, respectively. The central and eastern parts of the study area show more noticeable increases in precipitation, while the southern edge exhibits a more pronounced drought trend due to enhanced evaporation. These climatic trends reflect an overall warming pattern that aligns with the broader global warming trend, indicating potential impacts on permafrost stability and thermokarst processes. Moreover, the pronounced spatial and temporal variations highlight the influence of complex hydro-climatic dynamics on permafrost degradation and lake drainage.

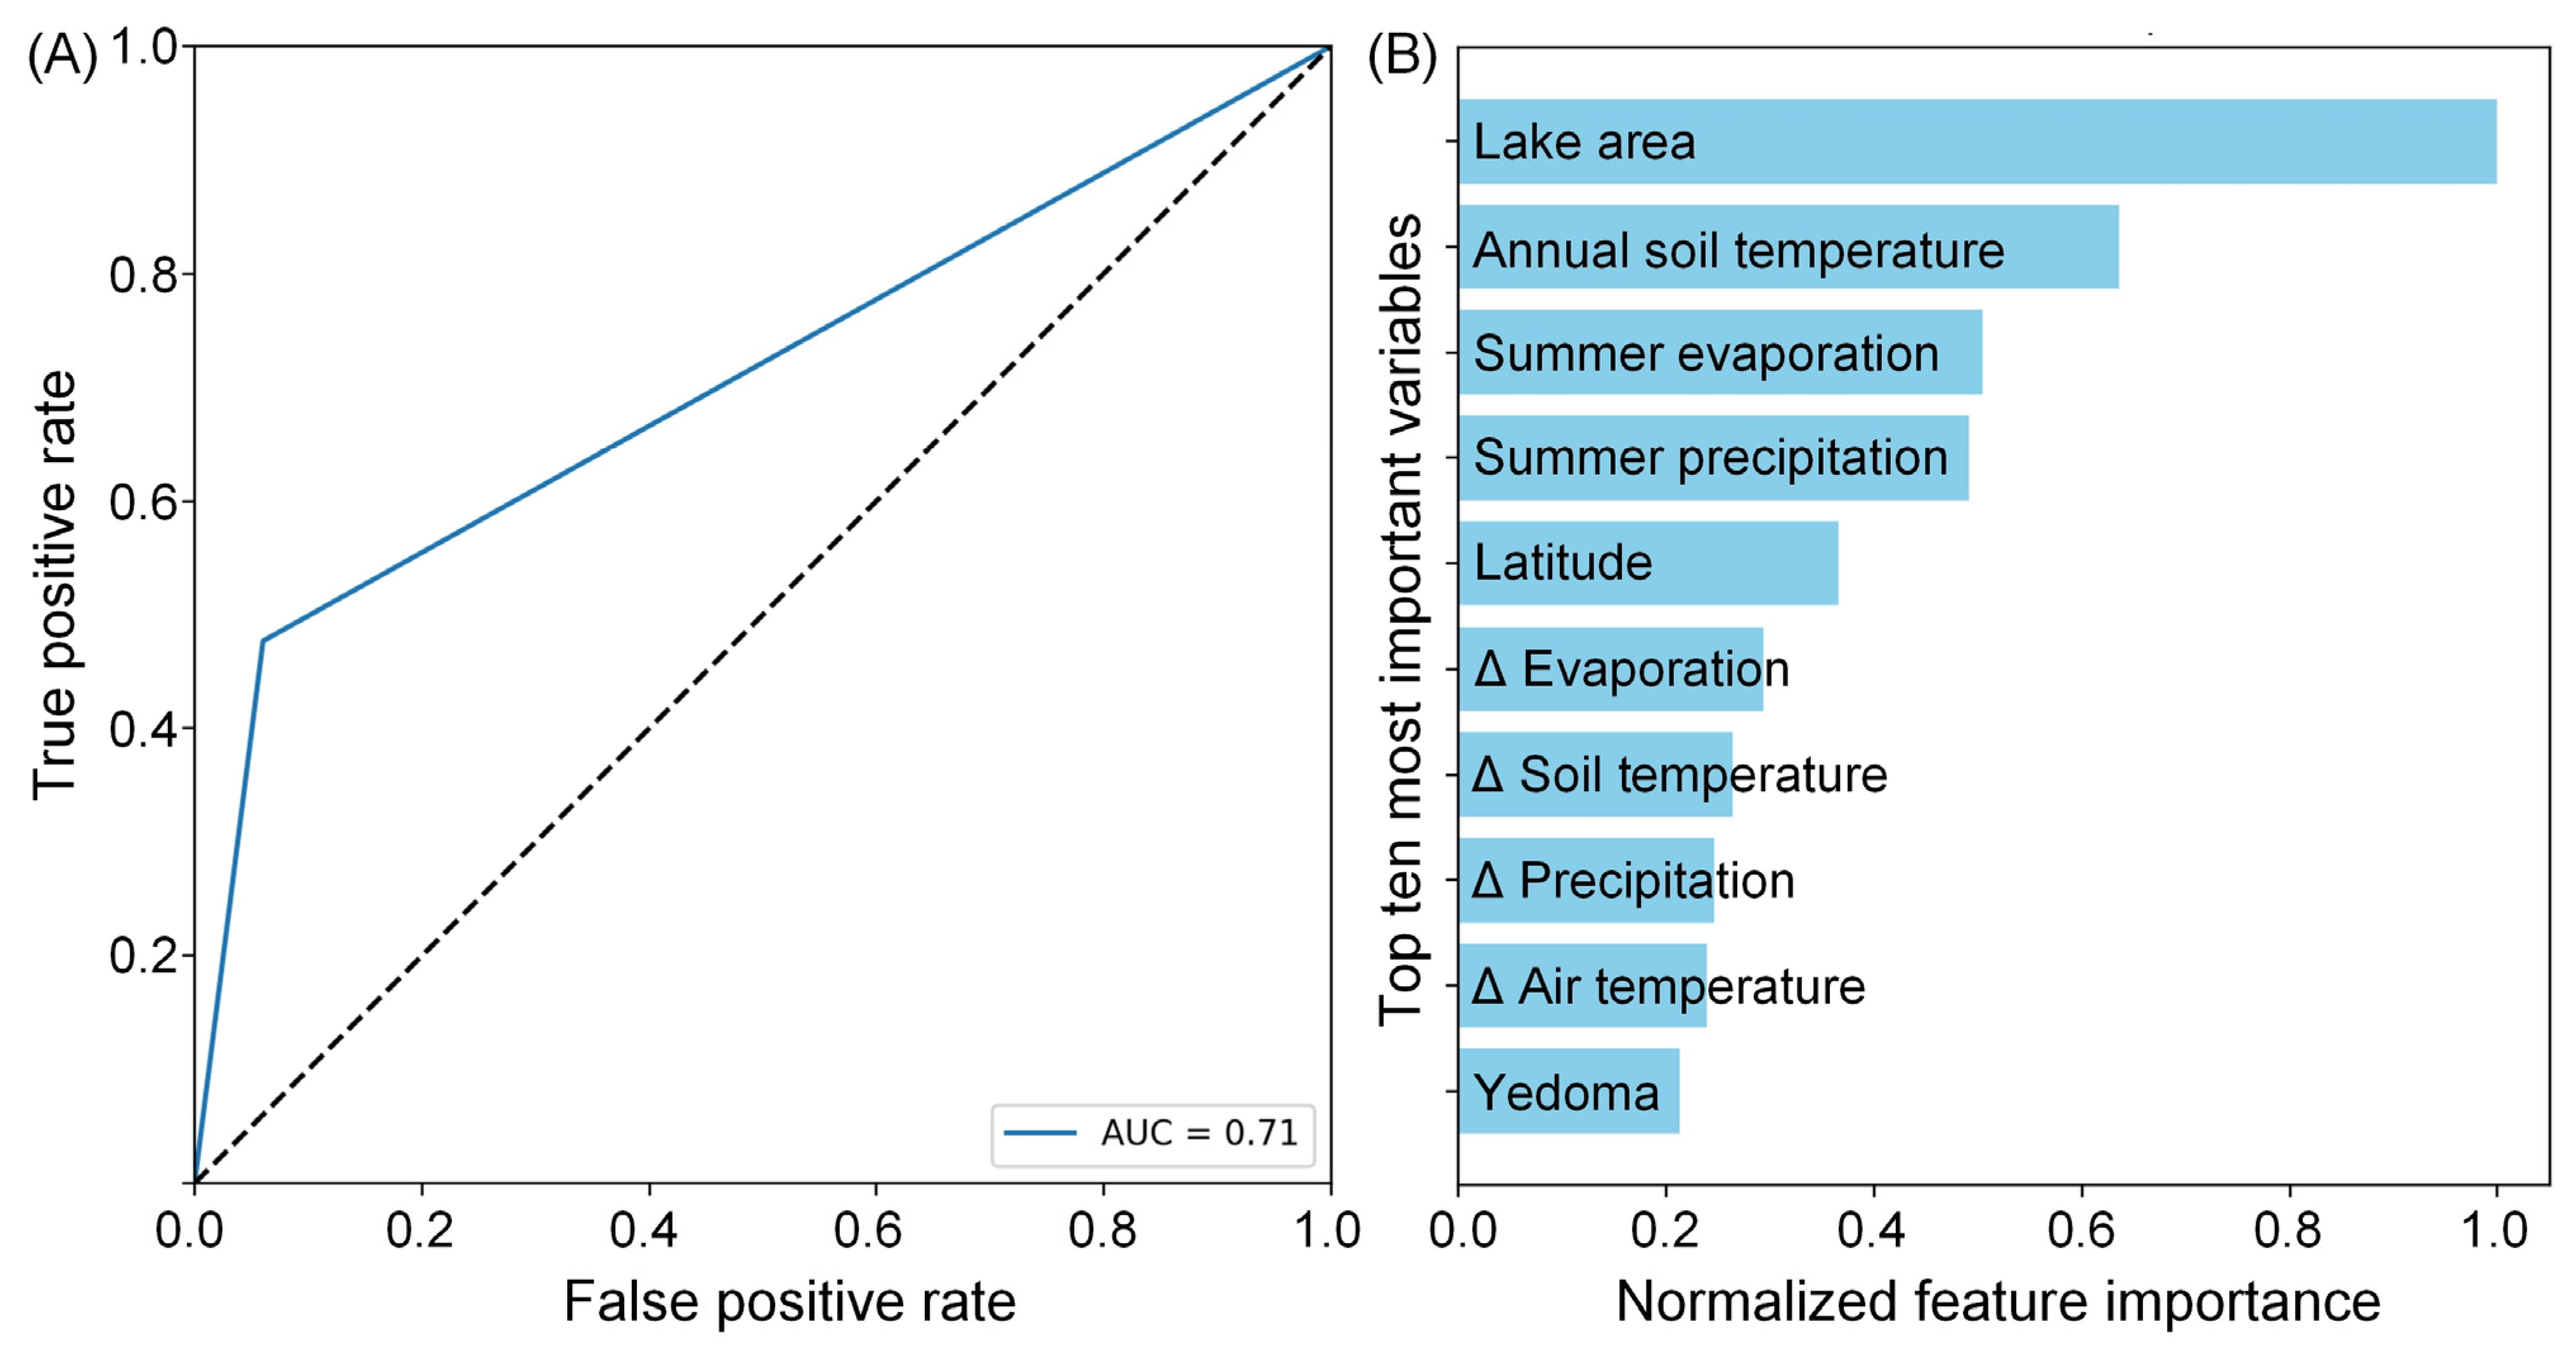
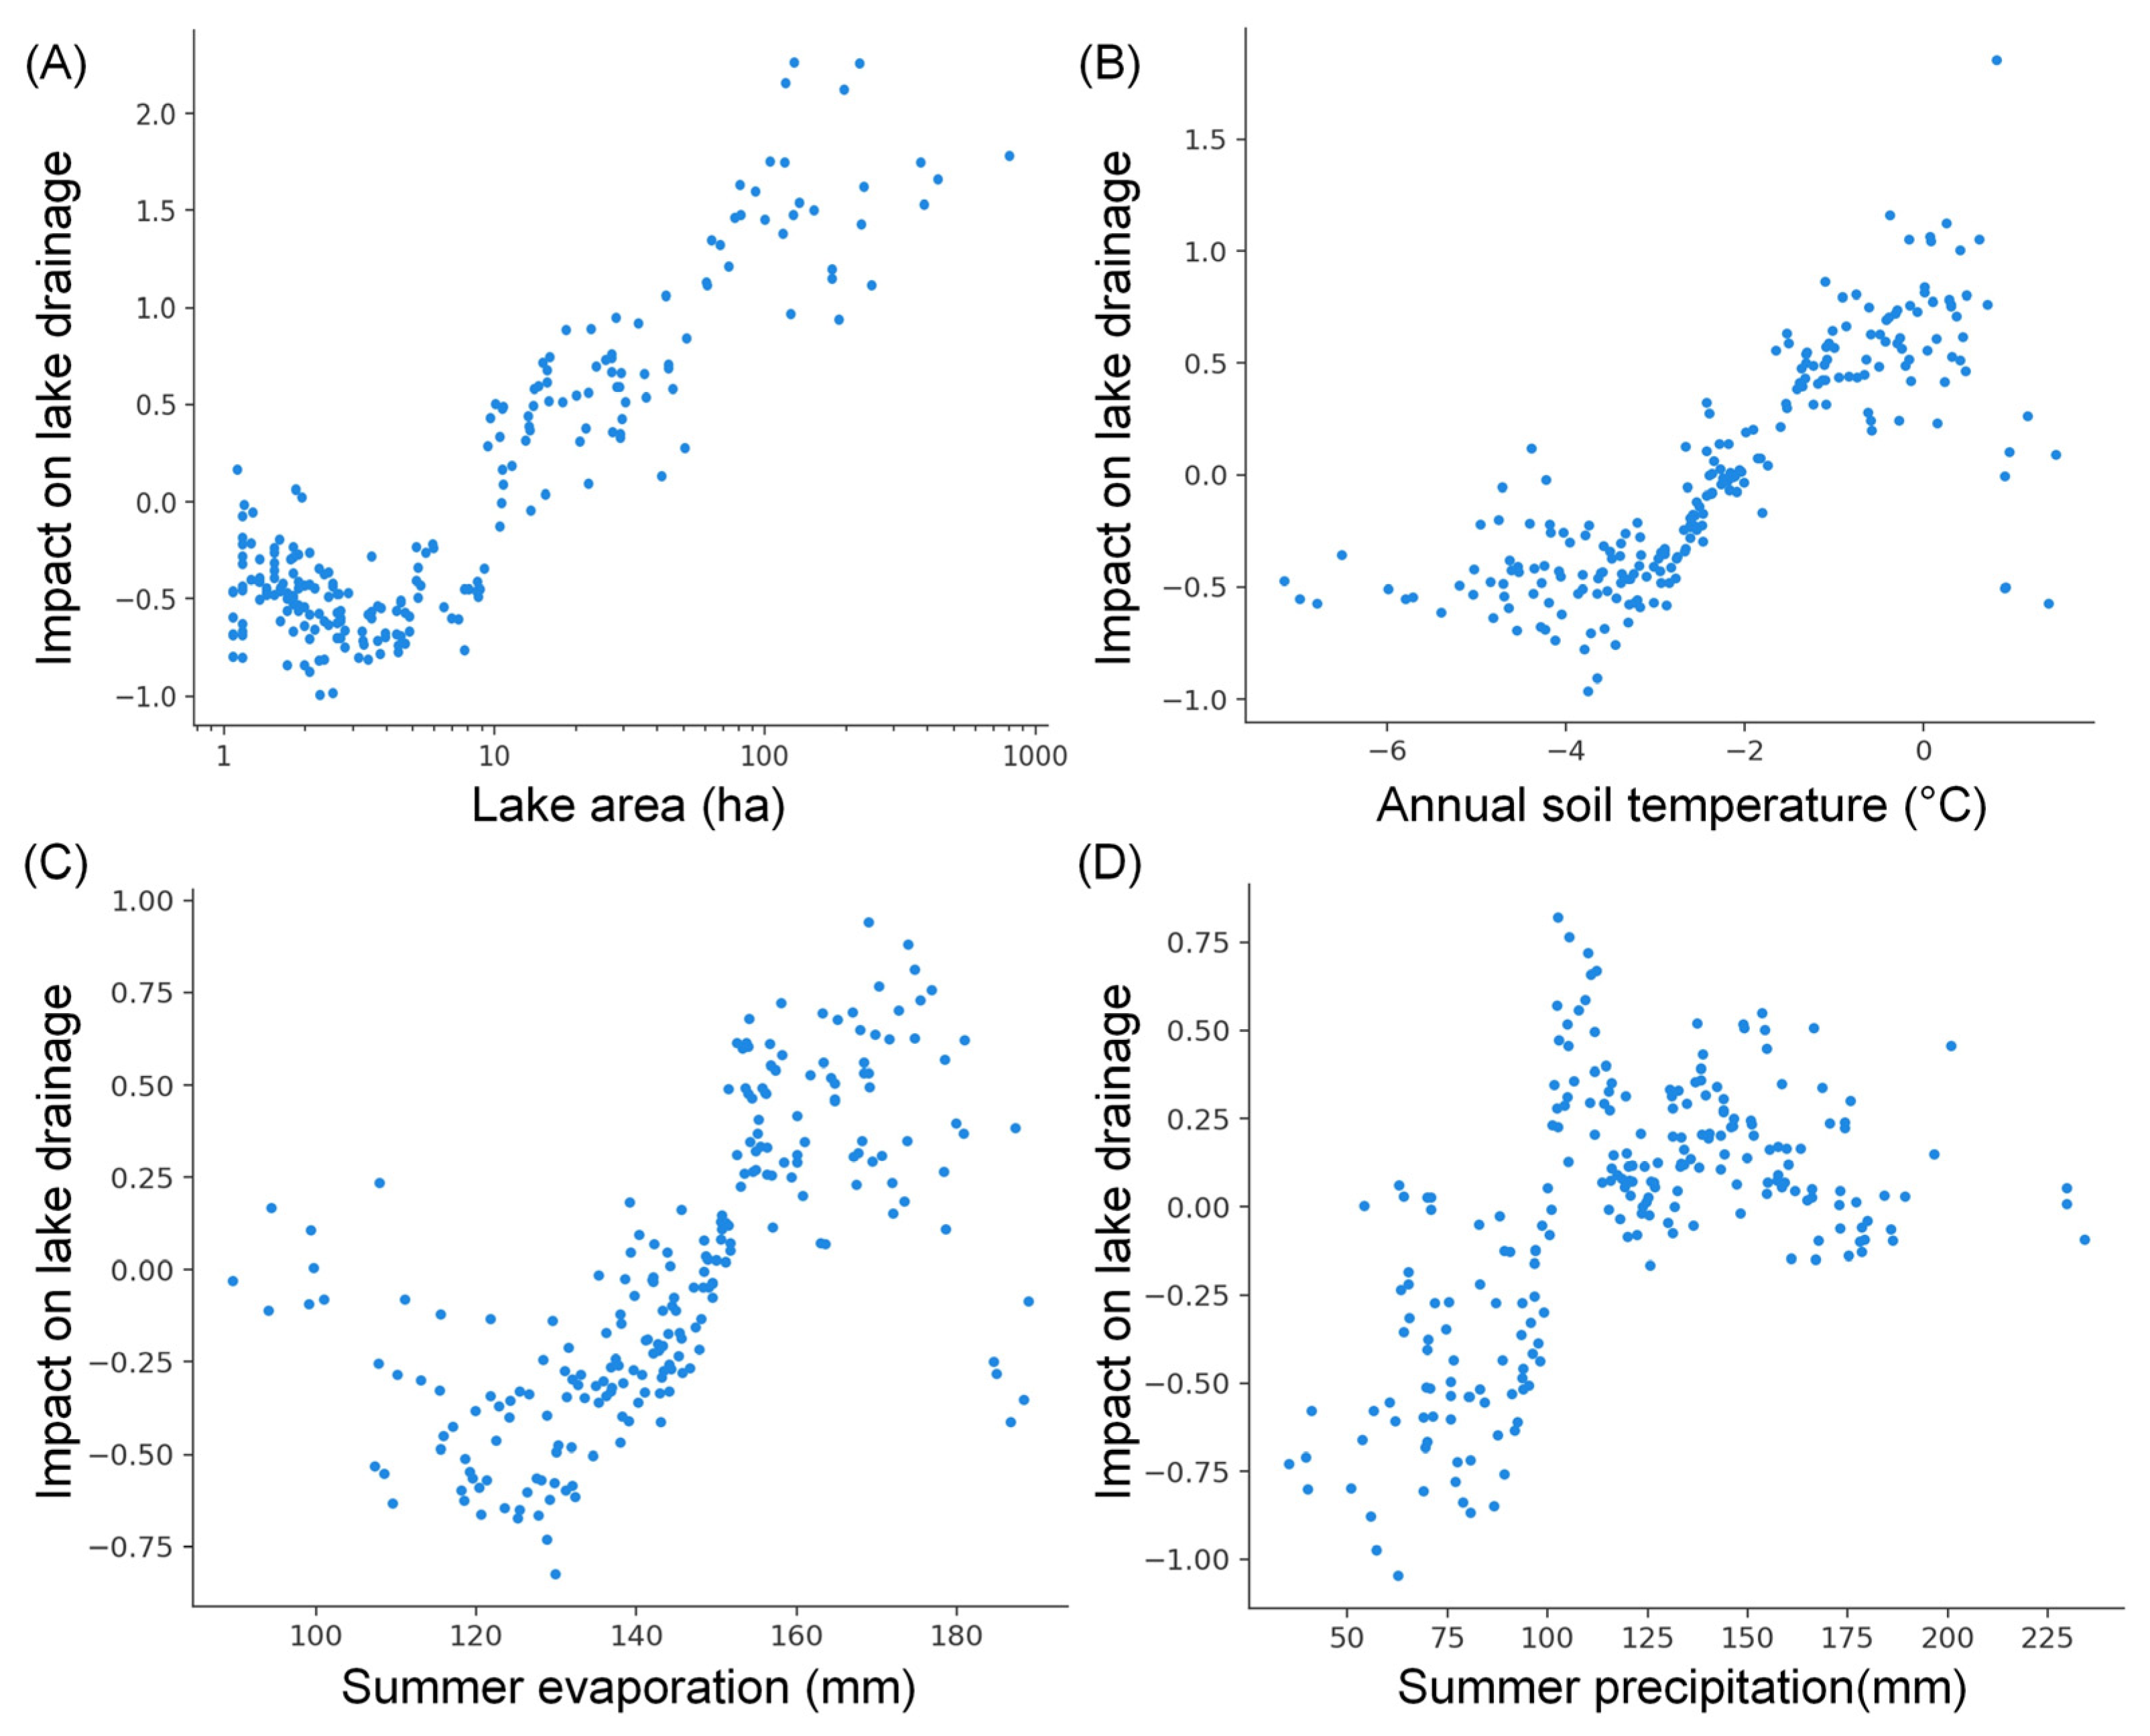
3.5. Machine Learning Analysis of Environmental Factors

To quantify the key factors influencing lake drainage events, we developed a GBDT classification model using the CatBoost implementation, with the lake drainage occurrence as the binary target label and climatic and environmental variables as the predictors. Hyperparameter tuning using cross-validation was conducted to optimize model performance. The optimized CatBoost model achieved an accuracy of 0.81, precision of 0.76, recall of 0.48, and AUC Score of 0.71 on the test set (Figure 12A), demonstrating reliable prediction of lake drainage events based on environmental conditions. Feature importance analysis using Shapley values revealed that the top ten most important factors influencing the occurrence of lake drainage events (in descending order of importance) are lake area, annual mean soil temperature, summer evaporation, summer precipitation, latitude, evaporation slope, soil temperature slope, precipitation slope, air temperature slope, and whether it is located in the Yedoma region (Figure 12B).
The dependence plots demonstrate that higher values in lake area, annual soil temperature, summer evaporation, and summer precipitation have an overall positive impact on lake drainage (Figure 13), with the magnitude of the effect decreasing in the order of variable importance. For annual soil temperature, its impact on lake drainage linearly increases from −4 to 0 °C and stabilizes beyond 0 °C. Similarly, for summer evaporation, its influence on lake drainage linearly increases from 120 to 160 mm and stabilizes beyond 160 mm. Additionally, lake drainage events exhibit a notable increase beyond summer precipitation thresholds of 100 mm (Figure 13).

4. Discussion

The Northeast Siberian coastal tundra ecoregion is characterized by a high ground ice content and a well-established lake thermokarst landscape. In the course of this study, 238 instances of thermokarst lake drainage events were identified within this region from 2000 to 2020. The spatial density of these detected events aligns with findings from previous surveys in other Arctic regions [31], indicating that this area experiences active thermokarst processes of comparable magnitude. The mapped distribution and density of drained lakes not only enhance our understanding of thermokarst lake dynamics but also identify regions of particularly high risk that may require adaptive strategies [55]. The clustered spatial distribution of drained lakes suggests that localized geological and hydrological factors may contribute to thermokarst activity in certain areas. The drainage hotspots are prominently situated along rivers and lake-rich lowlands, where abundant surface water and sediment transport likely accelerate permafrost degradation [56]. These zones could also overlay faults or unconsolidated Yedoma deposits that are susceptible to subsidence upon thawing [45]. The spatial clusters imply potential underground linkages between nearby lakes, which might sequentially drain if connected through subsurface taliks or fissures [31]. Further analysis integrating geological maps and hydrological models could corroborate whether these clusters result from inherent landscape vulnerabilities or interconnected drainage systems [24].
Within the study area, larger lakes exhibit a higher susceptibility to drainage events, followed by medium-sized lakes, with smaller lakes having the lowest probability of drainage occurrences. This observed trend is likely attributed to the hydrological and geological characteristics of the local large lakes, making them more prone to shoreline breaches. It is important to emphasize that this pattern may be specific to this study area, as geological and topographical conditions differ across the entire Arctic region, potentially leading to distinct evolutionary processes for lakes of various sizes. The acquisition of more regional data in the future is imperative to establish a comprehensive understanding of lake evolution on an Arctic-wide scale. Moreover, drainage events from larger lakes are more prone to triggering flood hazards. Once drainage occurs, the initially emptied lake basins frequently undergo annual catastrophic drainage, propelled by the peak of snowmelt that fosters the creation of transient lakes, consequently leading to swift and persistent flood peaks [12,57]. Hence, the asynchronous occurrence of lake drainage spikes among lakes of varying sizes necessitates further mechanistic research and modeling to predict future drainage risks.
In this study, a relatively strict threshold of 50% drainage ratio was used for selecting lake drainage events. Reducing this threshold would lead to detecting more drained lakes, but it could also introduce more erroneous noise into the results. Moreover, the study did not assess the probability of missed detection for drained lakes due to the lack of an available reference dataset in the study area. An evaluation suggested that the most likely scenarios for missed detection of drained lakes are in coastal regions and areas with dense lake overlap, as multiple lake objects might be identified as interconnected entities. The workflow employed in this study, utilizing the LandTrendr algorithm and the TimeSync tool, showcases impressive capabilities for accurately dating drainage events through dense time series of Landsat remote sensing satellite data. To enhance the accuracy of drainage event detection, the integration of supplementary data sources hold promise. The Sentinel-2 mission from Copernicus offers higher-resolution multispectral data, which is anticipated to enhance observation density and monitoring capabilities in high-latitude permafrost regions as its image archive grows [58].
The machine learning model identified soil temperature, precipitation, evaporation, and lake size as governing factors, illuminating the climatic and morphometric controls on drainage. However, subsurface factors like talik development are also influential but hard to characterize. Generally, the process of lake drainage can be linked to external factors like climate change and internal factors such as river erosion and talik development [9,59,60]. Lake drainage is determined by a range of factors, including the attributes of surrounding permafrost, lake characteristics, climate, vegetation, topography, and human activities [9]. Common mechanisms driving lake drainage comprise ice wedge degradation, snow damming, coastal erosion, river overflow, and channel shifting [9,61]. Long-term records of additional variables like active layer depth and thermokarst coverage will be needed to unravel the drivers and impacts of lake drainage. With further refinement using additional data, machine learning models show promise for integrating complex interactions and predicting lake stability under future climate scenarios.
Monitoring the dynamics of thermokarst lakes is essential for deepening our understanding of permafrost degradation processes and assessing the broader impacts of climate change on the landscape [30,62]. These lakes and their associated drained areas constitute 20% of the permafrost regions around the Arctic [7], playing integral roles in terrestrial and aquatic ecosystems. To comprehensively assess thermokarst lake dynamics, it is necessary to consider the lake expansion process, which is the opposite of lake drainage. Compared to thermokarst lake drainage events, the expansion of thermokarst lakes is a relatively slow process, with typical expansion rates ranging from tens to hundreds of centimeters per year [30]. In previous studies, Nitze et al. (2017) [27] analyzed lake dynamics in the Kolyma Lowland of Northeastern Siberia, reporting a 0.51% decrease in lake area between 1999 and 2014, indicating that the region experienced more lake area loss due to lake drainage events than gain from lake expansion. However, Veremeeva et al. (2021) [24] reported an increase in the lake area by 0.89% (1999–2013) and 4.15% (1999–2018) in the Kolyma Lowland, suggesting a dominant role in lake expansion. Future research should conduct more detailed analyses to assess the changing trends in total thermokarst lake area within specific regions and determine which of these two partially offsetting processes predominates.
Predictions of continued Arctic warming underscore the potential intensification of thermokarst lake dynamics in the region. Climate change could exacerbate lake disappearances and lead to a landscape increasingly dominated by drained areas [3,22,29,62]. The significant effects of lake drainage on vegetation, carbon storage, methane emissions, and wildlife habitats also demand precise quantification [32,63,64]. Integrating remote sensing of vegetation changes with field-based assessments of soil carbon stocks and greenhouse gas fluxes will provide a comprehensive evaluation of the overall carbon cycling effects arising from thermokarst lake drainage across the landscape [3,62,65]. Surface subsidence and shifts in hydrology might adversely impact habitats for migratory birds and mammals [66]. Overall, this research advances the understanding of thermokarst lake evolution in the Northeast Siberian tundra yet also reveals knowledge gaps to be addressed by integrating remote sensing, field studies, and modeling.

Author Contributions

Conceptualization, A.L. and Y.C.; methodology, A.L.; software, A.L.; validation, A.L. and Y.C.; formal analysis, A.L. and Y.C.; data curation, A.L.; writing—original draft preparation, A.L.; writing—review and editing, A.L. and Y.C.; visualization, A.L.; supervision, Y.C. and X.C.; project administration, X.C.; funding acquisition, X.C. All authors have read and agreed to the published version of the manuscript.

Funding

This research was funded by the National Natural Science Foundation of China (Grant No. 42306254 and 42301148), the National Outstanding Youth Foundation of China (Grant No. 41925027), and the Natural Science Foundation of Shandong Province, China (Grant No. ZR2023QD022).

Data Availability Statement

The data can be sourced from the following providers: United States Geological Survey Landsat 5, 7, and 8 Surface Reflectance data, ECMWF climate reanalysis data (ERA5-Land), and the Joint Research Centre (JRC) surface water product are accessible through Google Earth Engine (https://developers.google.com/earth-engine/datasets/, accessed on 1 September 2023). Maps of the lake thermokarst landscape, Yedoma, and ground ice content are available at https://dx.doi.org/10.3334/ORNLDAAC/1332, https://maps.awi.de/awimaps/projects/public/?cu=ice_rich_yedoma_permafrost, and https://doi.org/10.7265/skbg-kf16, all accessed on 1 September 2023.

Acknowledgments

We would like to express our sincere appreciation to the Google Earth Engine platform for providing the invaluable capabilities of remote sensing cloud computing. Our gratitude extends to the Joint Research Centre (JRC) for offering their exceptional water dynamic product. We are also thankful for the indispensable contributions of the LandTrendr algorithm and the TimeSync tool, which greatly supported our research. Additionally, we extend our thanks to the dedicated researchers who created the permafrost data products, as they proved essential for our study.

Conflicts of Interest

The authors declare no conflict of interest.

References

  1. Box, J.E.; Colgan, W.T.; Christensen, T.R.; Schmidt, N.M.; Lund, M.; Parmentier, F.-J.W.; Brown, R.; Bhatt, U.S.; Euskirchen, E.S.; Romanovsky, V.E.; et al. Key indicators of Arctic climate change: 1971–2017. Environ. Res. Lett. 2019, 14, 045010. [Google Scholar] [CrossRef]
  2. Biskaborn, B.K.; Smith, S.L.; Noetzli, J.; Matthes, H.; Vieira, G.; Streletskiy, D.A.; Schoeneich, P.; Romanovsky, V.E.; Lewkowicz, A.G.; Abramov, A.; et al. Permafrost is warming at a global scale. Nat. Commun. 2019, 10, 264. [Google Scholar] [CrossRef]
  3. Turetsky, M.R.; Abbott, B.W.; Jones, M.C.; Anthony, K.W.; Olefeldt, D.; Schuur, E.A.G.; Grosse, G.; Kuhry, P.; Hugelius, G.; Koven, C.; et al. Carbon release through abrupt permafrost thaw. Nat. Geosci. 2020, 13, 138–143. [Google Scholar] [CrossRef]
  4. Natali, S.M.; Holdren, J.P.; Rogers, B.M.; Treharne, R.; Duffy, P.B.; Pomerance, R.; MacDonald, E. Permafrost carbon feedbacks threaten global climate goals. Proc. Natl. Acad. Sci. USA 2021, 118, e2100163188. [Google Scholar] [CrossRef] [PubMed]
  5. Kokelj, S.V.; Jorgenson, M.T. Advances in Thermokarst Research. Permafr. Periglac. Process. 2013, 24, 108–119. [Google Scholar] [CrossRef]
  6. Turetsky, M.R.; Abbott, B.W.; Jones, M.C.; Anthony, K.W.; Olefeldt, D.; Schuur, E.A.G.; Koven, C.; McGuire, A.D.; Grosse, G.; Kuhry, P.; et al. Permafrost collapse is accelerating carbon release. Nature 2019, 569, 32–34. [Google Scholar] [CrossRef]
  7. Olefeldt, D.; Goswami, S.; Grosse, G.; Hayes, D.; Hugelius, G.; Kuhry, P.; McGuire, A.D.; Romanovsky, V.E.; Sannel, A.B.K.; Schuur, E.A.G.; et al. Circumpolar distribution and carbon storage of thermokarst landscapes. Nat. Commun. 2016, 7, 13043. [Google Scholar] [CrossRef]
  8. Loiko, S.; Klimova, N.; Kuzmina, D.; Pokrovsky, O. Lake Drainage in Permafrost Regions Produces Variable Plant Communities of High Biomass and Productivity. Plants 2020, 9, 867. [Google Scholar] [CrossRef]
  9. Jones, B.M.; Grosse, G.; Farquharson, L.M.; Roy-Léveillée, P.; Veremeeva, A.; Kanevskiy, M.Z.; Gaglioti, B.V.; Breen, A.L.; Parsekian, A.D.; Ulrich, M.; et al. Lake and drained lake basin systems in lowland permafrost regions. Nat. Rev. Earth Environ. 2022, 3, 85–98. [Google Scholar] [CrossRef]
  10. Anthony, K.M.W.; Zimov, S.A.; Grosse, G.; Jones, M.C.; Anthony, P.M.; Iii, F.S.C.; Finlay, J.C.; Mack, M.C.; Davydov, S.; Frenzel, P.; et al. A shift of thermokarst lakes from carbon sources to sinks during the Holocene epoch. Nature 2014, 511, 452–456. [Google Scholar] [CrossRef]
  11. Mu, C.; Mu, M.; Wu, X.; Jia, L.; Fan, C.; Peng, X.; Ping, C.; Wu, Q.; Xiao, C.; Liu, J. High carbon emissions from thermokarst lakes and their determinants in the Tibet Plateau. Glob. Chang. Biol. 2023, 29, 2732–2745. [Google Scholar] [CrossRef]
  12. Arp, C.D.; Jones, B.M.; Hinkel, K.M.; Kane, D.L.; Whitman, M.S.; Kemnitz, R. Recurring outburst floods from drained lakes: An emerging Arctic hazard. Front. Ecol. Environ. 2020, 18, 384–390. [Google Scholar] [CrossRef]
  13. Magnússon, R..; Limpens, J.; van Huissteden, J.; Kleijn, D.; Maximov, T.C.; Rotbarth, R.; Sass-Klaassen, U.; Heijmans, M.M.P.D. Rapid Vegetation Succession and Coupled Permafrost Dynamics in Arctic Thaw Ponds in the Siberian Lowland Tundra. J. Geophys. Res. Biogeosci. 2020, 125, e2019JG005618. [Google Scholar] [CrossRef]
  14. Zakharova, E.A.; Kouraev, A.V.; Stephane, G.; Franck, G.; Desyatkin, R.V.; Desyatkin, A.R. Recent dynamics of hydro-ecosystems in thermokarst depressions in Central Siberia from satellite and in situ observations: Importance for agriculture and human life. Sci. Total. Environ. 2018, 615, 1290–1304. [Google Scholar] [CrossRef] [PubMed]
  15. Yang, G.; Zheng, Z.; Abbott, B.W.; Olefeldt, D.; Knoblauch, C.; Song, Y.; Kang, L.; Qin, S.; Peng, Y.; Yang, Y. Characteristics of methane emissions from alpine thermokarst lakes on the Tibetan Plateau. Nat. Commun. 2023, 14, 3121. [Google Scholar] [CrossRef] [PubMed]
  16. Nitze, I.; Grosse, G. Detection of landscape dynamics in the Arctic Lena Delta with temporally dense Landsat time-series stacks. Remote Sens. Environ. 2016, 181, 27–41. [Google Scholar] [CrossRef]
  17. Olthof, I.; Fraser, R.H.; Schmitt, C. Landsat-based mapping of thermokarst lake dynamics on the Tuktoyaktuk Coastal Plain, Northwest Territories, Canada since 1985. Remote Sens. Environ. 2015, 168, 194–204. [Google Scholar] [CrossRef]
  18. Hinkel, K.M.; Jones, B.M.; Eisner, W.R.; Cuomo, C.J.; Beck, R.A.; Frohn, R. Methods to assess natural and anthropogenic thaw lake drainage on the western Arctic coastal plain of northern Alaska. J. Geophys. Res. Earth Surf. 2007, 112, F02S16. [Google Scholar] [CrossRef]
  19. Smith, L.C.; Sheng, Y.; Macdonald, G.M.; Hinzman, L.D. Disappearing Arctic Lakes. Science 2005, 308, 1429. [Google Scholar] [CrossRef] [PubMed]
  20. Jones, B.M.; Grosse, G.; Arp, C.D.; Jones, M.C.; Anthony, K.W.; Romanovsky, V.E. Modern thermokarst lake dynamics in the continuous permafrost zone, northern Seward Peninsula, Alaska. J. Geophys. Res. Biogeosci. 2011, 116, 1–13. [Google Scholar] [CrossRef]
  21. Chen, M.; Rowland, J.C.; Wilson, C.J.; Altmann, G.L.; Brumby, S.P. Temporal and spatial pattern of thermokarst lake area changes at Yukon Flats, Alaska. Hydrol. Process. 2014, 28, 837–852. [Google Scholar] [CrossRef]
  22. Nitze, I.; Grosse, G.; Jones, B.M.; Romanovsky, V.E.; Boike, J. Remote sensing quantifies widespread abundance of permafrost region disturbances across the Arctic and Subarctic. Nat. Commun. 2018, 9, 5423. [Google Scholar] [CrossRef] [PubMed]
  23. Lindgren, P.R.; Farquharson, L.M.; E Romanovsky, V.; Grosse, G. Landsat-based lake distribution and changes in western Alaska permafrost regions between the 1970s and 2010s. Environ. Res. Lett. 2021, 16, 025006. [Google Scholar] [CrossRef]
  24. Veremeeva, A.; Nitze, I.; Günther, F.; Grosse, G.; Rivkina, E. Geomorphological and Climatic Drivers of Thermokarst Lake Area Increase Trend (1999–2018) in the Kolyma Lowland Yedoma Region, North-Eastern Siberia. Remote Sens. 2021, 13, 178. [Google Scholar] [CrossRef]
  25. Su, Y.; Ran, Y.; Zhang, G.; Li, X. Remotely sensed lake area changes in permafrost regions of the Arctic and the Tibetan Plateau between 1987 and 2017. Sci. Total Environ. 2023, 880, 163355. [Google Scholar] [CrossRef]
  26. Luo, J.; Niu, F.; Lin, Z.; Liu, M.; Yin, G. Thermokarst lake changes between 1969 and 2010 in the Beilu River Basin, Qinghai–Tibet Plateau, China. Sci. Bull. 2015, 60, 556–564. [Google Scholar] [CrossRef]
  27. Nitze, I.; Grosse, G.; Jones, B.M.; Arp, C.D.; Ulrich, M.; Fedorov, A.; Veremeeva, A. Landsat-Based Trend Analysis of Lake Dynamics across Northern Permafrost Regions. Remote Sens. 2017, 9, 640. [Google Scholar] [CrossRef]
  28. Lara, M.J.; Chipman, M.L. Periglacial Lake Origin Influences the Likelihood of Lake Drainage in Northern Alaska. Remote Sens. 2021, 13, 852. [Google Scholar] [CrossRef]
  29. Webb, E.E.; Liljedahl, A.K.; Cordeiro, J.A.; Loranty, M.M.; Witharana, C.; Lichstein, J.W. Permafrost thaw drives surface water decline across lake-rich regions of the Arctic. Nat. Clim. Chang. 2022, 12, 841–846. [Google Scholar] [CrossRef]
  30. Chen, Y.; Liu, A.; Cheng, X. Landsat-Based Monitoring of Landscape Dynamics in Arctic Permafrost Region. J. Remote Sens. 2022, 2022, 9765087. [Google Scholar] [CrossRef]
  31. Chen, Y.; Liu, A.; Cheng, X. Detection of thermokarst lake drainage events in the northern Alaska permafrost region. Sci. Total Environ. 2022, 807, 150828. [Google Scholar] [CrossRef] [PubMed]
  32. Chen, Y.; Liu, A.; Cheng, X. Vegetation grows more luxuriantly in Arctic permafrost drained lake basins. Glob. Chang. Biol. 2021, 27, 5865–5876. [Google Scholar] [CrossRef] [PubMed]
  33. Pekel, J.-F.; Cottam, A.; Gorelick, N.; Belward, A.S. High-resolution mapping of global surface water and its long-term changes. Nature 2016, 540, 418–422. [Google Scholar] [CrossRef]
  34. Kennedy, R.E.; Yang, Z.; Cohen, W.B. Detecting trends in forest disturbance and recovery using yearly Landsat time series: 1. LandTrendr—Temporal segmentation algorithms. Remote Sens. Environ. 2010, 114, 2897–2910. [Google Scholar] [CrossRef]
  35. Kennedy, R.E.; Yang, Z.; Gorelick, N.; Braaten, J.; Cavalcante, L.; Cohen, W.B.; Healey, S. Implementation of the LandTrendr Algorithm on Google Earth Engine. Remote Sens. 2018, 10, 691. [Google Scholar] [CrossRef]
  36. Olson, D.M.; Dinerstein, E.; Wikramanayake, E.D.; Burgess, N.D.; Powell, G.V.N.; Underwood, E.C.; D’amico, J.A.; Itoua, I.; Strand, H.E.; Morrison, J.C.; et al. Terrestrial Ecoregions of the World: A New Map of Life on Earth: A New Global Map of Terrestrial Ecoregions Provides an Innovative Tool for Conserving Biodiversity. Bioscience 2001, 51, 933–938. [Google Scholar] [CrossRef]
  37. Zanaga, D.; Van De Kerchove, R.; Daems, D.; De Keersmaecker, W.; Brockmann, C.; Kirches, G.; Wevers, J.; Cartus, O.; Santoro, M.; Fritz, S.; et al. ESA WorldCover 10 m 2021 V200. 2022. Available online: https://zenodo.org/record/7254221 (accessed on 1 September 2023).
  38. Gorelick, N.; Hancher, M.; Dixon, M.; Ilyushchenko, S.; Thau, D.; Moore, R. Google Earth Engine: Planetary-scale geospatial analysis for everyone. Remote Sens. Environ. 2017, 202, 18–27. [Google Scholar] [CrossRef]
  39. Chen, J.; Zhu, X.; Vogelmann, J.E.; Gao, F.; Jin, S. A simple and effective method for filling gaps in Landsat ETM+ SLC-off images. Remote Sens. Environ. 2011, 115, 1053–1064. [Google Scholar] [CrossRef]
  40. Roy, D.P.; Kovalskyy, V.; Zhang, H.K.; Vermote, E.F.; Yan, L.; Kumar, S.S.; Egorov, A. Characterization of Landsat-7 to Landsat-8 reflective wavelength and normalized difference vegetation index continuity. Remote Sens. Environ. 2016, 185, 57–70. [Google Scholar] [CrossRef]
  41. Feyisa, G.L.; Meilby, H.; Fensholt, R.; Proud, S.R. Automated Water Extraction Index: A new technique for surface water mapping using Landsat imagery. Remote Sens. Environ. 2014, 140, 23–35. [Google Scholar] [CrossRef]
  42. Muñoz-Sabater, J.; Dutra, E.; Agustí-Panareda, A.; Albergel, C.; Arduini, G.; Balsamo, G.; Boussetta, S.; Choulga, M.; Harrigan, S.; Hersbach, H.; et al. ERA5-Land: A state-of-the-art global reanalysis dataset for land applications. Earth Syst. Sci. Data 2021, 13, 4349–4383. [Google Scholar] [CrossRef]
  43. Morin, P.; Porter, C.; Cloutier, M.; Howat, I.; Noh, M.-J.; Willis, M.; Bates, B.; Willamson, C.; Peterman, K. ArcticDEM; A Publically Available, High Resolution Elevation Model of the Arctic. In Proceedings of the Geophysical Research Abstracts, Vienna, Austria, 24–28 April 2016; Volume 18. [Google Scholar]
  44. Brown, J.; Ferrians, O.J., Jr.; Heginbottom, J.A.; Melnikov, E.S. Circum-Arctic Map of Permafrost and Ground-Ice Conditions, 2nd ed.; U.S. Geological Survey: Reston, VA, USA, 1997. [Google Scholar]
  45. Strauss, J.; Laboor, S.; Schirrmeister, L.; Fedorov, A.N.; Fortier, D.; Froese, D.; Fuchs, M.; Günther, F.; Grigoriev, M.; Harden, J.; et al. Circum-Arctic Map of the Yedoma Permafrost Domain. Front. Earth Sci. 2021, 9, 758360. [Google Scholar] [CrossRef]
  46. Wang, B.; Chen, Z.; Zhu, A.-X.; Hao, Y.; Xu, C. Multi-Level Classification Based on Trajectory Features of Time Series for Monitoring Impervious Surface Expansions. Remote Sens. 2019, 11, 640. [Google Scholar] [CrossRef]
  47. Zhu, L.; Liu, X.; Wu, L.; Tang, Y.; Meng, Y. Long-Term Monitoring of Cropland Change near Dongting Lake, China, Using the LandTrendr Algorithm with Landsat Imagery. Remote Sens. 2019, 11, 1234. [Google Scholar] [CrossRef]
  48. He, T.; Xiao, W.; Zhao, Y.; Deng, X.; Hu, Z. Identification of waterlogging in Eastern China induced by mining subsidence: A case study of Google Earth Engine time-series analysis applied to the Huainan coal field. Remote Sens. Environ. 2020, 242, 111742. [Google Scholar] [CrossRef]
  49. Cohen, W.B.; Yang, Z.; Kennedy, R. Detecting trends in forest disturbance and recovery using yearly Landsat time series: 2. TimeSync—Tools for calibration and validation. Remote Sens. Environ. 2010, 114, 2911–2924. [Google Scholar] [CrossRef]
  50. Ke, G.; Meng, Q.; Finley, T.; Wang, T.; Chen, W.; Ma, W.; Ye, Q.; Liu, T.Y. LightGBM: A Highly Efficient Gradient Boosting Decision Tree. In Proceedings of the Advances in Neural Information Processing Systems, Long Beach, CA, USA, 4–9 December 2017; Volume 2017. [Google Scholar]
  51. Prokhorenkova, L.; Gusev, G.; Vorobev, A.; Dorogush, A.V.; Gulin, A. Catboost: Unbiased Boosting with Categorical Features. In Proceedings of the Advances in Neural Information Processing Systems, Montreal, QC, Canada, 3–8 December 2018; Volume 2018. [Google Scholar]
  52. Pedregosa, F.; Varoquaux, G.; Gramfort, A.; Michel, V.; Thirion, B.; Grisel, O.; Blondel, M.; Prettenhofer, P.; Weiss, R.; Dubourg, V.; et al. Scikit-Learn: Machine Learning in Python. J. Mach. Learn. Res. 2011, 12, 2825–2830. [Google Scholar]
  53. Lundberg, S.M.; Erion, G.; Chen, H.; DeGrave, A.; Prutkin, J.M.; Nair, B.; Katz, R.; Himmelfarb, J.; Bansal, N.; Lee, S.-I. From local explanations to global understanding with explainable AI for trees. Nat. Mach. Intell. 2020, 2, 56–67. [Google Scholar] [CrossRef]
  54. Grosse, G.; Jones, B.; Arp, C. Thermokarst Lakes, Drainage, and Drained Basins. In Treatise on Geomorphology; Elsevier: Amsterdam, The Netherlands, 2013; Volume 1–14. [Google Scholar]
  55. Jones, M.C.; Berkelhammer, M.; Keller, K.J.; Yoshimura, K.; Wooller, M.J. High sensitivity of Bering Sea winter sea ice to winter insolation and carbon dioxide over the last 5500 years. Sci. Adv. 2020, 6, eaaz9588. [Google Scholar] [CrossRef]
  56. Beel, C.R.; Lamoureux, S.F.; Orwin, J.F. Fluvial Response to a Period of Hydrometeorological Change and Landscape Disturbance in the Canadian High Arctic. Geophys. Res. Lett. 2018, 45, 10446–10455. [Google Scholar] [CrossRef]
  57. Bowling, L.C.; Kane, D.L.; Gieck, R.E.; Hinzman, L.D.; Lettenmaier, D.P. The role of surface storage in a low-gradient Arctic watershed. Water Resour. Res. 2003, 39, 1087. [Google Scholar] [CrossRef]
  58. Runge, A.; Grosse, G. Mosaicking Landsat and Sentinel-2 Data to Enhance LandTrendr Time Series Analysis in Northern High Latitude Permafrost Regions. Remote Sens. 2020, 12, 2471. [Google Scholar] [CrossRef]
  59. Yoshikawa, K.; Hinzman, L.D. Shrinking thermokarst ponds and groundwater dynamics in discontinuous permafrost near council, Alaska. Permafr. Periglac. Process. 2003, 14, 151–160. [Google Scholar] [CrossRef]
  60. Lantz, T.C.; Turner, K.W. Changes in lake area in response to thermokarst processes and climate in Old Crow Flats, Yukon. J. Geophys. Res. Biogeosci. 2015, 120, 513–524. [Google Scholar] [CrossRef]
  61. Irrgang, A.M.; Bendixen, M.; Farquharson, L.M.; Baranskaya, A.V.; Erikson, L.H.; Gibbs, A.E.; Ogorodov, S.A.; Overduin, P.P.; Lantuit, H.; Grigoriev, M.N.; et al. Drivers, dynamics and impacts of changing Arctic coasts. Nat. Rev. Earth Environ. 2022, 3, 39–54. [Google Scholar] [CrossRef]
  62. Anthony, K.W.; von Deimling, T.S.; Nitze, I.; Frolking, S.; Emond, A.; Daanen, R.; Anthony, P.; Lindgren, P.; Jones, B.; Grosse, G. 21st-century modeled permafrost carbon emissions accelerated by abrupt thaw beneath lakes. Nat. Commun. 2018, 9, 3262. [Google Scholar] [CrossRef]
  63. Anthony, K.M.W.; Anthony, P. Constraining spatial variability of methane ebullition seeps in thermokarst lakes using point process models. J. Geophys. Res. Biogeosci. 2013, 118, 1015–1034. [Google Scholar] [CrossRef]
  64. Anthony, K.W.; Daanen, R.; Anthony, P.; von Deimling, T.S.; Ping, C.-L.; Chanton, J.P.; Grosse, G. Methane emissions proportional to permafrost carbon thawed in Arctic lakes since the 1950s. Nat. Geosci. 2016, 9, 679–682. [Google Scholar] [CrossRef]
  65. Zona, D.; Oechel, W.C.; Peterson, K.M.; Clements, R.J.; Paw U, K.T.; Ustin, S.L. Characterization of the carbon fluxes of a vegetated drained lake basin chronosequence on the Alaskan Arctic Coastal Plain. Glob. Chang. Biol. 2009, 16, 1870–1882. [Google Scholar] [CrossRef]
  66. Vincent, W.F.; Laybourn-Parry, J. Polar Lakes and Rivers: Limnology of Arctic and Antarctic Aquatic Ecosystems; Oxford University Press: Oxford, UK, 2009. [Google Scholar]
Figure 1. Overview of the study area. (A) Land cover map [37] depicting the Northeast Siberian coastal tundra ecoregion in Russia, with primary land cover types being herbaceous wetland and grassland. (B) Location overview map outlining the study area in red. (C) Satellite remote sensing image illustrating thermokarst lakes and drained lake basins.
Remotesensing 15 04396 g001
Figure 2. Flowchart depicting the process of detecting and analyzing thermokarst lake drainage events utilizing publicly accessible data products and the Google Earth Engine cloud platform.
Remotesensing 15 04396 g002
Figure 3. Schematic of object-based lake analysis. (A) Example of lake objects generated on the GEE platform, each uniquely identified and displayed in distinct colors. (B) Drained pixels are depicted in yellow, overlaid on the satellite remote sensing image.
Remotesensing 15 04396 g003
Figure 4. Schematic illustration of thermokarst lake drainage event detection using the LandTrendr algorithm. The image data are initially transformed into a spectral index and then divided into a sequence of straight-line segments by identifying vertices. The fitted LandTrendr line represents the processes of thermokarst lake drainage and subsequent evolution of drained lake basins.
Remotesensing 15 04396 g004
Figure 5. Visualization of the TimeSync tool, including the image window and trajectory window, used to validate detected lake drainage events.
Remotesensing 15 04396 g005
Figure 6. Geographical distribution and size categorization of drained lakes within the study area.
Remotesensing 15 04396 g006
Figure 7. Distribution map of detected drained lakes in the Northeast Siberian coastal tundra.
Remotesensing 15 04396 g007
Figure 8. Example of using the LandTrendr algorithm to detect the year of lake drainage. (AE) Landsat satellite images (NIR-R-G) for the years 2007, 2011, 2012, 2013, and 2018. (F) Pixel-wise detection results of lake drainage years.
Remotesensing 15 04396 g008
Figure 9. Temporal patterns of lake drainage events from 2001 to 2020, categorized by lake size.
Remotesensing 15 04396 g009
Figure 10. Variations of annual and summer averages for air temperature, soil temperature, precipitation, and evaporation from 2000 to 2020.
Remotesensing 15 04396 g010
Figure 11. Spatial distributions of trends in (A) evapotranspiration, (B) precipitation, (C) air temperature, and (D) soil temperature from 2000 to 2020 were calculated using Sen’s slope.
Remotesensing 15 04396 g011
Figure 12. (A) The receiver operating characteristic curve; (B) the top 10 variables ranked by importance. We calculated the relative importance of each variable by normalizing its importance value to the range of 0 to 1, where 1 represents the highest importance. Δ represents the Sen’s slope.
Remotesensing 15 04396 g012
Figure 13. Dependence plots for (A) lake area, (B) annual soil temperature, (C) summer evaporation, and (D) summer precipitation in relation to lake drainage. The y-axis represents Shapley values, where positive values indicate a promoting effect on lake drainage, with larger values having greater significance, and negative values indicating the opposite effect.
Remotesensing 15 04396 g013
Table 1. Control parameters of the Landtrendr algorithm.
ParameterValueDescription
spikeThreshold0.9Threshold for dampening the spikes
max_segments5Maximum number of segments for fitting
recovery_threshold0.25Recovery rate threshold for segmentation
pval_threshold0.1Models exceeding the threshold are discarded
min_observations6Min observations needed to perform fitting
bestModelProportion1.25Proportion threshold for a set of fitting models
Table 2. Optimal model hyperparameters for the CatBoost model.
ParameterValueDescription
iterations200Number of boosting iterations (trees)
learning_rate0.1Rate of weight adjustment in boosting
depth8Max depth of individual trees
l2_leaf_reg10L2 regularization for leaf weights
bagging_temperature0.0Strength of bagging
random_strength1.0Amount of noise in tree building
border_count255Splits considered for categorical features
min_data_in_leaf20Minimum samples in a leaf node
Disclaimer/Publisher’s Note: The statements, opinions and data contained in all publications are solely those of the individual author(s) and contributor(s) and not of MDPI and/or the editor(s). MDPI and/or the editor(s) disclaim responsibility for any injury to people or property resulting from any ideas, methods, instructions or products referred to in the content.

