
Drought-Related Spatiotemporal Cumulative and Time-Lag Effects on Terrestrial Vegetation across China


Abstract
:
1. Introduction
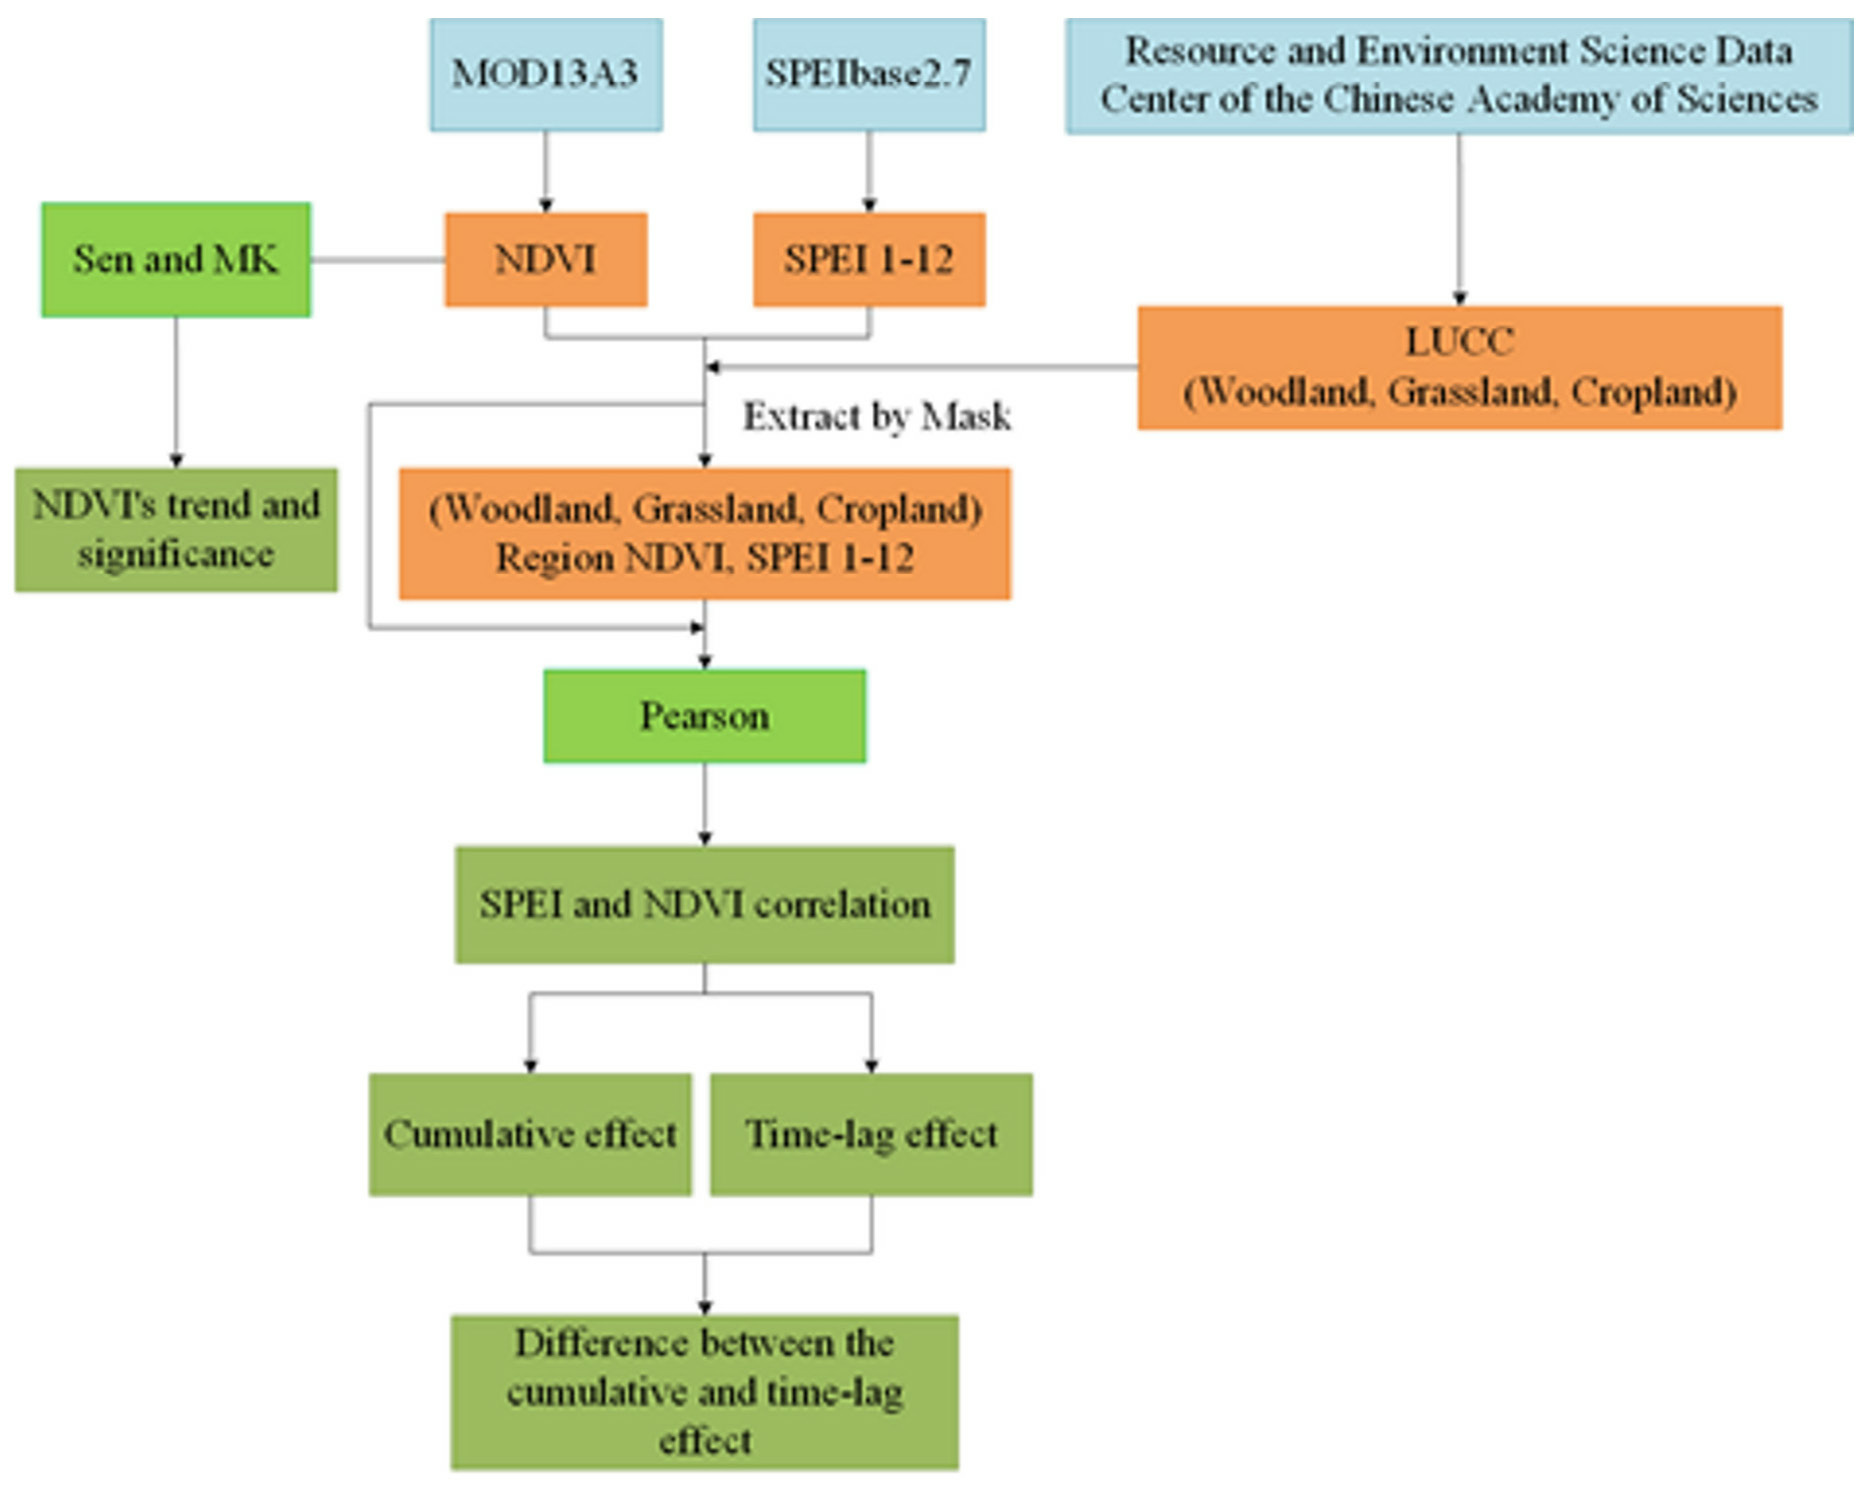
2. Data and Methods
2.1. Data
2.1.1. NDVI Dataset
2.1.2. Multi-Scalar SPEI Dataset
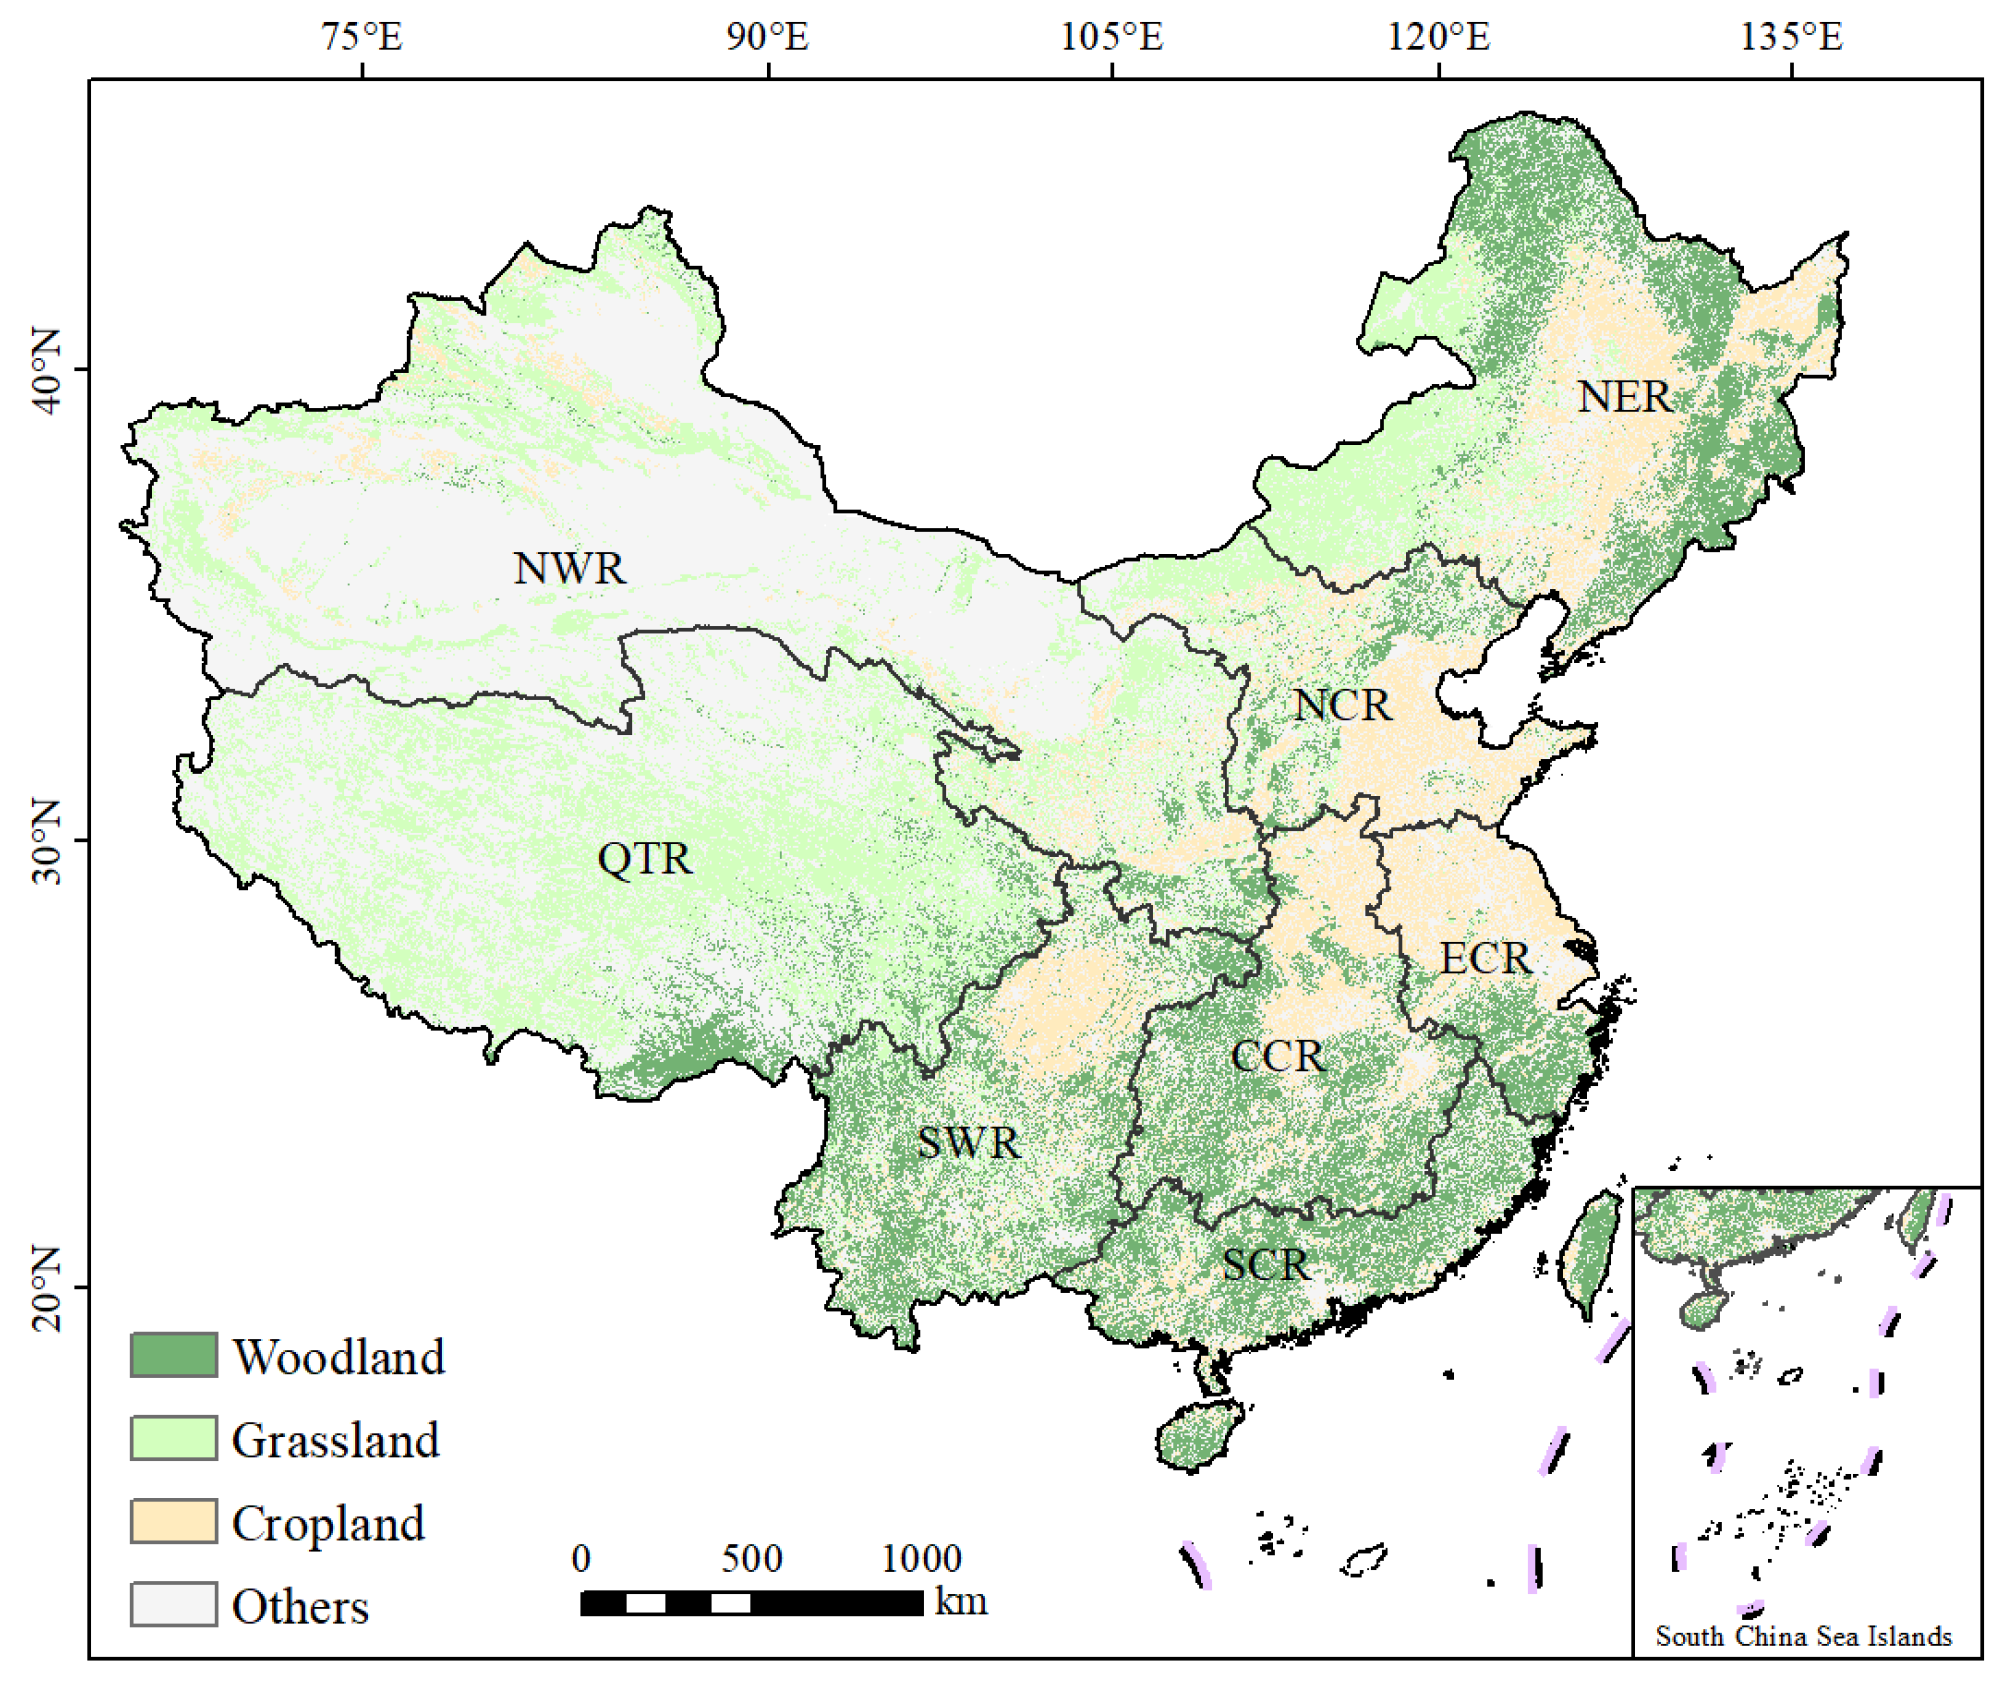
2.1.3. Land Use
2.2. Methods
2.2.1. Trend Analysis
2.2.2. Cumulative Effect
2.2.3. Time-Lag Effect
3. Result
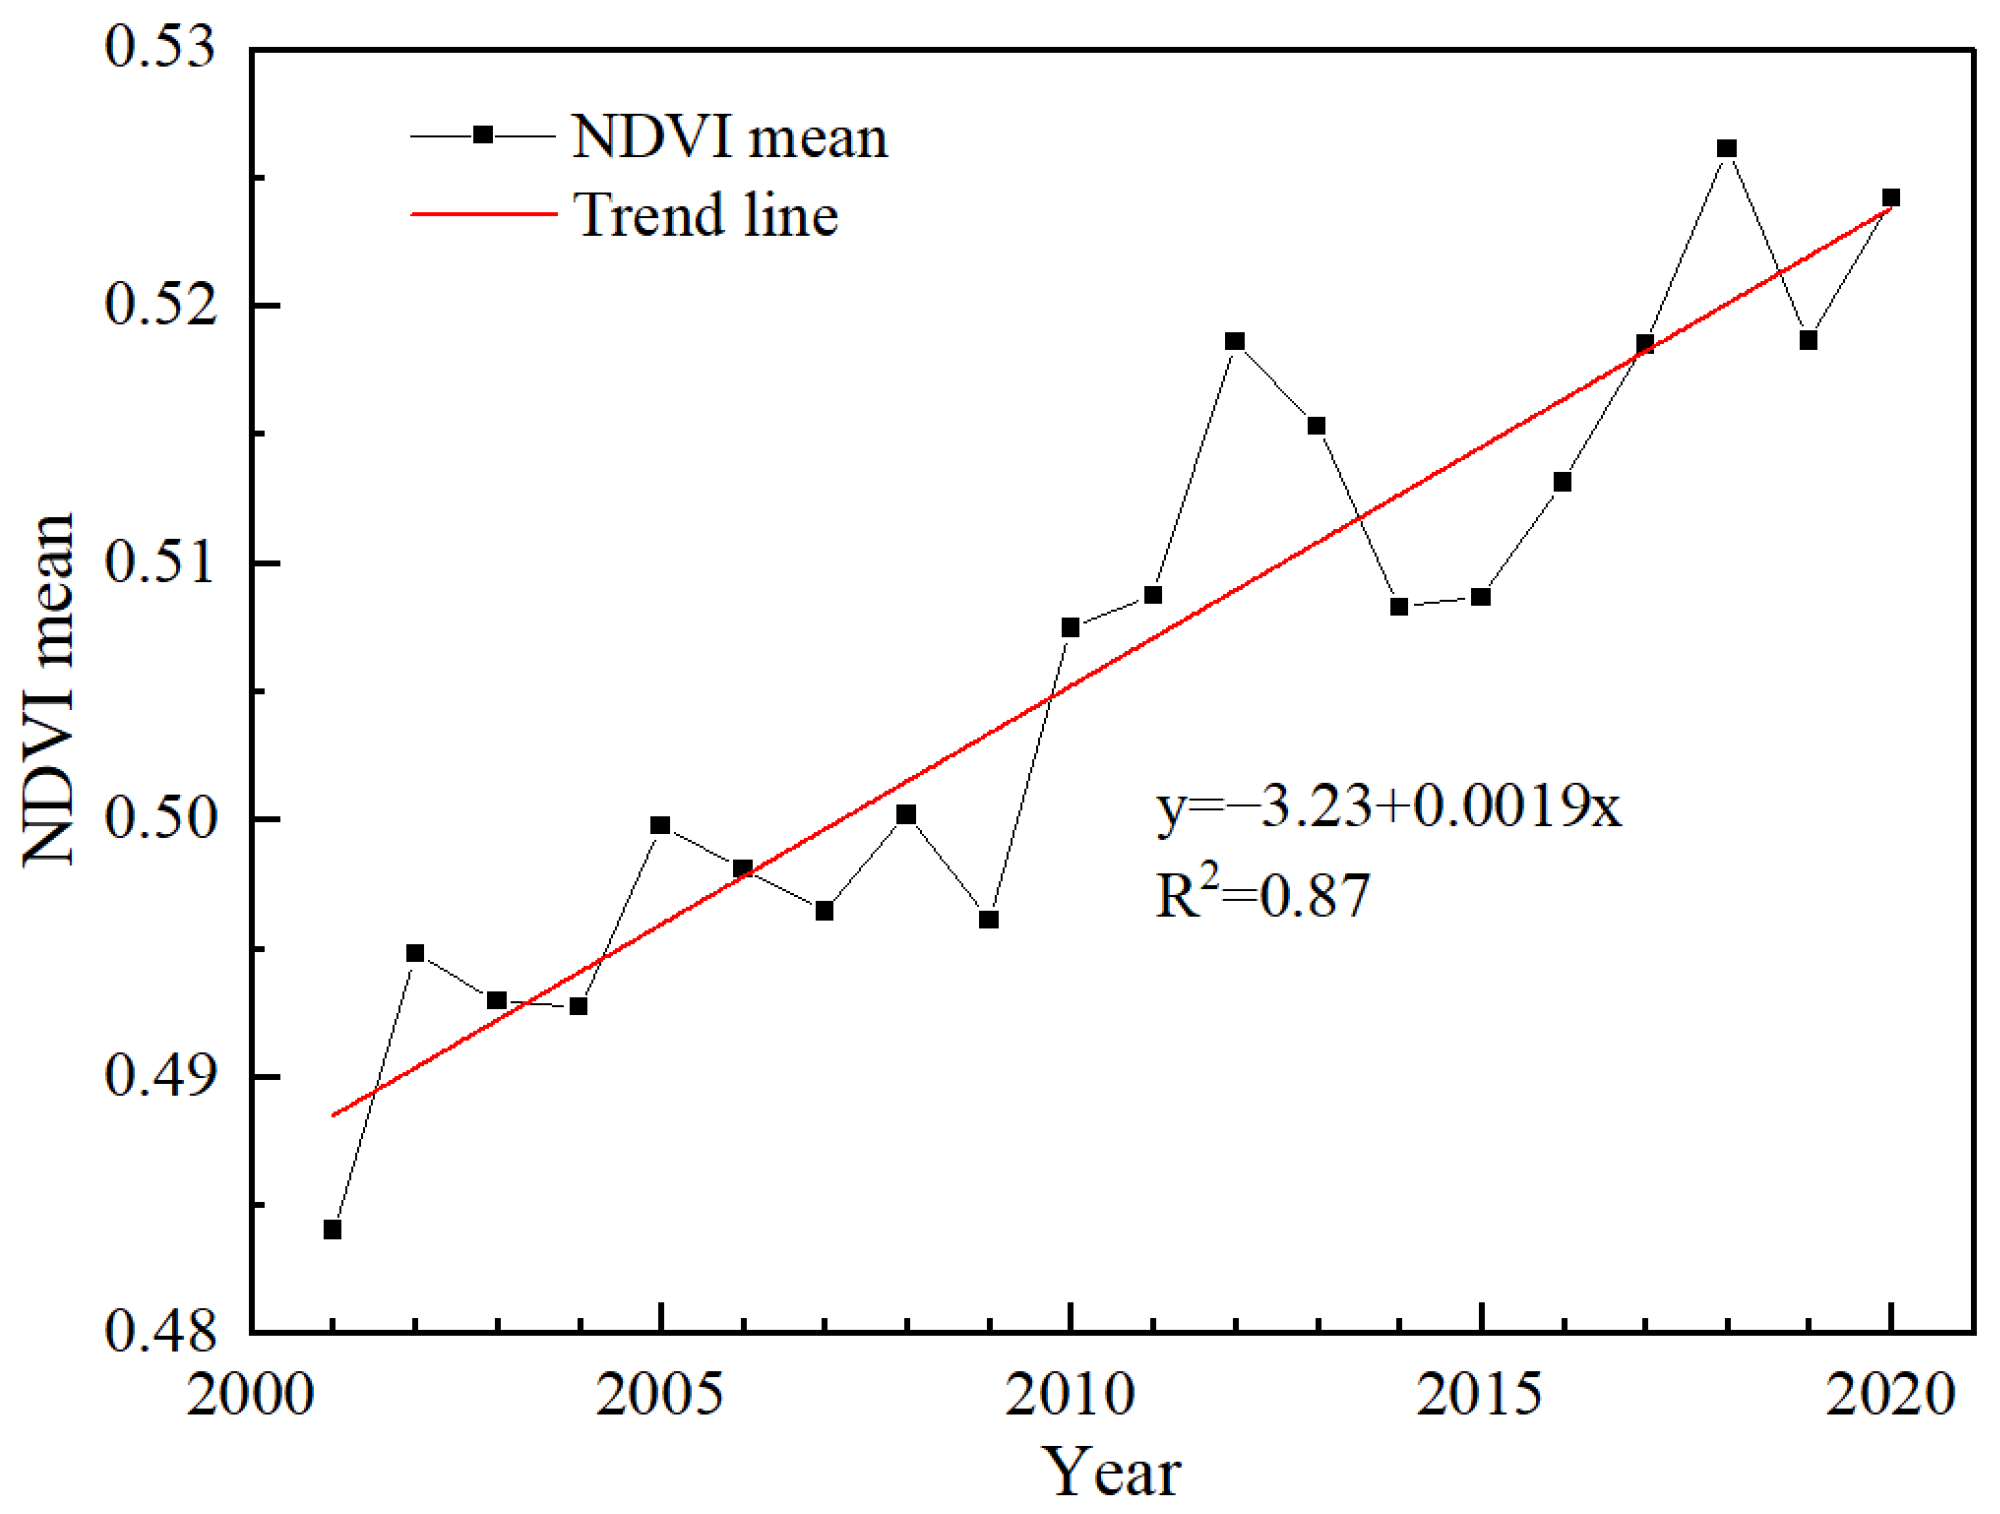
3.1. Spatial and Temporal Trends of NDVI
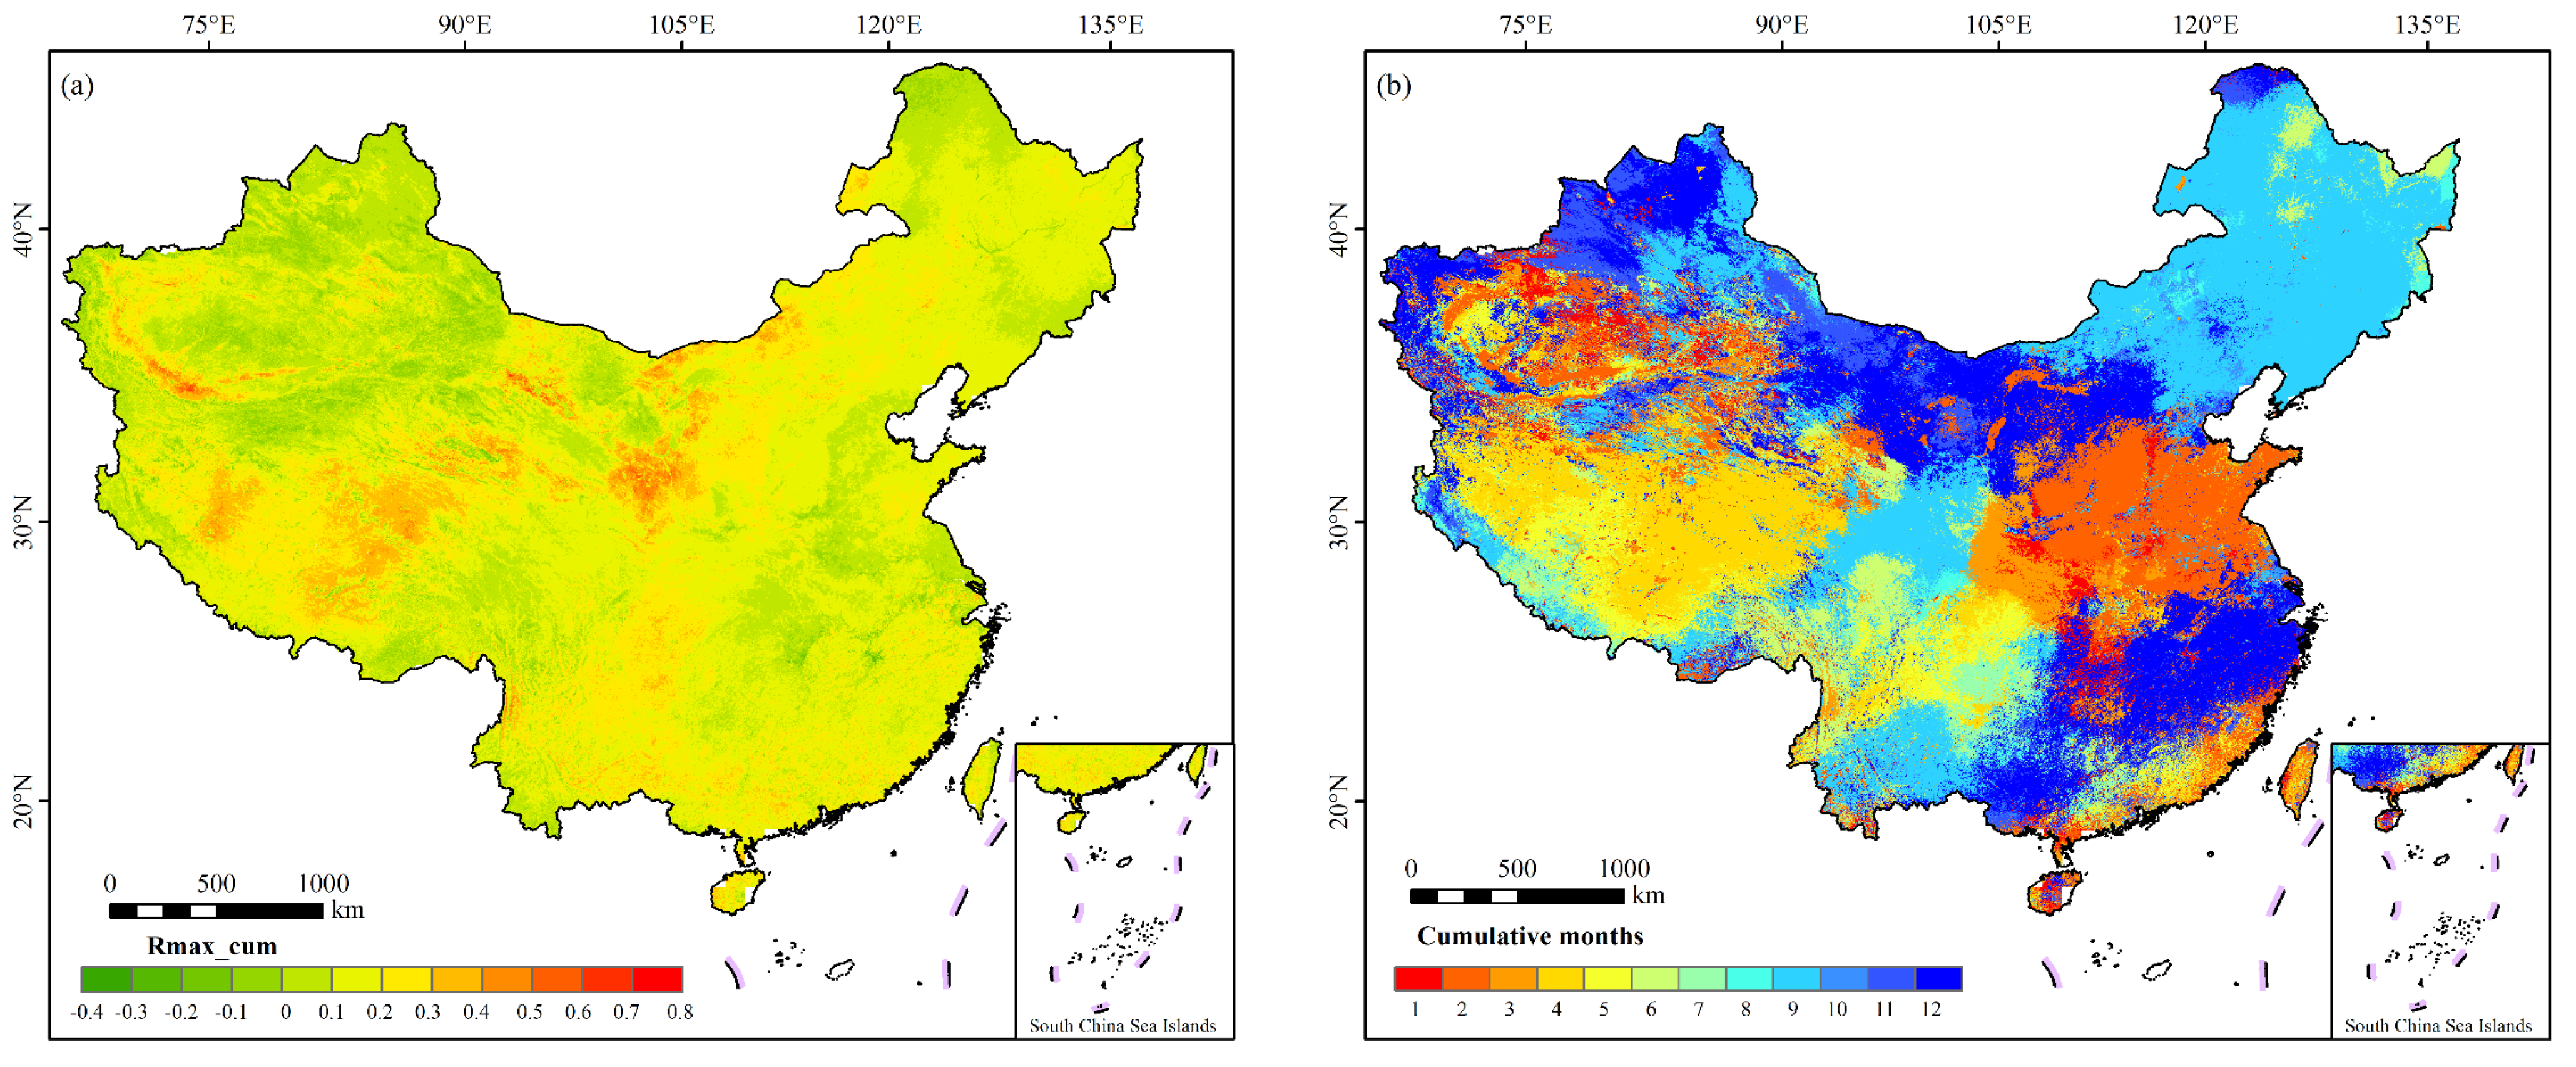
3.2. Cumulative Effect of Drought on Vegetation
3.2.1. Response of Vegetation to Drought at Different Time Scales
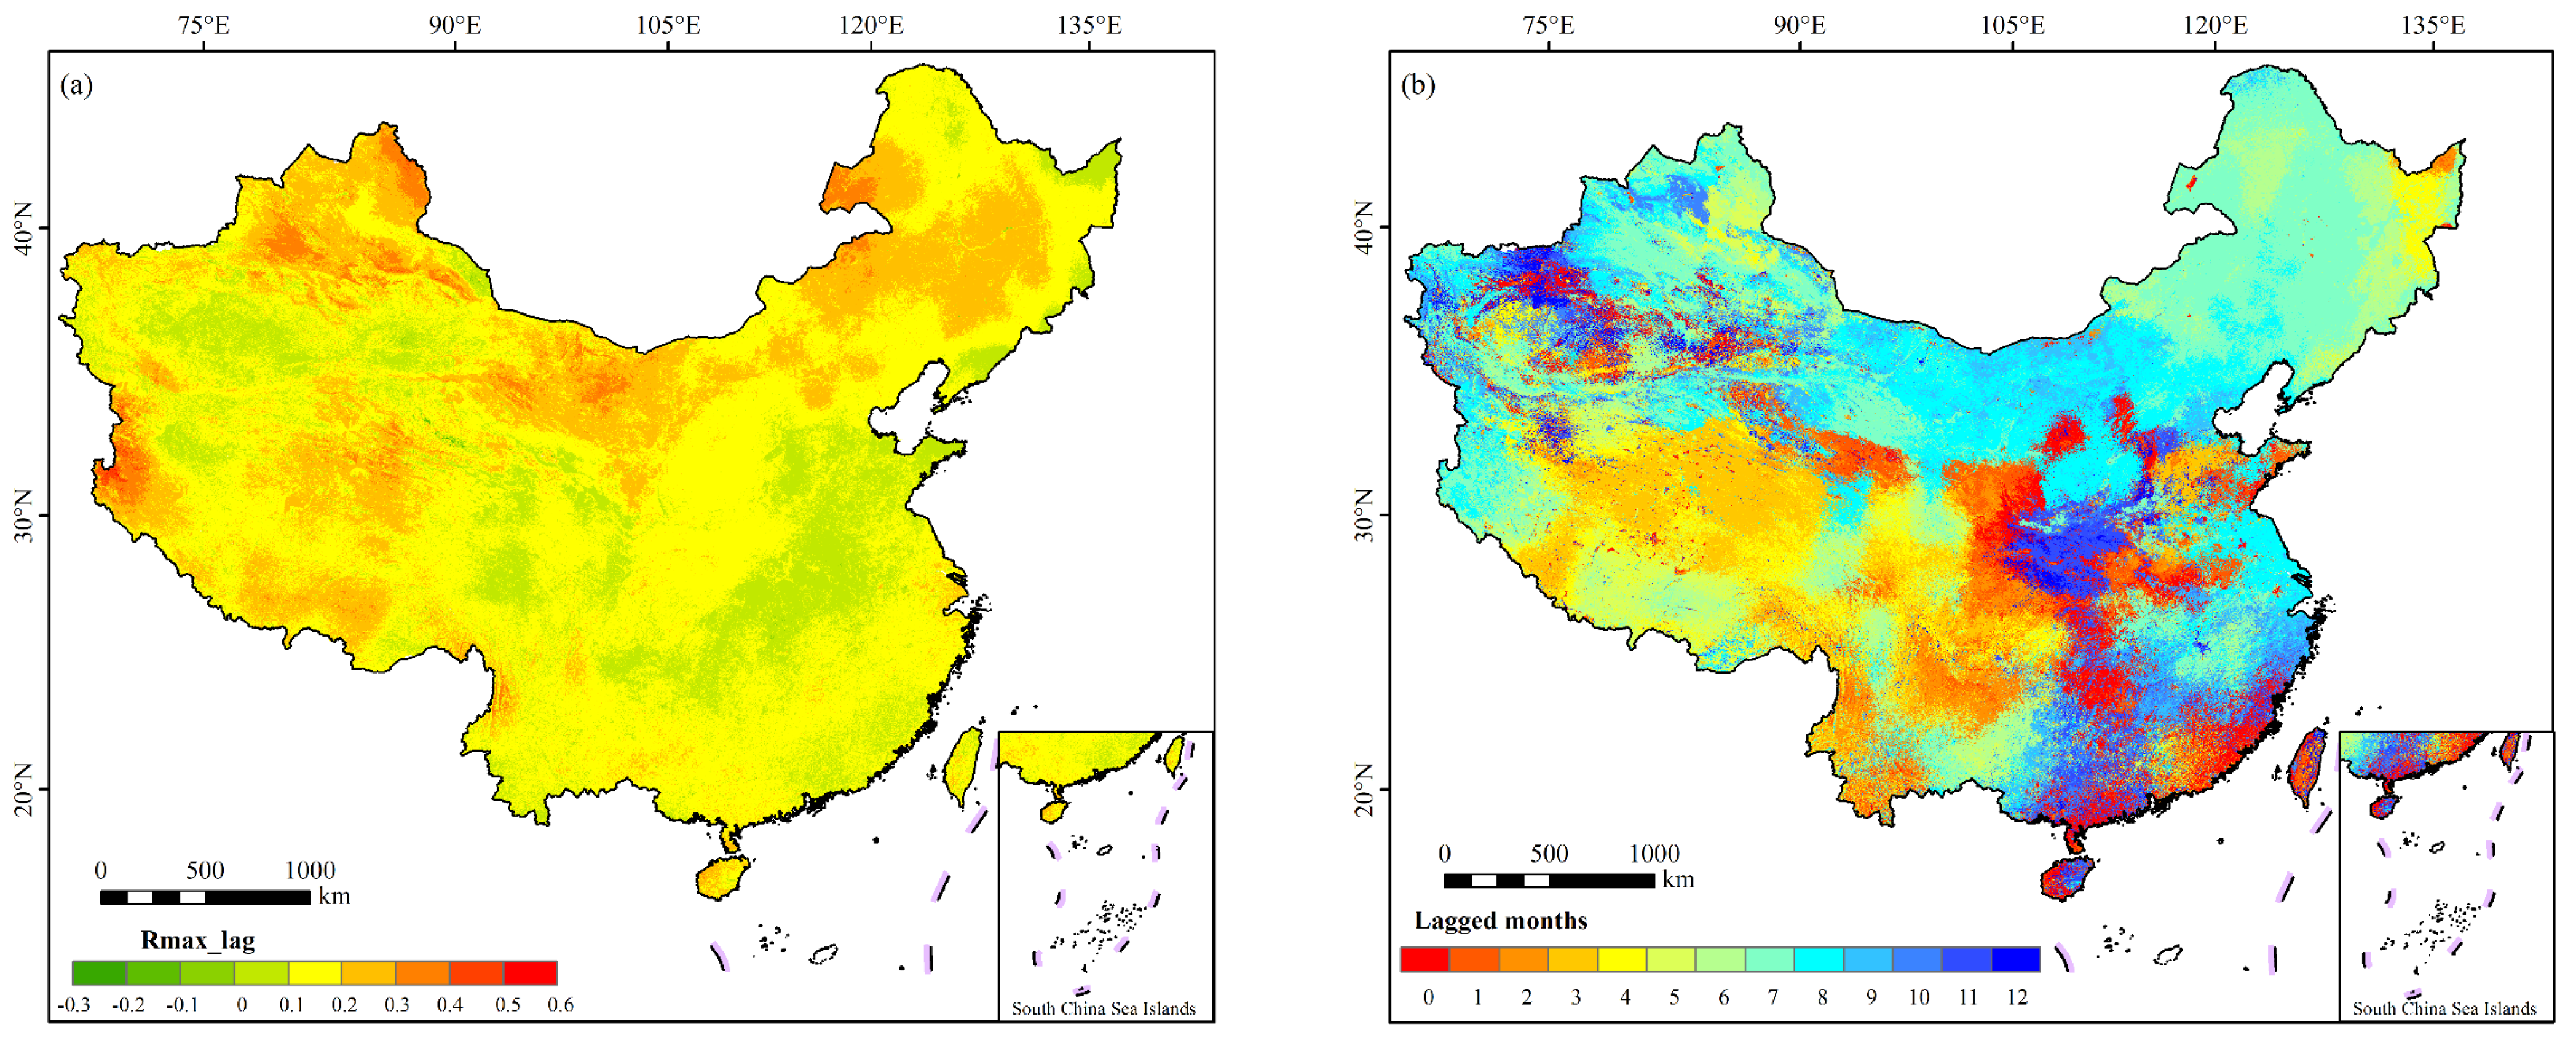
3.2.2. Spatial Distribution of the Cumulative Effect of Drought on Vegetation
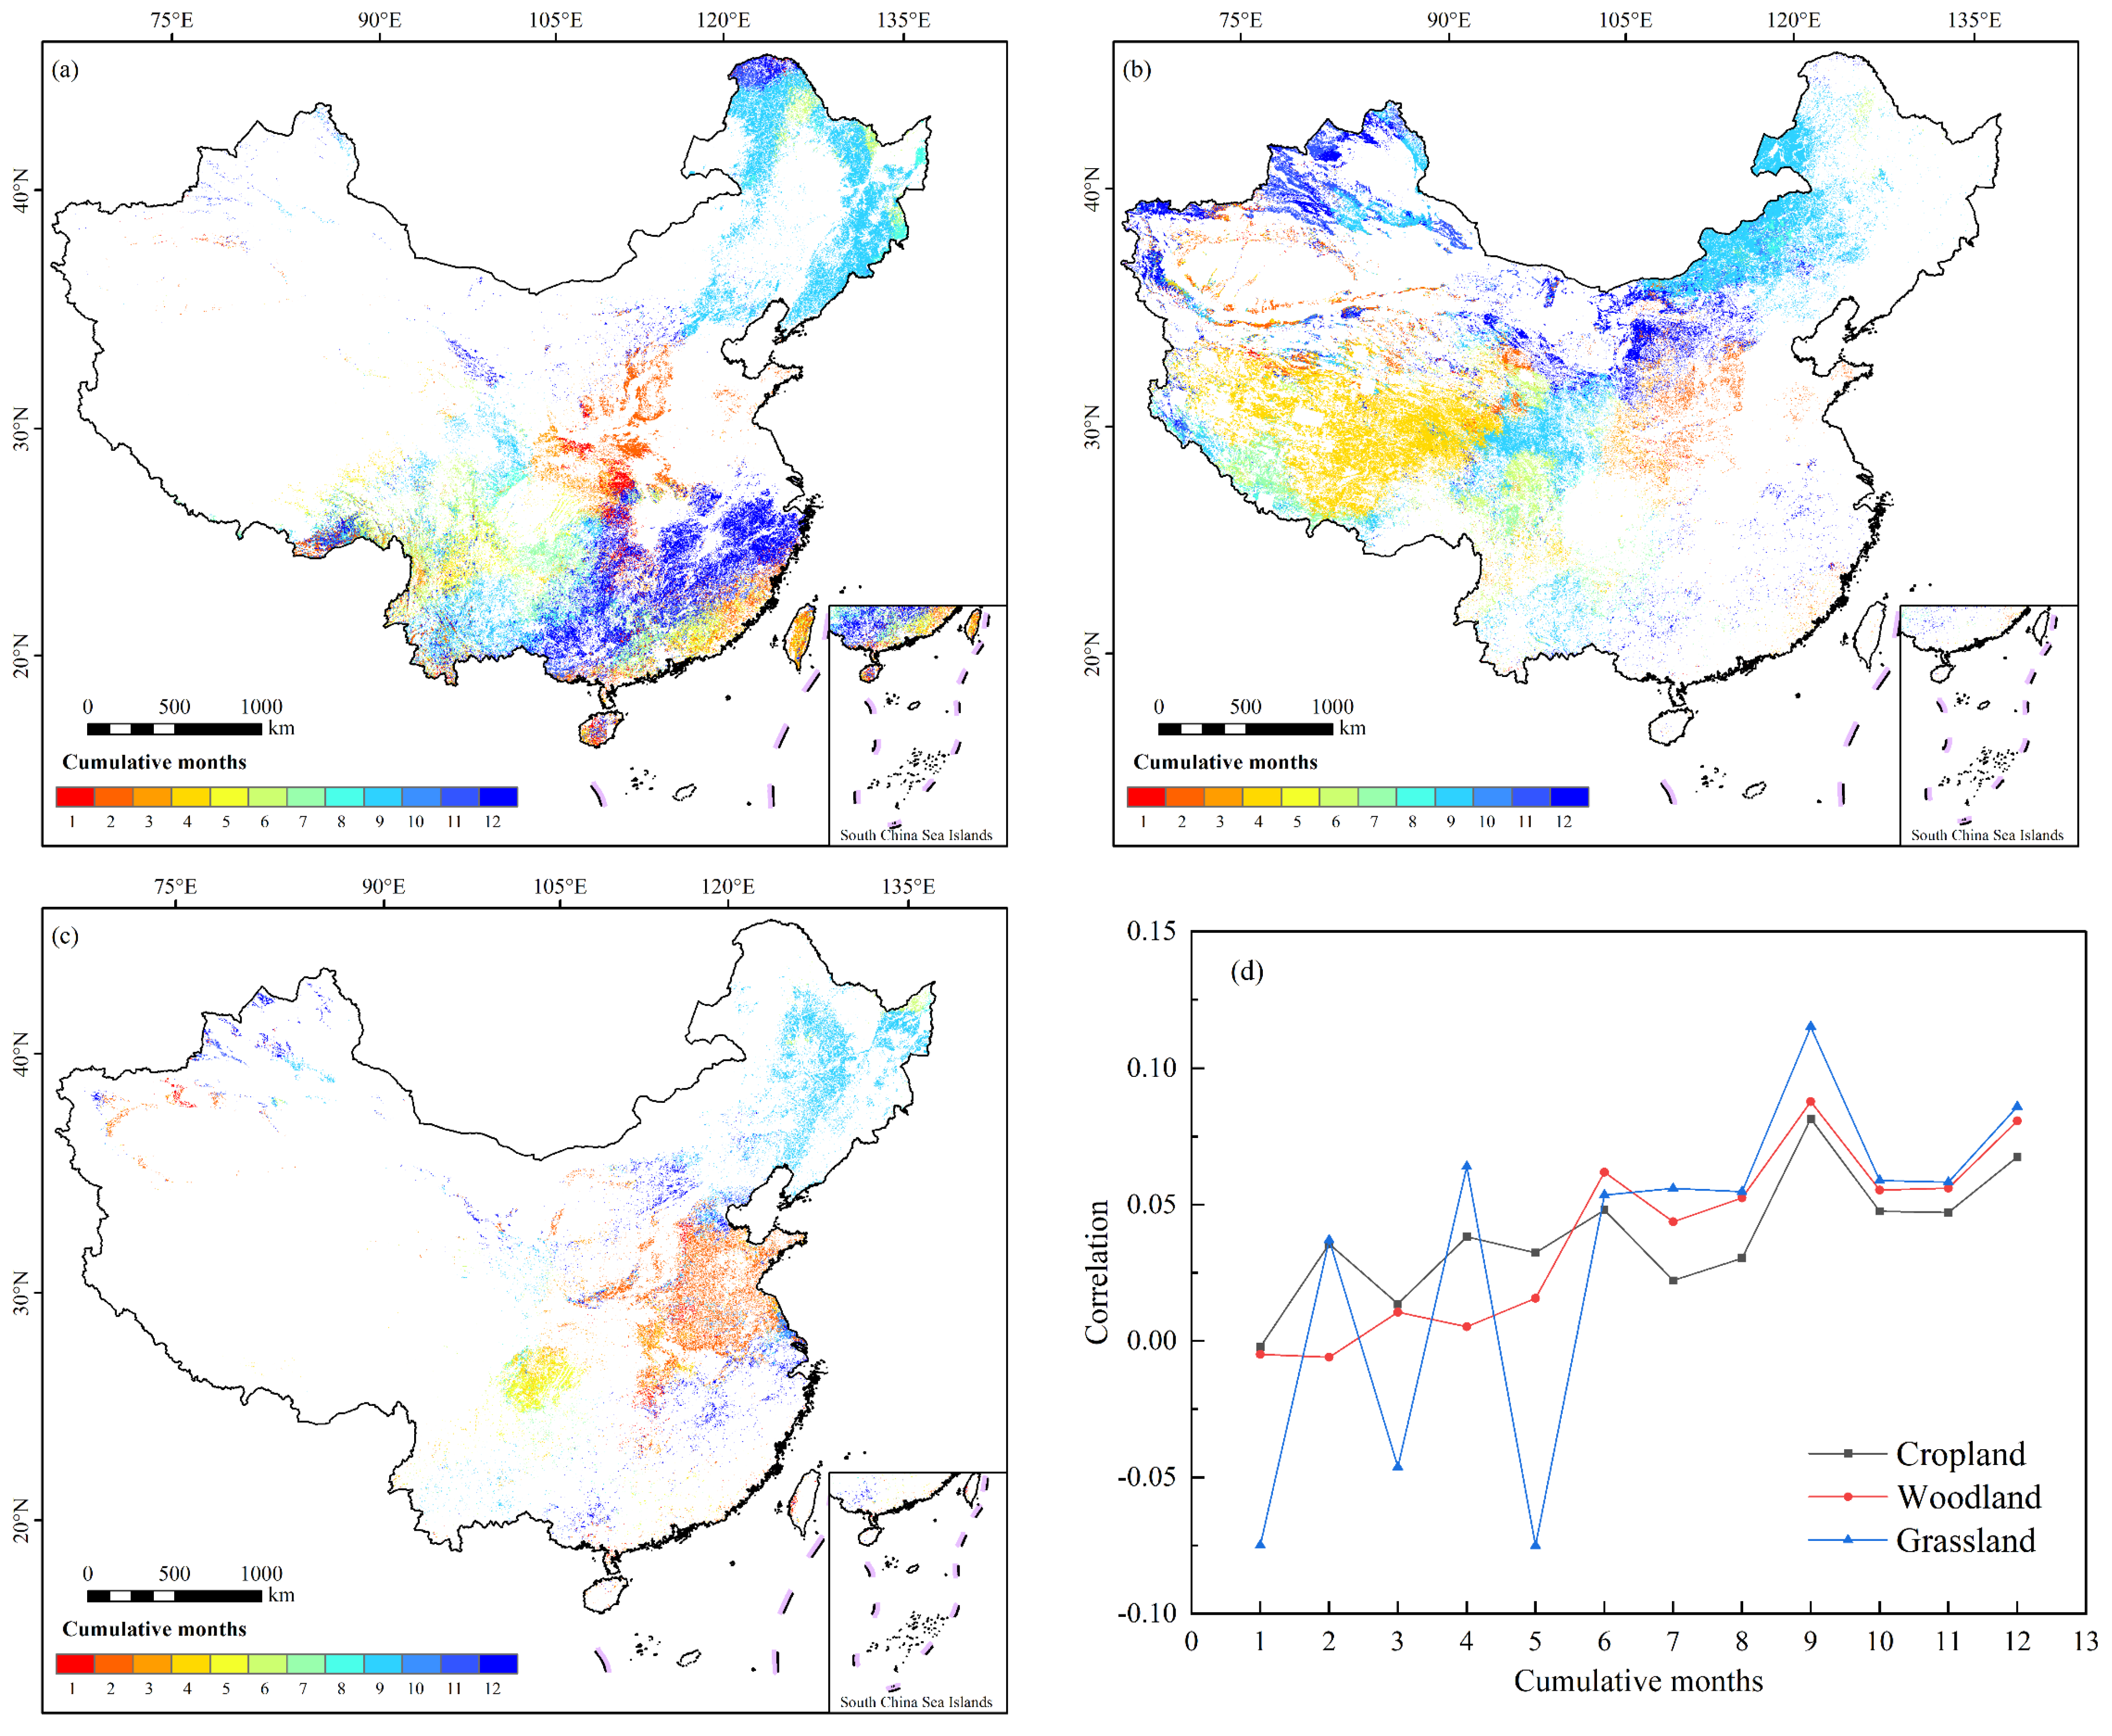
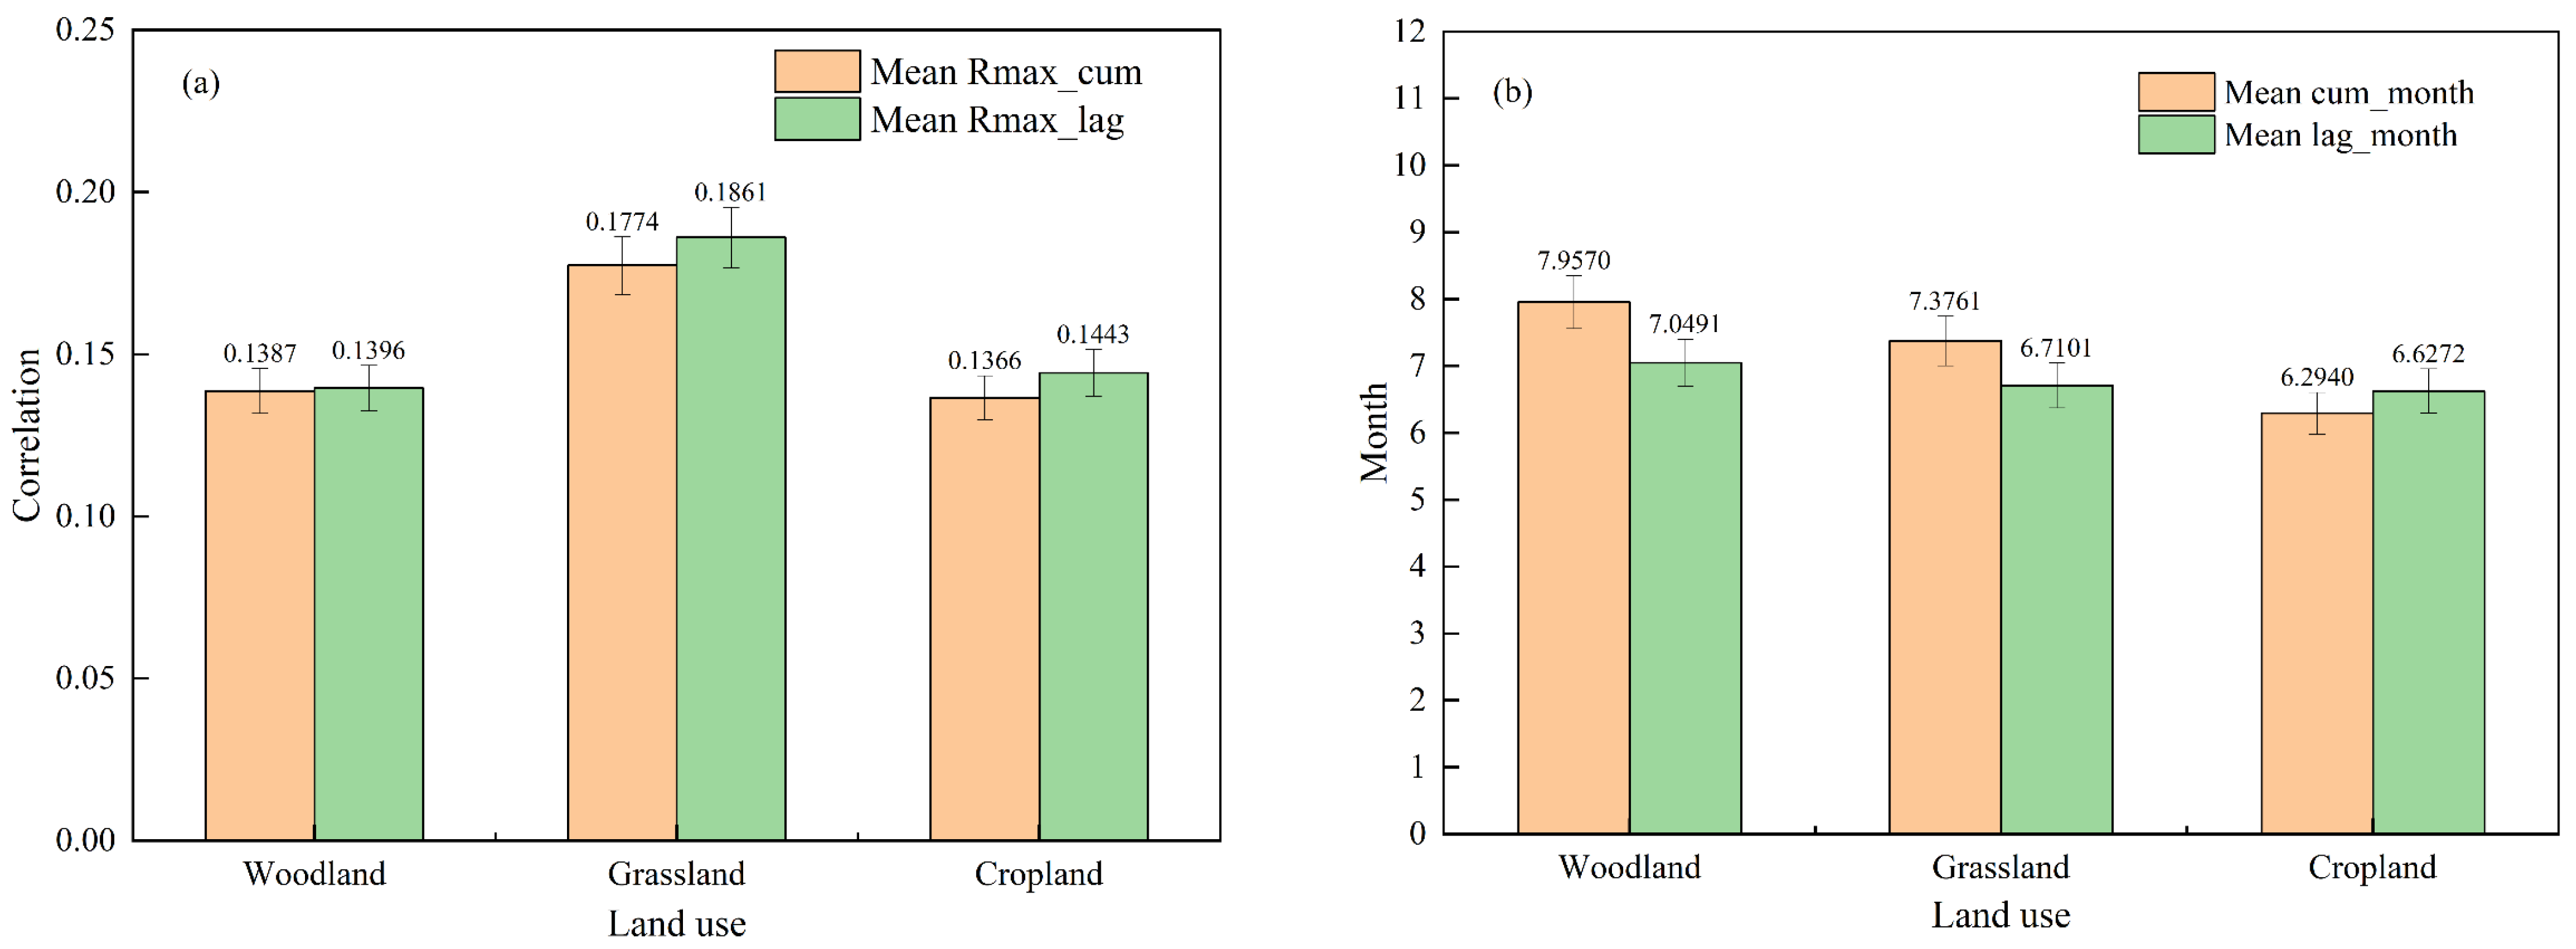
3.2.3. Cumulative Effects of Drought on Different Vegetation Types
3.3. Time-Lag Effect of Drought on Vegetation
3.3.1. Response of Vegetation to Drought at Different Time Scales
3.3.2. Spatial Distribution of Time-Lagged Effects of Drought on Vegetation
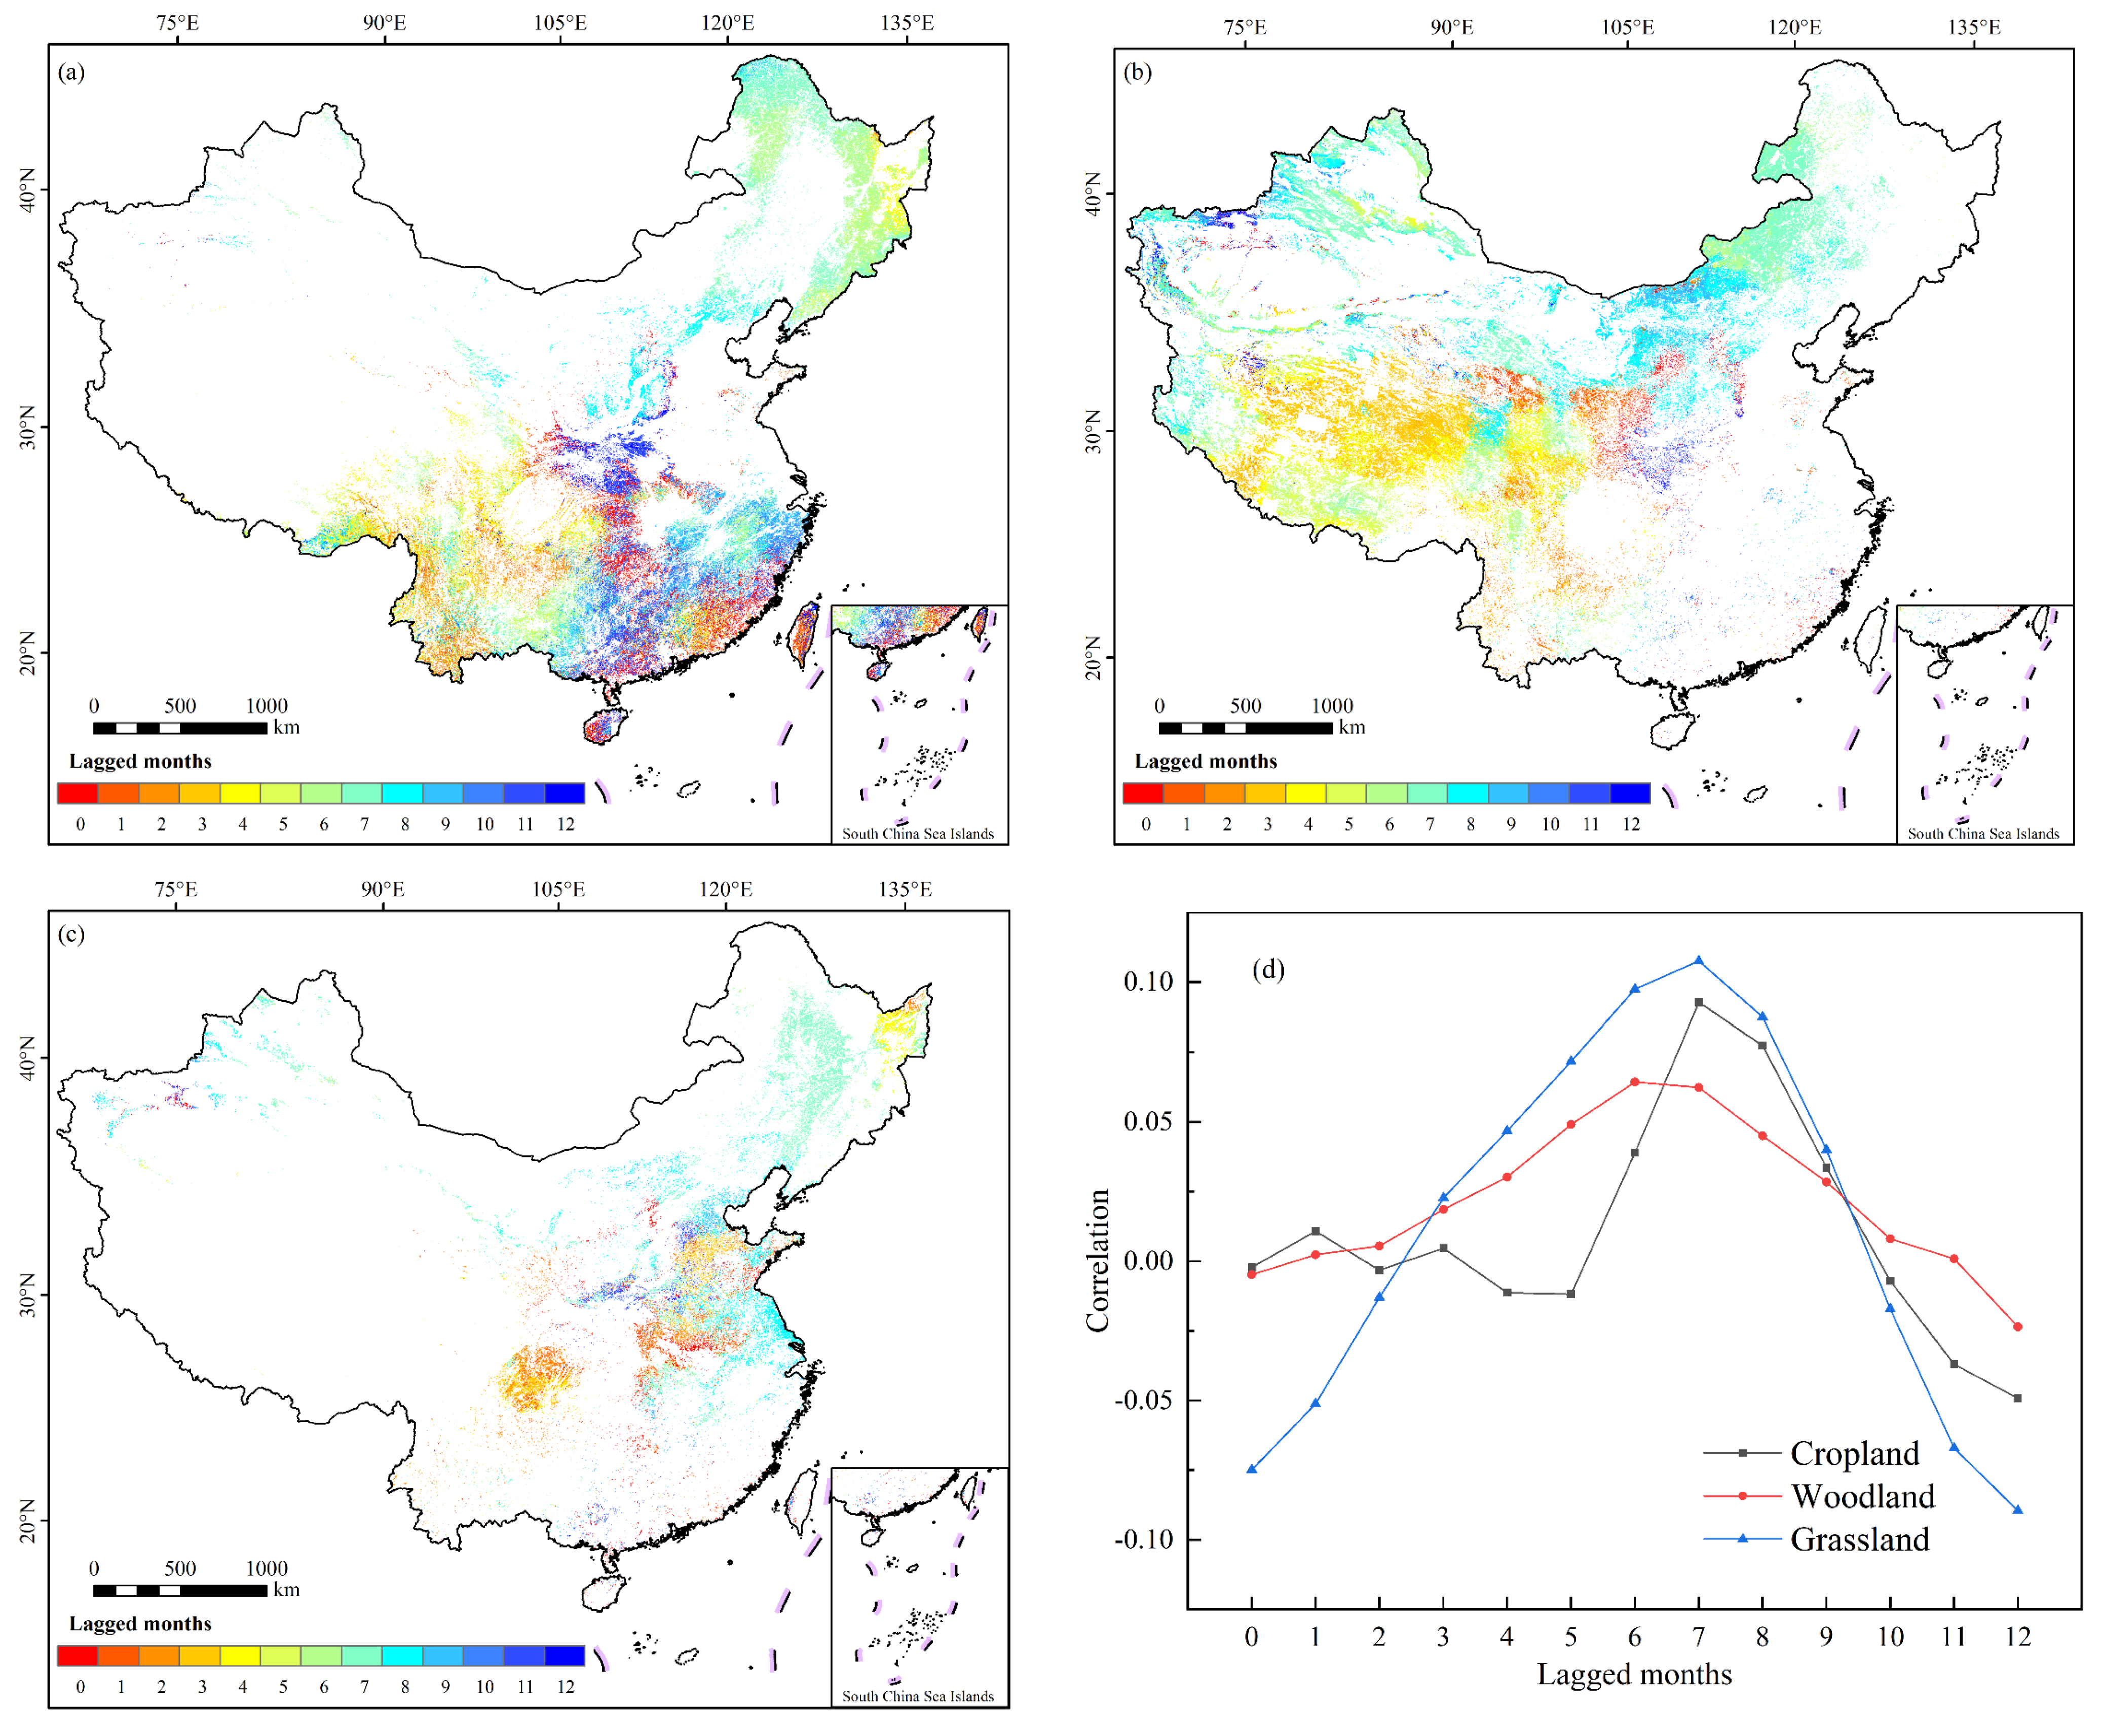
3.3.3. Time-Lag Effect of Drought on Different Vegetation Types
4. Discussion
4.1. The Effects of Drought on Different Vegetation Types
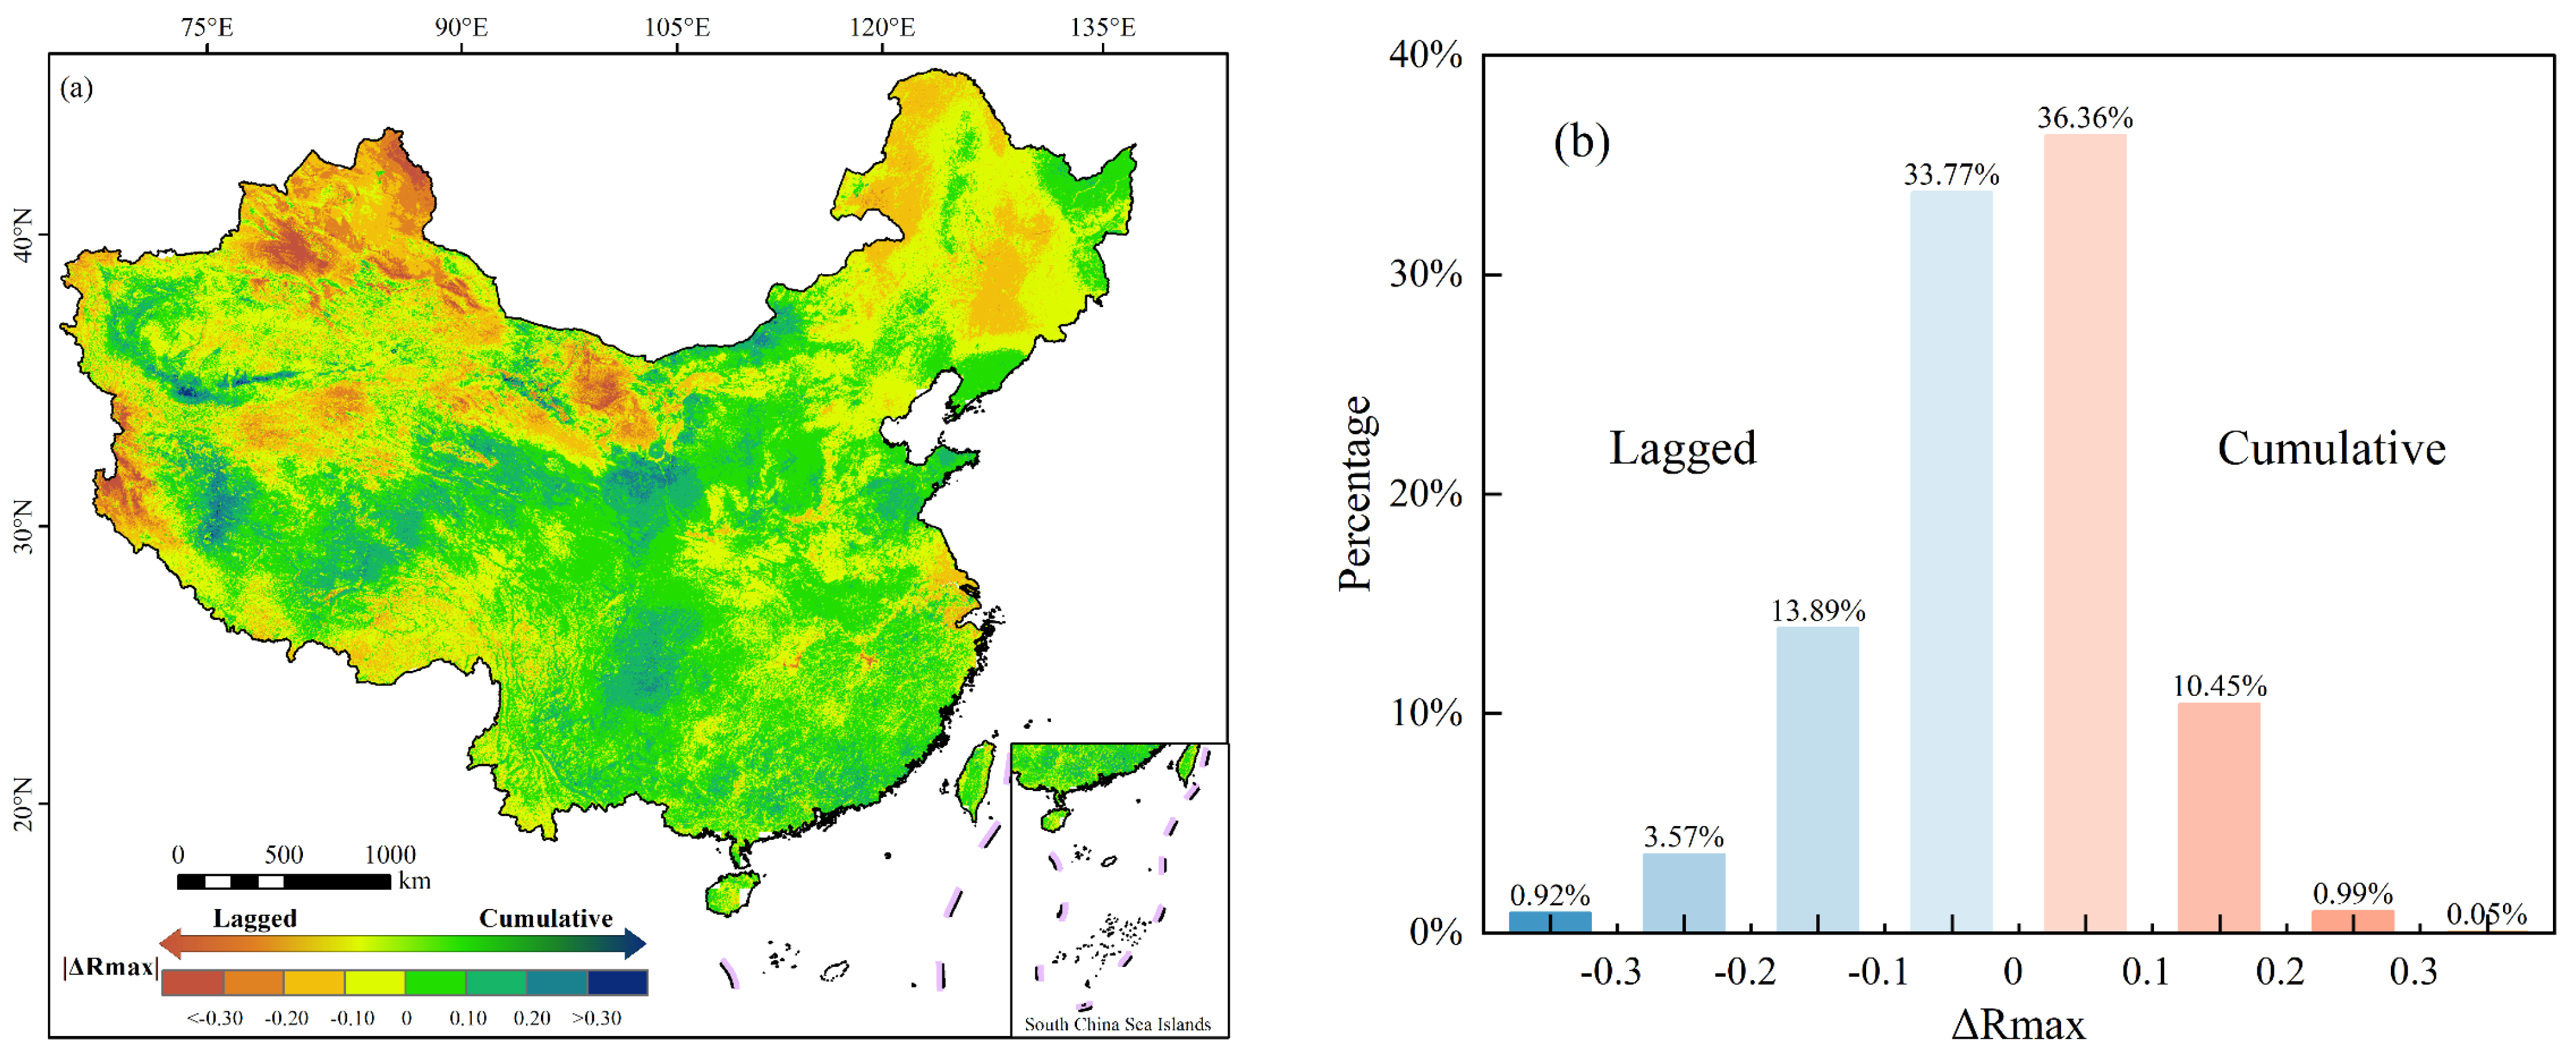
4.2. Reliability of the Framework
4.3. Uncertainty and Future Improvements
5. Conclusions
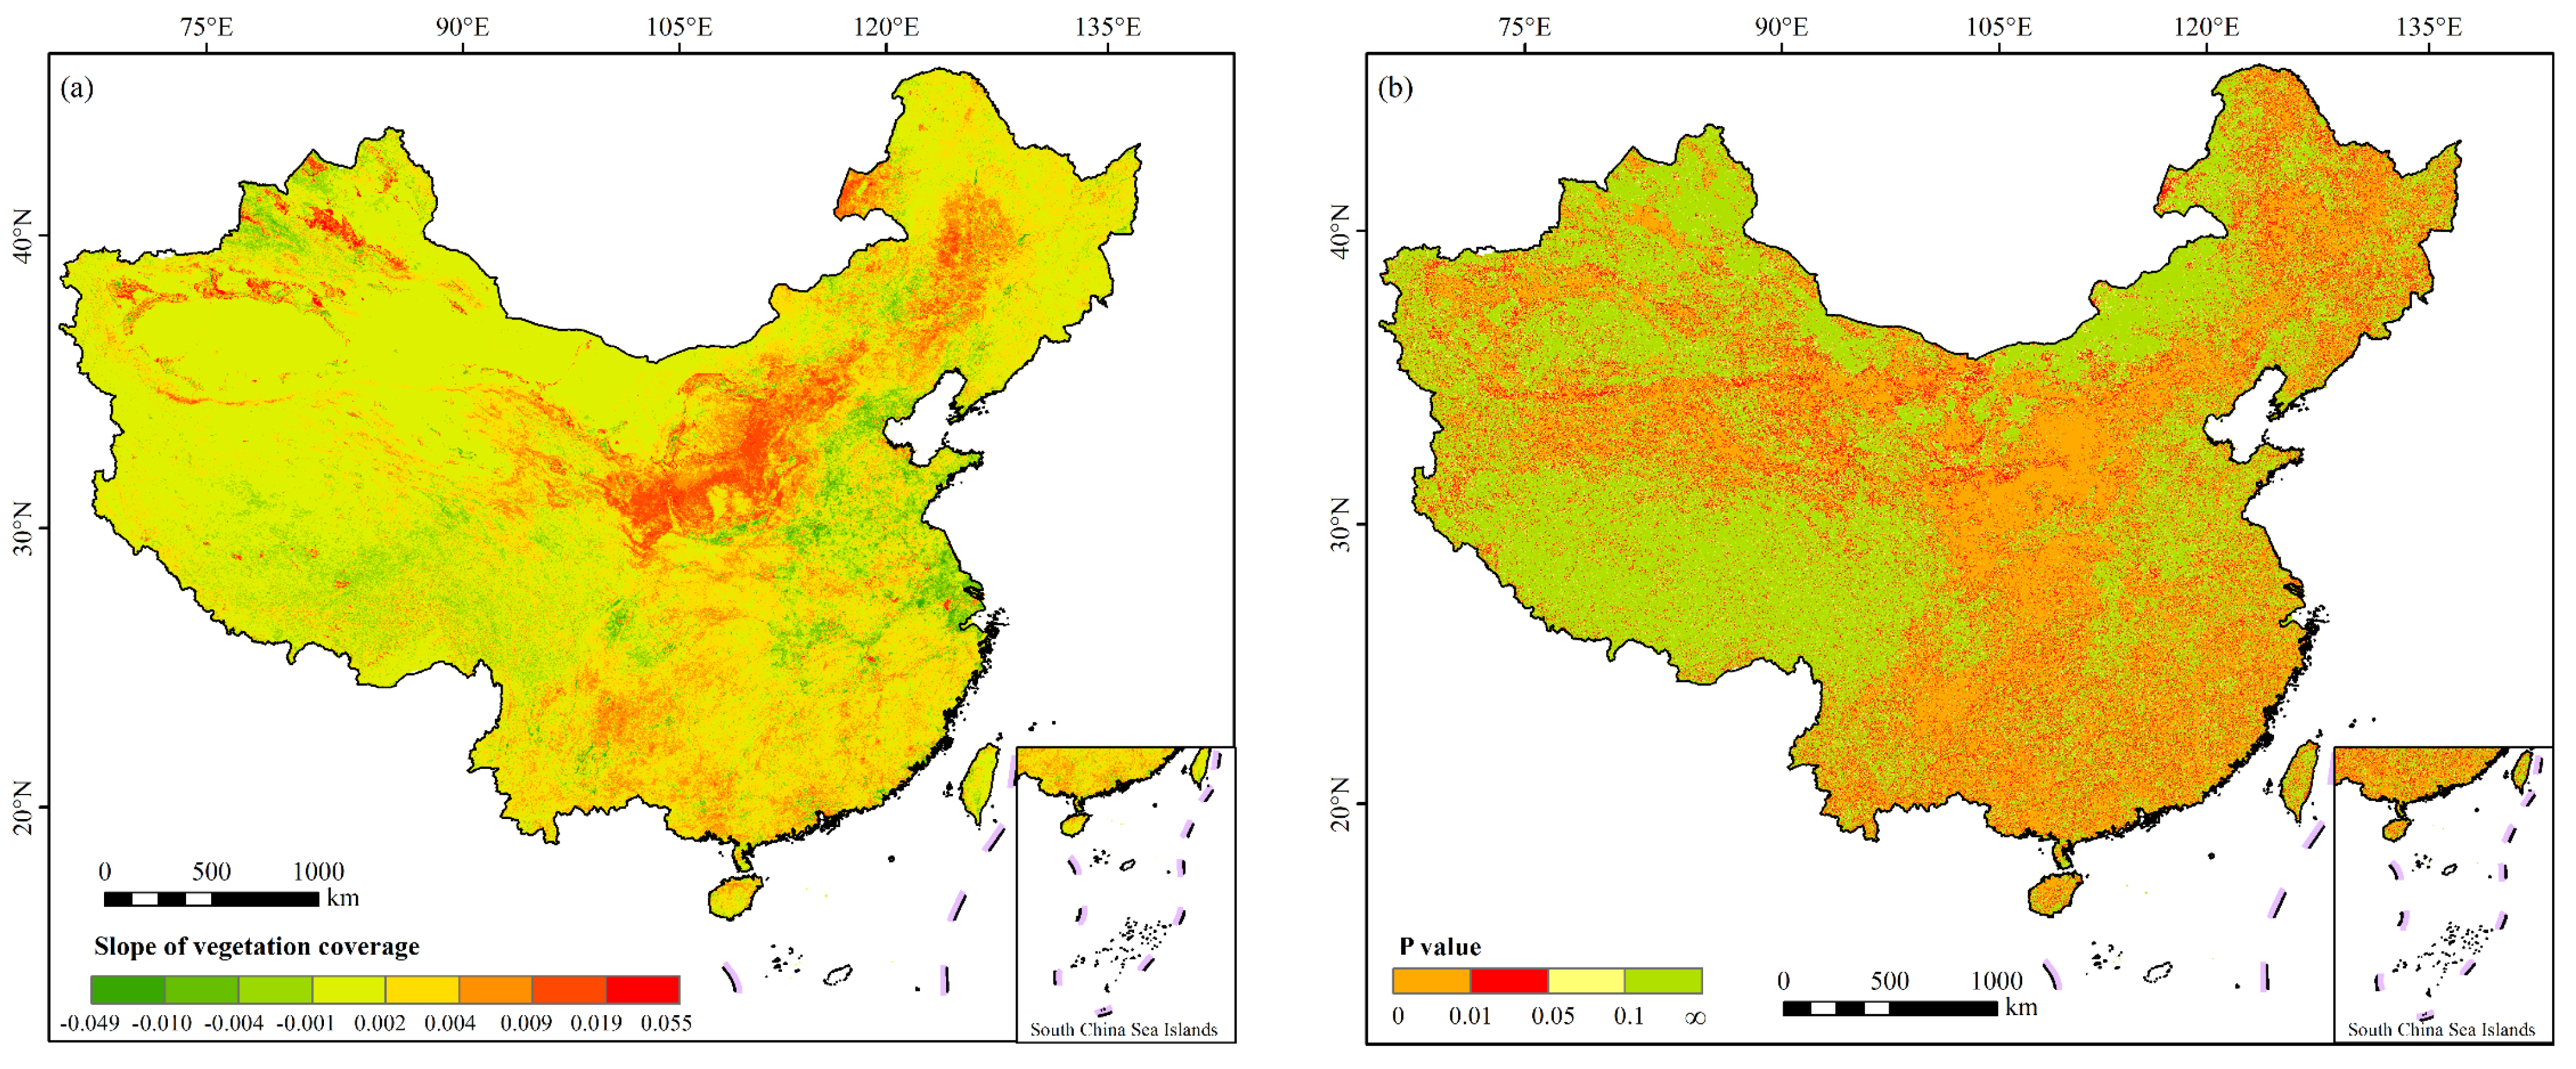
- The NDVI increased at a rate of 0.019/10 years, demonstrating the spatial variation trend of low values in the west and high values in the east, with an increase in the NDVI seen in 80.53% of areas.
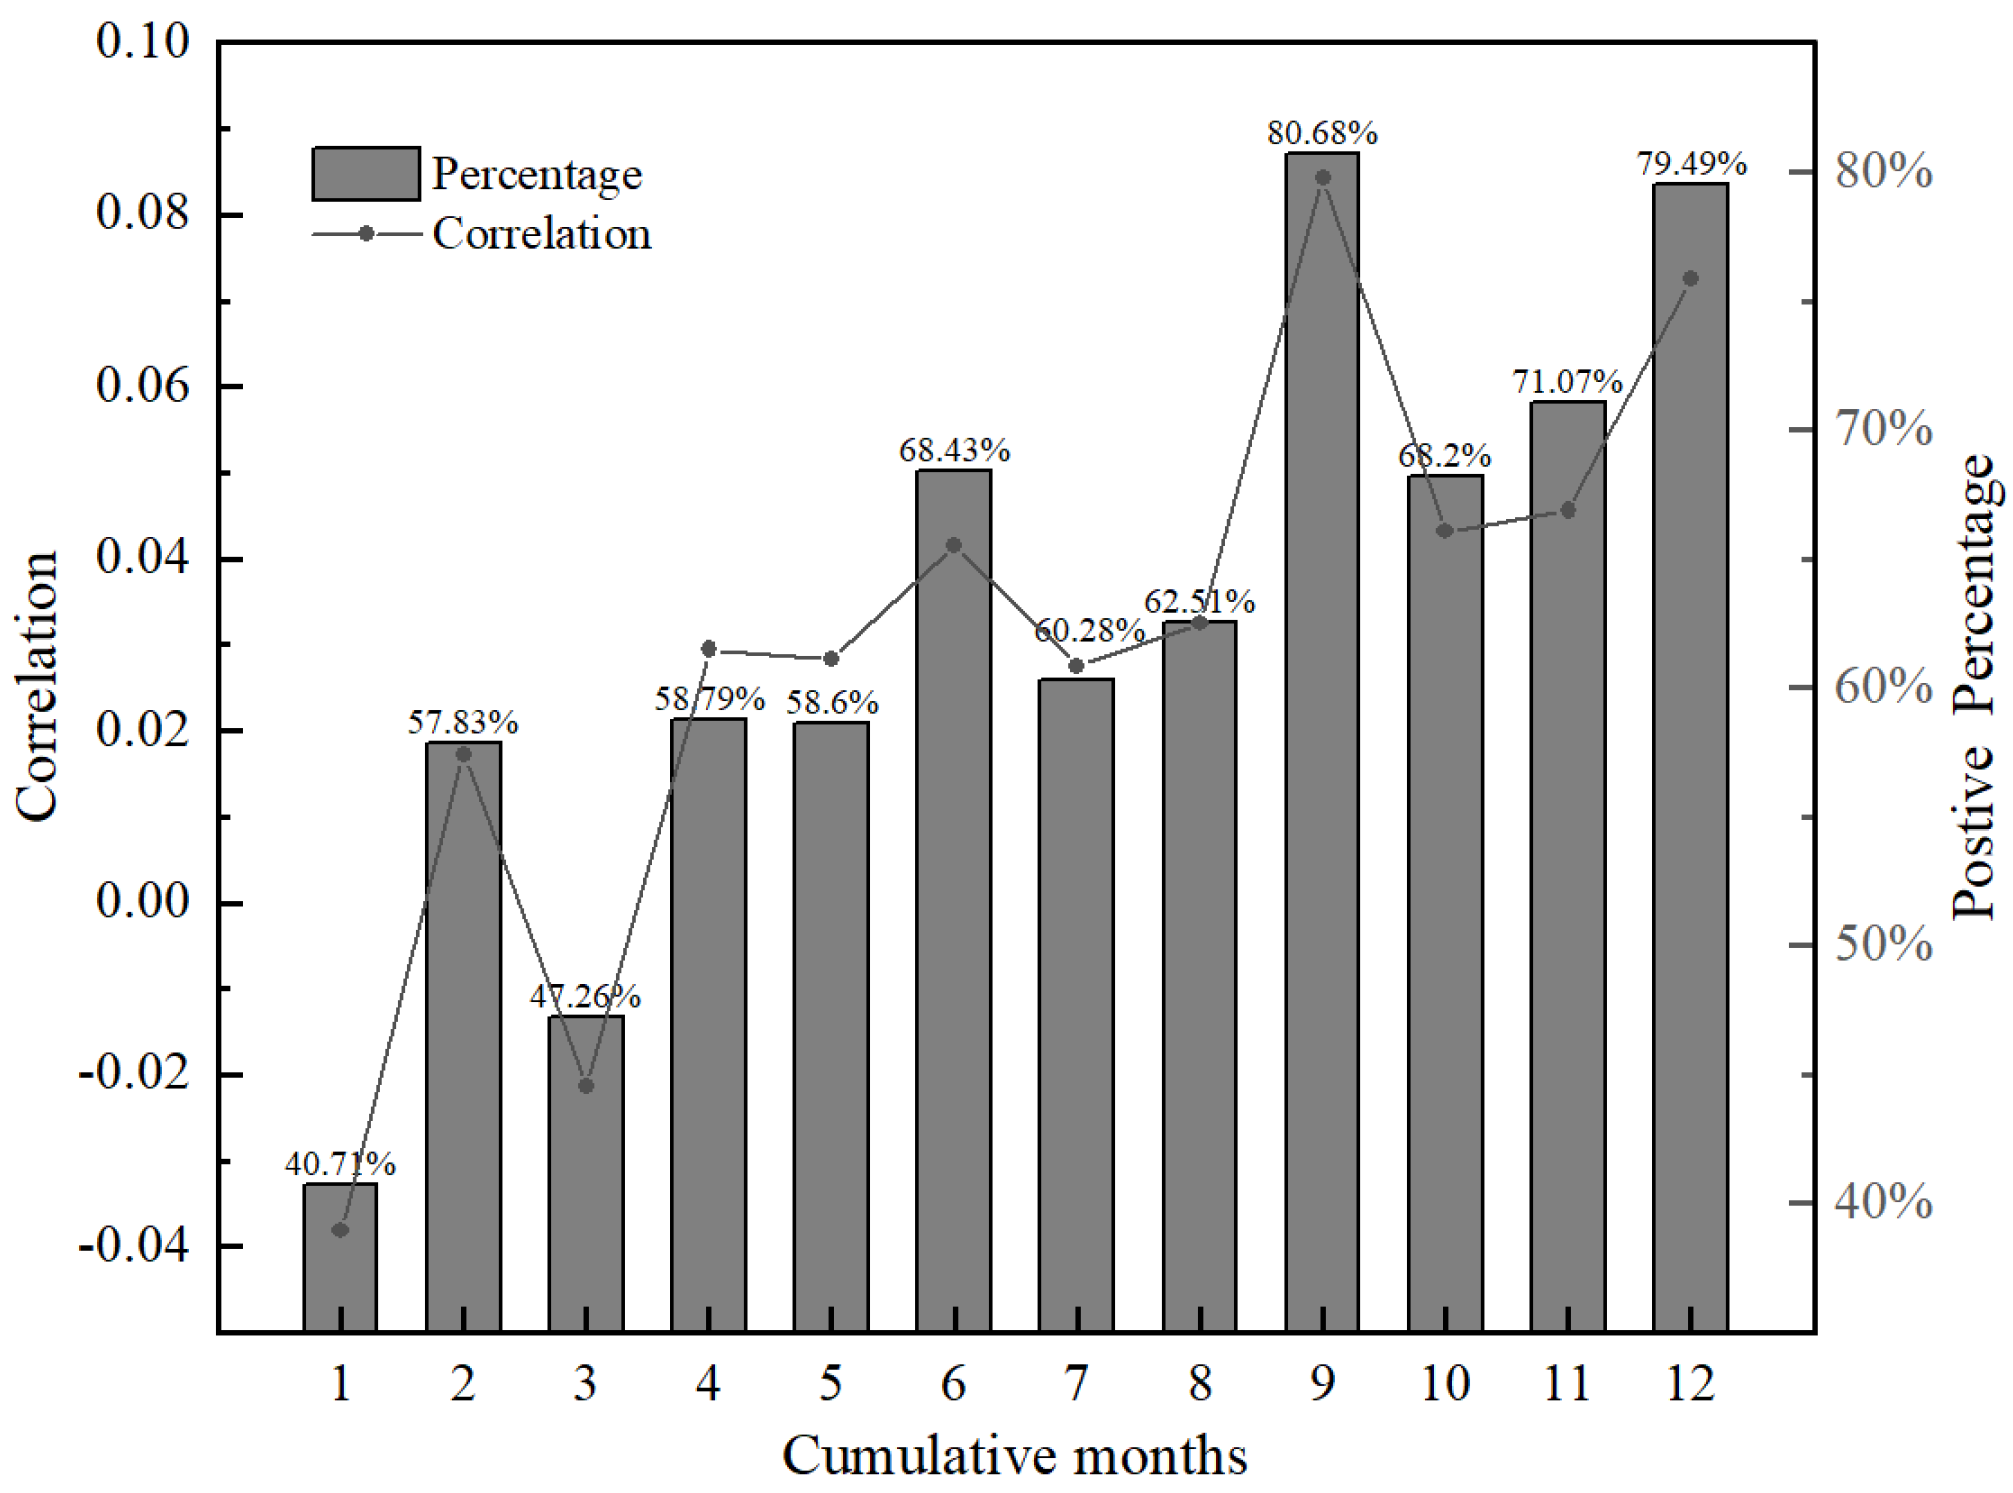
- The average SPEI cumulative time scale most relevant to the NDVI was 7.3 months, and the cumulative effect of drought on vegetation showed a strong correlation at 9–12 months. There were significant regional differences in the cumulative effect’s spatial distribution, with the cumulative scale being most widely distributed at 9 months and then 12 months, primarily in the northeast and northwest. The cumulative effects of drought on cropland, woodland, and grassland all showed the maximum correlation and the strongest cumulative effect at 9 months, and the correlation coefficients were ranked as grassland > woodland > cropland from 6 to 12 months of accumulation, and the average SPEI time scales most relevant to woodland, grassland, and cropland were 8.0, 6.3, and 7.4 months, respectively; that is, the best cumulative time followed the order woodland > cropland > grassland.
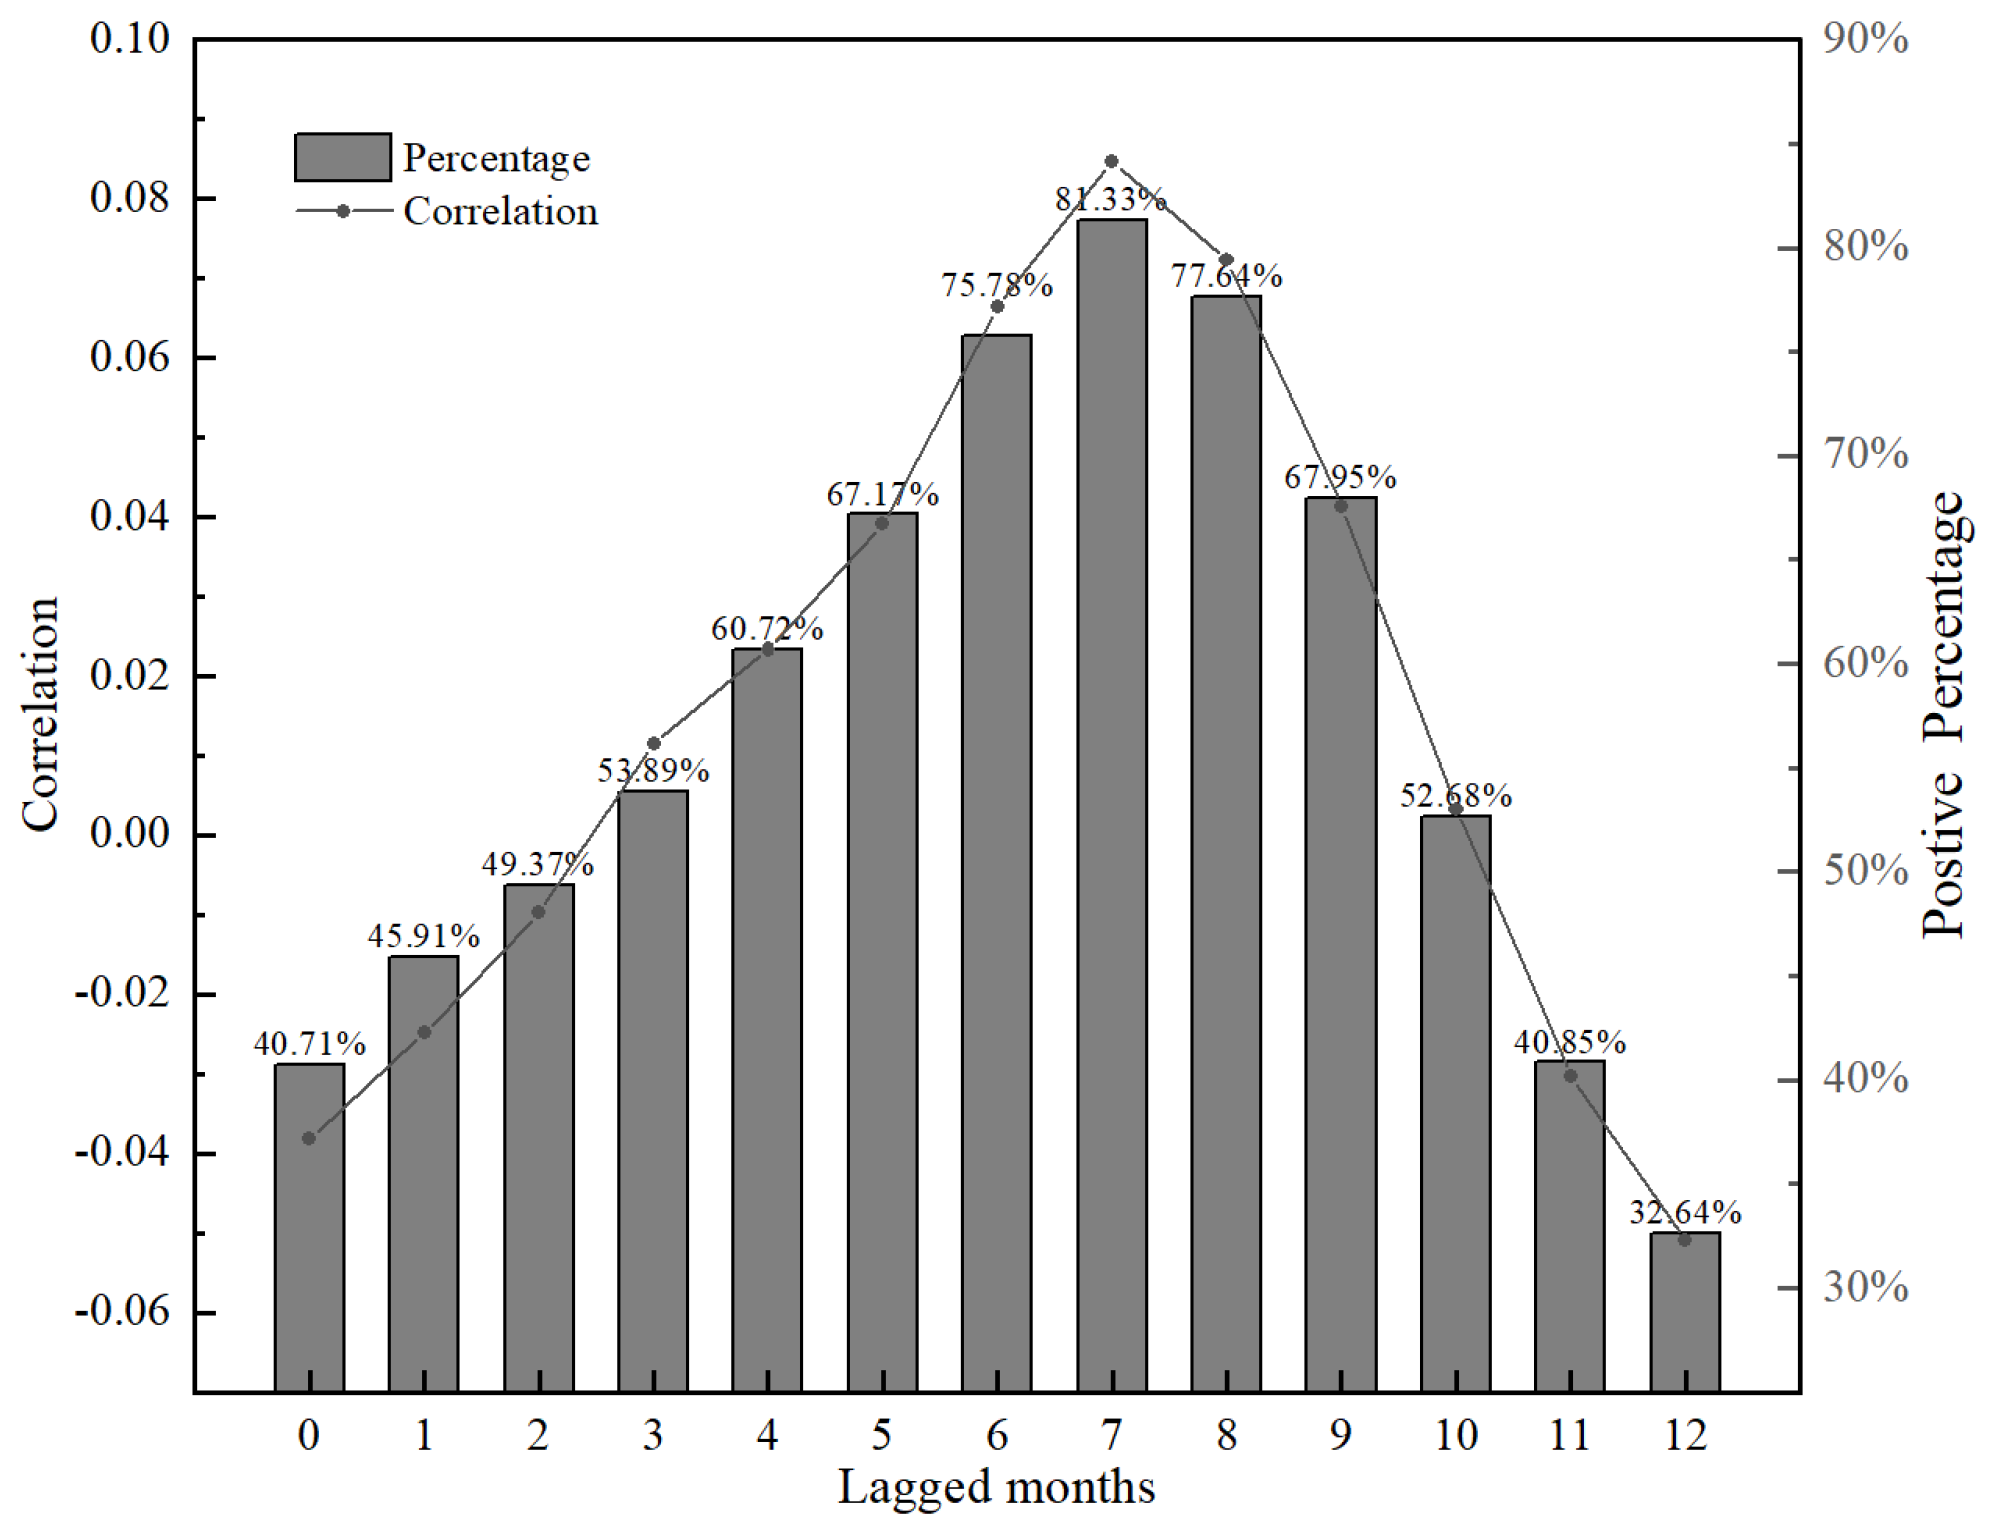
- The average SPEI time-lag scale related to the NDVI was 6.9 months, and the time-lag effect of drought on vegetation showed a maximum correlation at 7 months. The spatial distribution of the time-lag effect also had obvious territoriality, and the lag time interval was primarily 6–8 months, with cropland and grassland having the strongest time-lag effect at 7 months and woodland having the strongest time-lag effect at 6 months, and the time-lag effect of woodland on all scales was lower than that of grassland, and the average SPEI time scales related to woodland, grassland, and cropland were 7.0, 6.7, and 6.6 months, respectively.
Author Contributions
Funding
Data Availability Statement
Acknowledgments
Conflicts of Interest
References
- Wang, J. Research progress of remote sensing drought monitoring. Sci. Technol. Inf. 2014, 14, 109–112+123. (In Chinese) [Google Scholar]
- Zhou, J.; Feng, W.; Xiang, J.; Huang, M. Analysis of drought characteristics in Gansu Province in recent 58 years based on SPEI index. Met. Sci. 2022, 42, 99–107. (In Chinese) [Google Scholar]
- Jing, J.; Wang, Y.; He, C. Spatial and temporal variations of NDVI and its response to SPEI in Yunnan-Guizhou-Guangxi region. Res. Environ. Yb. 2022, 31, 1763–1775. (In Chinese) [Google Scholar]
- Stefanidis, S.; Rossiou, D.; Proutsos, N. Drought Severity and Trends in a Mediterranean Oak Forest. Hydrology 2023, 10, 167. [Google Scholar] [CrossRef]
- Hua, L.; Wang, H.; Sui, H.; Wardlow, B.; Hayes, M.J.; Wang, J. Mapping the Spatial-Temporal Dynamics of Vegetation Response Lag to Drought in a Semi-Arid Region. Remote Sens. 2019, 11, 1873. [Google Scholar] [CrossRef]
- Jiang, W.; Niu, Z.; Wang, L.; Yao, R.; Gui, X.; Xiang, F.; Ji, Y. Impacts of Drought and Climatic Factors on Vegetation Dynamics in the Yellow River Basin and Yangtze River Basin, China. Remote Sens. 2022, 14, 930. [Google Scholar] [CrossRef]
- Wang, H.; Li, Z.; Cao, L.; Feng, R.; Pan, Y. Response of NDVI of Natural Vegetation to Climate Changes and Drought in China. Land 2021, 10, 966. [Google Scholar] [CrossRef]
- Zhan, C.; Liang, C.; Zhao, L.; Jiang, S.; Niu, K.; Zhang, Y. Drought-related cumulative and time-lag effects on vegetation dynamics across the Yellow River Basin, China. Ecol. Indic. 2022, 143, 109409. [Google Scholar] [CrossRef]
- Hua, T.; Wang, X.; Zhang, C.; Lang, L.; Li, H. Responses of Vegetation Activity to Drought in Northern China. Land Degrad. Dev. 2017, 28, 1913–1921. [Google Scholar] [CrossRef]
- D’Orangeville, L.; Maxwell, J.; Kneeshaw, D.; Pederson, N.; Duchesne, L.; Logan, T.; Houle, D.; Arseneault, D.; Beier, C.M.; Bishop, D.A.; et al. Drought timing and local climate determine the sensitivity of eastern temperate forests to drought. Glob. Chang. Biol. 2018, 24, 2339–2351. [Google Scholar] [CrossRef]
- Ma, M.; Wang, Q.; Liu, R.; Zhao, Y.; Zhang, D. Effects of climate change and human activities on vegetation coverage change in northern China considering extreme climate and time-lag and -accumulation effects. Sci. Total. Environ. 2023, 860, 160527. [Google Scholar] [CrossRef]
- Wang, Y.; Chen, T.; Wang, Q.; Peng, L. Time-lagged and cumulative effects of drought and anthropogenic activities on China’s vegetation greening from 1990 to 2018. Int. J. Digit. Earth 2023, 16, 2233–2258. [Google Scholar] [CrossRef]
- Jin, K.; Jin, Y.; Wang, F.; Zong, Q. Should time-lag and time-accumulation effects of climate be considered in attribution of vegetation dynamics? Case study of China’s temperate grassland region. Int. J. Biometeorol. 2023, 67, 1213–1223. [Google Scholar] [CrossRef]
- Zhao, A.; Yu, Q.; Feng, L.; Zhang, A.; Pei, T. Evaluating the cumulative and time-lag effects of drought on grassland vegetation: A case study in the Chinese Loess Plateau. J. Environ. Manag. 2020, 261, 110214. [Google Scholar] [CrossRef]
- Wu, D.; Zhao, X.; Liang, S.; Zhou, T.; Huang, K.; Tang, B.; Zhao, W. Time-lag effects of global vegetation responses to climate change. Glob. Change Biol. 2015, 21, 3520–3531. [Google Scholar] [CrossRef]
- Zuo, D.; Han, Y.; Xu, Z.; Li, P.; Ban, C.; Sun, W.; Pang, B.; Peng, D.; Kan, G.; Zhang, R.; et al. Time-lag effects of climatic change and drought on vegetation dynamics in an alpine river basin of the Tibet Plateau, China. J. Hydrol. 2021, 600, 126532. [Google Scholar] [CrossRef]
- Hu, T.; Renzullo, L.J.; van Dijk, A.I.J.M.; He, J.; Tian, S.; Xu, Z.; Zhou, J.; Liu, T.; Liu, Q. Monitoring agricultural drought in Australia using MTSAT-2 land surface temperature retrievals. Remote Sens. Environ. 2019, 236, 111419. [Google Scholar] [CrossRef]
- Ji, L.; Peters, A.J. Assessing vegetation response to drought in the northern Great Plains using vegetation and drought indices. Remote Sens. Environ. 2003, 87, 85–98. [Google Scholar] [CrossRef]
- Jiang, P.; Wang, Y.; Yang, Y.; Gu, X.; Huang, Y.; Liu, L.; Liu, L. Spatiotemporal Features and Time-Lagged Effects of Drought on Terrestrial Ecosystem in Southwest China. Forests 2023, 14, 781. [Google Scholar] [CrossRef]
- Yuan, X.; Peng, Z.; Liu, X. Different Time-scale Responses of Vegetation to the SPEI Drought Index in Xinjiang. J. Desert Oasis Met. 2021, 15, 129–136. (In Chinese) [Google Scholar]
- Vicente-Serrano, S.M.; Beguería, S.; López-Moreno, J.I. A Multiscalar Drought Index Sensitive to Global Warming: The Standardized Precipitation Evapotranspiration Index. J. Clim. 2010, 23, 1696–1718. [Google Scholar] [CrossRef]
- Bouslihim, Y.; Kharrou, M.H.; Miftah, A.; Attou, T.; Bouchaou, L.; Chehbouni, A. Comparing Pan-sharpened Landsat-9 and Sentinel-2 for Land-Use Classification Using Machine Learning Classifiers. J. Geovisualization Spat. Anal. 2022, 6, 35. [Google Scholar] [CrossRef]
- Sen, P.K. Estimates of the regression coefficient based on Kendall’s Tau. J. Am. Stat. Assoc. 1968, 63, 1379–1389. [Google Scholar] [CrossRef]
- Mann, H.B. Nonparametric Tests against Trend. Econometrica 1945, 13, 245–259. [Google Scholar] [CrossRef]
- Tian, F.; Fensholt, R.; Verbesselt, J.; Grogan, K.; Horion, S.; Wang, Y.J. Evaluating temporal consistency of long-term global NDVI datasets for trend analysis. Remote Sens. Environ. 2015, 163, 326–340. [Google Scholar] [CrossRef]
- Burgan, H.I. The Short-Term and Seasonal Trend Detection of Sediment Discharges in Turkish Rivers. Rocz. Ochr. Śr. 2022, 24, 214–230. [Google Scholar] [CrossRef]
- Meng, X.; Gao, X.; Li, S.; Lei, J. Spatial and Temporal Characteristics of Vegetation NDVI Changes and the Driving Forces in Mongolia during 1982–2015. Remote Sens. 2020, 12, 603. [Google Scholar] [CrossRef]
- Hamed, K.H. Exact distribution of the Mann–Kendall trend test statistic for persistent data. J. Hydrol. 2009, 365, 86–94. [Google Scholar] [CrossRef]
- Ghasemloo, N.; Matkan, A.A.; Alimohammadi, A.; Aghighi, H.; Mirbagheri, B. Estimating the Agricultural Farm Soil Moisture Using Spectral Indices of Landsat 8, and Sentinel-1, and Artificial Neural Networks. J. Geovisualization Spat. Anal. 2022, 6, 19. [Google Scholar] [CrossRef]
- Jiang, L.; Liu, Y.; Wu, S.; Yang, C. Analyzing ecological environment change and associated driving factors in China based on NDVI time series data. Ecol. Indic. 2021, 129, 107933. [Google Scholar] [CrossRef]
- Piao, S.; Mohammat, A.; Fang, J.; Cai, Q.; Feng, J. NDVI-based increase in growth of temperate grasslands and its responses to climate changes in China. Glob. Environ. Chang. 2006, 16, 340–348. [Google Scholar] [CrossRef]
- Wei, Y.; Sun, S.; Liang, D.; Jia, Z. Spatial–temporal variations of NDVI and its response to climate in China from 2001 to 2020. Int. J. Digit. Earth 2022, 15, 1463–1484. [Google Scholar] [CrossRef]
- Sandholt, I.; Rasmussen, K.; Andersen, J. A simple interpretation of the surface temperature/vegetation index space for assessment of surface moisture status. Remote Sens. Environ. 2002, 79, 213–224. [Google Scholar] [CrossRef]
- Chen, S.; Zhang, L.; Tang, R.; Yang, K.; Huang, Y. Analysis on Temporal and Spatial Variation of Drought in Henan Province Based on SPEI and TVDI. Trans. Chin. Soc. Agric. Eng. 2017, 33, 126–132. [Google Scholar]
- Palmer, W.C. Keeping Track of Crop Moisture Conditions, Nationwide: The New Crop Moisture Index. Weatherwise 1968, 21, 156–161. [Google Scholar] [CrossRef]
- Tian, Q.; Lu, J.; Chen, X. A novel comprehensive agricultural drought index reflecting time lag of soil moisture to meteorology: A case study in the Yangtze River basin, China. Catena 2021, 209, 105804. [Google Scholar] [CrossRef]
- Matsushita, B.; Yang, W.; Chen, J.; Onda, Y.; Qiu, G. Sensitivity of the Enhanced Vegetation Index (EVI) and Normalized Difference Vegetation Index (NDVI) to Topographic Effects: A Case Study in High-density Cypress Forest. Sensors 2007, 7, 2636–2651. [Google Scholar] [CrossRef]
- Kumari, N.; Saco, P.M.; Rodriguez, J.F.; Johnstone, S.A.; Srivastava, A.; Chun, K.P.; Yetemen, O. The Grass Is Not Always Greener on the Other Side: Seasonal Reversal of Vegetation Greenness in Aspect-Driven Semiarid Ecosystems. Geophys. Res. Lett. 2020, 47, e2020GL088918. [Google Scholar] [CrossRef]
- Liu, Y.; Liu, X.; Hu, Y.; Li, S.; Peng, J.; Wang, Y. Analyzing nonlinear variations in terrestrial vegetation in China during 1982–2012. Environ. Monit. Assess. 2015, 187, 722. [Google Scholar] [CrossRef] [PubMed]
- Ding, Y.; Li, Z.; Peng, S. Global analysis of time-lag and -accumulation effects of climate on vegetation growth. Int. J. Appl. Earth Obs. Geoinf. 2020, 92, 102179. [Google Scholar] [CrossRef]
- Kong, D.; Miao, C.; Wu, J.; Zheng, H.; Wu, S. Time lag of vegetation growth on the Loess Plateau in response to climate factors: Estimation, distribution, and influence. Sci. Total. Environ. 2020, 744, 140726. [Google Scholar] [CrossRef] [PubMed]
- Wen, Y.; Liu, X.; Xin, Q.; Wu, J.; Xu, X.; Pei, F.; Li, X.; Du, G.; Cai, Y.; Lin, K.; et al. Cumulative Effects of Climatic Factors on Terrestrial Vegetation Growth. J. Geophys. Res. Biogeosciences 2019, 124, 789–806. [Google Scholar] [CrossRef]


Disclaimer/Publisher’s Note: The statements, opinions and data contained in all publications are solely those of the individual author(s) and contributor(s) and not of MDPI and/or the editor(s). MDPI and/or the editor(s) disclaim responsibility for any injury to people or property resulting from any ideas, methods, instructions or products referred to in the content. |
© 2023 by the authors. Licensee MDPI, Basel, Switzerland. This article is an open access article distributed under the terms and conditions of the Creative Commons Attribution (CC BY) license (https://creativecommons.org/licenses/by/4.0/).
Share and Cite
Wei, W.; Liu, T.; Zhou, L.; Wang, J.; Yan, P.; Xie, B.; Zhou, J. Drought-Related Spatiotemporal Cumulative and Time-Lag Effects on Terrestrial Vegetation across China. Remote Sens. 2023, 15, 4362. https://doi.org/10.3390/rs15184362
Wei W, Liu T, Zhou L, Wang J, Yan P, Xie B, Zhou J. Drought-Related Spatiotemporal Cumulative and Time-Lag Effects on Terrestrial Vegetation across China. Remote Sensing. 2023; 15(18):4362. https://doi.org/10.3390/rs15184362
Chicago/Turabian StyleWei, Wei, Ting Liu, Liang Zhou, Jiping Wang, Peng Yan, Binbin Xie, and Junju Zhou. 2023. "Drought-Related Spatiotemporal Cumulative and Time-Lag Effects on Terrestrial Vegetation across China" Remote Sensing 15, no. 18: 4362. https://doi.org/10.3390/rs15184362
APA StyleWei, W., Liu, T., Zhou, L., Wang, J., Yan, P., Xie, B., & Zhou, J. (2023). Drought-Related Spatiotemporal Cumulative and Time-Lag Effects on Terrestrial Vegetation across China. Remote Sensing, 15(18), 4362. https://doi.org/10.3390/rs15184362