Technical Note

New Functionalities and Regional/National Use Cases of the Anomaly Hotspots of Agricultural Production (ASAP) Platform

by
Felix Rembold
1,*,
Michele Meroni
1,
Viola Otieno
2,
Oliver Kipkogei
2,
Kenneth Mwangi
2,
João Maria de Sousa Afonso
3,
Isidro Metódio Tuleni Johannes Ihadua
3,
Amílcar Ernesto A. José
3,
Louis Evence Zoungrana
4,
Amjed Hadj Taieb
4,
Ferdinando Urbano
1,
Maria Dimou
1,
Hervé Kerdiles
1,
Petar Vojnovic
1,
Matteo Zampieri
1,5 and
Andrea Toreti
1
1
Joint Research Centre (JRC), European Commission, Via E. Fermi 2749, I-21027 Ispra, VA, Italy
2
Intergovernmental Authority on Development (IGAD) Climate Prediction and Applications Centre (ICPAC), Nairobi P.O. Box 10304-00100, Kenya
3
Instituto Nacional de Meteorologia e Geofísica de Angola (INAMET), Rua 21 de Janeiro, Rotunda do Gamek à Direita, S/N-RC, Luanda 1323, Angola
4
GIS and Remote Sensing Unit, Observatoire du Sahara et du Sahel (OSS), P.O. Box 31, Boulevard du Leader Yasser Arafat, Tunis 1080, Tunisia
5
Department of Physical Science and Engineering, King Abdullah University of Science and Technology (KAUST), Thuwal 23955, Saudi Arabia
*
Author to whom correspondence should be addressed.
Remote Sens. 2023, 15(17), 4284; https://doi.org/10.3390/rs15174284
Submission received: 26 June 2023 / Revised: 21 July 2023 / Accepted: 5 August 2023 / Published: 31 August 2023
(This article belongs to the Special Issue Remote Sensing for Land Degradation and Drought Monitoring II)

Abstract

:
The Anomaly hotSpots of Agricultural Production (ASAP) Decision Support System was launched operationally in 2017 for providing timely early warning information on agricultural production based on Earth Observation and agro-climatic data in an open and easy to use online platform. Over the last three years, the system has seen several methodological improvements related to the input indicators and to system functionalities. These include: an improved dataset of rainfall estimates for Africa; a new satellite indicator of biomass optimised for near-real-time monitoring; an indicator of crop and rangeland water stress derived from a water balance accounting scheme; the inclusion of seasonal precipitation forecasts; national and sub-national crop calendars adapted to ASAP phenology; and a new interface for the visualisation and analysis of high spatial resolution Sentinel and Landsat data. In parallel to these technical improvements, stakeholders and users uptake was consolidated through the set up of regionally adapted versions of the ASAP system for Eastern Africa in partnership with the Intergovernmental Authority on Development (IGAD) Climate Prediction and Applications Centre (ICPAC), for North Africa with the Observatoire du Sahara et du Sahel (OSS), and through the collaboration with the Angolan National Institute of Meteorology and Geophysics (INAMET), that used the ASAP system to inform about agricultural drought. Finally, ASAP indicators have been used as inputs for quantitative crop yield forecasting with machine learning at the province level for Algeria’s 2021 and 2022 winter crop seasons that were affected by drought.

1. Introduction

The importance of Earth Observation (EO) technologies in large-scale monitoring of crop and rangeland conditions is growing with more frequent climatic extreme events (e.g., droughts, heat waves) [1]. At the same time, EO-enhanced monitoring capabilities are made possible by the rapidly evolving availability of satellite imagery and access to cloud computing services (e.g., [2,3]). The derived information provides a relevant contribution to food security assessments and, therefore, early warning information for early action [4]. A system that provides early warning information on potential food production anomalies resulting from climate shocks (due to climate variability and extremes) is particularly relevant with the ever-increasing frequency and intensity of climate extremes caused by climate change. In addition, the COVID-19 pandemic showed how critical the capability to receive information on crop condition in remote and restricted-access areas is, in particular for understanding the impact of extraordinary events like the pandemic or natural hazards on agricultural livelihoods.
In response to these information needs, a number of monitoring systems are maintained at both regional and global scales—for recent reviews see [5,6]. Most of such systems make use of gridded agrometeorological data (e.g., precipitation, air temperature) and EO data. In fact, crop development and growth can be monitored from satellite-based EO data as it allows for the gathering of information about the biophysical state of vegetation over large areas with high revisit frequency [7]. Medium to coarse spatial resolution (250–1000 m) satellite missions operating in the reflected domain (e.g., Moderate-resolution Imaging Spectroradiometer, MODIS; Satellite Pour l’Observation de la Terre, SPOT-VEGETATION and its successor missions Prova-V and Sentinel-3) have been frequently used for crop monitoring [8]. For this purpose, vegetation indexes (e.g., the Normalised Difference Vegetation Index, NDVI) or biophysical variables (e.g., the Fraction of Photosynthetically Active Radiation, FPAR) are typically used in operational monitoring systems, e.g., [9,10,11]. The Anomaly hotSpots of Agricultural Production (ASAP) is an open web-based Decision Support System for agricultural monitoring and for early warning about agricultural production anomalies of crops and rangelands (https://agricultural-production-hotspots.ec.europa.eu (accessed on 4 August 2023)). An overview of the system functionalities and examples of operational use of the first release of the platform are provided in [12]. The system consists of three interactive online platforms (Figure 1) based on weather and EO data and directed at a wide range of users: the Hotspot Assessment, the Warning Explorer, and the High Resolution Viewer platforms.
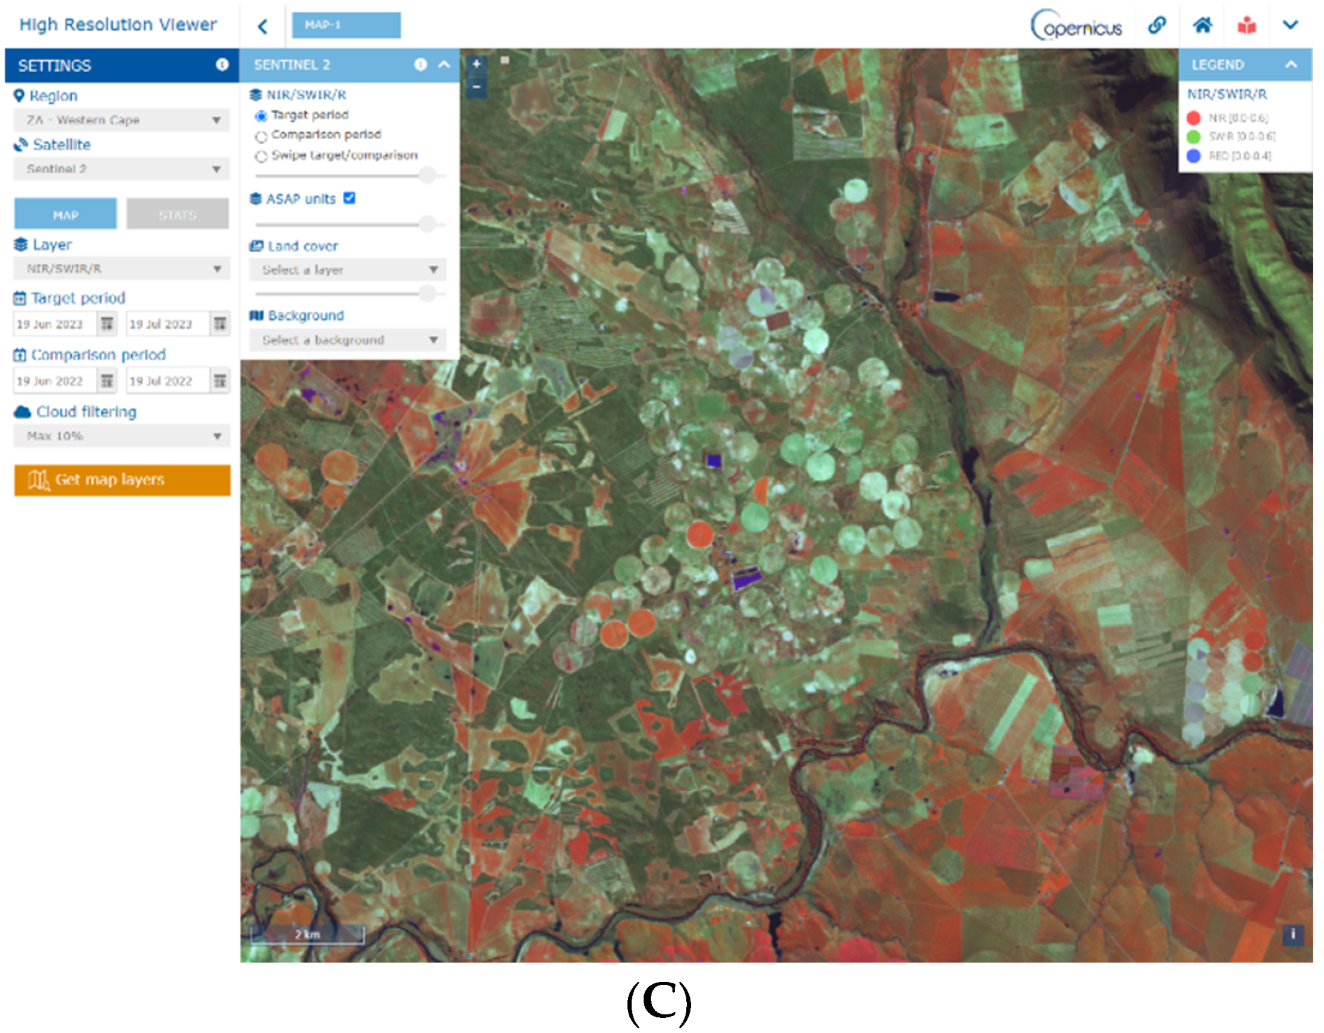
The Hotspot Assessment on the ASAP homepage (Figure 1A) provides a monthly assessment for 81 food insecure countries and the identification of countries with agricultural production hotspots. The webpage shows summary narratives that synthesise, in non-technical terms, the analysis of the weather- and EO-derived anomalies during the previous 30 days at the national level. The Warning Explorer (Figure 1B) is a web-GIS for visualising automatic warnings, agriculture-relevant global indicators in raster format and a dashboard showing statistics aggregated at the first sub-national administrative level. The Warning Explorer is automatically updated every 10 days. Agriculture monitoring experts, with knowledge of geo-spatial science, can use the Warning Explorer to inspect meteorological- and EO-based maps and interactive graphs for further analysis, in particular of the automatic warnings assigned by ASAP at the first sub-national level (i.e., ASAP units mostly correspond to FAO GAUL1 level). Analysts can also use the High Resolution Viewer (Figure 1C), a user-friendly interface based on Google Earth Engine (GEE) serving high spatial resolution data (Copernicus Sentinel-1 and Sentinel-2, and Landsat-8 and 9) with global coverage that can be easily visualised and processed to provide real-time information at the local (i.e., field) level. This environment also gives the possibility to extract time series statistics from the high-resolution imagery, such as NDVI profiles for a specific location or NDVI distribution histograms for user-defined polygons.
In the more than 5 years of its operational use since 2017, the ASAP system has been instrumental in detecting and monitoring a large number of agricultural hotspots in areas threatened by food crises. This information has successfully been made available to global crop monitoring initiatives such as the Group on Earth Observations Global Agricultural Monitoring initiative (GEOGLAM) [13] or to food security assessments, for example, during acute food insecurity analysis.
All information produced by the ASAP system is made publicly available online, including reference data sets such as the crop and rangeland masks, the phenology information, and the historical record of detected drought condition warnings. The latter has been used for the analysis of agricultural drought as a driver of food insecurity in the Food and Agriculture Organization (FAO) SOFI (State of Food Insecurity Report) reports in 2018 and 2019 [14,15]. Finally, aggregated ASAP indicators for administrative units are made available as proxy indicators for yield and have been used as inputs for quantitative yield forecasting in various countries.
In this manuscript, we present the latest developments of the ASAP system together with examples of regional to country level use of the information provided. Recent improvements regarded both the indicators used by the system, i.e., an improved dataset of rainfall estimates; a new satellite indicator of biomass optimised for near-real-time monitoring and methodological developments: a water balance accounting scheme delivering an indicator of crop and rangeland water stress; the inclusion of seasonal precipitation forecasts; information on the expected timing of planting, growth and harvesting for the main crops at national and sub-national levels through the adaptation of national crop calendars to the ASAP phenology; and new analysis tools and interface for the visualisation of high spatial resolution satellite data. As examples of uptake of ASAP information, we describe the country-level use of the system for the delivery of periodic agrometeorological bulletins in Angola, the development of regionally adapted versions of the ASAP system tailored for agricultural monitoring in East Africa and in North Africa, and finally the use of ASAP data for regional yield forecasting at country level.

2. Data, Method and Functionality Improvements

2.1. Rainfall Estimates

In the first version of ASAP, the considered rainfall indicators (i.e., rainfall and rainfall anomalies such as the Standardised Precipitation Index with 1 and 3 month time scales, SPI1 and SPI3, respectively) were based on two distinct ECMWF (European Centre for Medium-Range Weather Forecasts) numerical weather prediction models: the High Resolution model (HRES) for global data in near real-time and the ERA Interim reanalysis model for the historical archive. In the new version of the system, ASAP relies on rainfall data provided by the Climate Hazards Group InfraRed Precipitation with Station data (CHIRPS) estimates [16] with finer spatial resolution compared to ECMWF products and good accuracy over Africa [17,18,19]. However, CHIRPS data covers only latitudes between 50°N and 50°S. Beyond these latitudes and for the meteorological parameters other than rainfall (i.e., temperature, solar radiation, evapotranspiration), the new ASAP version uses ERA5 ECMWF data, an improved reanalysis dataset that replaced ERA Interim in 2019, in association with HRES for near real-time data.

2.2. NDVI Data

As source of the Normalised Difference Vegetation Index (NDVI), ASAP currently employs the Moderate Resolution Imaging Spectroradiometer (MODIS) data processed according to [20] for optimal noise removal in near -real-time applications. The algorithm uses MOD13A2 and MYD13A2 products (currently version 6.1), i.e., 16 day NDVI composites at 1 km resolution from the Terra and Aqua MODIS satellites with production shifted by 8 days. For the global cover, a total of 294 MODIS tiles are downloaded from the online Data Pool at the NASA LP DAAC, then they are mosaicked and reprojected to geographic coordinates (datum WGS84, EPSG 4326) with a spatial resolution of approximately 1 km (1°/112). The entire time series (from October 2001) is first smoothed off-line using the Whittaker smoother [21]. In brief, the Whittaker smoother balances two conflicting requirements [22]: (i) fidelity to the data, and (ii) smoothness of the resulting curve. The smoother attempts to closely fit a curve to the raw data, but is penalised if subsequent smoothed points vary too much (i.e., the fitting curve is not smooth). The smoothing parameter λ controls the balance between the two requirements and it is tuned through a trial-and-error process involving the visual inspection of a large number of sample points (observations and fitted curves) from different continents and environments. The smoothing takes into account the quality of the observations according to the MODIS VI Quality Assessment Science Data Set (QA SDS) [23], the actual acquisition day for each pixel, and it is applied with three iterations to best fit the upper envelope of the NDVI observations similarly to [24].
From smoothed daily outputs, 10 day composites (i.e., dekadal composites) are produced by selecting NDVI at the last day of the respective dekad (i.e., day 1–10, 11–20, and 21–last day of the month). When working on-line, i.e., in near real-time (NRT) mode, data production is referred to as filtering in contrast to the above-described smoothing, following the definitions of [25]. NRT data are produced at the end of each dekad based on the data that are available at that time. The filtering is applied to a temporal window extending back in time for 190 days. Filtered data are constrained by limiting the NDVI change between consecutive dekads according to historical statistics of the off-line smoothed data. When a new NRT data point is produced, the estimates of the previous four dekads are also updated. As a result, NDVI dekadal images are produced at five consolidation stages (C0 to C4) with stage C4 coming with a 4 dekad delay and being the most reliable NRT filtered product. Additionally, a final and fully off-line smoothed product is produced (CF) with a three month delay. More details on the processing and the resulting quality can be found in [26].

2.3. Water Satisfaction Index and Soil Moisture

Instead of the initially used SPI1 indicator of meteorological drought described in [12], ASAP has been upgraded to use a water balance indicator of agricultural drought. The water balance takes into account both precipitation amount and the crops (or rangelands) water requirements during the season. The Water Satisfaction Index (WSI) is a soil water balance model conceptually similar to that of [27]. WSI is an indicator of crop (or rangeland) performances based on the availability of water to the crop (rangeland) during the growing season. It uses a rainfall- and evapotranspiration-driven water balance accounting scheme to estimate water available to the plant. Compared to SPI1, which is an indicator of meteorological drought, WSI focuses on agricultural drought.
The global WSI uses ASAP phenology and masks [28] to determine when and where crops (rangelands) are expected to grow. In addition, it employs external static layers (i.e., soil map, global crop type distribution) and dynamic layers (i.e., weather variables) with a daily time step. Although the water balance is computed at the daily time step for more realistic modelling, WSI output is aligned to the dekadal time step of the ASAP system. In terms of spatial resolution, the base grid resolution is set to ASAP grid (1 km) although some data is available at a coarser spatial resolution (e.g., evapotranspiration data and crop coefficients). Rainfall data is sourced from Climate Hazards Infra Red precipitation with station (CHIRPS) from the Climate Hazards Group [16] in the latitude band between 50°N and 50°S and the European Centre for Medium-Range Weather Forecasts (ECMWF) forecasting system at higher latitudes (see Section 2.1). Evapotranspiration is taken from ECMWF for the whole global extent.
Crop evapotranspiration needed to compute the WSI is calculated with the FAO approach termed ‘Kc ET0′, whereby the effect of the climate on crop water requirements is given by the reference evapotranspiration ET0 and the effect of the crop phenology by the crop type coefficient Kc. That is, experimentally determined ratios of ETc/ET0 (ETc being the crop type specific evapotranspiration), the so-called crop coefficients (Kc), are used to relate ETc to ET0. Here, we used the single crop coefficient approach and the Kc crop coefficients from the work of [29]. Different from the standard approach where Kc is linked to the growing period length using the percentage progress of the season, in the ASAP WSI, a link between Kc values and the EO-based phenology has been defined [30].
While ASAP warnings are now computed with SPI3 and the standardised anomaly of the WSI (along with NDVI as a proxy of crop biomass), the SPI1 used in the previous version of ASAP is still available as a raster indicator that can be visualised in the Warning Explorer as a potential indicator of an upcoming meteorological drought.
In addition to such indicators, a new indicator related to water availability was recently added in the Warning Explorer: the volumetric surface soil moisture combined product for the Copernicus Climate Change Service (C3S, https://cds.climate.copernicus.eu/portfolio/dataset/satellite-soil-moisture (accessed on 4 August 2023)) at 0.25° spatial resolution. The combined product is a blended product using both scatterometer and radiometer soil moisture data. The product is typically made available with a 10 day latency on C3S; therefore, the derived raster indicators are made available with one dekad (i.e., 10 day period) delay. Data of soil moisture in a surface soil layer of 2 to 5 cm depth are made available on the Warning Explorer as original data in physical units (m3/m3) and as Z-score anomaly computed using the statistics from the ASAP reference period 2001–end of previous year (Figure 2).

2.4. Seasonal Precipitation Forecasts

Precipitation abundance is a major driver of crop and rangeland productivity at the global level and particularly in Africa, where droughts have significant effects on food security [14]. Recent examples include the severe drought that hit the Horn of Africa 2020–2023 as well as prolonged dry conditions in Madagascar and Angola. Therefore, anticipating the onset of a drought would be of utmost importance for an early warning system. For this reason, the information from the ASAP monitoring system has been complemented by precipitation seasonal forecasts in the attempt to provide useful information about the precipitation that can be expected in the coming months.
Precipitation data are retrieved from Copernicus Climate Change Service (C3S, https://climate.copernicus.eu/seasonal-forecasts (accessed on 4 August 2023)). We use monthly precipitation forecasts coming from six seasonal forecast systems available in the Copernicus C3S (i.e., CMCC, ECMWF, Met Office, Meteo-France, DWD, NCEP). Each system produces a set of ensemble members in forecast and hindcast mode. For the multi-system, a total of 378 and 176 ensemble members are available in forecast and hindcast mode, respectively. C3S seasonal forecasts are updated every month (on the 13th day at 12 UTC) and cover a time period of six months with a spatial resolution of 100 km. Precipitation forecasts from the entire set of ensemble members are downloaded locally and elaborated into tercile maps over different time horizons.
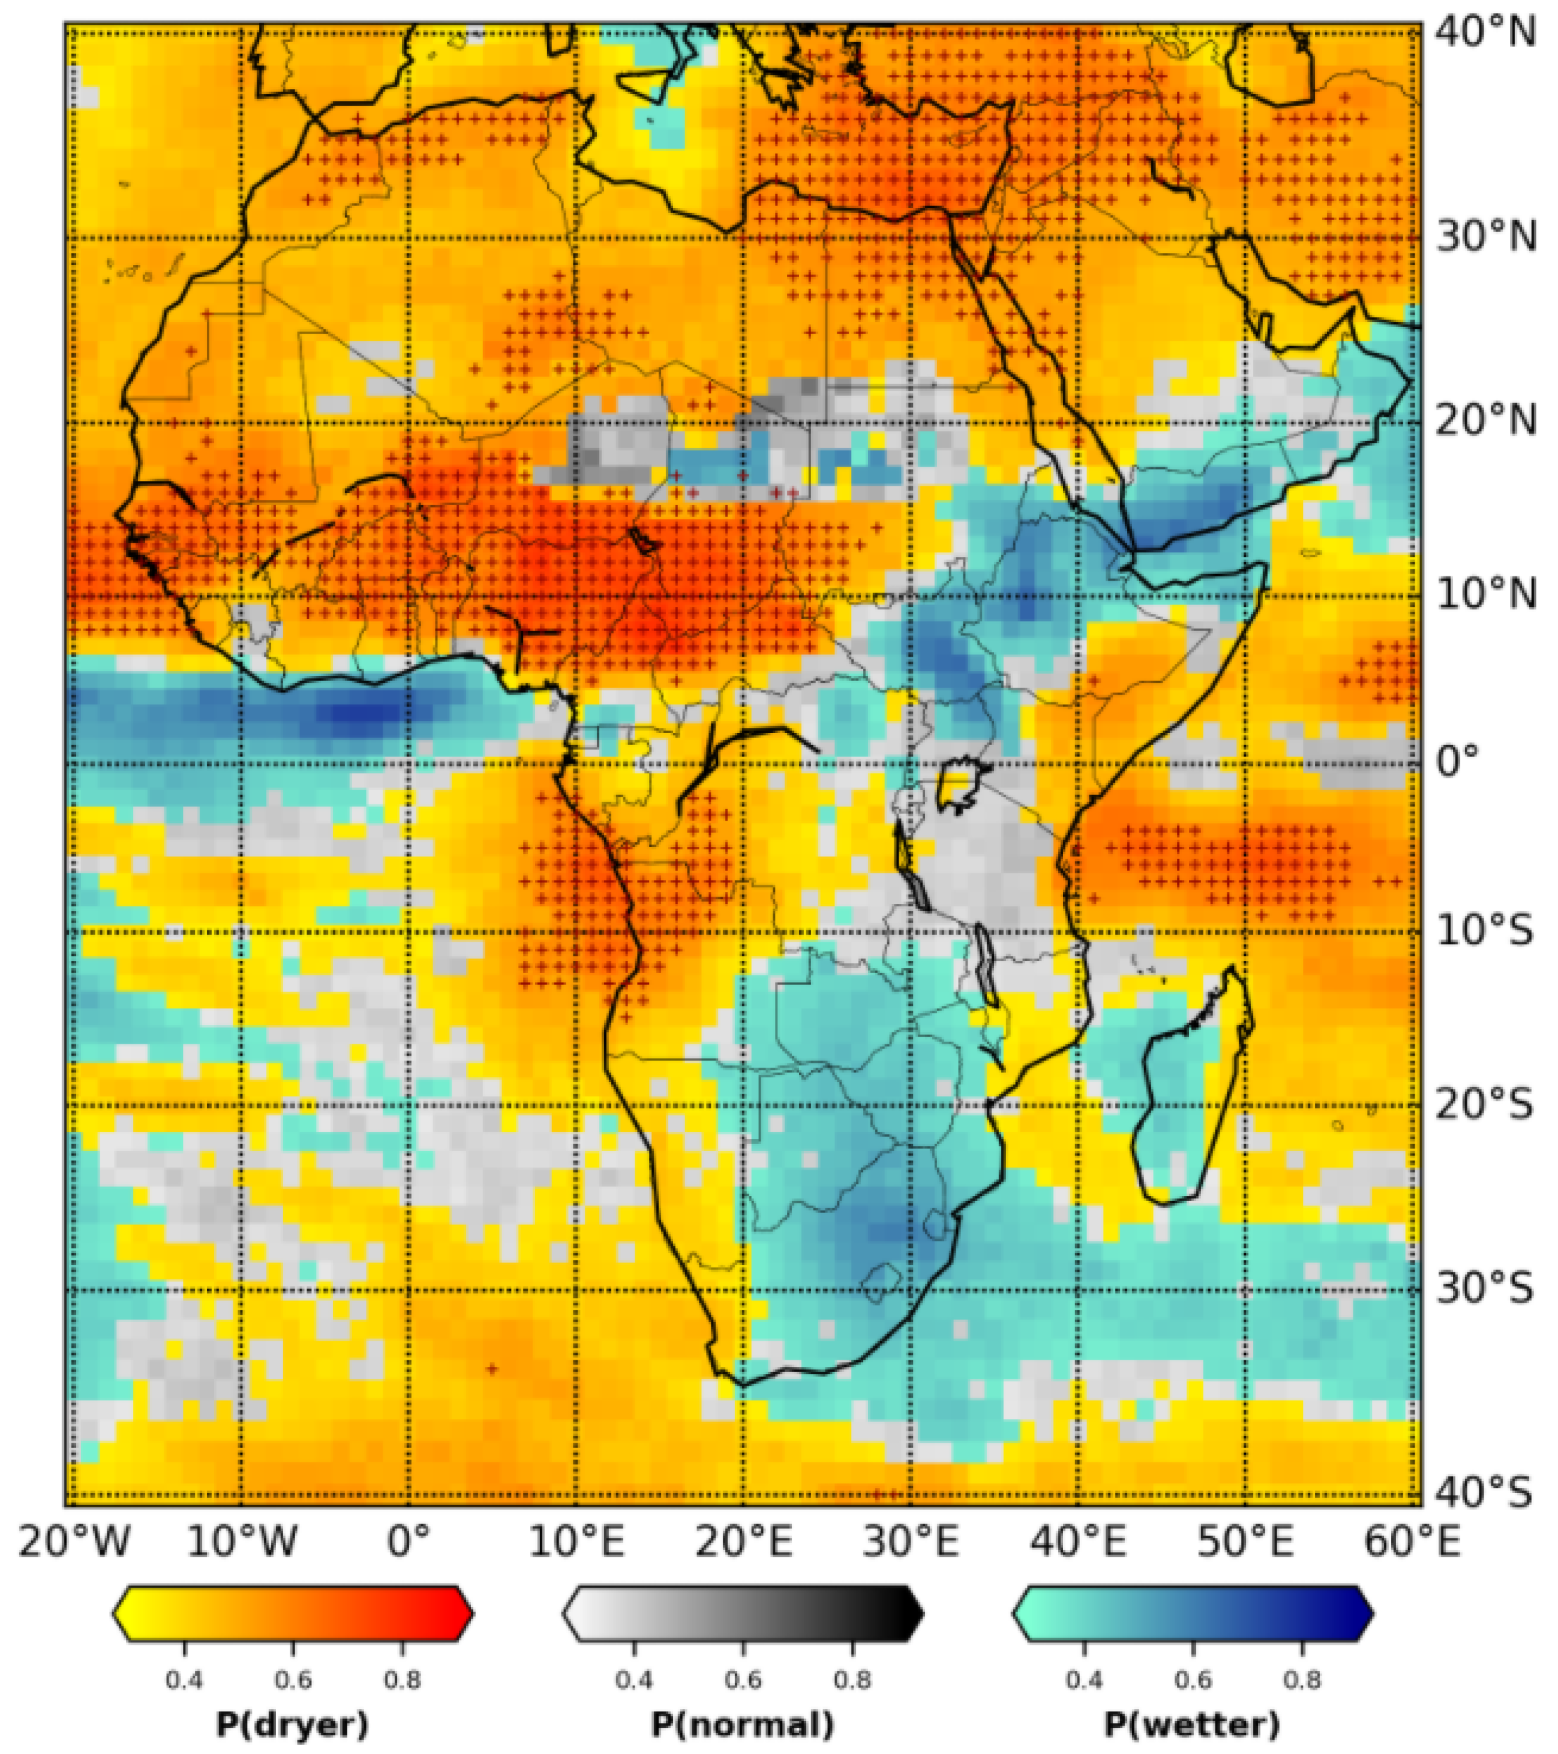
The tercile map shows the probability of the most likely category (drier than normal, normal, wetter than normal) over the selected time horizon, ranging from 1 to 6 months. Figure 3 shows an example of a tercile map for a period of three months (October–November–December 2021) as computed in October 2021.
Terciles are computed as the three 33rd percentiles of lowest, highest and normal precipitation accumulated over a reference period (from one to six months) for each grid point and each model in the retrospective forecast (i.e., hindcast). By having 24 years of past forecasts (1993–2016) with a forecasting model with n ensemble members each, each model grid point always contains 8 × n cases of precipitation in each tercile: the lowest category (precipitation ≤ 33rd percentile) represents below normal precipitation, the highest category (precipitation ≥ 67th percentile) represents above normal precipitation, the category in between (33rd percentile < precipitation ≤ 66th percentile) represents average precipitation. Figure 3, with a 100 km × 100 km spatial resolution, shows the probability of occurrence for the category predicted by the relative majority of ensemble members. For instance, consider the following example for a future month: there are a total of 378 forecast members, 200 of them predict precipitation below normal (falling in first tercile), 100 predict precipitation within the norm and 78 predict precipitation above normal. The corresponding grid cell will be yellow-orange, indicating a 52.9% probability (200 members out of 378) for precipitation below normal. The sum of each of these probabilities totals 100%, and only the information about the category having the highest forecast probability is mapped. That is, when considering the multi-model system, we will first classify each model outcome according to the model-specific terciles computed on past forecasts (thus avoiding possible bias problems among the models) and then compute the probabilities of the three terciles. These plots are updated every month and can be found in the ASAP website (https://agricultural-production-hotspots.ec.europa.eu/seasonal_forecast.php (accessed on 4 August 2023)).
Tercile maps can be considered a standard for visualising seasonal forecasts. For example, C3S provides tercile maps for three months after the forecasting time. Here, we extend this computation to all possible monthly aggregations that can be formed with the six monthly forecasts issued every month and to the computation of their skill using CHIRPS as the observational dataset. This suite of maps can be useful to an ASAP analyst interested in precipitation forecasts over a specific period of the year.
In addition, in the case of the probability of falling within the lowest 16% of the data is at least twice the expected one (where the expected is 0.16, so when P(<16%) ≥ 0.32), a “+” sign is drawn. The system is, indeed, informing that there is (at least) a 32% chance for a precipitation anomaly that occurred only 16% of the times in the past.
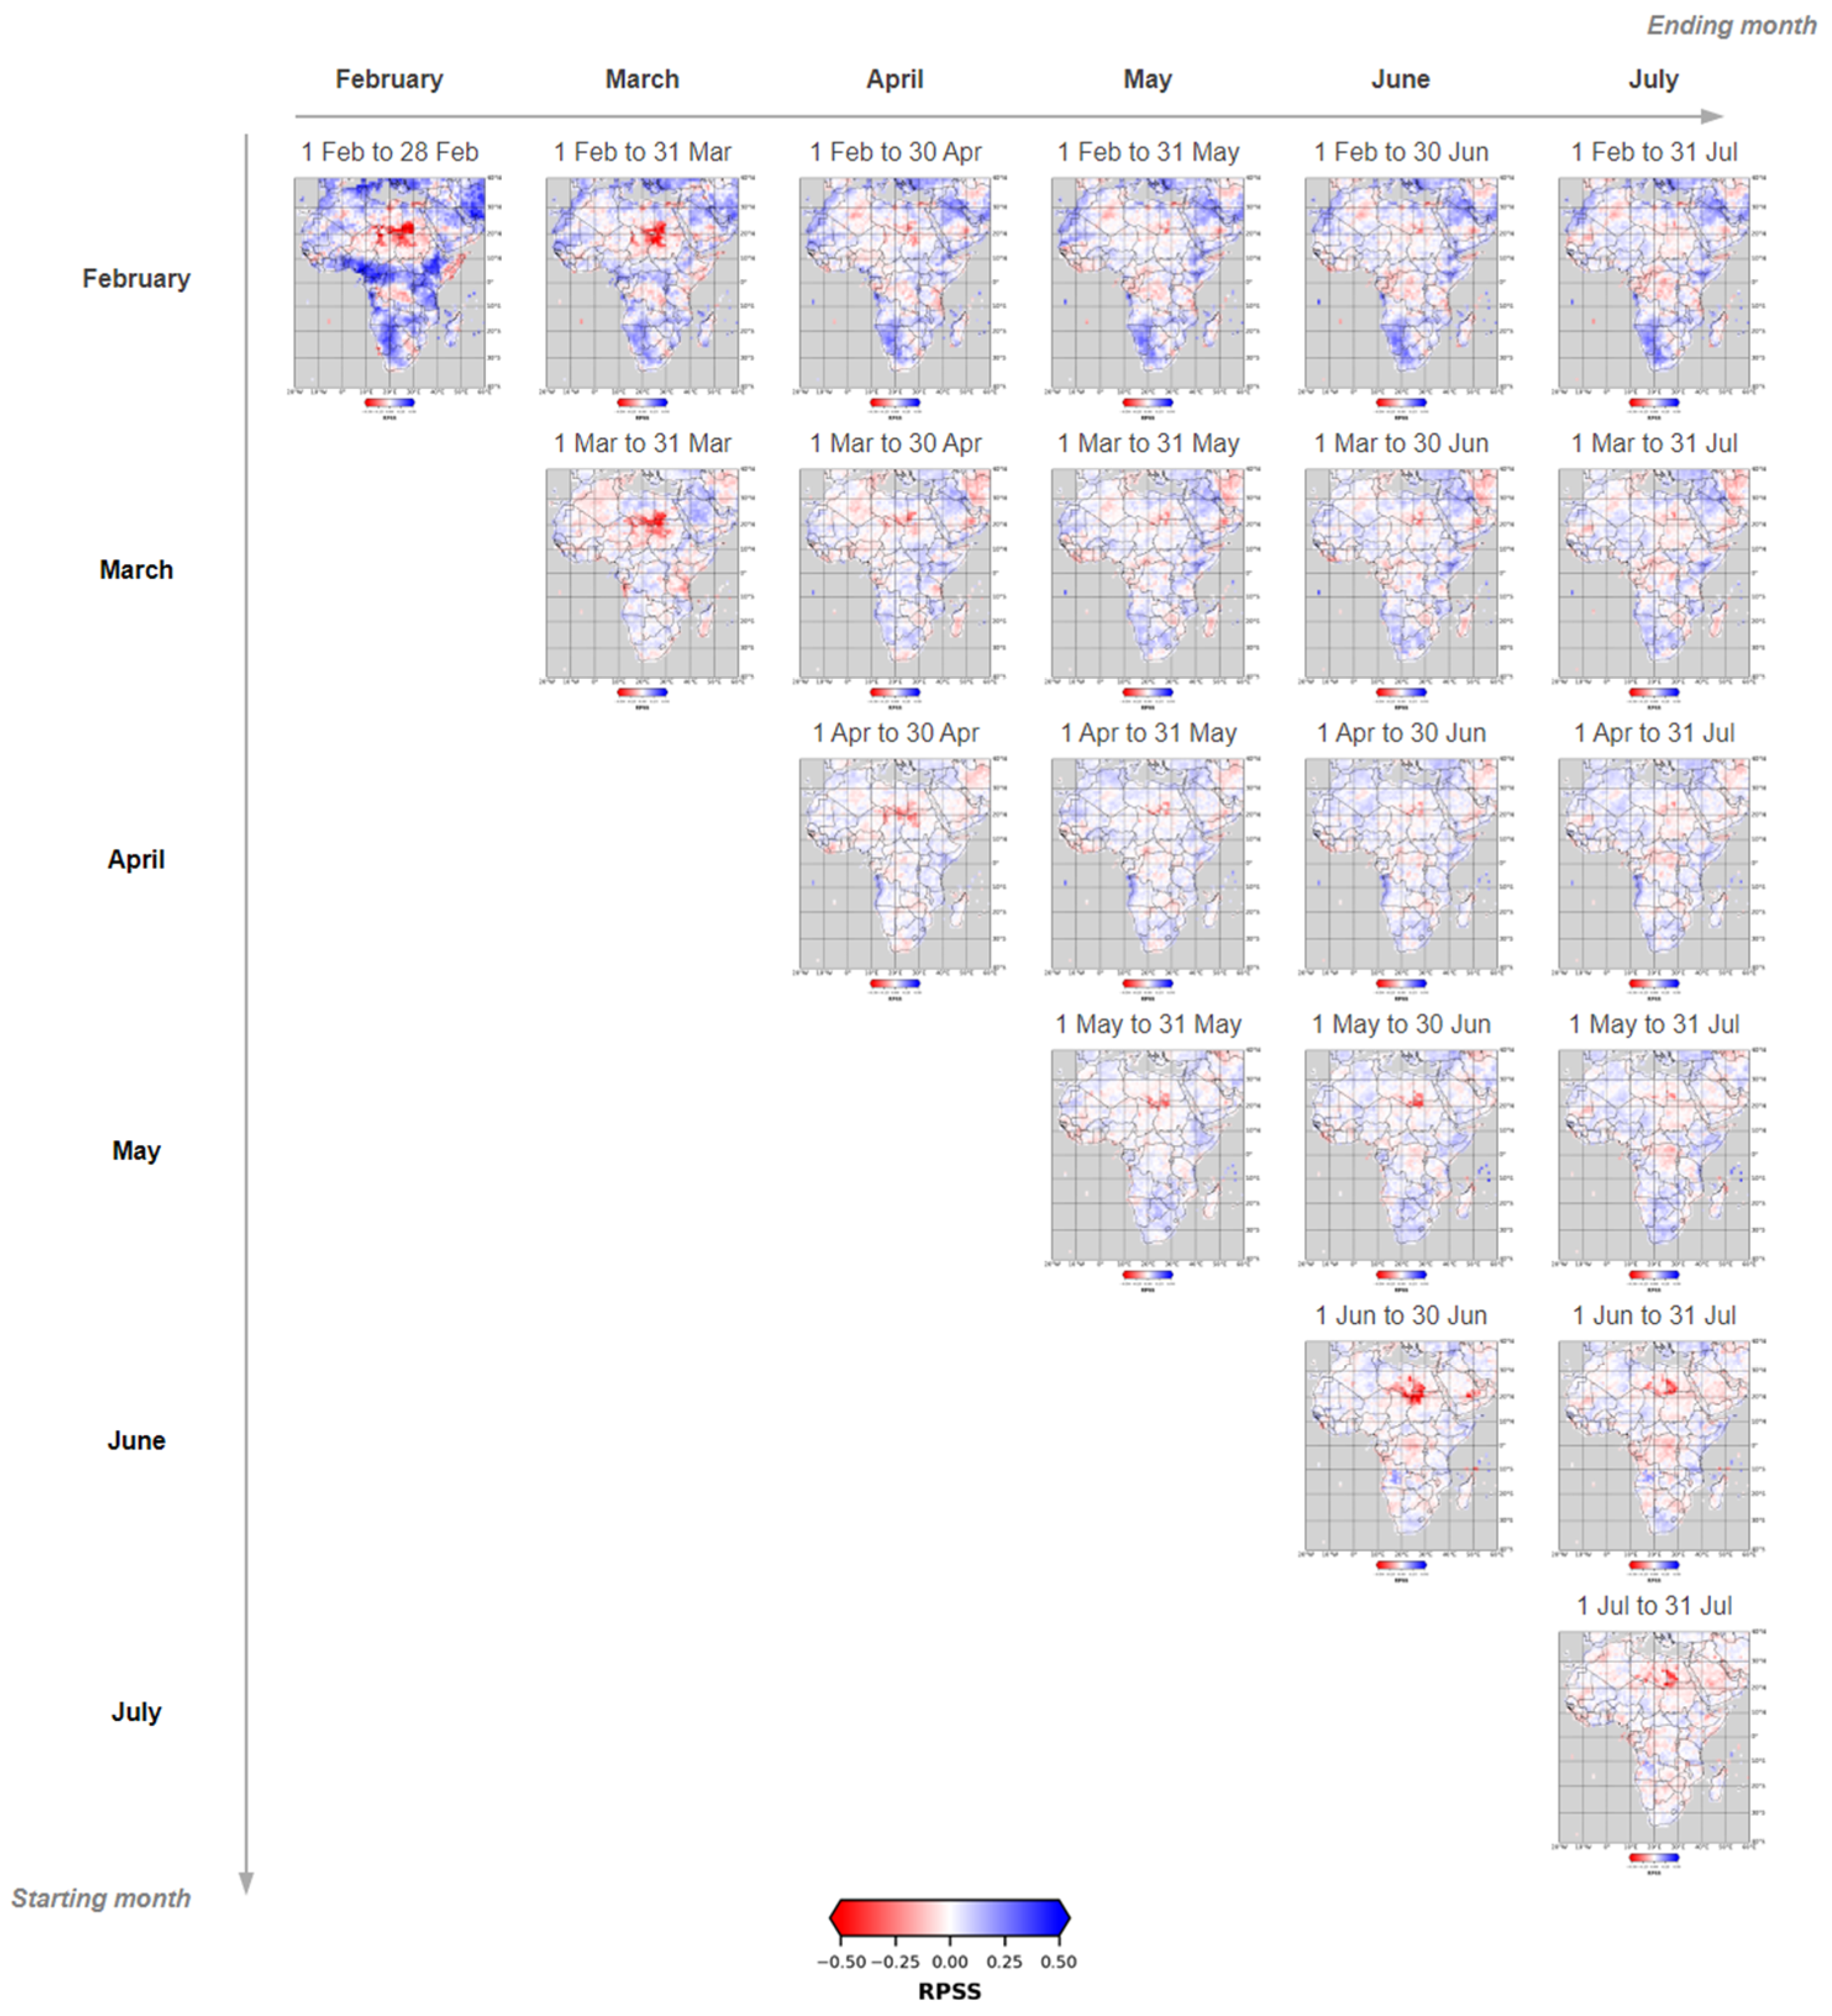
Figure 4 shows the layout used in ASAP to present the precipitation forecasts using those issued in February 2022 as an example. The forecasts are shown with tercile maps in a matrix form with rows indicating the starting month and columns indicating the ending month used for the accumulation of precipitation. To provide the user with information about the reliability of these forecasts, skill maps can be inspected on the same web page. Forecast skills are computed comparing hindcasts with CHIRPS precipitation data, considered here as the observational reference dataset, to derive the ranked probability skill score (RPSS) [31]. RPSS greater than zero indicates that the forecast outperforms the climatology while RPSS smaller than or equal to zero indicates no skill, as our forecast is less accurate than simple climatology. Figure 5 shows the RPSS maps corresponding to the tercile maps presented in Figure 4.
Seasonal precipitation forecasts are available for the global window and selected areas of interest (Asia, Europe, North America, South America, and Oceania) at the dedicated ASAP web page (https://agricultural-production-hotspots.ec.europa.eu/seasonal_forecast.php (accessed on 4 August 2023)).

2.5. Sub-National Crop Calendars

For the monthly identification of hotspot countries, ASAP analysts consider a wealth of information provided by the system, including the crop calendars, which typically list the climatological timing of planting, growth and harvesting of the main crop types. The crop calendars are available for most of the 81 food insecure countries analysed in Hotspot Assessment platform, both at national and the first sub-national level. As the crop mask employed in ASAP is not crop-specific, it is important for the analysts and users of the system to have additional information regarding the specific crop types that are likely to be present at the time of the analysis. This has been achieved by adapting FAO crop calendars available at the national level to the ASAP phenology at the first sub-national administrative level.
Land surface phenology (LSP) used in the ASAP system is defined by the satellite-derived phenology computed on the long-term average of 10 day MODIS NDVI data produced by BOKU University [20] at 1 km resolution. From the phenological analysis, some key parameters are retrieved for each land pixel, such as the number of growing seasons per year, the start of the season (SOS), the time of maximum NDVI (TOM), the start of senescence period (SEN) and the end of the season (EOS) [12]. The LSP SOS and EOS metrics at the sub-national level can be associated with sowing and harvesting dates from the known national-level crop calendars mentioned above.
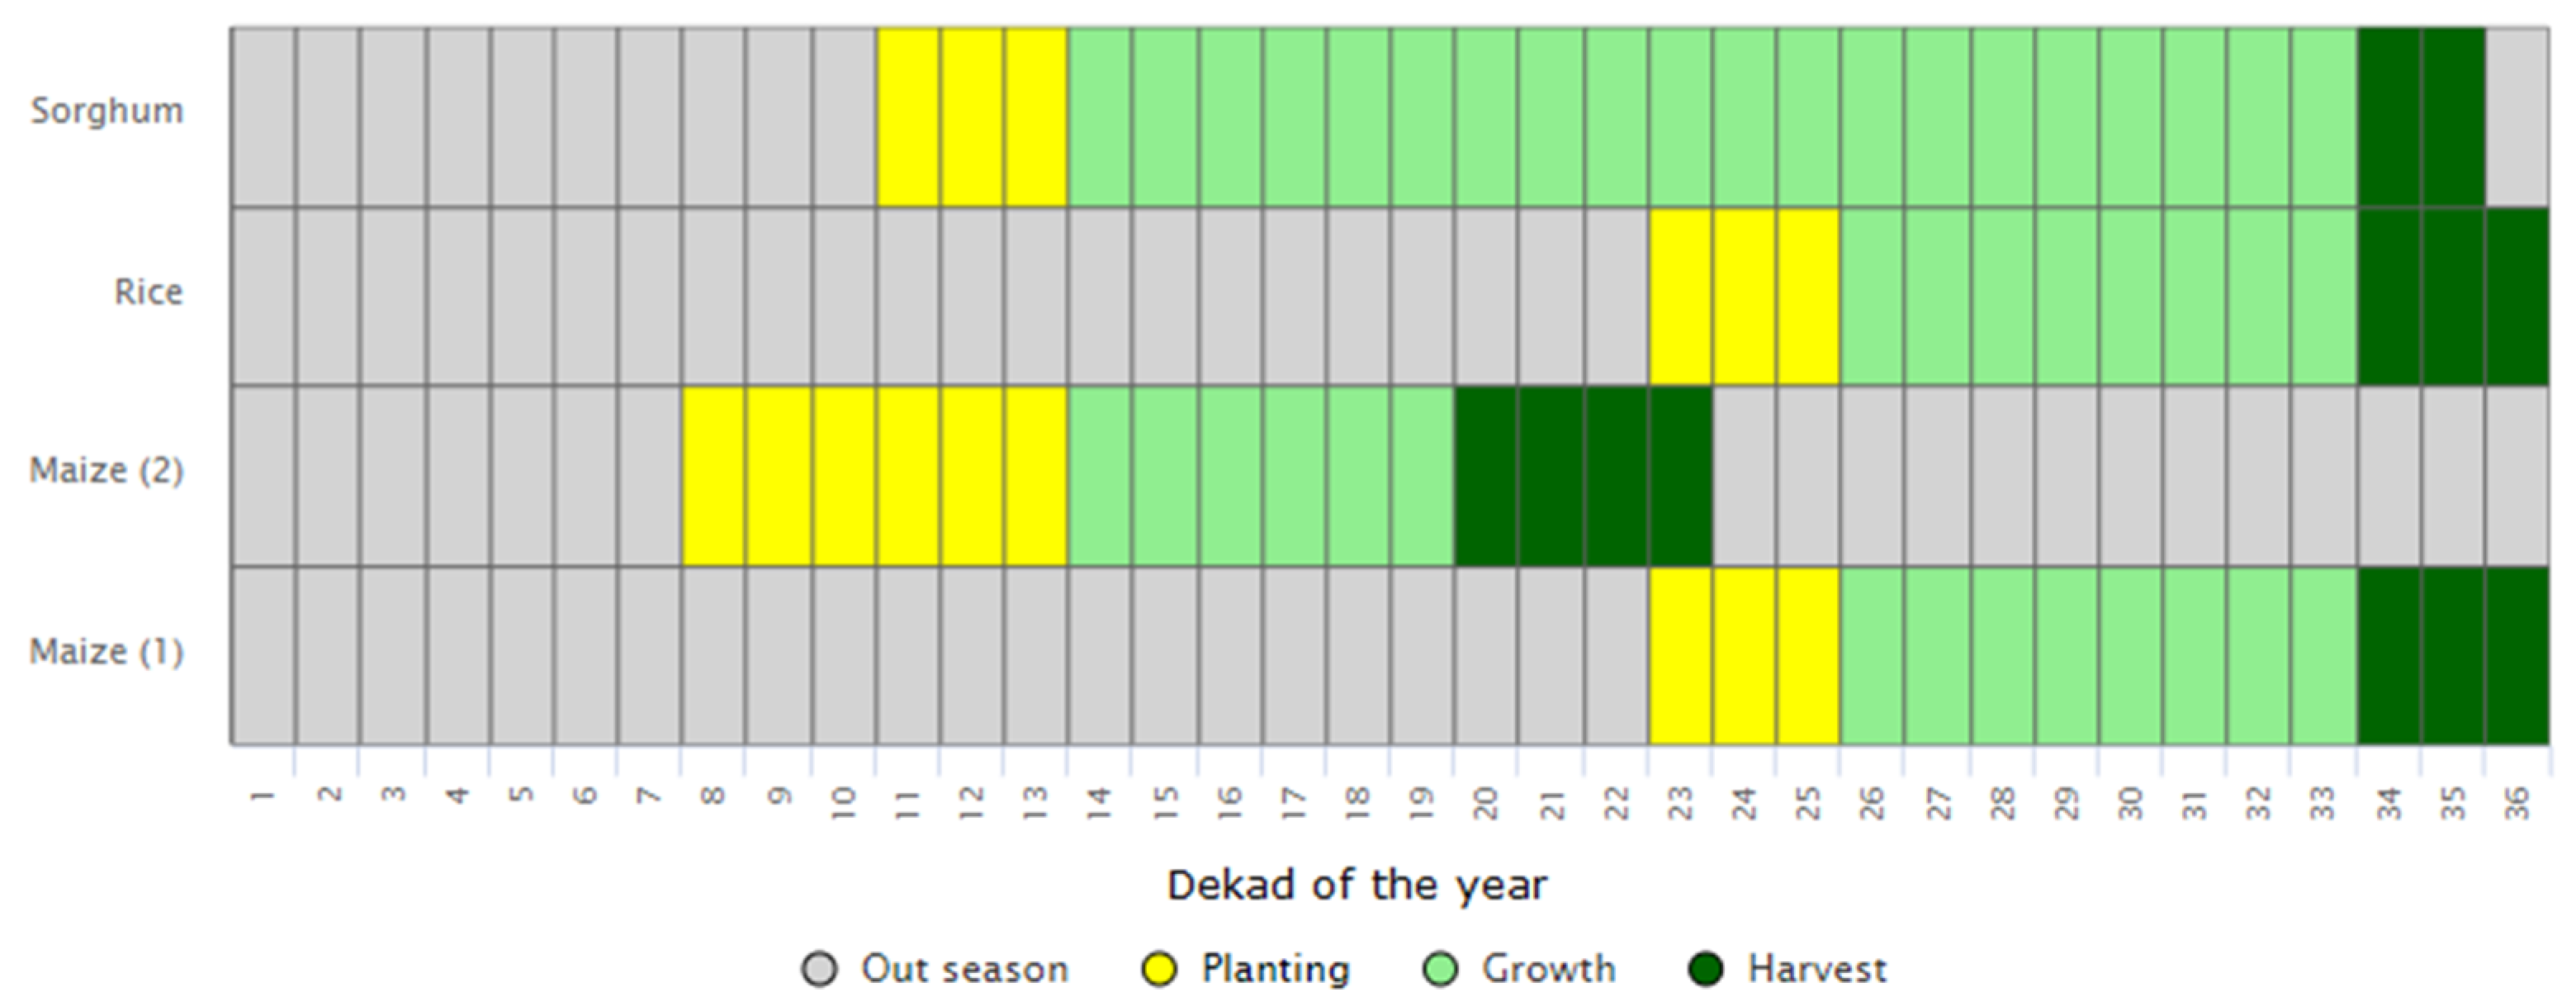
For each sub-national level unit in ASAP, the crop mask was used to extract SOS and EOS timings for each crop pixel, and density scatterplots (SOS vs. EOS) were produced for all units of the 81 countries of interest. In such scatterplots, data points tend to cluster around some [SOS, EOS] couples, indicating that a large fraction of the pixels within the unit tends to have a growing season period characterised by similar start and end timings [32]. These clusters are interpreted as main crop seasons occurring in the unit. This information is then compared with the timings from FAO national-level crop calendars in order to attribute a crop type and a calendar from the national-level information to each of the main seasons identified by the LSP analysis. As a result, crop calendars adapted to the ASAP phenology were compiled and are published on the ASAP web page in the form of graphical calendars (Figure 6). Results were checked qualitatively by comparing the cropping seasons identified with statistical data regarding the area harvested for each crop, used to verify the presence of a crop type.

2.6. High Resolution Viewer

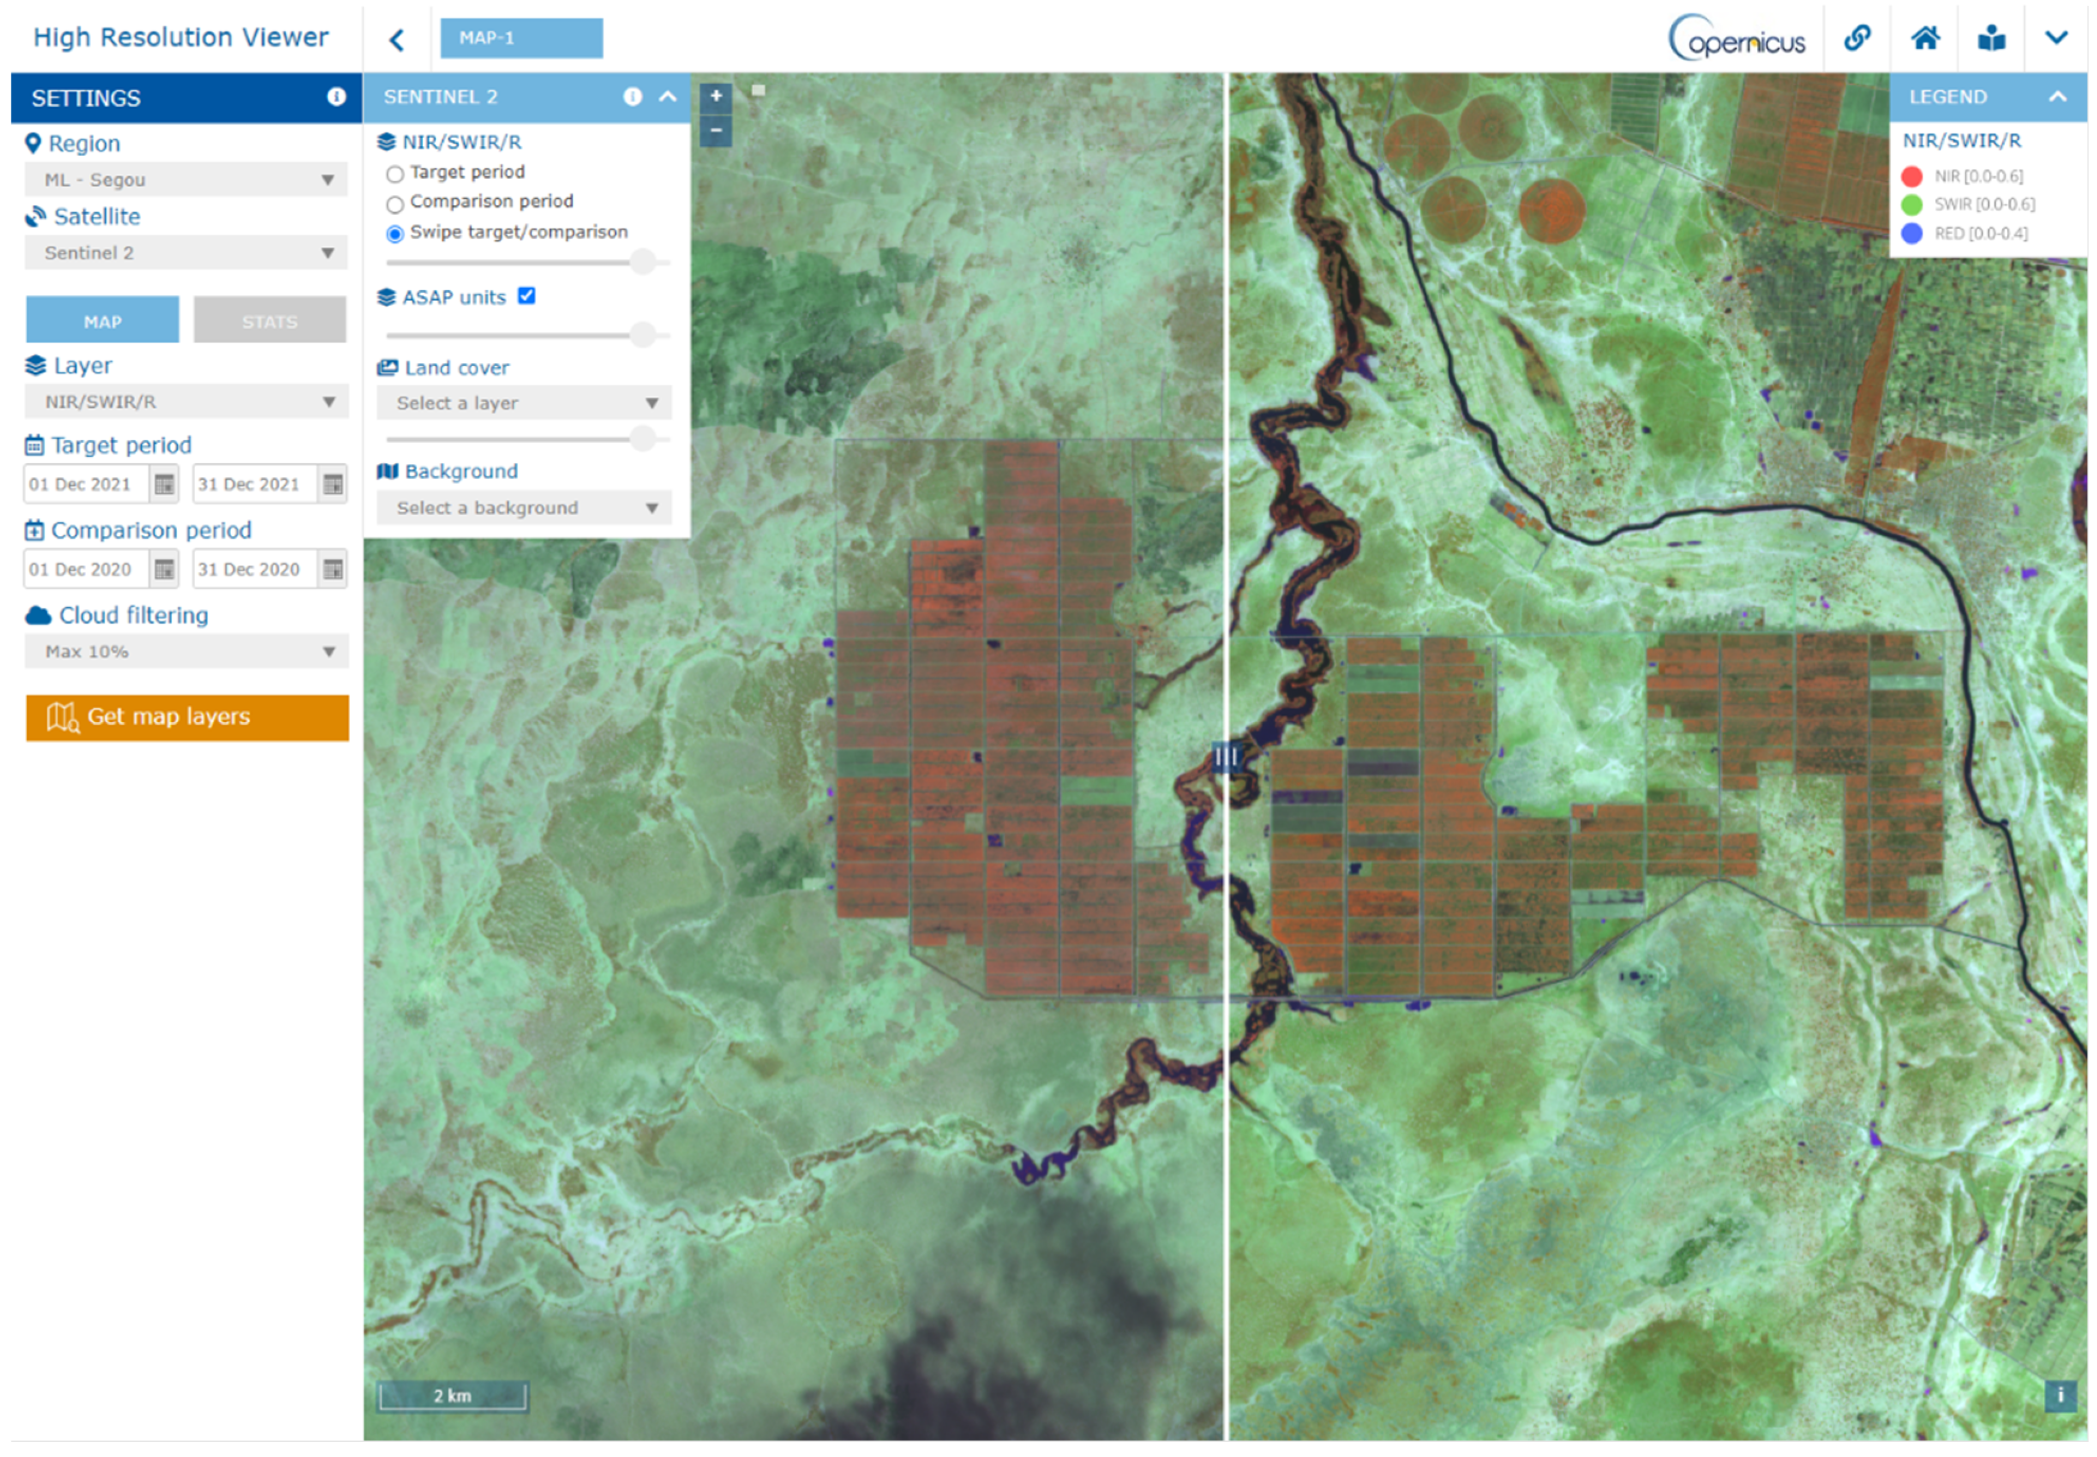
The High Resolution Viewer (https://agricultural-production-hotspots.ec.europa.eu/hresolution (accessed on 4 August 2023)) is the web application of the ASAP platform that enables analysts to monitor agriculture at field level, for example to detect surface water in case of floods or to compare current crop conditions with those at a previous reference time, based on the information offered by high-resolution satellites, namely Copernicus Sentinel-1 (radar) and Sentinel-2 (optical), and Landsat-8 and 9 (optical). The platform facilitates the exploitation of the latest generation satellite imagery by visualising and processing imagery directly in the cloud without having to download heavy datasets, thanks to a direct connection with the Google Earth Engine [2]. Users can visualise the relevant high resolution images by setting key parameters in a graphic interface: the area (a sub-national unit) where images are mosaicked, the desired satellite, the target and the comparison periods to calculate the composited images, and (for the optical sensors) the maximum cloud cover accepted and the band combination or vegetation index to be displayed (i.e., R/G/B, NIR/SWIR/RED, NDVI). In order to compare the high-resolution view with that of ASAP Warning Explorer, the user can overlay the ASAP masks as background. The opacity of the various layers can be varied, and a swipe functionality can be used to easily compare the target and comparison periods. The interface is simple and intuitive (Figure 7) and does not require any knowledge of coding to perform a detailed analysis and interpret the results based on the local context.
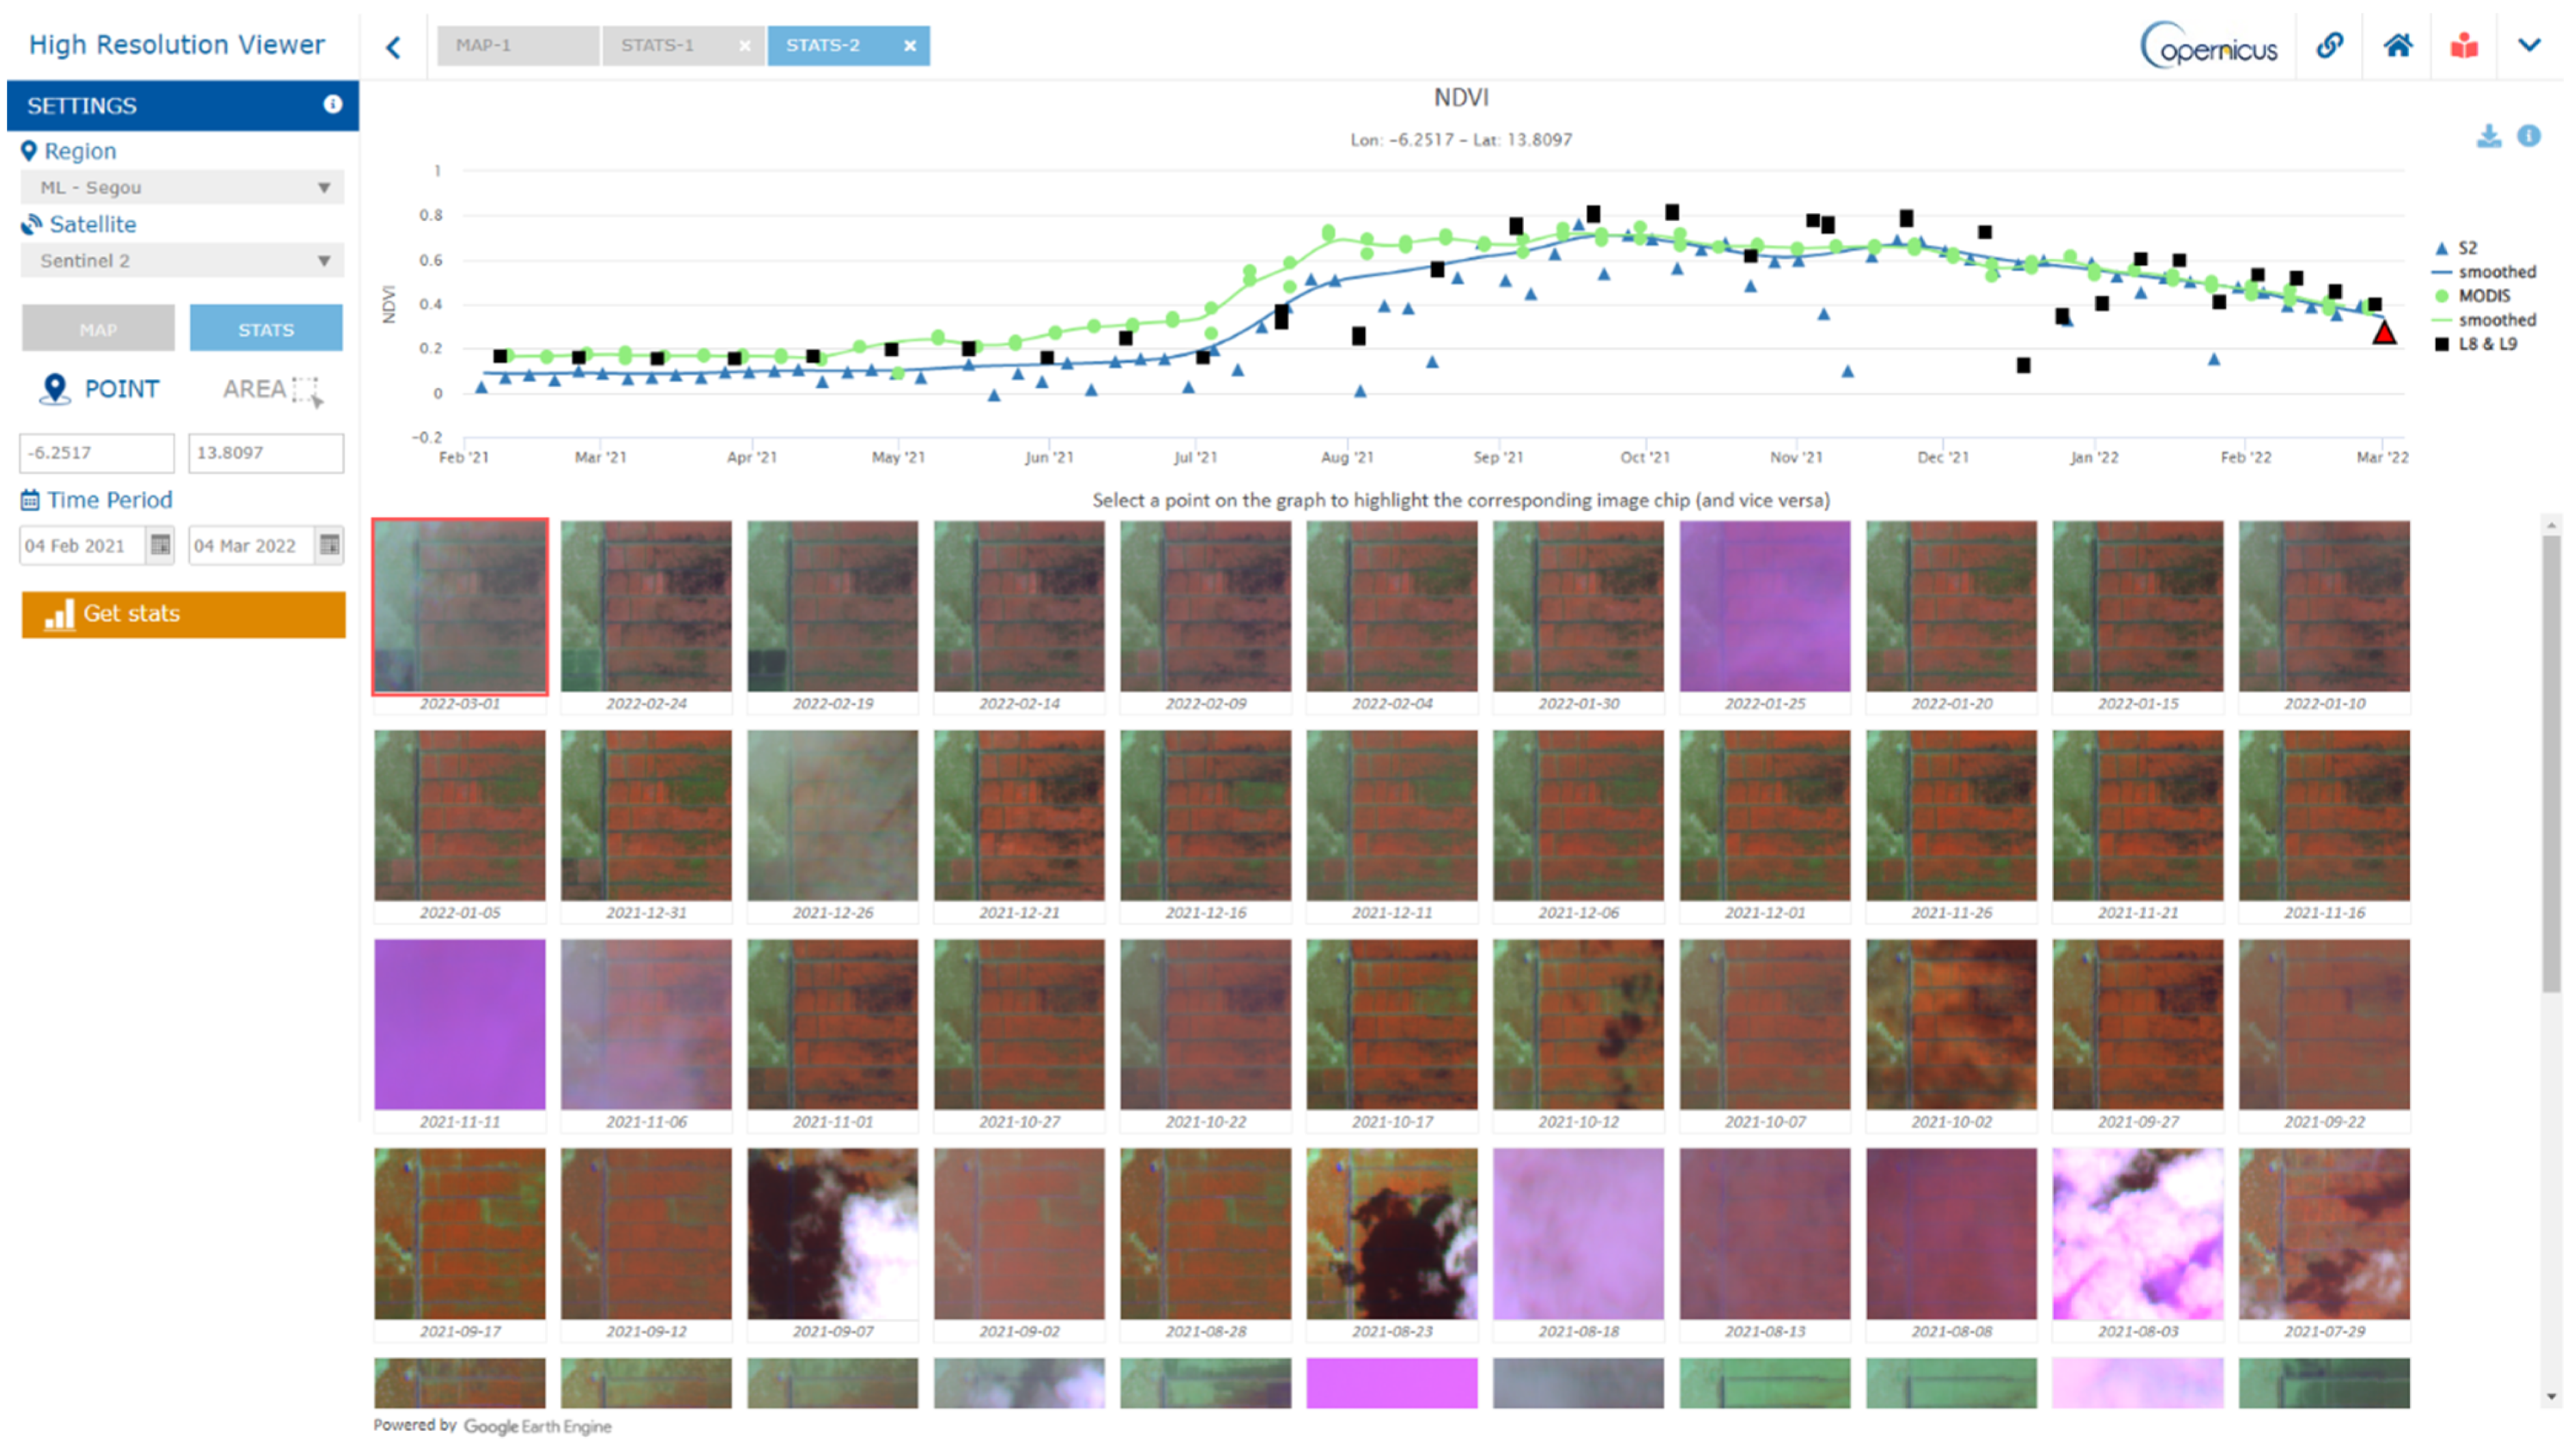
In addition to the visualisation of images, users can select a point or a polygon (multi-polygons allowed) to extract time series of NDVI (from Sentinel-2, Landsat-8 and 9, and MODIS) or VV, VH, and VH/VV ratio (from Sentinel-1) and image chips (small images around the selected areas), visualised as time series graphs and temporal sequence of images that can be interactively explored. An example is illustrated in Figure 8. In the case of polygons, instead of a time profile, the histogram of NDVI values inside the selected area is shown to assess its spatial heterogeneity.
The spatial resolution of the imagery (10–30 m) is lower compared to the very-high-resolution (VHR) imagery available in Google Earth or Bing Maps (<5 m); however, the temporal resolution is much higher (5–10 days), which makes the tool very powerful for monitoring both intra- and inter-seasonal changes. The SAR imagery (Sentinel-1) complements optical sensors and is particularly useful where optical imagery frequency is limited because of high cloudiness, or where changes involve physical properties of the surface such as harvest and irrigation. The user’s work and settings of map visualisations and time series profiles can be saved and shared between users by using short links.
The tool offers a precise view of the spatial and temporal patterns in agricultural areas at field level and allows to locally contextualise the more aggregated information provided by the Warning Explorer.

3. Regional Customisation and Local Use of ASAP Information

3.1. Improvement of Regional Climate Services in Eastern Africa in Collaboration with ICPAC

The Intergovernmental Authority on Development (IGAD) Climate Prediction and Applications Centre (ICPAC) is one of the eight regional climate centres implementing the EU funded Intra-ACP CLIMate Services and related Applications (ClimSA) project. In the framework of the ClimSA project, ICPAC implements three thematic services (i.e., agriculture, drought and water resource monitoring) over the Eastern Africa region with the objective of strengthening the capacity of member states to use EO data to improve decision support in the agriculture and food security sectors at regional, national, and sub-national levels including cross border areas of IGAD countries (i.e., Djibouti, Eritrea, Ethiopia, Kenya, Somalia, South Sudan, Sudan and Uganda).
For the Eastern Africa region, which is highly vulnerable to food insecurity resulting from exposure to multiple shocks including climate extremes and conflicts, EO offers an unprecedented opportunity for large-scale remote monitoring of agriculture conditions in near-real time, providing timely early warning information.
In 2020, a team of scientists and developers at ICPAC in collaboration with the EU-JRC ASAP team transferred and adapted the ASAP system to the region. The customised Eastern Africa ASAP system, named “Agriculture Monitoring for Eastern Africa” (https://agriculturehotspots.icpac.net/ (accessed on 4 August 2023)), features most of the functionality available in ASAP and is synchronised with the ASAP database. The system was launched in February 2021, during the 57th GHACOF (Greater Horn of Africa Climate Outlook Forum), a triannual regional event organised by ICPAC to co-produce and issue the seasonal climate forecast and related sectoral advisories for the region. The Agriculture Monitoring for Eastern Africa system fits well in the digital ecosystem of ICPAC and in particular the suite of different early warning geospatial services that ICPAC has been collecting into a one-stop-shop risk visualisation and analytics system called the East Africa Hazards Watch (EAHW, https://eahazardswatch.icpac.net (accessed on 4 August 2023)). This platform informs existing working groups that meet regularly to update latest information on climatic hazards and food security vulnerability. The information is shared with key actors across the climate, humanitarian, and development sectors such as the GHACOFs, the Food Security and Nutrition Working Group (FSNWG), the GEOGLAM regional Crop Monitoring for Early Warning and the newly established Regional Livestock Working Group. The Agriculture Monitoring for the Eastern Africa system has also been adopted as the food security monitoring system within the IGAD Disasters Operations Centre, mandated with providing comprehensive and integrated situational analysis of different multiple hazards occurring in the region. Two training workshops have been organised on the system: a Training of Trainers workshop organised in the first week of February 2021, followed by an extended user-training to ICPAC Member States representatives in June 2021.

3.2. Adaptation of ASAP to OSS

The Observatoire du Sahara et du Sahel (OSS) is an international organisation involving 33 member countries (26 African and 7 non-African countries) and 13 member organisations, including UNCCD, CILSS, IGAD and others. OSS focuses on the sustainable management of natural resources in arid, semi-arid and dry sub-humid areas of Africa, especially in areas highly vulnerable to climate change such as North Africa [33]. OSS is also the leader of one of the twelve African consortia selected by the Global Monitoring for Environment and Security (GMES) and Africa project (http://gmes.africa-union.org (accessed on 4 August 2023)), a European Union–African Union Commission project which aims at supporting decision-making in the field of sustainable management of water and natural resources through the use of EO data. In the frame of GMES & Africa, OSS is the regional centre for northern Africa, a region spanning from Mauritania to Egypt, which is highly dependent on wheat production and has experienced severe droughts in recent years, a trend likely to worsen with climate change according to the IPCC [33]. Therefore, an early warning system able to detect drought-affected areas and anticipate wheat production deficits is needed in order to take actions (e.g., better manage import and water resources). For this purpose, OSS set up an adaptation of ASAP for the northern Africa region, the GuetCrop system (http://guetcrop.oss-online.org (accessed on 4 August 2023)), launched in December 2022. The system is expected to support crop import and water management, and inform national services on crops and rangeland conditions in near real-time.
A first online training of more than 100 potential users from the region has been organised in May 2023 and will be followed by face-to-face and hands-on sessions.

3.3. Agrometeorological Bulletin by INAMET-Angola

In the context of the Intra-ACP ClimSA project, crop analysts of the Joint Research Centre provided training to meteorologists of INAMET (Instituto Nacional de Meteorologia e Geofísica, Angola) on the use of the ASAP platform for producing agrometeorological bulletins for the drought prone southern provinces of Angola. This training aimed at familiarising scientists from INAMET on the use of ASAP data for monitoring agricultural production. It included a detailed analysis of CHIRPS rainfall patterns derived from ASAP in connection with available weather station data provided by INAMET, and the progress of cropland and rangeland biomass through NDVI anomaly maps and temporal profiles derived from the ASAP system. This analysis was complemented with the inspection of Sentinel-2 false-color composites from the ASAP High Resolution Viewer, which provided additional evidences at 10 m resolution of status of crops and rangelands and surface water availability, by comparing the current agricultural season with reference years. From this collaboration, four bulletins were produced. The first was published in mid-May 2020, which reported crop and rangeland conditions for three southern provinces for the agricultural season between October 2019 and April 2020. The latest bulletin was published at the beginning of July 2021, providing information on the 2020/2021 agricultural season in the south-western part of the country that was affected by the worst drought in the last 30 years. This collaboration is a good example of how the information provided by the ASAP system can be synthesised into a product that provides policymakers and food-security analysts with up-to-date information regarding the meteorological conditions and the progress of the agricultural season. This information is crucial as it can be used to take preventive measures early in the season to mitigate the impact of extreme weather events, mainly drought, which affect crop yields and hamper food access for poor households.

3.4. ASAP Data as Predictors for Yield Forecasting

Beyond early warning systems, quantitative crop yield forecasting plays an important role in supporting national and international agricultural and food security policies, stabilising markets and planning food security interventions in food-insecure countries [13]. In the majority of cases, official yield statistics are made available by national authorities at sub-national administrative level. Operational yield-forecasting approaches are often based on empirical regression models linking historical yields and crop yield indicators, typically administrative unit averages of seasonal satellite and climate data over cultivated areas [34].
For this type of operation, often referred to as regional yield forecasting, the ASAP system represents a user-friendly source of satellite and meteorological data that are typically used as predictors of yield. In fact, the satellite-derived vegetation and meteorological variables listed in Table 1 are easily and freely downloadable from the ASAP system (https://agricultural-production-hotspots.ec.europa.eu/download.php (accessed on 4 August 2023)), which conveniently already provides the data as crop area-averaged temporal time series by administrative units.
The set of variables includes NDVI as a proxy of green biomass, the main meteorological variables influencing crop growth (precipitation, temperature and global radiation) and the Water Satisfaction Index described in Section 2.3. Variables can be downloaded from the ASAP system at GAUL (Global Administrative Units Layers of the Food and Agriculture Organization) level 1 or 2, typically corresponding to regions and provinces. Grid level values of input variables are spatially aggregated to the desired administrative level as the weighted average according to fractional area occupied by cropland in each pixel.
Examples of the use of ASAP as predictor provider for yield forecasting include the work of [36] that used a machine-learning method in Algeria or [37] that examined whether dry and wet spells combined with ASAP indicators could improve the forecast of millet yield in Senegal.
The work of [37] was based on CST (Crop Statistics Tool), a freeware designed for forecasting yield using indicators derived from crop models, weather or remote sensing data [38]. CST relates official yield statistics to yield indicators (at GAUL 1 or 2 level) imported from ASAP through linear regression or scenario analysis (a kind of nearest neighbor predictor), while accounting for time trend if present. The software can be downloaded from the ASAP web page (https://agricultural-production-hotspots.ec.europa.eu/download.php (accessed on 4 August 2023)). CST trainings based on ASAP indicators are regularly given in the framework of EU projects (e.g., GMES & Africa, ClimSA) with African partners.

4. Ways Forward

Several additional improvements are currently being implemented for the ASAP system in order to keep it synchronised with users needs and evolution of the input data sources. First, NDVI (i.e., the satellite biomass proxy) will be replaced by the FPAR (Fraction of absorbed Photosythetically Active Radiation) biophysical variable from the MODIS/VIIRS sensors. Such a change will result in a substantial increase of the spatial resolution, from the current 1 km to 500 m. An improved version of the current filtering procedure will be applied to FPAR MODIS Terra and Aqua combined and VIIRS products (currently from SUOMI-NPP, by summer 2023 complemented by NOAA-20). With this transition, we also aim at ensuring the continuity of the MODIS time series in case of future MODIS failure. In fact, FPAR observations generated from the VIIRS instrument are compatible to those of MODIS in terms of algorithm used and spatial resolution [39,40].
Second, the seasonal precipitation forecasts presented in this paper will be tailored to the ASAP phenology in order to be more easily used by the analysts. In fact, the tercile maps, although informative, leave the experts with the challenging task of understanding whether the provided information is relevant from an agronomic point of view. To overcome this issue, we will leverage on the ASAP Warning Explorer system by focusing on relevant area (using crop/rangeland static mask) and relevant time of the year when the crop/rangeland is growing (using ASAP phenology). In this way, we will extract the relevant information from the multiple tercile maps and compose it into a single map showing the most likely probability for either the remaining part of the current season or the next one if the season has not started yet.
Third, a new yield-forecasting workflow for the 81 food insecure ASAP countries is being developed [41], leveraging on FAOSTAT yield data and ASAP indicators at country level.
Finally, a more detailed administrative layer will be added (second sub-national layer vs. the currently used first sub-national layer) in order to be in-line with the information needs of agriculture and food security analysts including, for example, members of national technical working groups carrying out the Integrated Food Security Phase Classification analysis.

Author Contributions

Conceptualization, F.R., M.M. and F.U.; methodology, F.R., M.M., F.U., M.Z., A.T. and H.K.; software, P.V.; investigation, M.D., V.O., O.K., J.M.d.S.A., K.M., I.M.T.J.I., A.E.A.J., L.E.Z. and A.H.T.; data curation, P.V.; writing—original draft preparation, F.R. and M.M.; writing—review and editing, F.R., M.M., V.O., O.K., F.U., K.M., M.D. and H.K. All authors have read and agreed to the published version of the manuscript.

Funding

This research received no external funding.

Data Availability Statement

The data presented in this study are openly available at https://agricultural-production-hotspots.ec.europa.eu/download.php (accessed on 4 August 2023).

Conflicts of Interest

The authors declare no conflict of interest.

References

  1. IPCC. Climate Change 2022—Impacts, Adaptation and Vulnerability: Working Group II Contribution to the Sixth Assessment Report of the Intergovernmental Panel on Climate Change, 1st ed.; Cambridge University Press: Cambridge, UK, 2022; ISBN 978-1-00-932584-4. [Google Scholar]
  2. Gorelick, N.; Hancher, M.; Dixon, M.; Ilyushchenko, S.; Thau, D.; Moore, R. Google Earth Engine: Planetary-Scale Geospatial Analysis for Everyone. Remote Sens. Environ. 2017, 202, 18–27. [Google Scholar] [CrossRef]
  3. Soille, P.; Burger, A.; De Marchi, D.; Kempeneers, P.; Rodriguez, D.; Syrris, V.; Vasilev, V. A Versatile Data-Intensive Computing Platform for Information Retrieval from Big Geospatial Data. Future Gener. Comput. Syst. 2018, 81, 30–40. [Google Scholar] [CrossRef]
  4. Nakalembe, C.; Kerner, H. Considerations for AI-EO for Agriculture in Sub-Saharan Africa. Environ. Res. Lett. 2023, 18, 041002. [Google Scholar] [CrossRef]
  5. Fritz, S.; See, L.; Bayas, J.C.L.; Waldner, F.; Jacques, D.; Becker-Reshef, I.; Whitcraft, A.; Baruth, B.; Bonifacio, R.; Crutchfield, J.; et al. A Comparison of Global Agricultural Monitoring Systems and Current Gaps. Agric. Syst. 2019, 168, 258–272. [Google Scholar] [CrossRef]
  6. Nakalembe, C.; Becker-Reshef, I.; Bonifacio, R.; Hu, G.; Humber, M.L.; Justice, C.J.; Keniston, J.; Mwangi, K.; Rembold, F.; Shukla, S.; et al. A Review of Satellite-Based Global Agricultural Monitoring Systems Available for Africa. Glob. Food Secur. 2021, 29, 100543. [Google Scholar] [CrossRef]
  7. Atzberger, C.; Vuolo, F.; Klisch, A.; Rembold, F.; Meroni, M.; Marcio Pupin, M.; Formaggio, A. Remote Sensing Handbook. In Agriculture; CRC Press: Boca Raton, FL, USA, 2016. [Google Scholar]
  8. Weiss, M.; Jacob, F.; Duveiller, G. Remote Sensing for Agricultural Applications: A Meta-Review. Remote Sens. Environ. 2020, 236, 111402. [Google Scholar] [CrossRef]
  9. Rojas, O. Next Generation Agricultural Stress Index System (ASIS) for Agricultural Drought Monitoring. Remote Sens. 2021, 13, 959. [Google Scholar] [CrossRef]
  10. Wu, B.; Gommes, R.; Zhang, M.; Zeng, H.; Yan, N.; Zou, W.; Zheng, Y.; Zhang, N.; Chang, S.; Xing, Q.; et al. Global Crop Monitoring: A Satellite-Based Hierarchical Approach. Remote Sens. 2015, 7, 3907–3933. [Google Scholar] [CrossRef]
  11. Cammalleri, C.; Arias-Muñoz, C.; Barbosa, P.; de Jager, A.; Magni, D.; Masante, D.; Mazzeschi, M.; McCormick, N.; Naumann, G.; Spinoni, J.; et al. A Revision of the Combined Drought Indicator (CDI) Used in the European Drought Observatory (EDO). Nat. Hazards Earth Syst. Sci. 2021, 21, 481–495. [Google Scholar] [CrossRef]
  12. Rembold, F.; Meroni, M.; Urbano, F.; Csak, G.; Kerdiles, H.; Perez-Hoyos, A.; Lemoine, G.; Leo, O.; Negre, T. ASAP: A New Global Early Warning System to Detect Anomaly Hot Spots of Agricultural Production for Food Security Analysis. Agric. Syst. 2019, 168, 247–257. [Google Scholar] [CrossRef]
  13. Becker-Reshef, I.; Justice, C.; Barker, B.; Humber, M.; Rembold, F.; Bonifacio, R.; Zappacosta, M.; Budde, M.; Magadzire, T.; Shitote, C.; et al. Strengthening Agricultural Decisions in Countries at Risk of Food Insecurity: The GEOGLAM Crop Monitor for Early Warning. Remote Sens. Environ. 2020, 237, 111553. [Google Scholar] [CrossRef]
  14. FAO. Building Climate Resilience for Food Security and Nutrition. In The State of Food Security and Nutrition in the World; FAO: Rome, Italy, 2018; ISBN 978-92-5-130571-3. [Google Scholar]
  15. FAO. Safeguarding against Economic Slowdowns and Downturns. In The State of Food Security and Nutrition in the World; FAO: Rome, Italy, 2019; ISBN 978-92-5-131570-5. [Google Scholar]
  16. Funk, C.; Peterson, P.; Landsfeld, M.; Pedreros, D.; Verdin, J.; Shukla, S.; Husak, G.; Rowland, J.; Harrison, L.; Hoell, A.; et al. The Climate Hazards Infrared Precipitation with Stations—A New Environmental Record for Monitoring Extremes. Sci. Data 2015, 2, 150066. [Google Scholar] [CrossRef] [PubMed]
  17. Dinku, T.; Funk, C.; Peterson, P.; Maidment, R.; Tadesse, T.; Gadain, H.; Ceccato, P. Validation of the CHIRPS Satellite Rainfall Estimates over Eastern Africa. Quart. J R. Meteoro Soc 2018, 144, 292–312. [Google Scholar] [CrossRef]
  18. Lemma, E.; Upadhyaya, S.; Ramsankaran, R. Investigating the Performance of Satellite and Reanalysis Rainfall Products at Monthly Timescales across Different Rainfall Regimes of Ethiopia. Int. J. Remote Sens. 2019, 40, 4019–4042. [Google Scholar] [CrossRef]
  19. Muthoni, F.K.; Odongo, V.O.; Ochieng, J.; Mugalavai, E.M.; Mourice, S.K.; Hoesche-Zeledon, I.; Mwila, M.; Bekunda, M. Long-Term Spatial-Temporal Trends and Variability of Rainfall over Eastern and Southern Africa. Theor. Appl. Climatol. 2019, 137, 1869–1882. [Google Scholar] [CrossRef]
  20. Klisch, A.; Atzberger, C. Operational Drought Monitoring in Kenya Using MODIS NDVI Time Series. Remote Sens. 2016, 8, 267. [Google Scholar] [CrossRef]
  21. Atzberger, C.; Eilers, P.H.C. Evaluating the Effectiveness of Smoothing Algorithms in the Absence of Ground Reference Measurements. Int. J. Remote Sens. 2011, 32, 3689–3709. [Google Scholar] [CrossRef]
  22. Eilers, P.H.C. A Perfect Smoother. Anal. Chem. 2003, 75, 3631–3636. [Google Scholar] [CrossRef]
  23. Didan, K.; Munoz, A.B.; Solano, R.; Huete, A. MODIS Vegetation Index User’s Guide (MOD13 Series); University of Arizona, Vegetation Index and Phenology Lab: Tucson, AZ, USA, 2015. [Google Scholar]
  24. Beck, P.S.A.; Atzberger, C.; Høgda, K.A.; Johansen, B.; Skidmore, A.K. Improved Monitoring of Vegetation Dynamics at Very High Latitudes: A New Method Using MODIS NDVI. Remote Sens. Environ. 2006, 100, 321–334. [Google Scholar] [CrossRef]
  25. Sedano, F.; Kempeneers, P.; Hurtt, G. A Kalman Filter-Based Method to Generate Continuous Time Series of Medium-Resolution NDVI Images. Remote Sens. 2014, 6, 12381–12408. [Google Scholar] [CrossRef]
  26. Meroni, M.; Fasbender, D.; Rembold, F.; Atzberger, C.; Klisch, A. Near Real-Time Vegetation Anomaly Detection with MODIS NDVI: Timeliness vs. Accuracy and Effect of Anomaly Computation Options. Remote Sens. Environ. 2019, 221, 508–521. [Google Scholar] [CrossRef] [PubMed]
  27. Popov, G.; Frere, M. Early Agrometeorological Crop Yield Assessment; FAO Plant Production and Protection Paper; FAO: Rome, Italy, 1986. [Google Scholar]
  28. Pérez-Hoyos, A.; Udías, A.; Rembold, F. Integrating Multiple Land Cover Maps through a Multi-Criteria Analysis to Improve Agricultural Monitoring in Africa. Int. J. Appl. Earth Obs. Geoinf. 2020, 88, 102064. [Google Scholar] [CrossRef] [PubMed]
  29. Allen, R.G.; Food and Agriculture Organization of the United Nations (Eds.) Crop Evapotranspiration: Guidelines for Computing Crop Water Requirements; FAO Irrigation and Drainage Paper; Food and Agriculture Organization of the United Nations: Rome, Italy, 1998; ISBN 978-92-5-104219-9. [Google Scholar]
  30. Boogaard, H.; van der Wijngaart, R.; van Kraalingen, D.; Meroni, M.; Rembold, F. ASAP Water Satisfaction Index; European Commission Joint Research Centre, Publications Office of the European Union: Luxembourg, 2019. [Google Scholar] [CrossRef]
  31. Wilks, D.S. Statistical Methods in the Atmospheric Sciences, 4th ed.; Elsevier: Cambridge, MA, USA, 2019; ISBN 978-0-12-815823-4. [Google Scholar]
  32. Dimou, M.; Meroni, M.; Rembold, F. Development of a National and Sub-National Crop Calendars Data Set Compatible with Remote Sensing Derived Land Surface Phenology; European Commission Joint Research Centre, Publications Office of the European Union: Luxembourg, 2018. [Google Scholar] [CrossRef]
  33. IPCC; Core Writing Team; Lee, H.; Romero, J. (Eds.) Climate Change 2023: Synthesis Report; A Report of the Intergovernmental Panel on Climate Change; Contribution of Working Groups I, II and III to the Sixth Assessment Report of the Intergovernmental Panel on Climate Change; IPCC: Geneva, Switzerland, 2023. [Google Scholar]
  34. Schauberger, B.; Jägermeyr, J.; Gornott, C. A Systematic Review of Local to Regional Yield Forecasting Approaches and Frequently Used Data Resources. Eur. J. Agron. 2020, 120, 126153. [Google Scholar] [CrossRef]
  35. Meroni, M.; Rembold, F.; Urbano, F.; Csak, G.; Lemoine, G.; Kerdiles, H.; Perez-Hoyos, A. The Warning Classification Scheme of ASAP—Anomaly Hot Spots of Agricultural Production v 4.0; European Commission Joint Research Centre, Publications Office of the European Union: Luxembourg, 2019. [Google Scholar] [CrossRef]
  36. Meroni, M.; Waldner, F.; Seguini, L.; Kerdiles, H.; Rembold, F. Yield Forecasting with Machine Learning and Small Data: What Gains for Grains? Agric. For. Meteorol. 2021, 308–309, 108555. [Google Scholar] [CrossRef]
  37. Fall, C.M.N.; Lavaysse, C.; Kerdiles, H.; Dramé, M.S.; Roudier, P.; Gaye, A.T. Performance of Dry and Wet Spells Combined with Remote Sensing Indicators for Crop Yield Prediction in Senegal. Clim. Risk Manag. 2021, 33, 100331. [Google Scholar] [CrossRef]
  38. Kerdiles, H.; Rembold, F.; Leo, O.; Boogaard, H.; Hoek, S. CST, a Freeware for Predicting Crop Yield from Remote Sensing or Crop Model Indicators: Illustration with RSA and Ethiopia. In Proceedings of the 2017 6th International Conference on Agro-Geoinformatics, Fairfax, VA, USA, 7–10 August 2017; pp. 1–6. [Google Scholar] [CrossRef]
  39. Xu, B.; Park, T.; Yan, K.; Chen, C.; Zeng, Y.; Song, W.; Yin, G.; Li, J.; Liu, Q.; Knyazikhin, Y.; et al. Analysis of Global LAI/FPAR Products from VIIRS and MODIS Sensors for Spatio-Temporal Consistency and Uncertainty from 2012–2016. Forests 2018, 9, 73. [Google Scholar] [CrossRef]
  40. Yan, K.; Park, T.; Chen, C.; Xu, B.; Song, W.; Yang, B.; Zeng, Y.; Liu, Z.; Yan, G.; Knyazikhin, Y.; et al. Generating Global Products of LAI and FPAR From SNPP-VIIRS Data: Theoretical Background and Implementation. IEEE Trans. Geosci. Remote Sens. 2018, 56, 2119–2137. [Google Scholar] [CrossRef]
  41. Piles, M.; Mateo-Sanchis, A.; Munoz-Mari, J.; Camps-Valls, G.; Waldner, F.; Rembold, F.; Meroni, M. Global Cropland Yield Monitoring with Gaussian Processes. In Proceedings of the 2021 IEEE International Geoscience and Remote Sensing Symposium IGARSS, Brussels, Belgium, 11–16 July 2021; pp. 180–183. [Google Scholar]
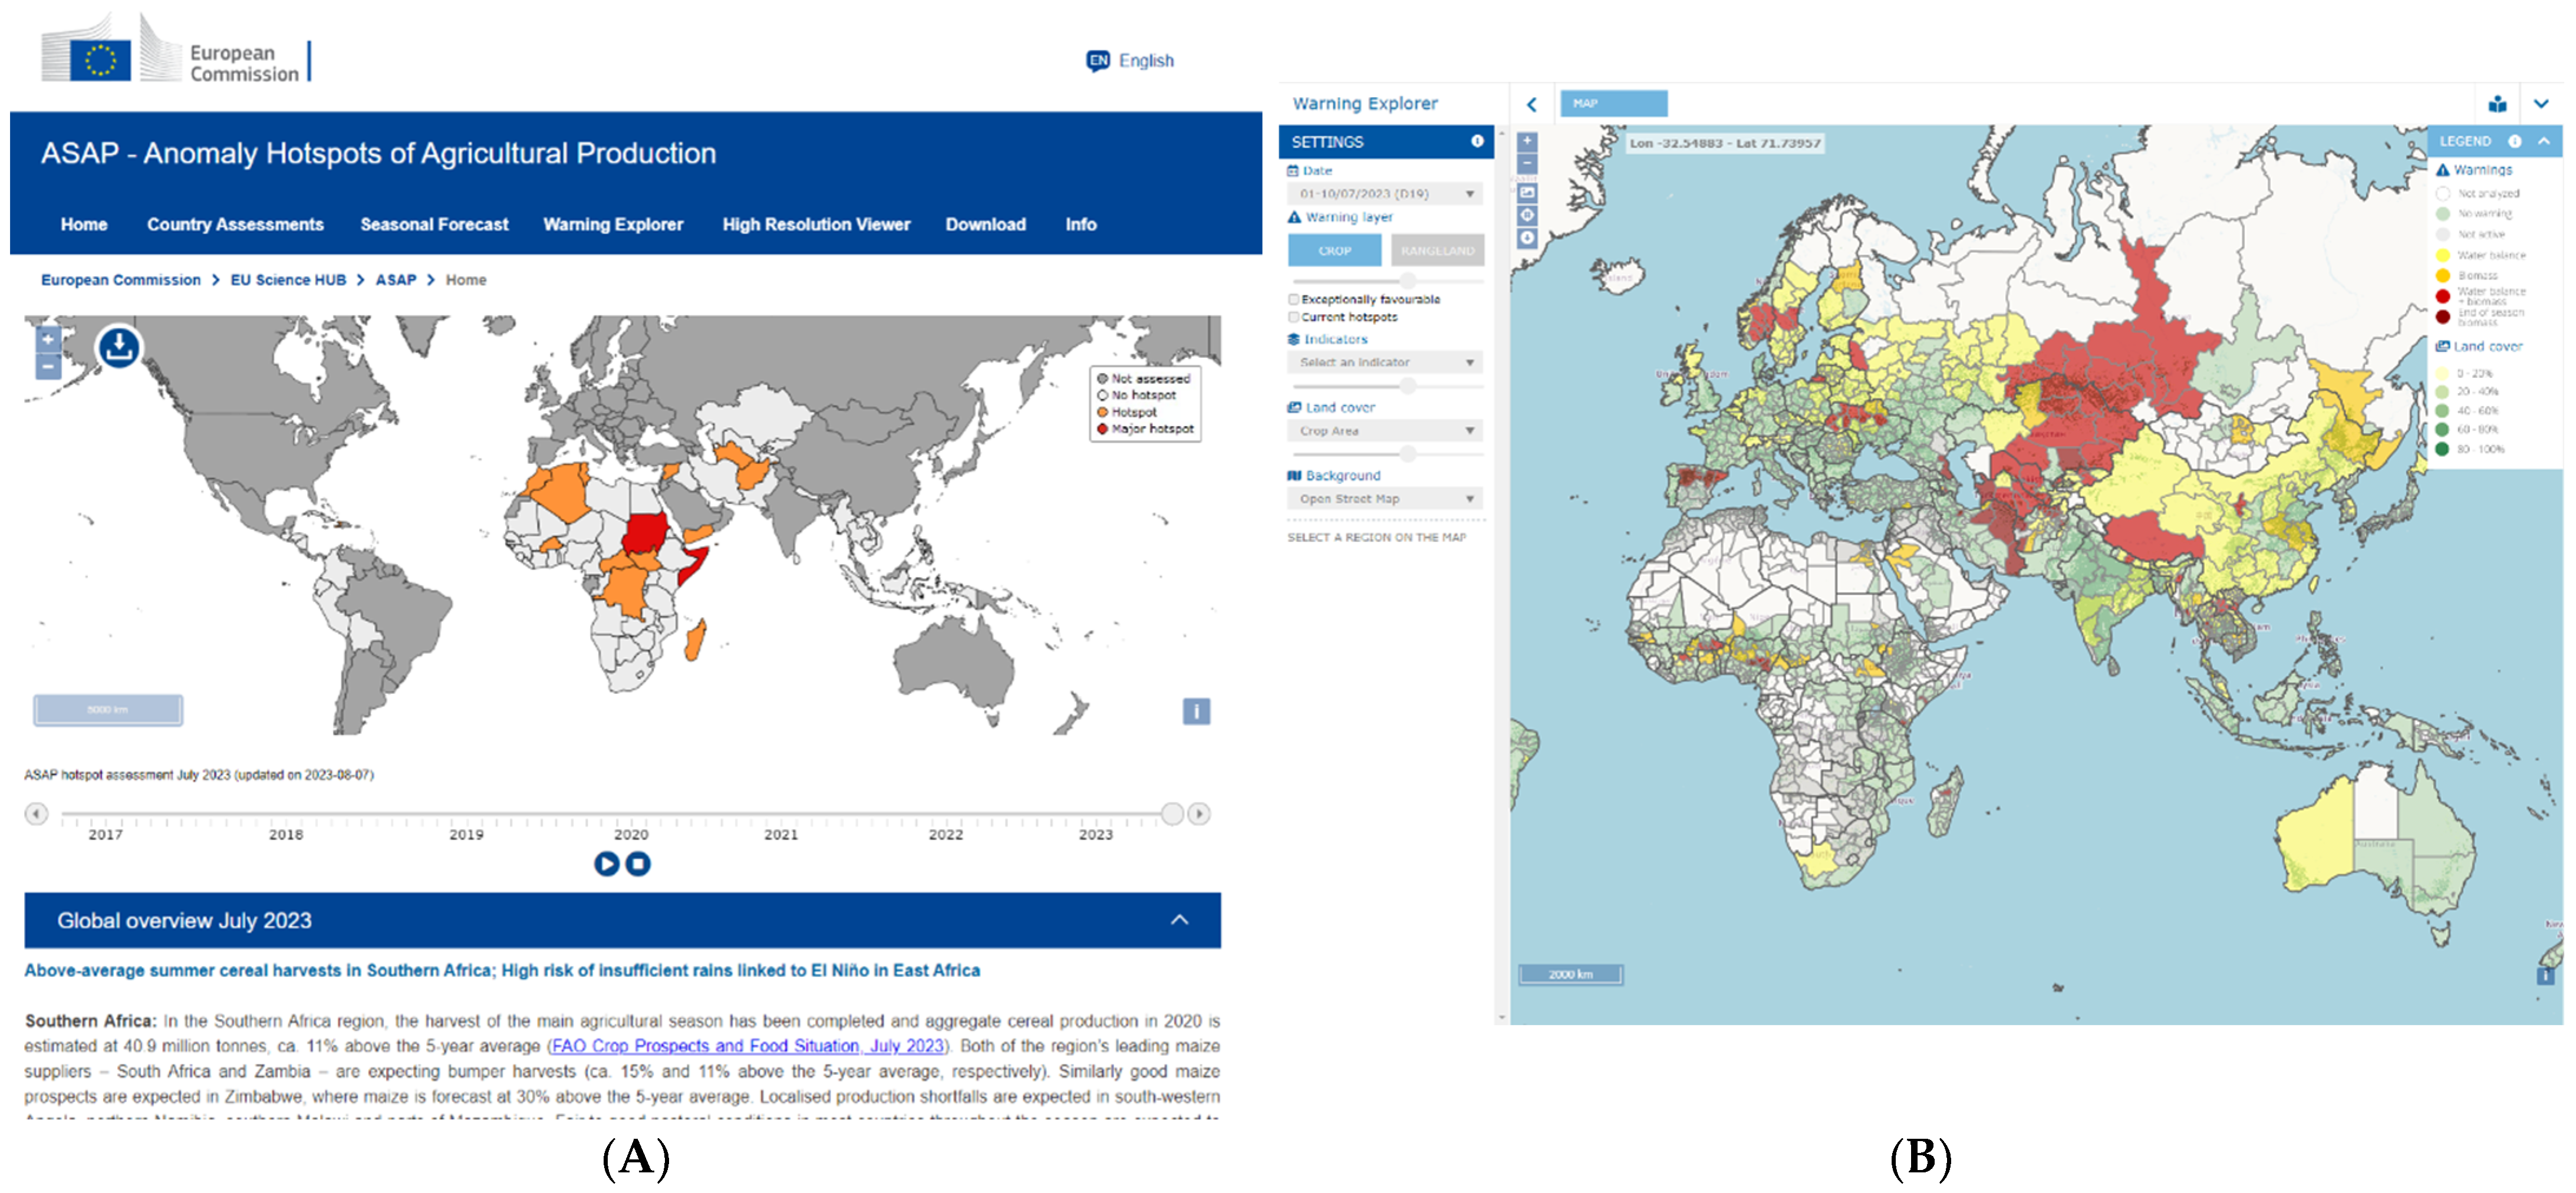
Figure 1. Main entry web pages of ASAP: (A) Global Hotspot Assessment; (B) Warning Explorer; and (C) High Resolution Viewer.
Remotesensing 15 04284 g001aRemotesensing 15 04284 g001b
Figure 2. Anomaly of the volumetric surface soil moisture for the last dekad of January 2022.
Remotesensing 15 04284 g002
Figure 3. Precipitation tercile map computed on forecasts issued in October 2021 and referring to the period October–November–December 2021.
Remotesensing 15 04284 g003
Figure 4. Tercile maps of seasonal precipitation forecasts available on the ASAP system on 15 February 2022.
Remotesensing 15 04284 g004
Figure 5. RPSS maps of seasonal precipitation forecasts available on the ASAP system on 15 February 2022.
Remotesensing 15 04284 g005
Figure 6. Crop calendar for the sub-national administrative unit of Niger (Nigeria). Yellow, light green and dark green indicate sowing, growing and harvesting periods, respectively.
Remotesensing 15 04284 g006
Figure 7. An example of the High Resolution Viewer with the parameters set (on the left panel) to retrieve the images shown in the map. In this case, the swipe functionality is activated to compare a NIR/SWIR/Red composition of Sentinel-2 for December 2021 (left to the vertical white swipe line) with the same month of the previous year (right of the swipe line) in an area of irrigated crops in the Segou province of Mali.
Remotesensing 15 04284 g007
Figure 8. Statistics extracted for the selected point. The upper panel shows the NDVI temporal profile derived from Sentinel-2, Landsat-8 and 9 and MODIS (with smoothed curve to help the interpretation of the results). The lower panel shows the time series of the chips (images zoomed on the selected point). Chips and the time profile are connected so it is possible to click on a data point to visualise the corresponding image, helping to detect values affected by undetcted clouds.
Remotesensing 15 04284 g008
Table 1. ASAP variables available for direct download and use in yield-forecasting operations.
CategoryVariableSpatial
Resolution
Temporal ResolutionSource
Satellite vegetation proxyNDVI1 km10 dayMODIS MOD13A2 and MYD13A2 V006 filtered using the constrained Whittaker smoother as described in [20]
Meteorological dataAverage air temperature (at 2 m), Global Radiation sum25 km10 dayElaboration on ECMWF ERA5 data as described in [35]
Precipitation sum, SPI 3 months5 km10 dayCHIRPS 2.0 [16]
Water satisfaction index1 km10 day[30]
Cropland/rangeland fractionPercentage of the pixel occupied by cropland/rangeland1 kmstaticDerived from hybrid cropland mask combining multiple land cover maps [28]
Disclaimer/Publisher’s Note: The statements, opinions and data contained in all publications are solely those of the individual author(s) and contributor(s) and not of MDPI and/or the editor(s). MDPI and/or the editor(s) disclaim responsibility for any injury to people or property resulting from any ideas, methods, instructions or products referred to in the content.