Technical Note

An Investigation on the Ionospheric Response to the Volcanic Explosion of Hunga Ha’apai, 2022, Based on the Observations from the Meridian Project: The Plasma Drift Variations

1
Department of Geophysics, College of the Geology Engineering and Geomatics, Chang’an University, Xi’an 710054, China
2
Department of Earth and Space Sciences, Southern University of Science and Technology, Shenzhen 518055, China
3
School of Earth and Space Sciences, University of Science and Technology of China, Hefei 230026, China
4
Center for Environmental Research and Earth Sciences (CERES), Salem, MA 01970, USA
5
Institute of Earth Physics and Space Science (ELKH EPSS), 9400 Sopron, Hungary
6
Instituto De Geofísica, Universidad Nacional Autónoma De México, Mexico City 04510, Mexico
*
Author to whom correspondence should be addressed.
Remote Sens. 2023, 15(17), 4181; https://doi.org/10.3390/rs15174181
Submission received: 17 July 2023 / Revised: 17 August 2023 / Accepted: 19 August 2023 / Published: 25 August 2023

Abstract

:
The Hunga Ha’apai volcano eruption (20.536°S, 175.382°W in Tonga) reached its maximum outbreak on 15 January 2022, at 04:15 UT, leading to huge oceanic fluctuations and atmospheric disturbances. This study focuses on the response of the ionosphere to the eruption of Tonga volcano, based on observations from a low-latitude station of the Meridian Project at Fuke, Hainan (19.310°N, 109.080°E). We identified the anomalies in the plasma drift caused by the volcanic eruption and discussed the possible mechanisms. The following results were obtained: (1) The anomalies of ionospheric plasma drift were observed at Fuke Station, during the main eruption; (2) A sudden increase and inversion of the plasma drift velocity occurred on January 15, and a large fluctuation of the drift velocity occurred afterwards; (3) By comparing the anomalous propagation velocity with the background drift, it was confirmed that the anomaly was the response of the low latitude ionosphere to the Tonga volcano eruption. Furthermore, we analyzed a possible mechanism for the effect of volcanic eruptions on ionospheric plasma drift. A large number of charged particles could be brought out by the explosion to generate an atmospheric electric field, which may cause the ionospheric plasma to change its original motion.

Graphical Abstract

1. Introduction

The ionospheric plasma is mainly caused and maintained by ionization through various solar radiations. The plasma drift velocity is a series of directional movements of the ionized particles under the combined electric field, magnetic field, gravity, and other forces [1,2]. As one of the important parameters of the ionosphere, the plasma drift velocity is of great significance to the study of the ionospheric morphology and dynamics [3].
The study of ionospheric plasma can be performed in terms of ionospheric dynamics. For example, plasma drift with small-scale irregularities [4], the daily and seasonal variations of plasma vertical drift velocity at mid-low latitudes [5], and the characteristics of plasma drift at low latitude during geomagnetic activities [5] have been widely studied over the years. The ionospheric plasma motions are mainly driven by local ionospheric electric field and neutral wind [6,7], while the magnetic field disturbances during strong magnetic storms could also have a significant impact on plasma drift velocity [8,9,10,11]. In addition, previous results also show that there is a certain coupling between the lower atmospheric disturbances and the ionospheric plasma drift. In a plasma bubble event, the vertical drift velocity will change while the bubbles generated in the lower atmosphere are lifted to the top of the ionosphere [12]. And during the Sudden Stratosphere Warming (SSW) event, the equator plasma drift perturbation is enhanced substantially in the vertical direction at the nightside [13].
On the other hand, studies using ionospheric altimeter research on ionospheric response to earthquakes around the world have shown that ionospheric disturbances near the epicenter are often observed and detected [14,15]. The strong pre-seismic ionospheric disturbances observed in ground-based ionospheric and satellite ionospheric measurements have been synthesized, and the pre-seismic E layer critical frequency enhancement and layer expansion phenomena in the literature have been summarized [8,16]. The multiple pre-earthquake E layer critical frequency (foES) enhancement and sporadic E layer (ES) extension phenomena have all been observed. Based on the global Position System (GPS) observatory stations over China, researchers have also conducted a large number of applied studies on the seismic-ionosphere couplings [17]. According to the statistical analysis of 736 earthquakes with the seismic magnitude scale of the Richter scale M > 6 in the global area from 2002 to 2010, it could be concluded that spatially perturbed anomalies in TEC often occurred near the epicenter [18]. Therefore, the investigation of the coupling mechanism between earthquakes and the ionosphere is of profound significance for the study of ionospheric morphology and dynamical processes.
In addition, the volcanic eruption, which may often be accompanied by earthquakes, is also considered to be responsible for multiple ionospheric disturbances [19,20,21,22,23,24,25,26,27,28,29,30,31]. Overall, the specific physical mechanism of volcanic-ionosphere coupling is still highly uncertain, which is why a large amount of observational evidence is both necessary and important [16,32,33,34,35,36]. For our case study, we consider the Hunga Ha’apai volcanic eruption in Tonga (20.536°S, 175.382°W), which is one of the strongest volcanic eruptions in recent years with a start date of 20 December 2021, universal time (UT) [37,38]. This is an important example for investigating the characteristics and physical mechanisms of volcano-ionosphere coupling, with important research significance [29,37,38,39,40,41,42,43,44,45,46,47,48,49].
Hunga Ha’apai’s last violent eruption was in 1100 A.D., indicating a possible cycle of about a thousand years for violent eruptions [40,42]. On December 20, 2021, its eruption column reached 16 km, and two existing volcanic islands (Hunga Tonga and Hunga Ha’apai) that were once separated are now joined together [42,46]. Furthermore, a violent eruption occurred again around 04:00 UT on 15 January 2022, accompanied by a strong explosion and a large number of lightning strokes (about 5000–6000 times a minute) [42]. The eruption emitted about 400,000 tons of sulfur dioxide and ruined the previously expanded volcanic island by extending into the sea [45,46]. In addition, several other large eruptions were recorded on 23 December 2021, and 13 and 14 January 2022. The eruption column reached an altitude of more than 40 km and a diameter of 440 km, while the top umbra cloud reached a maximum diameter of 500 km during the eruption on 15 January 2022 [42,46]. The eruption on 15 January 2022 is the largest outbreak recorded in this cycle [42,46]. Current analysis suggests that it has a Volcanic Explosivity Index (VEI) of 5 or 6 or even higher, similar to the type of Surtseyan or Plinian eruptions [42,45].
In this paper, we investigate the effect of the Tonga volcano eruption on the plasma drift in the ionosphere. The plasma drift data are analyzed in three directions: longitudinal, latitudinal, and vertical, based on the observations at Fuke, Hainan station (19.310°N, 109.080°E) from the Meridian Project. By identifying the correlation between anomalous drift velocity and eruption event, the possible coupling between volcanic eruption and plasma drift is discussed. Our results could possibly contribute to the further study of the global ionospheric dynamics mechanism.

2. Materials and Methods

The ionospheric sounding is an important way for understanding the morphological characteristics, structure, and disturbances of the ionosphere [50]. At present, the detection methods can be divided into two main categories, i.e., space-based detection and ground-based detection [51]. The space-based method can detect ion concentration distributions above the F2 layer [52]. The mass spectrometer can obtain important information such as the velocity distribution, mass spectrum, and energy spectrum of ionospheric particles [53]. The ground-based detection can be achieved by incoherent scatter radar (ISR), very high-frequency (VHF) coherent scatter radar, ionosonde, and GPS receiving stations [54].
The ionospheric plasma drift can be measured in several ways [54]. For example, the averaged plasma velocity can be observed by the Langmuir probe carried by the space-based observing platform [52]. The irregular drift velocity is calculated from the ground-based received GPS signal after ionospheric scintillation through a three-point GPS observation system [55]. Furthermore, the plasma drift velocity can be calculated by the scattering radar time delay echo analysis [17].
The plasma drift data used in this study come from the ionosonde at Fuke station of the Chinese Meridian Project. The ionosonde of the DPS-4 type in Fuke can detect the structure and dynamic characteristics of the ionosphere through parameters such as phase shift and time delay of the received echo [56]. The drift velocity mode is based on the Doppler frequency shift and phase shift of the echoes the Drift Data Analysis (DDA) processing can obtain the distribution map of the plasma reflection region and, finally, the three-dimensional velocity of the plasma motion without interruption [57]. The calculation method is described below.
The Doppler shift is equal to:
Δ f = 2 v l o s λ ,
where v l o s is the drift velocity, and λ is the wavelength of the emitted pulse wave [58].
Furthermore, the drift velocity can be written as:
v l o s = Δ f λ 2 .
According to Chapman’s law, the ionosphere can be divided into D, E, and F layers through ionization characteristics [58]. The ionospheric plasma can reflect electromagnetic waves of the corresponding response frequency, so each reflection zone is used as a wave source for an independent vector wavenumber [57]. Since the distance between the receiving antennas is much smaller than the distance from the ionosphere to the antenna, the reflected wave is approximated as a plane wave, i.e., the incident angle on all receiving antennas is considered to be the same [17].
For a wave number K for the electromagnetic that echo arrives at the receiving antenna, the phase is
α a = K · r a ,
where a and r a are the ath receiving antenna and its position relative to the first antenna [56].
The phase difference between the two receiving antennas is
α a b = α b α a = K · r b r a .
The DPS-4 ionosonde has four receiving antennas (as shown in Figure 1). The direction of the echo, i.e., azimuth and zenith angle, can be obtained by the least squares method, which is given by
ϵ 2 = j = 1 N 1 i = j + 1 N 1 K r i r j φ i φ j 2 6 ,
where N is the number of receiving antennas [56].
Assuming that the top ionosphere above the observation point has an overall and uniform velocity of motion, then for all reflection points that produce echoes, there are [53]:
ϵ 2 = ( v s , l o s 2 ( v x s i n θ c o s φ + v y s i n θ s i n φ + v z c o s φ ) ) 2 .
Thus, the overall three-dimensional motion velocity V v x , v y , v z can be calculated. Here, v x is the north-south (meridional) drift velocity, with northward positive; v y is east-west (latitudinal) drift velocity, with eastward positive; and v z is the vertical drift velocity, with upward positive [53].

3. Observations and Results

On 15 January 2022, a violent eruption occurred at 04:15 UT on Hunga Ha’apai Island in the Kingdom of Tonga, a South Pacific country. The powerful underwater eruption generated tsunami waves that were transmitted to the atmosphere as well [59]. The eruption process was accompanied by a large number of lightning strikes [44], and the outbreak produced acoustic shock waves sufficient to disturb the ionosphere [60]. Some researchers believed that its eruption VEI index was 5–6 or even higher, not unlike a Surtseyan or Plinian type of extreme volcanic eruption [48,61]. After the eruption, the meteorological satellite [59], the Global Navigation Satellite System (GNSS) stations [60], the superDARN radar [49], and the ionosonde received continuous abnormal signals. Images collected by the Atmospheric Infrared Sounder (AIRS) satellite several hours after the main eruption revealed puzzling atmospheric ripples and dispersion circles [59]. The observations of superDARN radar indicated that the eruption caused oscillations in the ionosphere of the northern hemisphere [49].
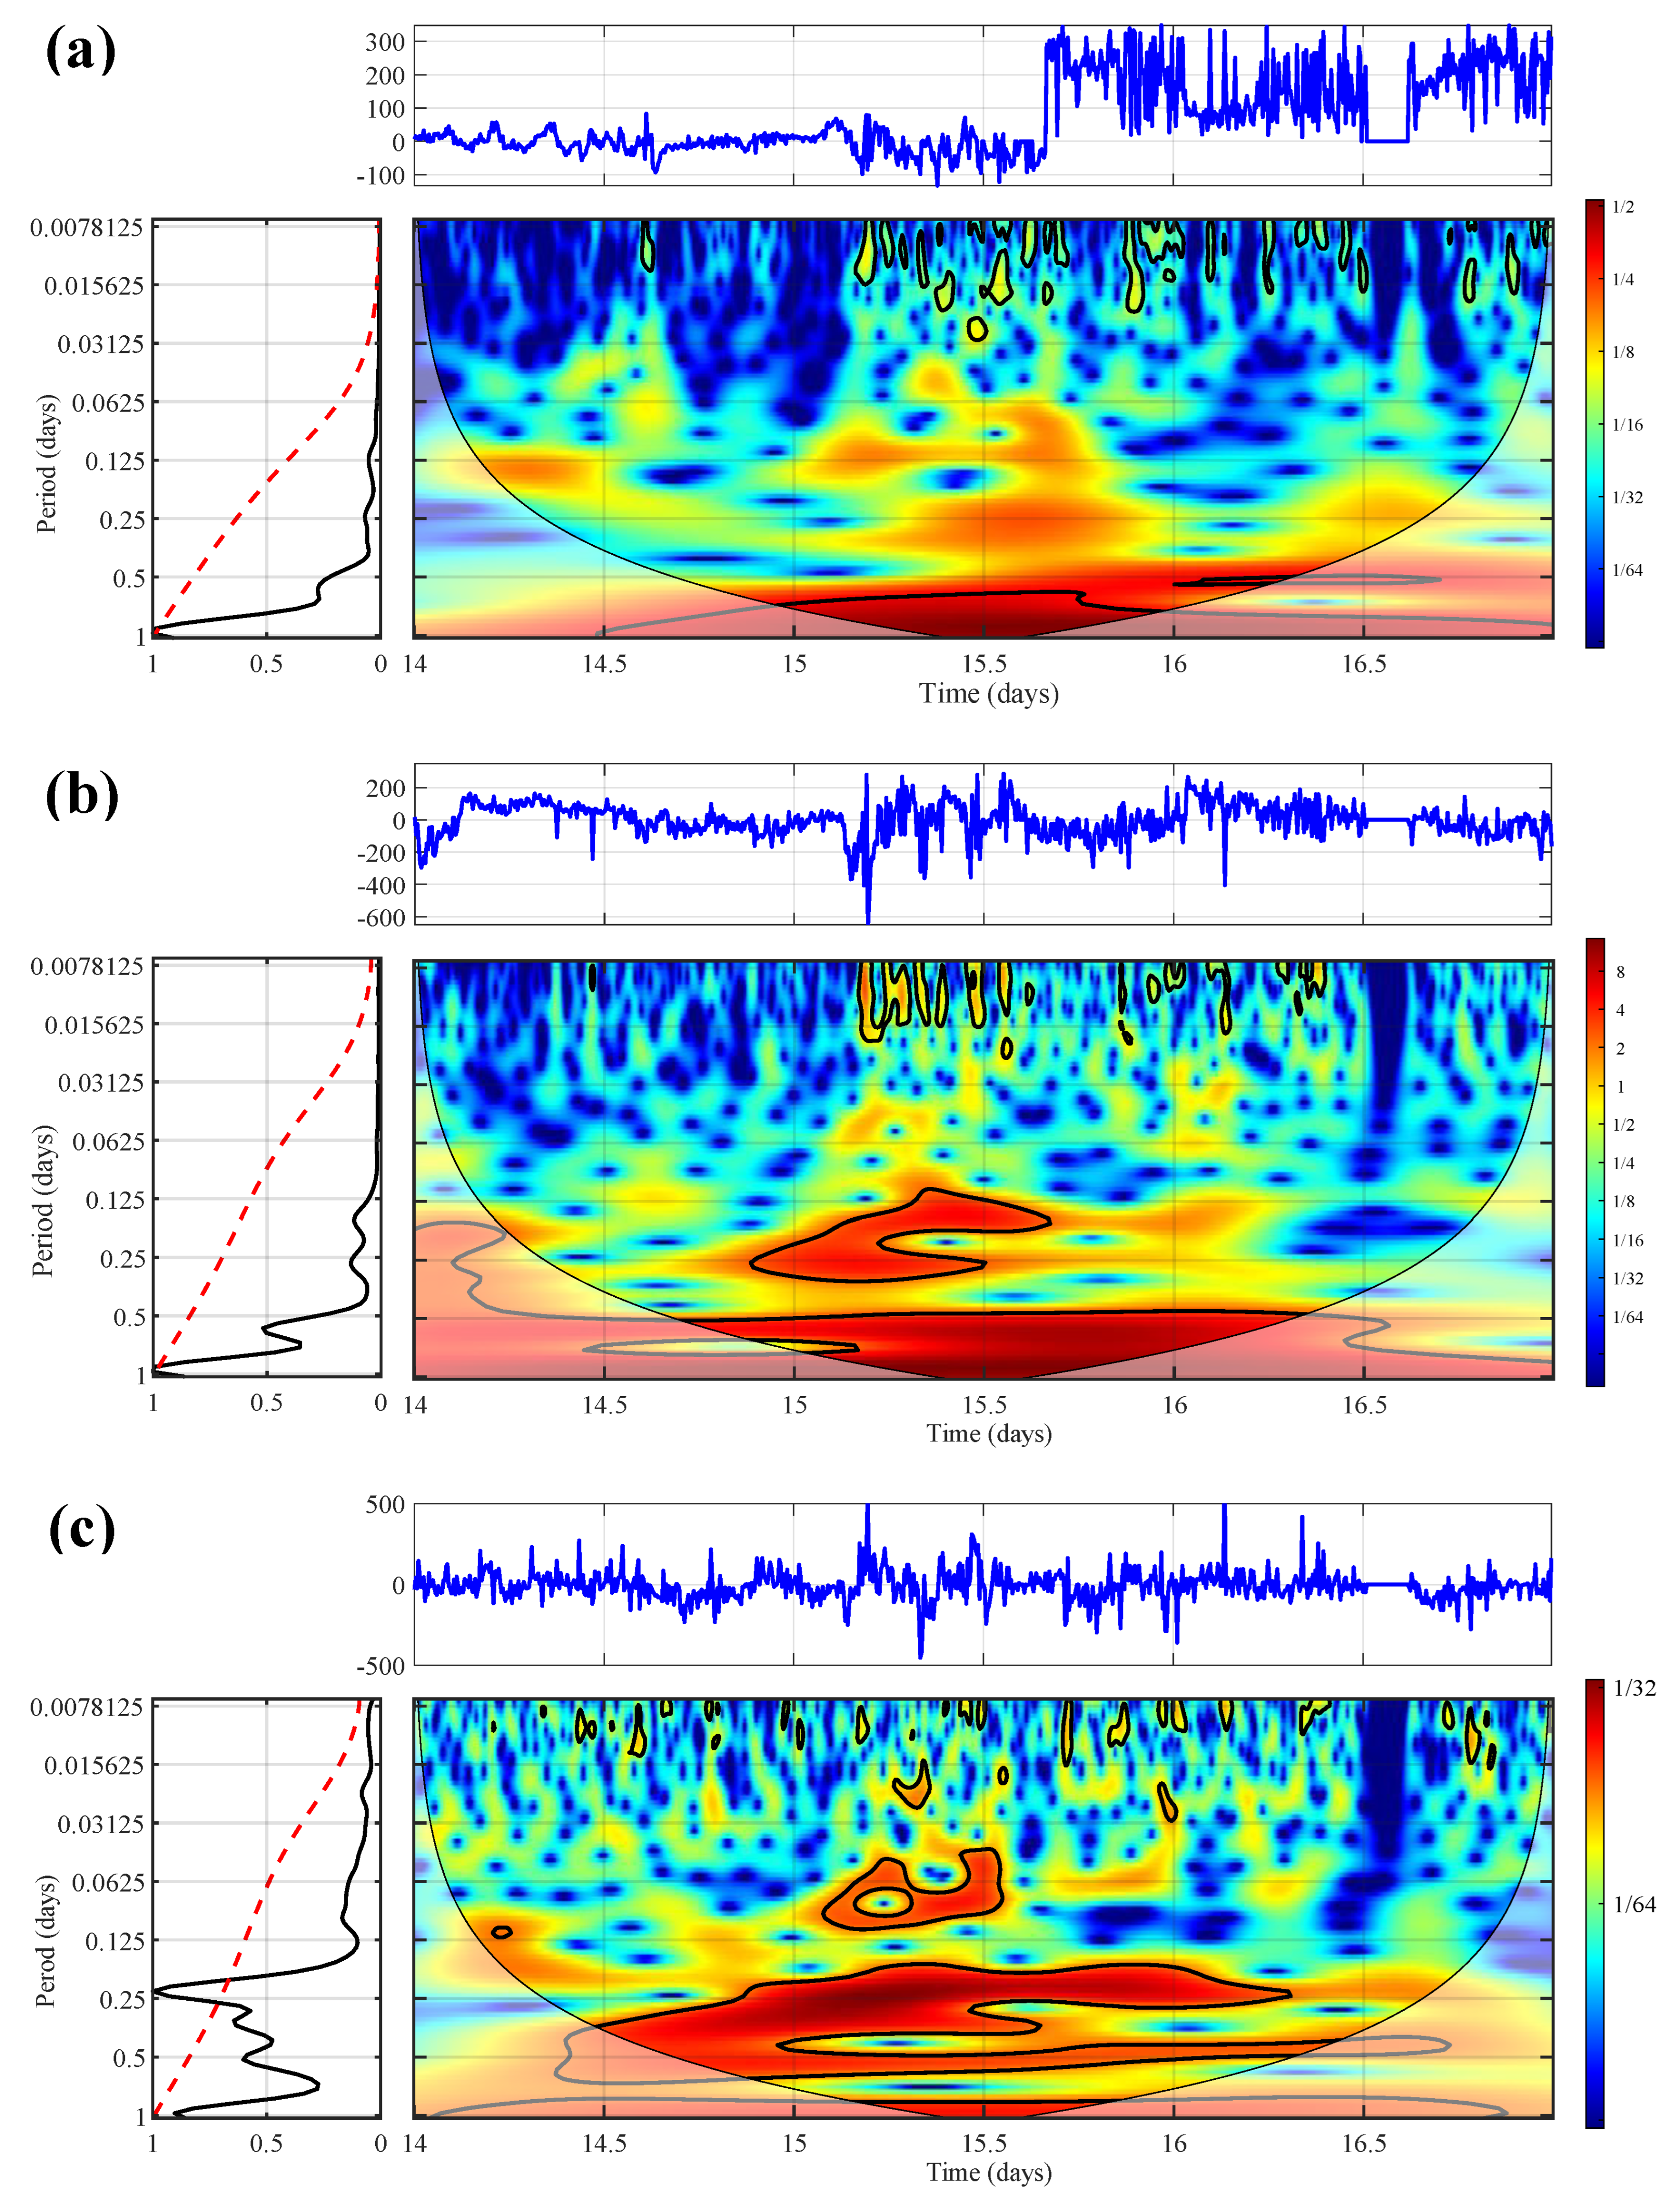
Therefore, the study based on the Meridian Project can help understand the mechanism of the impact of the volcanic eruption on the global ionosphere. Figure 2 shows the plasma drift velocity curves in three directions. The red curves represent the background drift velocity distributions averaged from 14 to 16 January (the background drift velocity profile for day i is obtained by averaging the drift velocity values for the same moments within days i − 1, i, and i + 1).
The blue lines are the time series of the drift velocity from 14 to 16 January. It can be found that before the main eruption, the drift velocity curves in the three directions on 14 January were basically consistent with the trend of the three-day velocity mean curve. Before 13: 00 UT on 15 January, the plasma drift velocities in the three directions were still consistent with the background profile, with no significant anomaly appearing.
However, the vertical drift velocity (Figure 2a) showed anomalies from 13:27 UT to 17:02 UT on 15 January. The drift velocity observations revealed a noticeable upward increase relative to the background profile. The maximum increase in drift velocity exceeds 300 m/s. And the vertical drift velocity indicated a series of large-scale anomalous fluctuations during this period.
The zonal velocity curve showed the occurrence of velocity fluctuation and velocity reversal from 14:17 UT to 16:47 UT on 15 January (Figure 2b). Relative to the background, the zonal drift velocity westward can reach a maximum value of about 80 m/s.
The meridional anomalies occurred at 13:47 UT on 15 January, and there were significant fluctuations in the rising phase of the background profile (Figure 2c). Thereafter, until 16:52 UT, the meridional drift velocity was above background values.
Overall, after processing the low-latitude ionospheric plasma drift velocity curves during the 3 days before and after the eruption, it was found that the anomalous change in drift velocity in three directions only occurred after 13:00 UT on January 15. Furthermore, as shown in Figure 2a–c, the anomalous direction of the drift velocity is in the same direction as the direction of the Tonga volcano pointing vector toward Fuke Station. A series of oscillations are generated after the anomalies and slowly recover to the background profile by 16 January. From the plasma velocity curves on 16 January, it can be seen that the anomalies slowly recover to “normal” or background levels.

4. Discussion

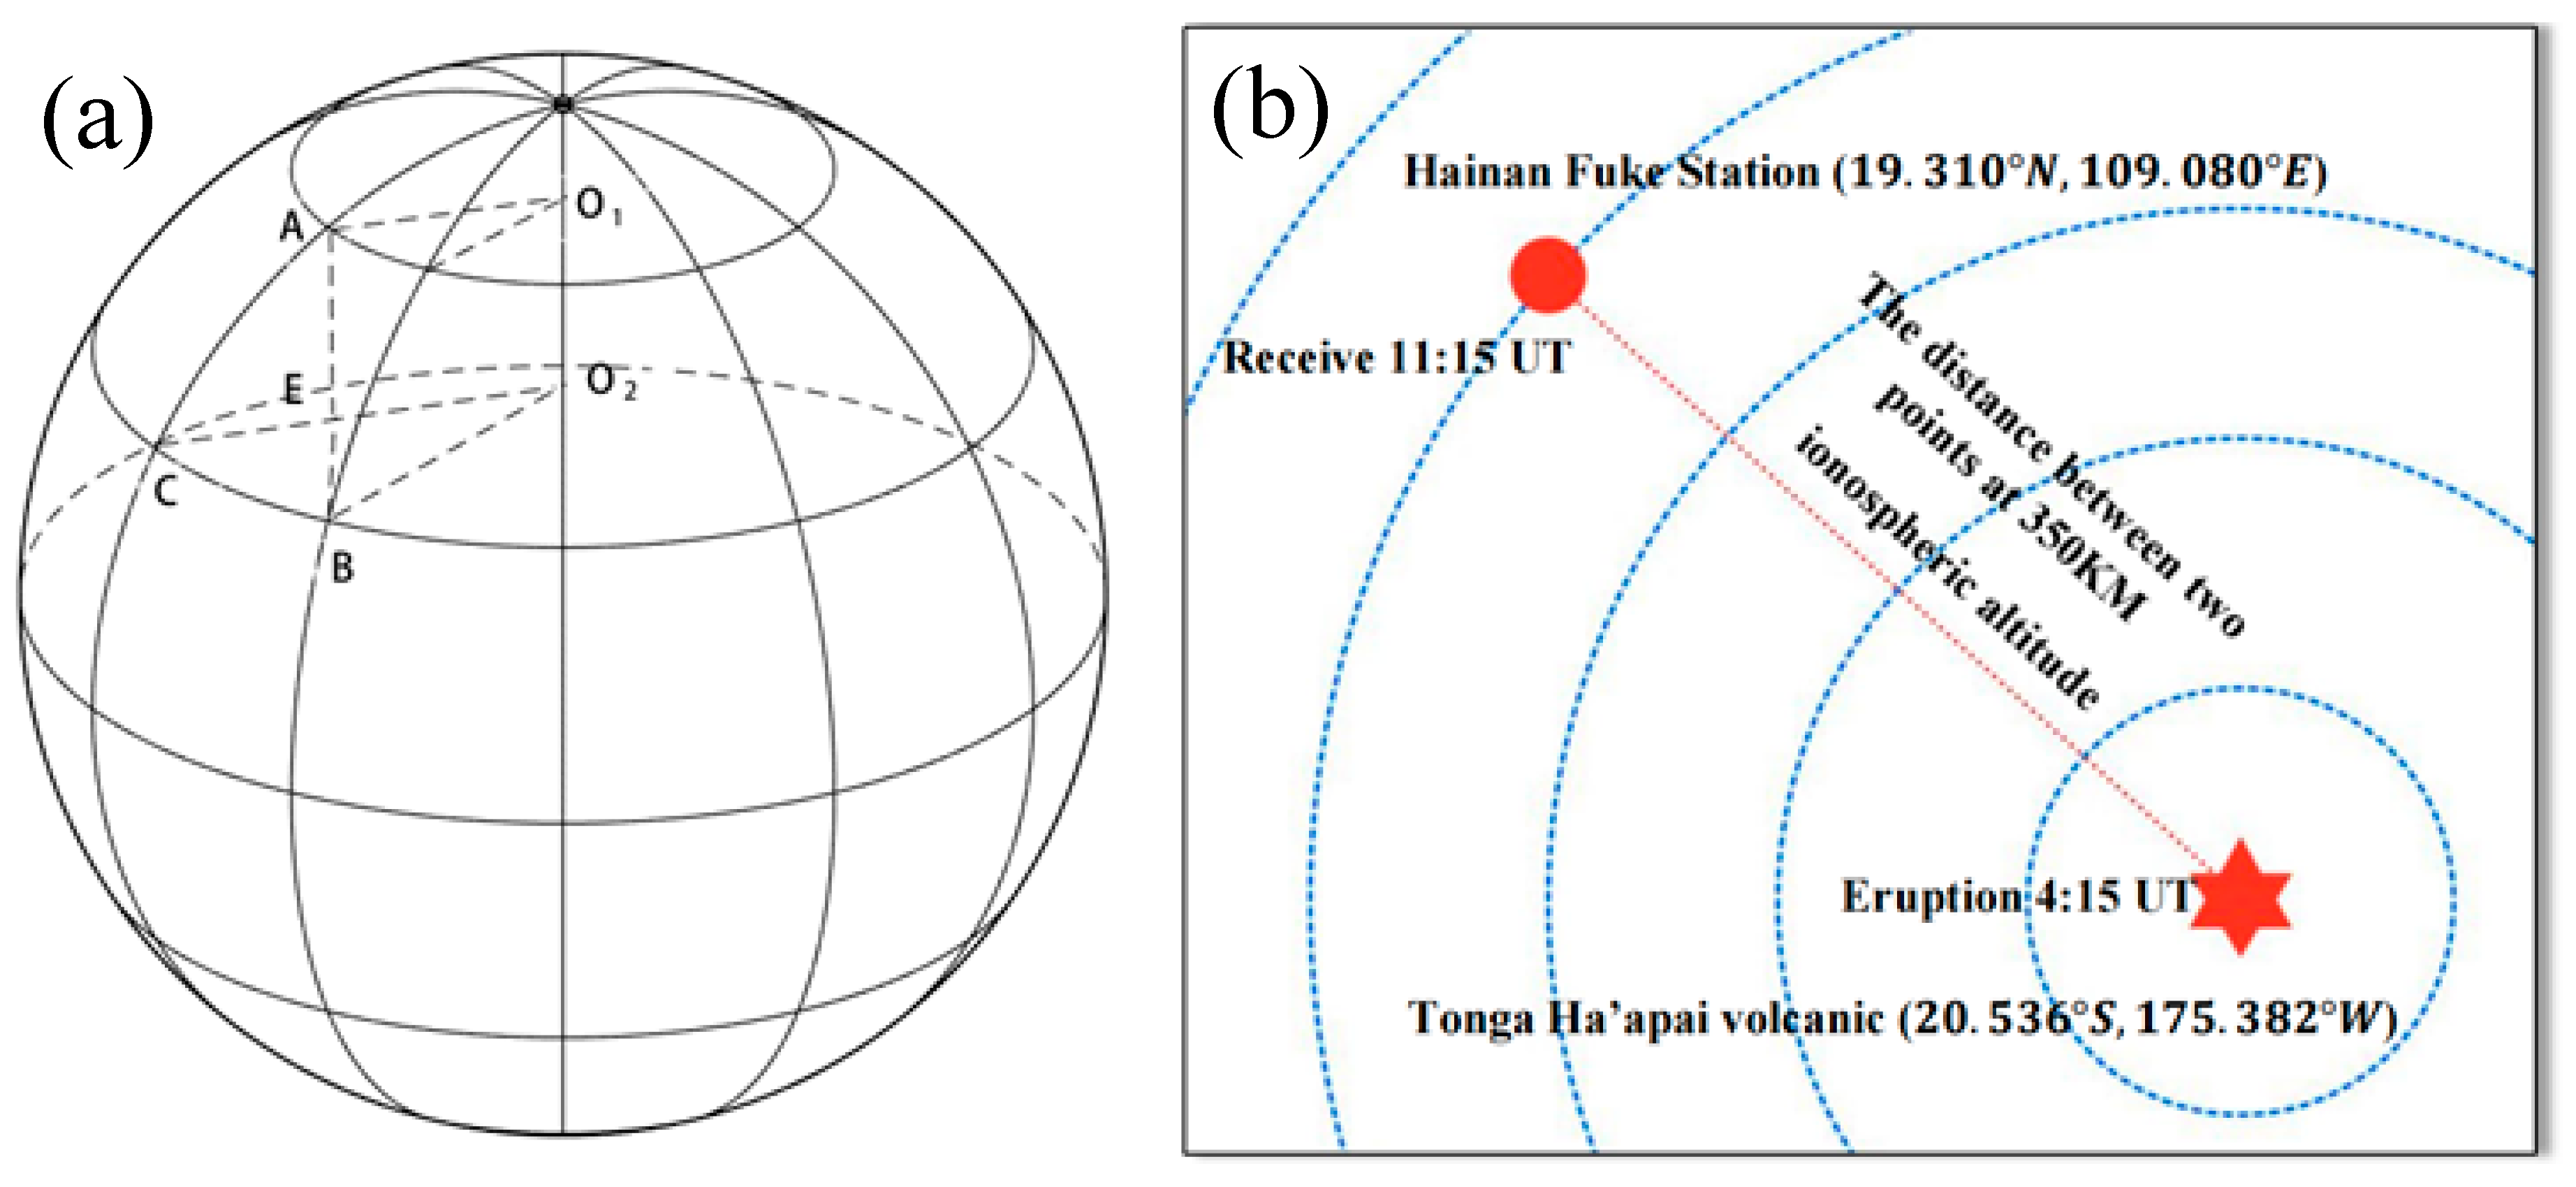
The correlation between the anomalous drift velocity and the volcanic eruption can be further illustrated by calculating the propagation velocity compared with the actual drift speed. It is first assumed that the anomaly is caused by the fluctuations of the volcanic eruption in the ionosphere. According to the time of the anomaly occurrence, which is at about 11:15 UT, combined with the main eruption at 04:15 UT, the time difference between the eruption and the anomaly is about 7 h. The spherical distance between two points of different diameters in the spherical model is calculated as the length of the inferior arc of the great circle passing through these two points, based on the distance of the high-altitude arc between the measuring station and the eruption location of Tonga. Suppose the longitudes and latitudes of the excitation source and reception points on the sphere are A α 1 , β 1 and B α 2 , β 2 , respectively, where α 1 and α 2 are the longitudes of the two points; β 1 and β 2 are the latitudes, and R is the radius of the sphere. As shown in Figure 3a, the arc distance between two points of the spherical model can be written as:
L = R θ = R · arccos cos α 1 α 2 cos β 1 cos β 2 + sin β 1 sin β 2 .
The latitude and longitude of Fuke station are 19.310°N, 109.080°E, and the geographic coordinates of the volcanic eruption of Tonga are 20.536°S, 175.382°W. According to the latitude and longitude, the distance could be calculated using the spherical model. Furthermore, the arc distance between the volcanic eruption point and Fuke Station is calculated to be about 9858 km at an altitude of about 350 km. The average drift velocity of the anomaly should be about 287 m/s, according to the final calculation results and the time difference between the eruption and the anomalous event.
The statistical results shown in Table 1 are the plasma drift observations from the ionosonde at Fuke station. Based on the plasma drift velocities in each direction during the time period corresponding to the appearance of the anomalies, the drift velocity V v x , v y , v z is calculated to be around 327 m/s. Thus, the modeled velocity (e.g., 287 m/s) is consistent with the observed result.
Furthermore, this study conducted wavelet analysis (as depicted in Figure 4) on the time series data to examine the periodic characteristics of the ionospheric response to the volcanic eruption.
The results of the wavelet analysis on the vertical (as depicted in Figure 4a) and zonal (as depicted in Figure 4b) drift velocities reveal that prior to 15 January, on 4:30 UT, the spectral power of periods shorter than 0.03125 days is relatively low. However, after 4:30 UT, a significant increase in the power spectrum of these shorter periods is observed. This power spectral enhancement coincides with the timing of the volcanic eruption. In the longer period range, the power of vertical drift velocity with a period of approximately 0.125 days starts to increase on 15 January, 0:00 UT. The enhancement in zonal velocity spectral power, spanning a period of 0.125–0.25 days, occurs slightly earlier, around 14 January, 22:00 UT. Furthermore, there is a notable amplification in meridional velocity spectral power (as depicted in Figure 4c) with a period of about 0.0625–0.125 days, beginning at approximately January 15, 2:30 UT.
Interestingly, the enhancement of power spectra in the 0.0625–0.25-day period range occurs earlier than those with periods less than 0.0325 days. This observation suggests a potential energy accumulation process prior to the volcanic eruption.
In addition, previous research showed considerable atmospheric ripples were caused by the eruption, as seen in images collected by the Atmospheric Infrared Sounder (AIRS) on the Aqua satellite in the hours following the eruption of Tonga [59]. Each concentric circle represented a rapidly moving atmospheric gravity wave in the atmosphere, accompanied by upward and downward transmitted energy [19]. Based on the GNSS receiving network over New Zealand, Australia, and Japan, the Lamb waves over Japan were imaged [44]. Combined with the observations in Australia and Japan during 08:00 UT and 10:00 UT on 15 January, the horizontal phase velocities of direct and conjugate concentric traveling ionosphere disturbances (CTIDs) were calculated to be 320–390 m/s [35]. The sound velocity was calculated to be about 340 m/s close to the ground, arriving in Japan after 6 h [35]. Therefore, the anomalous drift velocity recorded at Fuke station is close to the results of previous studies, consistent with the range of gravity wave velocities. These results indicate that the plasma drift velocity could be affected by the disturbance of gravity waves from the lower atmosphere.
On the other hand, in the study of the low-latitude ionosphere, it was found that the plasma drift velocity will attenuate due to the drag effect of the background zonal wind on the plasma. The plasma drift velocity is overall modulated by the particle collision frequency, the cyclotron frequency, and the latitudinal wind component perpendicular to the magnetic line [62]. The electric field causing the plasma drift during a quasi-magnetostatic day comes from the E region [58]. Since the collision frequency in the E region is large enough during the daytime, the zonal wind cutting the magnetic field lines can cause a strong tidal electric field perpendicular to the geomagnetic field [62]. At night, the zonal wind in the F region will cut the magnetic field line and generate a polarized electric field to drive the plasma motion. The fitting shows that the zonal plasma drift velocity is mainly caused by the electric drift caused by the vertical electric field and the night polarization electric field [63]. The meridional plasma drift velocity is affected by the zonal neutral wind. The vertical plasma drift velocity is affected by the atmospheric electric field for the season.
In summary, the fitting results show that the zonal plasma drift velocity is mainly controlled by the electric drift caused by the nighttime vertical and polarized electric fields [8,64,65,66]. The meridional plasma drift velocity is influenced by the zonal neutral wind [64]. The vertical plasma drift velocity is affected by the seasonal atmospheric electric field [64]. Therefore, it is shown that the plasma drift will not only be dragged by the neutral wind but also by electromagnetic force. During the volcanic eruption, various hot materials in the interior are ejected outward, and visible volcanic ash is ejected to several kilometers of height, which is far below the ionosphere [64]. However, the volcanic eruption can bring out a large amount of charged particles. The directional movement of volcanic ash cuts the magnetic lines, generating a polarized electric field that could possibly penetrate to higher altitudes [8,64,66]. Under the effect of its short time and rapidly established polarized electric field, the described mechanisms may have some influence on the plasma in the ionosphere [8,64,65,66].
It is noteworthy that the volcanic eruption also coincided with a small magnetic storm. The Dst index began to drop to −94 nT at 23:00 UT on 14 January [44]. However, it was found that the interplanetary magnetic field at z direction (IMF-Bz) deflected southward after 18:00 UT and gradually reached −18 nT at 22:30 UT [44]. The solar wind speed was just 350–380 km/s, and the particle density changed slightly, indicating a limited influence of this magnetic storm [44].

5. Conclusions

The mechanisms of volcanic eruption and ionospheric coupling are crucial to the study of ionospheric dynamics. On 15 January 2022, the Hunga Ha’apai volcano eruption (20.536°S, 175.382°W in Tonga) reached its maximum outbreak. In this paper, the plasma drift observations of DPS-4 ionosonde at Fuke station (19.310°N, 109.080°E) from January 14 to 16 are analyzed. The response of the low-latitude ionosphere to the eruption of Tonga volcano is detailed. It is found that the plasma drift velocity in the three directions on the day before the eruption is consistent with the background mean curve. While the plasma drift vertical velocity on 15 January at 13:27 UT, the latitudinal and longitudinal directions at around 14:00 UT all show anomalies in plasma drift velocity with different scales. The drift velocities in the three directions after the anomalous event appear to fluctuate significantly, accompanied by abnormal velocity inversions. We assume that the detected anomalous event was caused by the volcanic eruption. According to the distance between the volcanic eruption foot-point and the receiving station, combined with the time difference between the abnormal event and the eruption moment, the average velocity of the plasma drift is calculated. Comparing the observed plasma drift velocity with the modeled anomalous velocity further confirms the correlation between the ionospheric plasma drift anomaly and the volcanic eruption.

Author Contributions

S.Q. conceived this study and wrote this manuscript. M.S. performed data analysis and prepared Figure 1 and Table 1. X.W. prepared Figure 2. Z.Z. prepared Figure 3. W.S. was in charge of the organization and English polishing of the whole manuscript. V.M.V.H. prepared Figure 4. All authors have read and agreed to the published version of the manuscript.

Funding

This research was funded by the National Natural Science Foundation of China, grant number 41974178, and the Fundamental Research Funds for the Central Universities, CHD, grant number 300102263205.

Data Availability Statement

The plasma drift observations are available from the Chinese Meridian Project database (http://meridianproject.ac.cn/, accessed on 8 August 2023).

Acknowledgments

This work is supported by the National Natural Science Foundation of China (NO. 41974178). We acknowledge the Chinese Meridian Project for the ground observation data of ionospheric plasma drift.

Conflicts of Interest

The authors declare that the research was conducted in the absence of any commercial or financial relationships that could be construed as a potential conflict of interest.

References

  1. Bittencourt, J.A. Fundamentals of Plasma Physics; Springer Science & Business Media: Berlin/Heidelberg, Germany, 2004; Volume 38. [Google Scholar]
  2. Lysak, R.L. Introduction to Space Physics. Eos Trans. Am. Geophys. Union 1995, 49, 57–58. [Google Scholar] [CrossRef]
  3. Zhang, R.L.; Liu, L.B.; Chen, Y.D.; Hui, J. The dawn enhancement of the equatorial ionospheric vertical plasma drift. J. Geophys. Res. Space Phys. 2015, 120, 10688–10697. [Google Scholar] [CrossRef]
  4. Kremeyer, K.; Nazarenko, S.; Newell, A. The role of vorticity in shock propagation through inhomogeneous media. In Proceedings of the 37th Aerospace Sciences Meeting and Exhibit, Reno, NV, USA, 11–14 January 1999. [Google Scholar]
  5. Hong, Y.; Wang, G.J.; Shi, J.K.; Wang, X.; Cheng, W.Z.; Wang, Z.; Shang, S.P. Response of ionospheric plasma drift to geomagnetic activity at low latitudes (Hainan). J. Space Sci. 2019, 39, 8. [Google Scholar] [CrossRef]
  6. Chao-Song Huang, J.C.; Foster, J.; Holt, J. Westward plasma drift in the midlatitude ionospheric F region in the midnight-dawn sector. Pract. Stat. Med. Res. 2001, 106, 30349–30362. [Google Scholar]
  7. Liu, L.B.; Wan, W.X. Recent ionospheric investigations in China (2018–2019). Earth Planet. Phys. 2020, 4, 179–205. [Google Scholar] [CrossRef]
  8. Cai, J.T.; Zhao, G.Z.; Zhan, Y.; Tang, J.; Chen, X.B. Study of ionospheric disturbance phenomena during earthquakes. Prog. Geophys. 2007, 22, 695–701. [Google Scholar]
  9. Eccles, J.V.; Stmaurice, J.; Schunk, R.W. Reviewing the Mechanisms Underlying the Pre-reversal Enhancement of the Vertical Plasma Drift in the Low Latitude Ionosphere. AGU Fall Meet. Abstr. 2011, 120, 4950–4970. [Google Scholar]
  10. Farley, D.T.; Bonelli, E.; Fejer, B.G.; Larsen, M.F. The prereversal enhancement of the zonal electric field in the equatorial ionosphere. J. Geophys. Res. Atmos. 1986, 91, 13723–13728. [Google Scholar] [CrossRef]
  11. Navarro, L.A.; Fejer, B.G. Storm-time coupling of equatorial nighttime F-region neutral winds and plasma drifts. J. Geophys. Res. Space Phys. 2020, 125, 2169–9380. [Google Scholar] [CrossRef]
  12. Huang, C.-S.; de La Beaujardiere, O.; Pfaff, R.F.; Retterer, J.M.; Roddy, P.A.; Hunton, D.E.; Su, Y.-J.; Su, S.-Y.; Rich, F.J. Zonal drift of plasma particles inside equatorial plasma bubbles and its relation to the zonal drift of the bubble structure. J. Geophys. Res. Space Phys. 2010, 115, A7. [Google Scholar] [CrossRef]
  13. Fejer, B.G.; Olson, M.E.; Chau, J.L.; Stolle, C.; Lühr, H.; Goncharenko, L.P.; Yumoto, K.; Nagatsuma, T. Lunar-dependent equatorial ionospheric electrodynamic effects during sudden stratospheric warmings. J. Geophys. Res. Space Phys. 2010, 115, A00G03. [Google Scholar] [CrossRef]
  14. Li, J.Y. Study of Seismic Ionospheric TEC Anomalies Using GPS Data; Institute of Earthquake Prediction, China Earthquake Administration: Beijing, China, 2010.
  15. Hayakawa, M.; Kasahara, Y.; Nakamura, T.; Muto, F.; Horie, T.; Maekawa, S.; Hobara, Y.; Rozhnoi, A.A.; Solovieva, M.; Molchanov, O.A. A statistical study on the correlation between lower ionospheric perturbations as seen by subionospheric VLF/LF propagation and earthquakes. J. Geophys. Res. Space Phys. 2010, 115. [Google Scholar] [CrossRef]
  16. Pulinets, S.A.; Bondur, V.G.; Tsidilina, M.N.; Gaponova, M.V. Verification of the concept of seismoionospheric coupling under quiet heliogeomagnetic conditions, using the Wenchuan (China) earthquake of May 12, 2008, as an example. Geomagn. Aeron. 2010, 50, 231–242. [Google Scholar] [CrossRef]
  17. Zhang, X.M.; Shen, X.H.; Zhao, S.F.; Liu, J.; Ouyang, X.Y.; Lou, W.Y. Research progress of seismic ionospheric sounding technology and its application. J. Seismol. 2016, 38, 20. [Google Scholar]
  18. Liu, J.Y.; Liu, L. A statistical analysis of ionospheric anomalies before 736 M6.0+ earthquakes during 2002–2010. J. Geophys. Res. 2011, 116, A02303. [Google Scholar] [CrossRef]
  19. Aoyama, T.; Iyemori, T.; Nakanishi, K.; Nishioka, M.; Rosales, D.; Veliz, O.; Safor, E.V. Localized field-aligned currents and 4-min TEC and ground magnetic oscillations during the 2015 eruption of Chile’s Calbuco volcano. Earth Planets Space 2016, 68, 148. [Google Scholar] [CrossRef]
  20. Cahyadi, M.N.; Handoko, E.Y.; Rahayu, R.W.; Heki, K. Comparison of volcanic explosions in Japan using impulsive ionospheric disturbances. Earth Planets Space 2021, 73, 228. [Google Scholar] [CrossRef]
  21. Cahyadi, M.N.; Rahayu, R.W.; Heki, K.; Nakashima, Y. Harmonic ionospheric oscillation by the 2010 eruption of the Merapi volcano, Indonesia, and the relevance of its amplitude to the mass eruption rate. J. Volcanol. Geotherm. Res. 2020, 405, 107047. [Google Scholar] [CrossRef]
  22. Heki, K.; Fujimoto, T. Atmospheric modes excited by the 2021 August eruption of the Fukutoku-Okanoba volcano, Izu–Bonin Arc, observed as harmonic TEC oscillations by QZSS. Earth Planets Space 2022, 74, 112. [Google Scholar] [CrossRef]
  23. Li, W.; Guo, J.; Yue, J.; Shen, Y.; Yang, Y. Total electron content anomalies associated with global VEI4 + volcanic eruptions during 2002–2015. J. Volcanol. Geotherm. Res. 2016, 325, 98–109. [Google Scholar] [CrossRef]
  24. Lin, J.W. Ionospheric Anomaly due to the volcanic eruption in Colima, Mexico, 06 January 2013: Two-Dimensional Principal Component Analysis. Eur. J. Remote Sens. 2017, 46, 689–698. [Google Scholar] [CrossRef]
  25. Liu, X.; Zhang, Q.; Shah, M.; Hong, Z. Atmospheric-ionospheric disturbances following the April 2015 Calbuco volcano from GPS and OMI observations. Adv. Space Res. 2017, 60, 2836–2846. [Google Scholar] [CrossRef]
  26. Maletckii, B.; Astafyeva, E. Near-Real-Time Analysis of the Ionospheric Response to the 15 January 2022 Hunga Tonga-Hunga Ha’apai Volcanic Eruption. J. Geophys. Res. Space Phys. 2022, 127, e2022JA030735. [Google Scholar] [CrossRef]
  27. Manta, F.; Occhipinti, G.; Hill, E.M.; Perttu, A.; Assink, J.; Taisne, B. Correlation Between GNSS-TEC and Eruption Magnitude Supports the Use of Ionospheric Sensing to Complement Volcanic Hazard Assessment. J. Geophys. Res. Solid Earth 2021, 126, e2020JB020726. [Google Scholar] [CrossRef]
  28. Pandara, D.P.; Muslim, B.; Sunardi, B.; Ferdy; Pasau, G.; Mananohas, M.; Ango, C. Analysis of Ionosphere disturbance caused by the Lokon Volcano Eruption using GPS TEC data. IOP Conf. Ser. Mater. Sci. Eng. 2021, 1115, 012062. [Google Scholar] [CrossRef]
  29. Saito, S. Ionospheric disturbances observed over Japan following the eruption of Hunga Tonga-Hunga Ha’apai on 15 January 2022. Earth Planets Space 2022, 74, 57. [Google Scholar] [CrossRef]
  30. Toman, I.; Bri, D.; Kos, S. Contribution to the Research of the Effects of Etna Volcano Activity on the Features of the Ionospheric Total Electron Content Behaviour. Remote Sens. 2021, 13, 1006. [Google Scholar] [CrossRef]
  31. Zhang, S.-R.; Vierinen, J.; Aa, E.; Goncharenko, L.P.; Erickson, P.J.; Rideout, W.; Coster, A.J.; Spicher, A. 2022 Tonga Volcanic Eruption Induced Global Propagation of Ionospheric Disturbances via Lamb Waves. Front. Astron. Space Sci. 2022, 9, 871275. [Google Scholar] [CrossRef]
  32. Gokhberg MB, G.; Gershenzon, N.I.; Pilipenko, V.A. Electromagnetic effects during rupture of the Earth’s Crust. Phys. Solid Earth 1985, 21, 52–63. [Google Scholar]
  33. Lockner, D.A.; Johnston, M.J.S.; Byerlee, J.D. A mechanism to explain the generation of earthquake lights. Nature 1983, 302, 28–33. [Google Scholar] [CrossRef]
  34. Parrot, M.; Benoist, D.; Berthelier, J.; Błęcki, J.; Chapuis, Y.; Colin, F.; Elie, F.; Fergeau, P.; Lagoutte, D.; Lefeuvre, F.; et al. The magnetic field experiment IMSC and its data processing onboard DEMETER: Scientific objectives, description and first results. Planet. Space Sci. 2006, 54, 441–455. [Google Scholar] [CrossRef]
  35. Parrot, M.; Berthelier, J.J.; Lebreton, J.P.; Sauvaud, J.A.; Santolik, O.; Blecki, J. Examples of unusual ionospheric observations made by the DEMETER satellite over seismic regions. Phys. Chem. Earth Parts A/B/C 2006, 31, 486–495. [Google Scholar] [CrossRef]
  36. Zhang, X.M.; Liu, J.; Qian, J.D.; Shen, X.H.; Zhao, S.F. Ionospheric electromagnetic disturbance before Gaize earthquake with MS 6.9 Tibet. Earthquake 2008, 28, 14–22. [Google Scholar]
  37. Poli, P.; Shapiro, N.M. Rapid Characterization of Large Volcanic Eruptions: Measuring the Impulse of the Hunga Tonga Ha’apai Explosion from Teleseismic Waves. Geophys. Res. Lett. 2022, 49, e2022GL098123. [Google Scholar] [CrossRef]
  38. Robin, S.; Matoza David, F.; Jelle, D.; Alexandra, M.; David, N.; Keehoon, K. Atmospheric waves and global seismoacoustic observations of the January 2022 Hunga eruption, Tonga. Science 2022, 377, 95–100. [Google Scholar]
  39. Amores, A.; Monserrat, S.; Marcos, M.; Argüeso, D.; Villalonga, J.; Jordà, G.; Gomis, D. Numerical Simulation of Atmospheric Lamb Waves Generated by the 2022 Hunga-Tonga Volcanic Eruption. Geophys. Res. Lett. 2022, 49, e2022GL098240. [Google Scholar] [CrossRef]
  40. Global Volcanism Program. Report on Hunga Tonga-Hunga Ha’apai (Tonga); Bennis, K.L., Venzke, E., Eds.; Bulletin of the Global Volcanism Network, 47:3; Smithsonian Institution: Washington, DC, USA, 2022. [Google Scholar] [CrossRef]
  41. IGS. About IGS. 2022. Available online: https://igs.org/about/ (accessed on 8 August 2023).
  42. INGV. La Grande Eruzione del Vulcano Hunga Tonga–Hunga Ha’apai. 2022. Available online: https://ingvvulcani.com/2022/01/17/grande-eruzione-vulcano-hunga-tonga-hunga-haapai/ (accessed on 8 August 2023).
  43. Kusky, T.M. Déjà vu: Might Future Eruptions of Hunga Tonga-Hunga Ha’apai Volcano be a Repeat of the Devastating Eruption of Santorini, Greece (1650 BC)? J. Earth Sci. 2022, 33, 229–235. [Google Scholar] [CrossRef]
  44. Lin, J.T.; Rajesh, P.K.; Lin CC, H.; Chou, M.Y.; Liu, J.Y.; Yue, J. Rapid Conjugate Appearance of the Giant Ionospheric Lamb Wave Signatures in the Northern Hemisphere After Hunga-Tonga Volcano Eruptions. Geophys. Res. Lett. 2022, 49, e2022GL098222. [Google Scholar] [CrossRef]
  45. NASA. Hunga Tonga-Hunga Ha‘apai Erupts. 2022. Available online: https://earthobservatory.nasa.gov/images/149347/hunga-tonga-hunga-haapai-erupts (accessed on 8 August 2023).
  46. NPR. NASA Scientists Estimate Tonga Blast at 10 Megatons. 2022. Available online: https://www.npr.org/2022/01/18/1073800454/nasa-scientists-estimate-tonga-blast-at-10-megatons (accessed on 8 August 2023).
  47. Tatsuya, K.; Tatsuhiko, S.; Kiwamu, N. Global fast-traveling tsunamis driven by atmospheric Lamb waves on the 2022 Tonga eruption. Science 2022, 377, 91–94. [Google Scholar]
  48. Wright, C.J.; Hindley, N.P.; Alexander, M.J.; Barlow, M.; Hoffmann, L.; Mitchell, C.N. Surface-to-space atmospheric waves from Hunga Tonga–Hunga Ha’apai eruption. Nature 2022, 609, 741–746. [Google Scholar] [CrossRef]
  49. Zhang, J.; Xu, J.; Wang, W.; Wang, G.; Ruohoniemi, J.M.; Shinbori, A.; Nishitani, N.; Wang, C.; Deng, X.; Lan, A.; et al. Oscillations of the Ionosphere Caused by the 2022 Tonga Volcanic Eruption Observed with SuperDARN Radars. Geophys. Res. Lett. 2022, 49, e2022GL100555. Available online: https://agupubs.onlinelibrary.wiley.com/doi/abs/10.1029/2022GL100555 (accessed on 8 August 2023). [CrossRef]
  50. Nagano, I.; Mambo, M.; Shimbo, T.; Kimura, I. Propagation characteristics in the earth-ionosphere waveguide for VLF waves emitted from trapping cones at high latitudes. Memoirs of National Institute of Polar Research. Spec. Issue 1987, 47, 183–191. [Google Scholar]
  51. Olwendo, J.; Cilliers, P.J.; Ming, O. Comparison of ground-based ionospheric scintillation observations with in situ electron density variations as measured by the Swarm satellites. Radio Sci. 2019, 54, 852–866. [Google Scholar] [CrossRef]
  52. Cheng, J.; Shi, J.K. Comparison of ionospheric detection methods. In Proceedings of the Twentieth Annual Meeting of the Chinese Geophysical Society, Xi’an, China, 16 October 2003. [Google Scholar]
  53. Wang, X.; Shi, J.K.; Wang, X. Ionospheric drift characteristics at low latitudes in China (Hainan). J. Radio Wave Sci. 2005, 20, 5. [Google Scholar]
  54. Astafyeva, E. Ionospheric detection of natural hazards. Rev. Geophys. 2019, 57, 1265–1288. [Google Scholar] [CrossRef]
  55. Kan, L.; Fang, Y.; Han, J.; Li, Y.; Yang, X. Design and validation of space-based GPS ionospheric sounding technology. In Proceedings of the China Satellite Navigation Academic Conference, Shanghai, China, 25 May 2017. [Google Scholar]
  56. Zhang, M.L.; Shi, J.K.; Wang, X.; Wu, S.Z.; Zhang, S.R. Comparative study of ionospheric characteristic parameters obtained by DPS-4 digisonde with IRI2000 for low latitude station in China. Adv. Space Res. 2004, 33, 869–873. [Google Scholar] [CrossRef]
  57. Wang, X. Study of Ionospheric Variability and Disturbance Characteristics in the Low-Latitude (Hainan) Region; Graduate School of Chinese Academy of Sciences (Center for Space Science and Applications Research): Beijing, China, 2004. [Google Scholar]
  58. Chapman, S. The absorption and dissociative or ionizing effect of monochromatic radiation in an atmosphere on a rotating earth. Proc. Phys. Soc. 1931, 43, 26–45. [Google Scholar] [CrossRef]
  59. Adam, D. Tonga Volcano Created Puzzling Atmospheric Ripples. Nature 2022, 602, 2022. [Google Scholar]
  60. Astafyeva, E.; Maletckii, B.; Mikesell, T.D.; Munaibari, E.; Ravanelli, M.; Coisson, P.; Manta, F.; Rolland, L. The 15 January 2022 Hunga Tonga Eruption History as Inferred from Ionospheric Observations. Geophys. Res. Lett. 2022, 49, e2022GL098827. [Google Scholar] [CrossRef]
  61. Lynett, P.; McCann, M.; Zhou, Z.; Renteria, W.; Borrero, J.; Greer, D.; Fa’anunu, O.; Bosserelle, C.; Jaffe, B.; La Selle, S.; et al. Diverse tsunamigenesis triggered by the Hunga Tonga-Hunga Ha’apai eruption. Nature 2022, 609, 728–733. [Google Scholar] [CrossRef]
  62. Balan, N.; Liu, L.B.; Le, H.J. A brief review of equatorial ionization anomaly and ionospheric irregularities. Earth Planet. Phys. 2018, 2, 257–275. [Google Scholar] [CrossRef]
  63. Liang, B.; Li, J.; Ma, S. Progress of ionospheric research in China. Chin. J. Geophys. 1994, 37 (Suppl. S1), 51–73. [Google Scholar]
  64. Hong, Y.; Wang, G.J.; Shi, J.K.; Wang, Z.; Wang, X. Comparative Study of Ionospheric Drift at Hainan Station during Different Solar Activity Years; China Electronics Society, Member of the National Natural Science Foundation of China, Xi’an University of Electronic Science and Technology: Xi’an, China, 2017. [Google Scholar]
  65. Liu, L.B.; Lei, J.H.; Liu, J. Ionospheric Investigations Conducted by Chinese Mainland Scientists in 2020–2021. Chin. J. Space Sci. 2022, 42, 653–683. [Google Scholar] [CrossRef]
  66. Wan, W.X.; Nin, B.Q.; Yuan, H. Observation of ionospheric disturbances with GPS beacons. Chin. J. Space Sci. 1998, 18, 247–252. [Google Scholar]
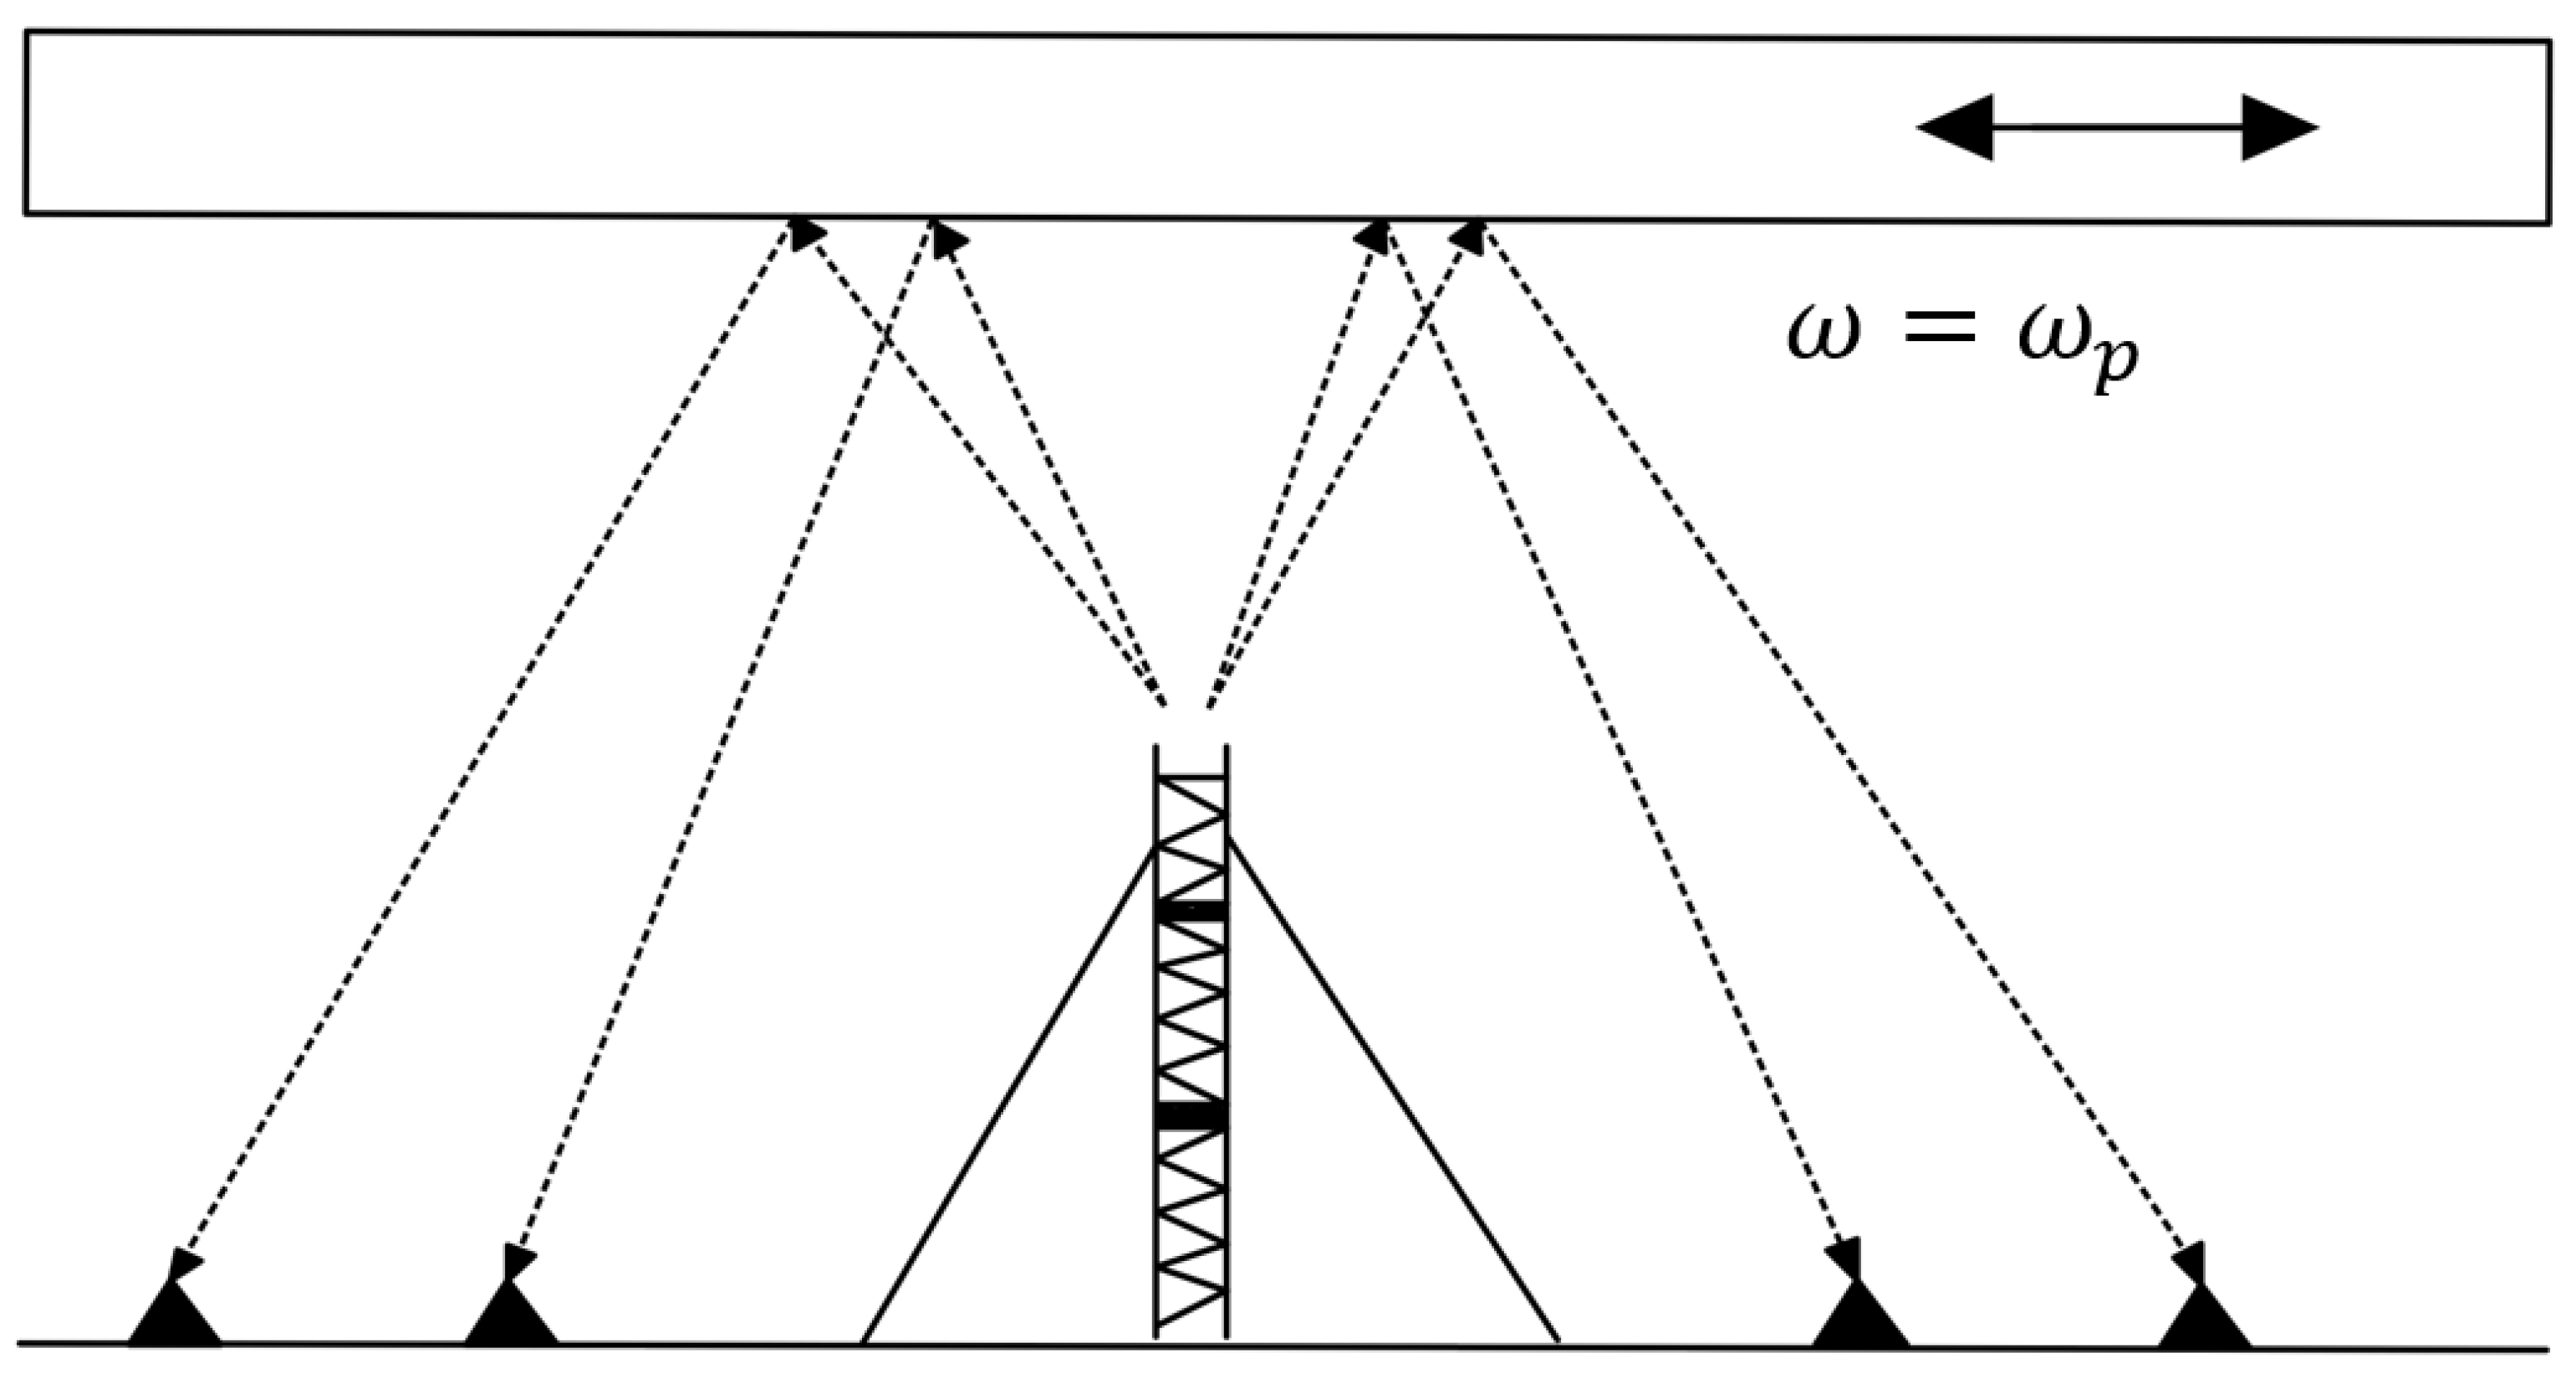
Figure 1. The measuring principle illustration for the DPS-4 ionosonde with four receiving antennas.
Remotesensing 15 04181 g001
Figure 2. (a) Vertical plasma drift velocity curves from 14 to 16 January 2022. (b) Zonal plasma drift velocity curves from 14 to 16 January. (c) Meridional plasma drift velocity curves from 14 to 16 January. The blue line is the velocity curve in the corresponding direction of the day, the black line corresponds to the data in Table 1, and the red line is the background velocity curve. All data were five-point smoothed.
Remotesensing 15 04181 g002
Figure 3. (a) The illustration of an ellipsoidal model of the Earth. (b) The distance and time of the anomaly propagation at 350 km altitude.
Remotesensing 15 04181 g003
Figure 4. Wavelet analysis results of (a) Vertical plasma drift velocity; (b) Zonal plasma drift velocity; (c) Meridional plasma drift velocity. The upper panel illustrates the observed signal, the left panel depicts the time-averaged global wavelet power, while the middle/central panel represents the time-frequency spectral power content with the outside zone of the cone of influence shaded.
Remotesensing 15 04181 g004
Table 1. Observations from the ionosonde in Fuke station during the period of anomalous drift velocity.
DateReceive Time
(UT)
Longitudinal Velocity (m/s)Latitudinal Velocity (m/s)Horizontal Velocity (m/s)Vertical Velocity (m/s)
115 January 202216:02:0252.64−138.75148.40290.90
215 January 202216:07:02−40.44−111.87118.95250.78
315 January 202216:12:0281.54−130.52153.90302.49
415 January 202216:17:0211.85−26.3028.84288.31
515 January 202216:22:02−46.08−92.49103.33242.83
615 January 202216:27:0236.21−24.7643.87305.03
715 January 202216:32:0231.45−119.53123.60284.41
815 January 202216:37:0261.08−119.65134.34297.49
Note: UT-Universal Time.
Disclaimer/Publisher’s Note: The statements, opinions and data contained in all publications are solely those of the individual author(s) and contributor(s) and not of MDPI and/or the editor(s). MDPI and/or the editor(s) disclaim responsibility for any injury to people or property resulting from any ideas, methods, instructions or products referred to in the content.