Article

Spatio-Temporal Characteristics and Differences in Snow Density between the Tibet Plateau and the Arctic

1
Key Laboratory of West China’s Environment Systems (Ministry of Education), College of Earth and Environmental Sciences, Observation and Research Station on Eco-Environment of Frozen Ground in the Qilian Mountains, Lanzhou University, Lanzhou 730000, China
2
Cryosphere Research Station on the Qinghai–Tibet Plateau, State Key Laboratory of Cryospheric Science, Northwest Institute of Eco-Environment and Resources, Chinese Academy of Sciences, Lanzhou 730000, China
3
Southern Marine Science and Engineering Guangdong Laboratory, Zhuhai 519000, China
4
Key Laboratory of Remote Sensing of Gansu Province, Northwest Institute of Eco-Environment and Resources, Chinese Academy of Sciences, Lanzhou 730000, China
5
Department of Geosciences and Natural Resource Management, University of Copenhagen, 1350 Copenhagen, Denmark
*
Author to whom correspondence should be addressed.
Deceased January 2022.
Remote Sens. 2023, 15(16), 3976; https://doi.org/10.3390/rs15163976
Submission received: 12 June 2023 / Revised: 5 August 2023 / Accepted: 8 August 2023 / Published: 10 August 2023
(This article belongs to the Special Issue Study on Cryospheric Sciences Using Remote Sensing Technology)

Abstract

:
The Tibet Plateau (TP) and the Arctic are typically cold regions with abundant snow cover, which plays a key role in land surface processes. Knowledge of variations in snow density is essential for understanding hydrology, ecology, and snow cover feedback. Here, we utilized extensive measurements recorded by 697 ground-based snow sites during 1950–2019 to identify the spatio-temporal characteristics of snow density in these two regions. We examined the spatial heterogeneity of snow density for different snow classes, which are from a global seasonal snow cover classification system, with each class determined from air temperature, precipitation, and wind speed climatologies. We also investigated possible mechanisms driving observed snow density differences. The long-term mean snow density in the Arctic was 1.6 times that of the TP. Slight differences were noted in the monthly TP snow densities, with values ranging from 122 ± 29 to 158 ± 52 kg/m3. In the Arctic, however, a clear increasing trend was shown from October to June, particularly with a rate of 30.3 kg/m3 per month from March to June. For the same snow class, the average snow density in the Arctic was higher than that in the TP. The Arctic was characterized mainly by a longer snowfall duration and deeper snow cover, with some areas showing perennial snow cover. In contrast, the TP was dominated by seasonal snow cover that was shallower and warmer, with less (more) snowfall in winter (spring). The results will be helpful for future simulations of snow cover changes and land interactions at high latitudes and altitudes.

Graphical Abstract

1. Introduction

Snow density is one of the most fundamental properties of snow cover [1]. It has critical effects on energy budgets [2] and snow surface temperature [3], as the thermal conductivity of snow is controlled mostly by its density [4]. Snow density is also a significant attribute that impacts various types of snow cover remote sensing applications because it is directly linked to the dielectric permittivity of snow, which controls the emission and reflection of electromagnetic waves in the snow layer [5]. Moreover, the mechanical interactions that occur within snow cover or between snow cover and the surroundings are related to snow density [6,7]. Furthermore, snow properties, such as porosity [6], optical properties [8], and permeability [9], are connected with snow density. Snow density is a key input parameter for many models, including land surface models [10] and snow models [11,12]. In addition, snow density establishes the relationship between snow depth and the snow water equivalent (SWE), which makes it indispensable in a variety of snow hydrology studies and applications, such as water supply [13], flood forecasting [14], and snowmelt runoff quantification [15].
Snow density varies with time, place, and surrounding weather conditions [11,16]. When the temperature is very low during snowfall, the new snow typically has a rather low density, while higher densities for new snow occur at higher temperatures [17,18]. Snow densification begins immediately after snowfall reaches the ground and is mainly caused by metamorphism (snow grains change in size and shape), wind action, and compaction [16,19]. There are three types of snow metamorphism: constructive metamorphism (kinetic growth metamorphism), destructive metamorphism (equilibrium growth metamorphism), and wet snow metamorphism (melt or melt-freeze metamorphism) [16,20,21]. Constructive metamorphism is caused by strong vertical temperature gradients (low air temperature) that occur throughout the snowpack, which produce large, faceted grains referred to as depth hoar. These large grains are hard to pack closely together, resulting in low rates of densification [16,21,22]. The snow grains slowly metamorphose into rounded shapes through destructive metamorphism caused by weak vertical temperature gradients (warmer air temperature) [6,16,21]. The thermal isolation of snow causes a higher snow ground interface temperature than the snow surface temperature, which results in a vertical temperature gradient in the snow layer (°C/m). Lower air temperature is more favorable for producing strong vertical gradients. When the air temperature is warm, the vertical temperature gradient is weak [6,16]. Melt metamorphism typically occurs when liquid water is present in the snow cover, which also accelerates destructive metamorphism [22]. Regardless of the snow metamorphism type, increases in snow density could be the result of overburden pressure [16,23,24]. The prevalent high wind is known to redistribute the snow grains, which makes the snow cover become more densely packed, easily producing greater densities [18,25,26].
However, several studies have used fixed [11,27] or modeled snow density values [28,29], which can lead to significant errors of up to 100% when estimating snow depth [30]. In addition, directly determining snow density using remote sensing methods remains problematic [5,31]. Thus, site and field measurements are the primary methods for investigating snow density. There are several approaches available to directly measure snow density, such as gravimetry measurement [32], stereology [33], microcomputed tomography [34], high-resolution osmometry [35], dielectric permittivity measurement [1], the neutron-scattering probe [36], and diffuse near-infrared transmission [8]. Compared to the cumbersome direct measurement, gathering snow density by determining the SWE and the snow depth is more manageable, less expensive, and less time-consuming [37]. Nevertheless, a lack of extensive ground-based data remains the greatest challenge in analyzing snow density over large areas [6,17]. For instance, field snow observations conducted on a 5.4 km section in the Central Spanish Pyrenees Mountains indicated variation in snow density but showed no discernible pattern [38]. Moreover, insufficient snow density measurements may also lead to considerable uncertainty in snow density analyses. In northern taiga and tundra areas, it has been shown that on some days a single measurement might represent the snow density for a land cover group because of the very limited measurements [7]. The spatio-temporal characteristics of snow density have not been well described thus far, particularly in the overall Arctic region.
The TP and the Arctic are typically cold regions and are extremely sensitive to global climate change because both have shown amplified warming in response to global warming [39,40]. The TP covers the largest area of snow and glaciers outside the poles [41,42,43] and is referred to as the “Water Tower of Asia” [44,45,46]. The snow density in each of these two areas has been examined in previous research [7,47,48,49,50]. For example, in the middle and southwestern parts of the TP, the snow density obtained from ground-based snow sites ranged from 140 kg/m3 to 180 kg/m3 during 1950–2009 [49]. The shallow snow depth and significant depth hoar fraction in the high Arctic resulted in a high average snow density of 298 kg/m3 [25]. Yet, studies of snow density in the Arctic are available for parts of the region, and there are no systematic studies for the entire region [25,51]. Whether there are similarities or differences between the TP and Arctic remains inconclusive, as most snow density studies have focused exclusively on one or the other of the two regions, and there have not been many attempts to systematically contrast the snow density characteristics between them. Such knowledge gaps hamper our understanding of the interaction between snow and climate in cold regions.
For this study, we compiled a wide range of available ground-based datasets of snow density across the TP and the Arctic. Our primary objectives were (1) to provide information on the spatio-temporal features of snow density across the TP and the Arctic, (2) to investigate regional heterogeneities in snow density based on the Global Seasonal-Snow Classification, Version 1, and (3) to explore the possible reasons for the differences in snow density between these two regions. The results will shed light on the different roles of snow cover regarding regional hydrology and ecology, as well as improve the modeling of snowpack evolution in land surface models.

2. Materials and Methods

2.1. Data

2.1.1. Data Sources

We used the Arctic Monitoring and Assessment Programme (AMAP) boundary [52] to define the Arctic region (Figure 1). The snow depth and SWE data were obtained from 697 sites with 191,946 paired records of snow density across the TP and the Arctic (Table 1). The air temperature and precipitation data consisted of 1,776,040 records from 174 stations (Table 1). A snow cover year was defined as 1 July through 30 June of the subsequent year to cover the entire snow season [53]. Most snow surveys started at the beginning of the snow accumulation period and ended during the snow melting period. The time interval was regular weekly or biweekly, except for data from the Snow Telemetry (SNOTEL) network and weather stations, which were collected daily.
The snow sites were separated into six classes based upon the snow class map [54] (Figure 1a). These classes were applied to emphasize regional heterogeneity in snow density. The 697 sites from which the data were obtained were not evenly distributed throughout the vast terrestrial regions. In the Arctic, the snow sites extended across Alaska, the Yukon Territory, and the southern Northwest Territories, whereas those in the TP were concentrated mainly in the eastern-central region.
Figure 1. (a) Ground-based measurement sites of snow depth and SWE for different snow classes [55] in the TP and the Arctic, (b) meteorological stations for air temperature and precipitation data in the TP and the Arctic.
Remotesensing 15 03976 g001
No maritime snow appeared in the TP. The tundra snow accounted for approximately 73% of the snow cover, followed by prairie snow at 15%; the remaining three snow classes accounted for approximately 10%. In the Arctic, tundra snow and boreal forest snow accounted for approximately 16% and 7%, respectively; all other snow classes made up less than 0.3%, including ephemeral snow at 0.003%.
The air temperature and precipitation stations were usually collocated with snow stations and sites during 1981–2010 (Figure 1b). Here, we selected only those stations where snow depth, SWE, air temperature, and precipitation were all available (174 stations in total). These stations are predominately concentrated at higher elevations (approximately 4000 m) over the eastern regions of the TP, and those in the Arctic are located at relatively low elevations, with the vast majority being found at elevations below 2000 m.
Due to the lack of wind speed data at meteorological stations, we adopted the ERA5-Land hourly wind speed data [56] as a proxy. The wind data from ERA5-Land were divided into the eastward component of the 10 m wind and the northward component of the 10 m wind. We first calculated the daily average from hourly data and then combined the eastward component and northward component to derive the horizontal wind speed. The wind speed was extracted from this daily average grid data based on the geographical location of the meteorological station.

2.1.2. Data Quality Control

The detection of outliers in measurements is vital to eliminating measurement errors. Accordingly, we conducted quality control for all datasets utilized in this study.
  • In situ snow data
(1) SNOTEL network
Daily SWE and snow depth data, measured via a snow pillow and an ultrasonic sensor, respectively, were collected remotely using an extensive automated data collection network known collectively as the SNOTEL network [57,58]. The data were recorded on the water years, a water year spans from October 1 of the previous year to September 30 of the current year. The SNOTEL network data used in this study were recorded between 2000 and 2018 (Table 1).
SNOTEL measurements were fully automated. We performed quality control procedures similar to those used in previous research [58,59,60]. Details of the procedure were as follows: (i) Stations with missing SWE values during the first 15 days of October were considered service delays, and the water year was coded as missing values. For daily snow depth increments greater than 50 cm or SWE increments greater than 200 mm, the corresponding snow depth (SWE) was considered no data. (ii) For the snow depth (SWE) records equal to zero, if the previous and subsequent day both had nonzero values, we eliminated the corresponding snow depth (SWE). (iii) When an SWE increment greater than 63.5 mm was followed on a subsequent day by an SWE increment less than −63.5 mm, or, conversely, an SWE increment less than −63.5 mm was followed on the next day by an SWE increment greater than 63.5 mm, these values were also considered to be invalid and were deleted. (iv) SWE increments and precipitation were combined to identify erroneous SWE values. Positive SWE increments greater than five standard deviations from the monthly mean values without a corresponding extreme precipitation event or a corresponding precipitation increment greater than three standard deviations were considered erroneous. Negative SWE increments greater than five standard deviations from the monthly mean were also deemed as erroneous. (v) To remain consistent with the Canadian historical snow survey dataset, we discarded snow density values less than 50 kg/m3 or greater than 600 kg/m3. The above procedures rejected approximately 21.9% of the data.
(2) Snow courses
The National Water and Climate Center (NWCC) of the United States Department of Agriculture (USDA) conducts a manual snow monitoring program in the western United States (https://www.nrcs.usda.gov/wps/portal/wcc/home/aboutUs/monitoringPrograms/manualSnowMonitoring/, accessed on 11 October 2020), with snow courses measuring snow variables on or close to the first day of each month in winter. The snow courses are approximately 300 m long and typically consist of 5 to 10 evenly distributed individual sample points. The Standard Federal snow sampler consists of a snow tube and a spring scale used for measuring snow depth and SWE [57]. The monthly snow course in Alaska has been tested by quality control measures and can thus be used directly.
Snow depth and SWE survey data have been consistently recorded since 1966 across Russia [61]. These observations in the Russian Arctic (1965–2018) include datasets from the All-Russian Research Institute of Hydrometeorological Information-World Data Centers (RIHMI-WDC) and those from the National Snow and Ice Data Center (NSIDC) of the University of Colorado Boulder. The length of the snow course measurements in Russia is approximately 2000 m, with sampling typically conducted on the 10th, 20th, and last days of the month during the cold season, and every five days during the intense snowmelt period [62]. In addition, the snow depth represents the average of 100 to 200 individual sample points measured using a portable snow measuring rod, and the SWE is calculated from the spatial average of 20 individual sample points measured by the snow weighing balance [62]. We performed quality control procedures based on the following parameters outlined by the NSIDC [62]: (i) snow depth values less than 1 cm or greater than 200 cm were removed; (ii) SWE values greater than 400 mm were eliminated; (iii) SWE to snow depth ratios less than 50 or more than 600 were excluded in the following analysis. These procedures rejected approximately 0.03% of the data.
(3) DATA SET 3200 (DSI-3200)
The DSI-3200 Alaskan snow dataset is derived from the station observations of the National Weather Service (NWS) cooperative station network [63]. The weather stations are equipped with snow boards or snow stakes for measuring daily snow depth, and a standard precipitation gauge is used to measure SWE. For snow that is deeper than approximately 61 cm, the SWE is typically measured with the Federal Snow Sampler [64,65]. This dataset contains data quality flags (marked as Flag 1 and Flag 2) to identify uncertain values in the snow measurements (https://rda.ucar.edu/OS/web/datasets/ds510.0/docs/2006jun.td3200.html, accessed on 1 September 2020). A detailed description of the quality mark can also be found on the above website. We retained the Flag1 of “E”, “J”, “)”, and “Blank”. For Flag 2, we took out “2”, “3”, “4”, “T”, and “U”; the rest of the flag values were reserved. The ratios of SWE to snow depth less than 50 or greater than 600 were also excluded.
(4) Canadian historical snow survey dataset
The associated data were obtained from various agencies. These data were then merged and presented in a standard comma-separated format. Snow data measurement type, data quantity, and availability vary considerably depending on the particular agency. Measurement methods consist of the snow course survey generally conducted at biweekly and monthly intervals during the snow season as well as daily snow pillow monitoring. Most agencies gather snow course measurements consisting of 5 to 40 samples to obtain the depth and SWE [66].
A quality control test based on five standard deviations [67] is applied to remove unrealistic values, following processing steps detailed in a previous study [68]. The dataset retains snow survey observations with complete information on SWE, snow depth, and snow density triplets with density values between 50 kg/m3 and 600 kg/m3 [69]. Therefore, this dataset can be used directly after simple data processing and cleaning (such as removing duplicated observations). Most of the data were concentrated within the period between 1964 and 2016.
(5) Snow measurements from meteorological stations in the TP
Long-term records of snow depth and SWE recorded across the TP between 1954 and 2012 were downloaded from the National Meteorological Centre, China Meteorological Stations. The SWE was measured on the 5th, 10th, 15th, 20th, and last day of the month during the cold season, and the snow depth was measured daily using a snow ruler in earlier years and ultrasonic or laser snow depth measurement sensors in recent years. SWE was taken as the average value measured by a snow weighing balance [49,50,70]. For quality control, we used the same method as that applied to the Russian data.
b.
Air temperature and precipitation data
Air temperature and precipitation measurements from SNOTEL stations were collected using quality control procedures [59]. Errors in conversion from voltage to degrees Celsius can lead to warm bias for cold temperatures in SNOTEL air temperature observations [71,72]. Currier et al. [72] used independent observations from temperature sensors, housed in ventilated shelters collocated with SNOTEL sites, to develop a correction equation (Equation (1)). We removed maximum, minimum, or mean temperature values greater than 40 °C or less than −60 °C, as well as those with identical values between day N and N +1. In addition, if the air temperature was greater or less than three standard deviations from the long-term average monthly temperature for a given month, the value was eliminated. The following equation was given in a previous study [72]:
T c o r r e c t = 1.03 × T S N O T E L 0.9
where T c o r r e c t is the corrected air temperature (°C), and T S N O T E L is the raw SNOTEL air temperature (°C).
For SNOTEL precipitation data, we applied the following four conditions to reduce the amount of erroneous data [59]. (i) When the accumulated precipitation was more than 12.7 cm on 1 October, the corresponding water year was deemed as a missing value and was eliminated. (ii) If the accumulated precipitation on the previous and subsequent days were identical but differed from that on the current day, the accumulated precipitation for that current day was set to the same value as that recorded for the preceding and following days. (iii) If the accumulated precipitation on the current day was either higher than that on the subsequent day or lower than that on the previous day and the positive difference in accumulated precipitation between the two was less than 1.3 cm, the accumulated precipitation for the current day was replaced with the average of the preceding and following days. (iv) If the positive daily increment was greater than 25.4 cm or the negative increment was less than −1.3 cm, the corresponding increment was marked. A combination of five standard deviations and SWE increments was also used to determine erroneous accumulated precipitation values. Finally, we truncated the time series of the water year at the appearance of the marked value.
Precipitation and air temperature values from DSI-3200 [63], the Canadian climate stations [73], RIHMI-WDC (http://meteo.ru/english/climate/descrip11.htm, accessed on 21 July 2020), and the China Meteorological Data Service Center [74] include quality control flags to make users aware of erroneous data. Accordingly, data quality control was conducted based on flag values, whereby manual elimination, verification, and correction were applied to uncertain or incorrect data. The DSI-3200 values included only the maximum and minimum air temperatures, which we averaged to represent the mean temperature. All observation sites recorded at least 20 years of observation data.

2.1.3. Snow Classification

On the basis of the newest global snow class map (10 arc-sec by 10 arc-sec) from the NSIDC [54], we separated the snow sites in the TP and the Arctic into the following six snow classes according to the climatic characteristics of air temperature, precipitation, and wind speed: tundra, boreal forest, prairie, montane forest, maritime, and ephemeral snow [55] (Figure 1a and Supplementary Figure S1).

2.2. Method

2.2.1. Snow Density

Snow density is related to SWE (mm) and snow depth (cm) through the following equation [13]:
ρ s = ρ w S W E S D × 10
where ρ s is the density of the snowpack (kg/m3), and ρ w is the density of liquid water (1000 kg/m3). The snow density in this study was bulk density.
We first calculated the snow density for all available measurements and then averaged all snow densities for a given month at a given site. Finally, the average snow density at a site was calculated on a monthly basis. The monthly mean snow density for a region was the arithmetic mean from all available snow densities in a given month for all sites within that region. The inter-annual variability in snow density was considered negligible due to small inter-annual variation (Supplementary Figure S2), which agrees with the results reported in previous studies [6,13,38]. We stressed that snow density was not a regularly observed indicator in the meteorological observation system. We collected the data from a variety of sources to obtain all the available data. Therefore, there were differences in the number of site measurements in this study.

2.2.2. Snowfall

The air temperature threshold determines precipitation falling as rain or snow, with continental areas and mountain ranges generally exhibiting warmer air temperature thresholds, while maritime areas and low-lands exhibit colder air temperature thresholds [75]. This underscores the inadequacy of partitioning precipitation falling as rain or snow by establishing a uniform air temperature threshold. Therefore, we employed a method that allows for a mix of rainfall and snowfall. This method was more accurate than the snowfall calculated using a fixed threshold. All precipitation was assumed to be snowfall (rainfall) if T m e a n ≤ −2 °C ( T m e a n ≥ 2 °C). For values between 2 °C and −2°C, we applied a linear relationship to estimate the solid proportion of precipitation, as shown in Equation (3) [76]:
f = 1   ( T m e a n < = 2   ° C ) 0.25 × T m e a n + 0.5   ( 2   ° C < T < 2   ° C ) 0   ( T m e a n > = 2   ° C )
S f = f × P
where f is the solid fraction of the total precipitation; S f is the snowfall (mm); and P is precipitation (mm).

3. Results

3.1. Spatial Heterogeneity of Snow Density

The average site snow densities varied from 50 kg/m3 to 564 kg/m3 in the TP and the Arctic (Figure 2a), with average values of 138 ± 61 kg/m3 and 223 ± 54 kg/m3, respectively. The difference in average snow density between the TP and Arctic regions was pronounced, reaching approximately 85 kg/m3. In the Arctic region, the lowest long-term mean snow density was found in the Canadian Arctic, at 217 ± 42 kg/m3, and the highest value reached 239 ± 51 kg/m3 in the Russian Arctic. There was no remarkable difference between the Canadian Arctic and Alaska (225 ± 61 kg/m3), which differed by only ~8 kg/m3 (Figure 2b). Therefore, the snow density in the Arctic had a low variation. The SNOTEL, DSI-3200, and snow course datasets were tested separately to provide a more quantitative comparison for each dataset in Alaska. The results showed that the average snow densities were 243 ± 45 kg/m3 and 238 ± 47 kg/m3 for the SNOTEL and snow course in Alaska, respectively, while that of DSI-3200 was only 163 ± 79 kg/m3. The difference between the SNOTEL and DSI-3200 was approximately 49%, which was only 2% between the SNOTEL and snow course (Figure 2c). Together, the SNOTEL, snow course, and DSI-3200 datasets represent a wide range of locations and snow cover conditions in Alaska. SNOTEL data are representative of high-elevation areas, whereas the DSI-3200 sites are typically located at relatively low elevations and in flat areas, and snow courses are more representative of the area elevation (Figure 3a and Supplementary Figure S3). At lower elevations, there was more variability in snow density (Figure 3b). In terms of snow cover conditions, the average snow depths were significantly larger for the snow course (68 ± 36 cm) and SNOTEL dataset (50 ± 25 cm) than for the DSI-3200 dataset (18 ± 14 cm) (Figure 3c). These results indicated that different terrains and snow cover conditions result in observed differences in snow density.
The average snow densities based on different snow classes also showed significant differences between the two areas. It should be noted that, in the subsequent analysis, the absence of snow classes was explained by the lack of snow sites or insufficient measurements (Supplementary Figure S1). Moreover, no maritime snow occurred in the TP, which also explained the missing snow classes.
Considerable differences in snow density were noted among the snow classes (Figure 4 and Supplementary Table S1), particularly between the TP and Arctic values for the same snow class. For tundra snow, the average densities were 140 ± 33 kg/m3 in the TP and 228 ± 56 kg/m3 in the Arctic. For prairie snow, the Arctic had a considerably larger average of 215 ± 51 kg/m3 compared with the 130 ± 41 kg/m3 of the TP. In both regions, the tundra snow density was higher than that of prairie snow. The lowest snow density of 96 kg/m3 was found in ephemeral snow in the TP and was accompanied by a rather low standard deviation. In the Arctic, the average snow density for the boreal forest snow class was 210 ± 42 kg/m3, which was lower than that for other snow classes. The average snow density for prairie snow was similar to that for tundra snow. Maritime snow had the highest value at 290 ± 63 kg/m3 and the greatest within-site variability in terms of average snow density, followed by the montane forest snow at 232 ± 52 kg/m3.

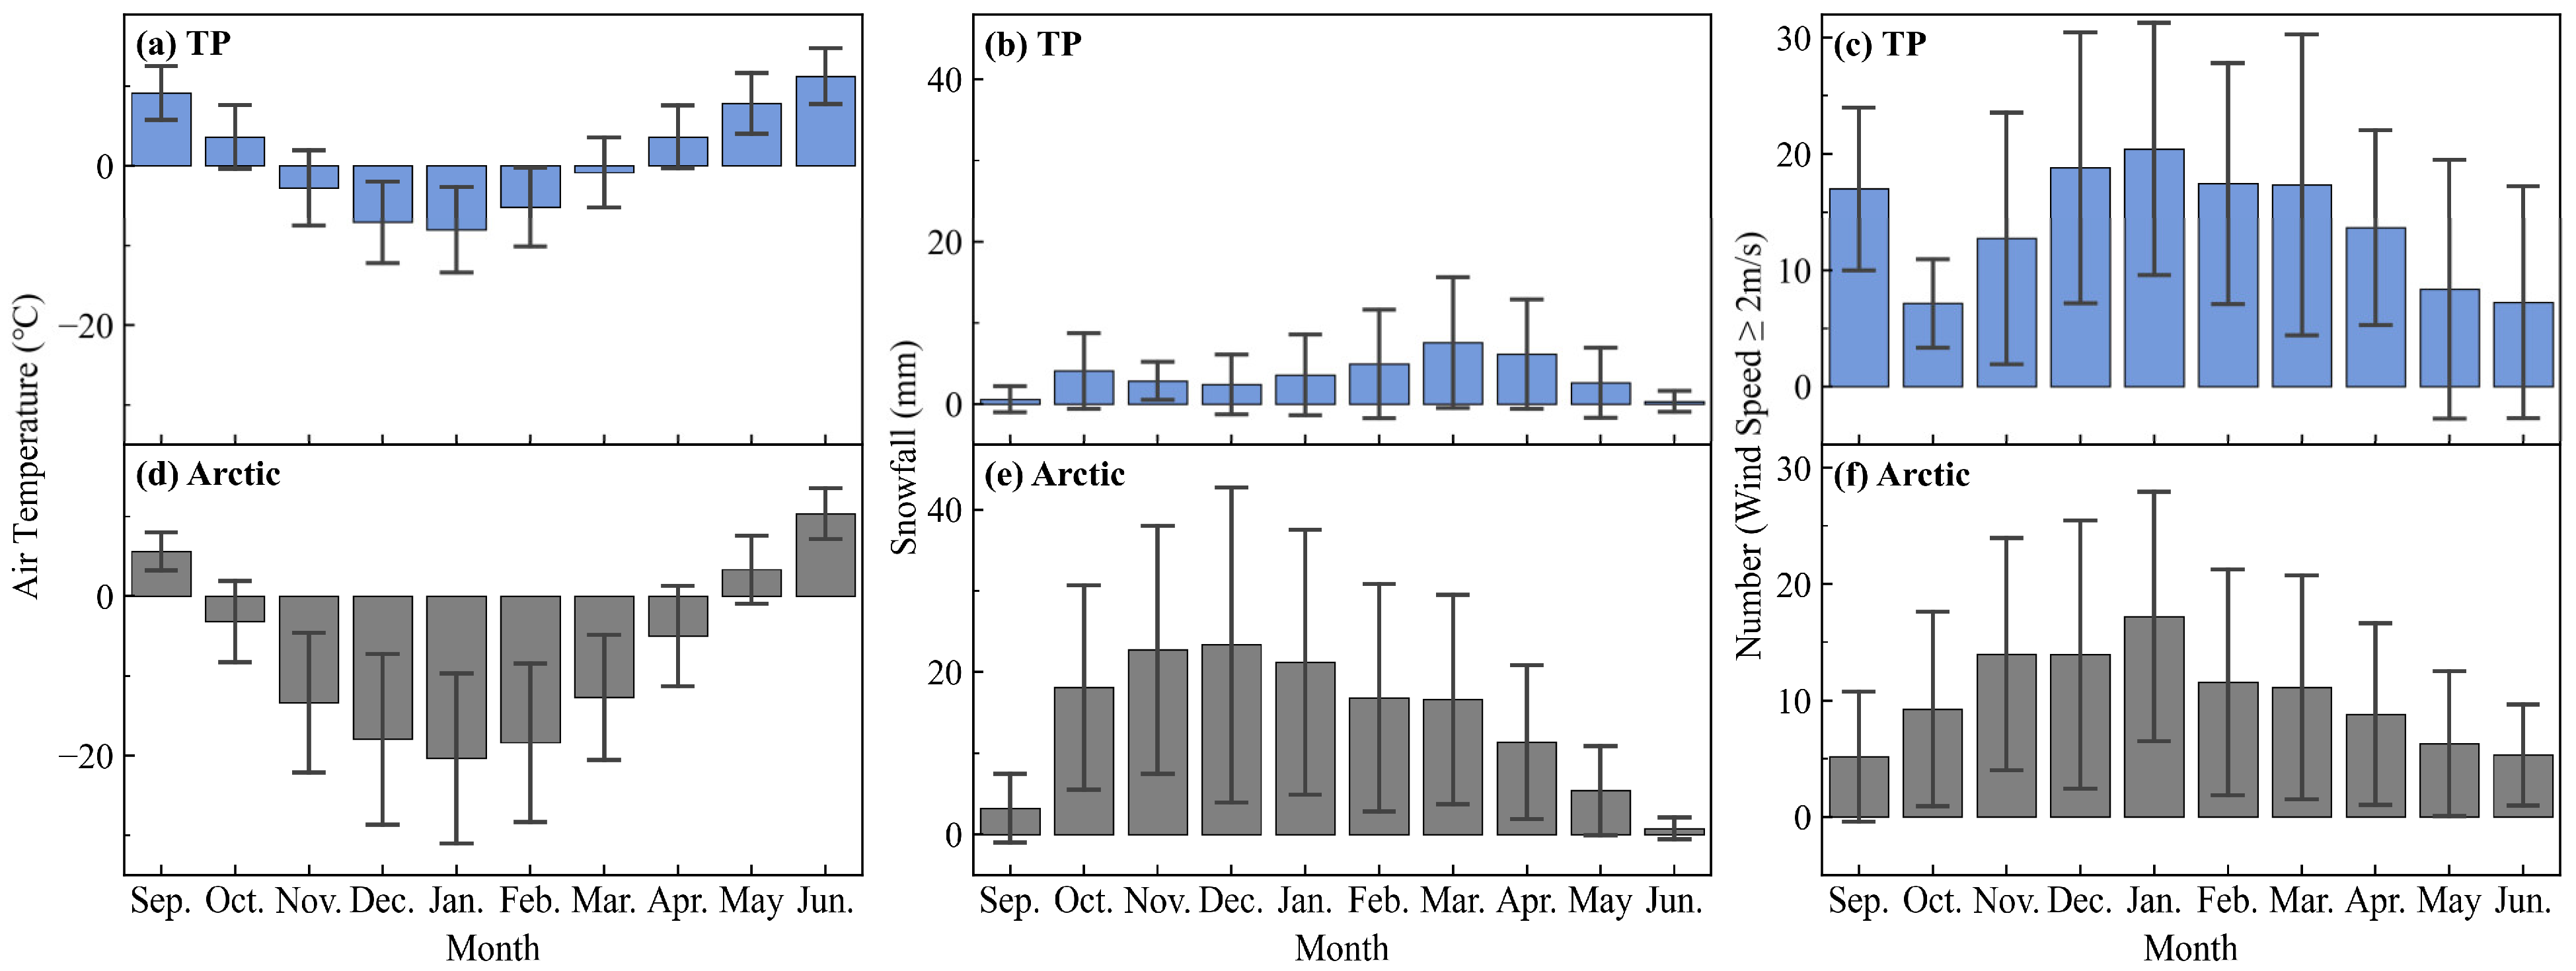
3.2. Seasonal Variation in Snow Density

The time-densification process of the snowpack was confirmed in this research based on monthly mean snow densities. The statistical details of monthly snow density are shown in Figure 5 and Table S2 in the Supplementary Materials. The monthly mean snow densities in the TP were clearly lower than those in the Arctic. No specific pattern was exhibited in the TP throughout the snow cover season. However, slight differences were noted among the monthly densities in the TP, particularly from September to May, with values occurring within a narrow range of variability between 122 ± 29 kg/m3 and 137 ± 45 kg/m3. The monthly mean snow densities increased at a very low densification rate from March to June, increasing by only 8 kg/m3 per month. In the Arctic region, the monthly mean snow density showed considerable variation, with increases of approximately 18.8 kg/m3 per month from October to June. This increase was particularly pronounced from March to June, at 30.3 kg/m3 per month. The difference in monthly mean snow density between October and June was as high as 169 kg/m3. The decrease in October might be attributed to the combined effects of low-density new snow and increasing snowfall events, which dominated the snow cover (Supplementary Figure S4).
The monthly changes in snow density were also considerable among the snow classes (Figure 6 and Supplementary Table S1). No clear changing trend was noted in the TP. The monthly mean snow densities for tundra snow showed strong fluctuations, ranging from 129 ± 49 kg/m3 to 153 ± 69 kg/m3. For prairie snow, the values fluctuated between 109 ± 22 kg/m3 and 177 ± 55 kg/m3, with the maximum value occurring in June. The average snow density value for ephemeral snow was as low as 96 ± 11 kg/m3. Ephemeral snow was recorded only in January (the coldest month), which was related to the characteristic of the rapid evolution of this snow class from accumulation to ablation and in situ observations with low observation frequency and at given dates. The decrease in snow density from December to January (Figure 5a) was attributed to the lower snow density of this class.
In the Arctic region, the seasonal evolution of snow density tended to be similar among the snow classes, showing an increase from October to June. The maximum monthly values always occurred in May or June, while the minimum monthly values largely appeared in October or November. The minimum values were recorded in the boreal forest class, with snow densities ranging from 148 kg/m3 to 366 kg/m3. This result was associated with relatively small standard deviations and implied that snow density in the boreal forest class was relatively insensitive to its seasonal variability. The highest monthly mean snow densities were all recorded in the maritime snow class.

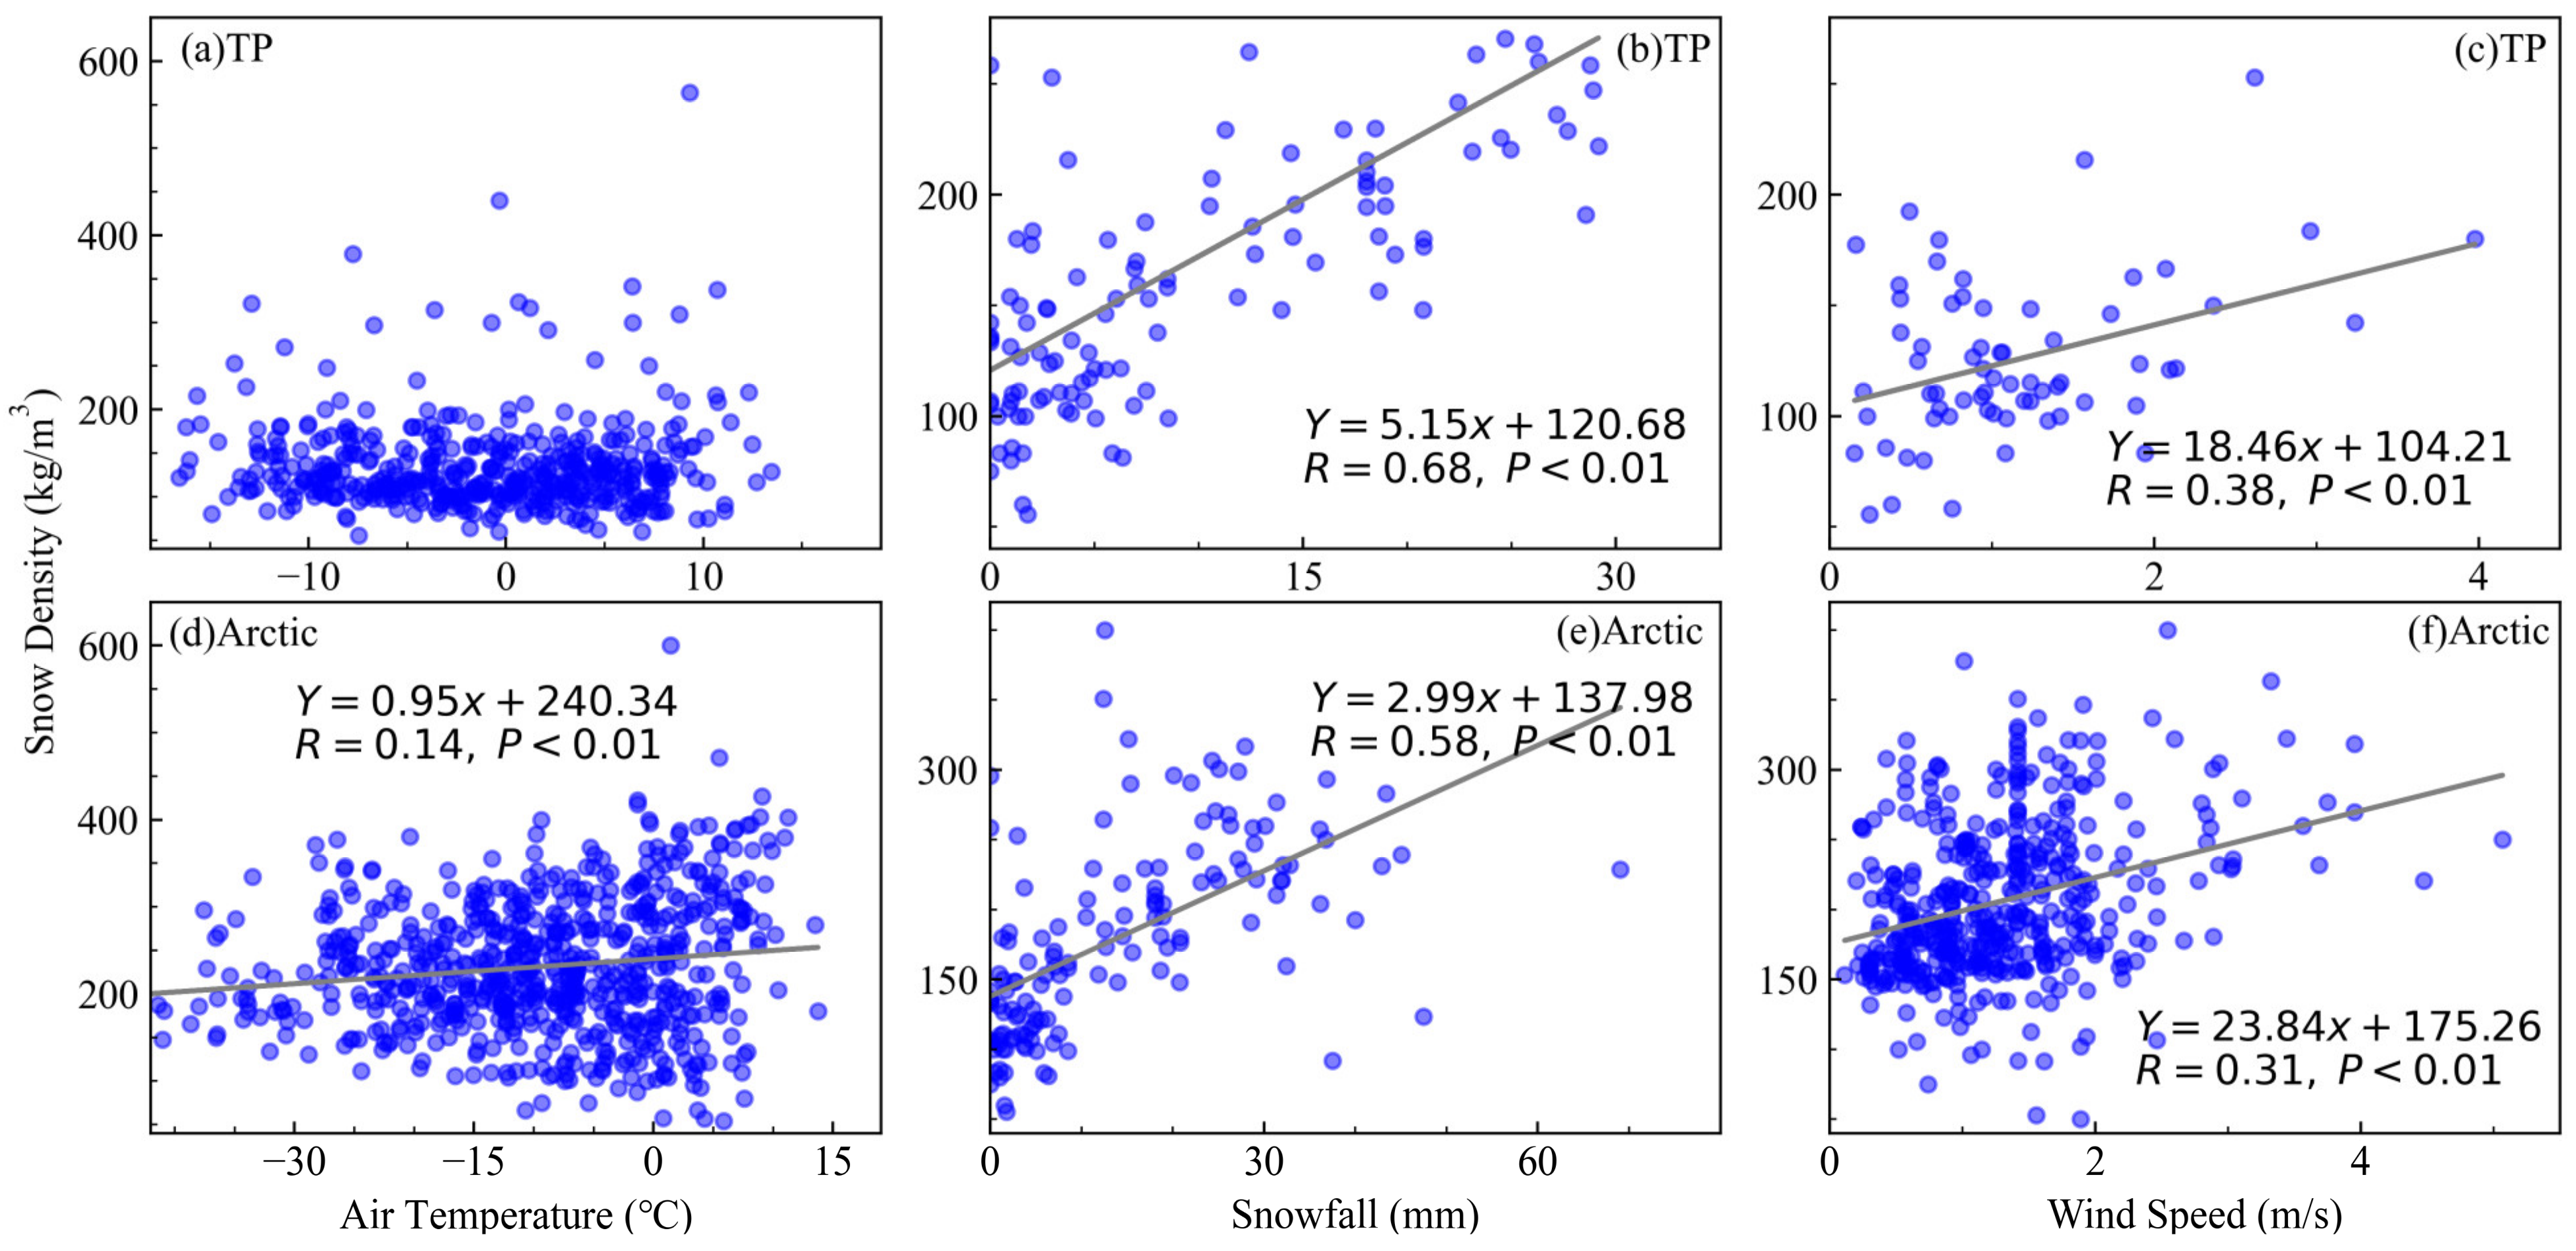
3.3. Relationship between Snow Density and Environmental Factors

The average annual air temperature in the TP was 3.1 ± 4.0 °C, with monthly mean air temperatures falling below 0 °C during five months (from November to March). Therefore, the TP was dominated by seasonal snow cover. The vertical temperature gradients were relatively weak from November to February due to the relatively high air temperature (Figure 7a). In contrast, the average annual air temperature in the Arctic was −3.8 ± 5.2 °C (perennial snow cover existed), with monthly mean air temperatures below 0 °C occurring between October and April. From November to March, the cold temperature maintained a strong thermal gradient through the snowpack due to extremely low air temperatures (Figure 7d). In the TP, the snowfall duration lasted for eight months, from October to May. The overall snowfall amount was low, with less (more) snowfall occurring in winter (spring) (Figure 7b). Snowfall duration was considerably longer in the Arctic (from September to May), with the greatest amount occurring between late fall and mid-winter (Figure 7e). The TP was frequently under windy conditions in September and from November to April (Figure 7c). In the Arctic, winds were more frequent between November and January (Figure 7f).
There may not be a linear relationship between multi-year average snow density and air temperature (Figure 8a,d), the physical processes were complex, and it was difficult to find a simple expression that could give a better correlation. Unlike the complex intuitive relationship between air temperature and snow density, the relationship between air temperature and snow densification rate was obvious in the Arctic, with densification rates being significantly lower in winter than in spring (Figure 5b and Figure 7d). To minimize the effect of air temperature on snow cover, we only employed multi-year monthly mean snowfall and wind in January to explore their relationship with snow density. It can be expected that the larger the snowfall, the higher the average snow density due to the compaction process. This can be seen in Figure 8b,e. In both the Arctic and the TP, the wind speed also showed statistically reliable positive correlations with snow density (Figure 8c,f).
To explore the details of the effects of environmental factors on snow density, we analyzed snowfall, air temperature, snow depth, wind, and snow density at three sites: Qing shuihe in the TP (33.8°N, 97.13°E; 4415 m a.s.l.), Monument Creek in Alaska (65.08°N, 145.87°W; 564 m a.s.l.), and Salehard in Russia (66.50°N, 66.68°E; 15 m a.s.l.) (Figure 1b). These sites were chosen primarily because they provided a relatively high number of snow measurements. Additionally, the sites were located in different geographical regions and at different elevations. At the Qing shuihe site (Figure 9a,b), accumulated snowfall was as low as 113 mm, snow depth was mostly limited to 5–10 cm, and the average temperature during the cold season was only −10.4 °C. There was more snowfall in spring, but it was accompanied by wind speeds below 2 m/s. The combined effect of these factors was the principal reason for the low and fluctuating snow densities (in the range of 80–200 kg/m3). However, the snow depth at the Monument Creek and Salehard sites was deep (maximum was more than 60 cm), with frequent and heavy snowfall resulting in accumulations over 170 mm (Figure 9d,e,g,h). In addition, pronounced vertical temperature gradients persisted from November to March, which, together with the long duration and medium wind speeds, ultimately formed large and increasing snow density values (Figure 9e,f,h,i).

4. Discussion

In the Arctic, no dedicated agency conducts systematic snow surveys over the whole region. Instead, multiple national agencies use different methods to record observations, as well as a few short-term field surveys performed by researchers in localized areas. As a result, snow density studies have been limited to only parts of the region [25,47,77]. Here, we generalized multiple long-term snow measurements from different subregions of the Arctic, with sites essentially covering the Arctic. Moreover, we provided systematic and representative spatio-temporal characteristics of snowpack density on a regional scale. Our study is temporally complete and includes observations from September to June, whereas the vast majority of studies concentrate on values obtained between November and April or shorter periods. Furthermore, we adopted the latest version of the snow classification dataset [54]. Few studies have been conducted on snow density based on snow classes in the TP. Our study involved almost all snow classes in the Arctic and was facilitated by the extensive availability of snow density observations. In contrast, most of the current studies focus on the tundra and boreal forest snow [7,47,77]. Our study is the first to systematically compare the differences in snow density characteristics between the Arctic and the TP.

4.1. Spatial and Temporal Patterns of Snow Density in the TP and the Arctic

We obtained a lower average snow density of 138 ± 61 kg/m3 during 1954–2012 in the TP, with respect to that of 156 kg/m3 for September–May during 2013–2020, as reported by Wang et al. [78]. This small disparity is attributed to our use of all available measurements recorded between September and June for the different study periods. The average snow density observed in Alaska, 225 ± 61 kg/m3, relatively agrees with that observed by Sturm et al. [13] in northwestern Alaska in 2002 at approximately 245 kg/m3. For snow classes, our results confirmed previous findings, such that the greatest snow density and range occurred at maritime snow sites and boreal forest had the lowest snow density and was the least spatial heterogeneous [13,53]. A few studies based in North America and the former Soviet Union have reported that ephemeral snow typically has a relatively high snow density among snow classes [53,55]. The results from our case demonstrated that the average snow density was very low at the ephemeral sites in the TP. This occurred because fewer snow density measurements were available for the ephemeral snow, and differences in regional sample sizes gave slightly different results.
A generalization often mentioned in previous research is that snow density gradually increases during the snow cover season [6,53,79]. We found similar results in the Arctic. Surprisingly, the seasonal snow density in the TP was relatively constant and did not show the expected increasing trend over time, particularly in winter. The seasonal variation in snow density highlights the unique features of the snow cover in the TP. In this study, the snow density exhibited strong regional variations between the different snow classes during different months. Despite this notable difference, some SWE retrievals utilized a constant snow density throughout the retrieval, regardless of the snow cover condition, place, or time [11,80]. Moreover, a considerable number of models assumed that the snow density was a constant rather than a variable value [37,81]. Given these facts, our findings can be applied to various types of applications, including remote sensing retrieval and validation, model simulation and prediction (e.g., snow, atmosphere, land surface schemes), and hydrological and climate studies.

4.2. Effect of Environmental Factors on Snow Density over Two Regions

The results of our study indicated that the snow density disparity between the TP and the Arctic was associated with differences in air temperature, snowfall, and wind conditions.
In the Arctic, constructive metamorphism caused by strong vertical temperature gradients (low air temperature) occurred from November to March (Figure 7d), producing large grains that contributed to the slow rates of densification (Figure 5b) because they were hardly packed closely together. In addition, the increase in snow density was caused by continuous compaction facilitated by the weight of the abundant snowfall (Figure 7e). Wind-driven redistribution was a primary factor controlling the increase in snow density from November to February (Figure 7f). In April, the combination of melt metamorphism, accelerated destructive metamorphism, and overburden pressure reduced the porosity of the snow cover, which caused the snow density to increase at high densification rates. This seasonal persistent snow cover, referred to as firn, has densities typically ranging from 550 kg/m3 to 800 kg/m3 [22] and is a driver of the high snow density in the Arctic.
In the TP, slow destructive metamorphism caused by weak vertical temperature gradients (warmer air temperature) generally dominated the densification process from November to February (Figure 7a). The rare snowfall and shallow snow depth produced negligible overburden pressure (Figure 7b). Despite the windy winter conditions (Figure 7c), very little snowfall limited the effect of wind on snow density. Hence, little change was noted for snow density in winter (Figure 5a). When the snow cover melted in March, melt metamorphism and accelerated destructive metamorphism were more prone to producing high densification rates. However, the shallow snow depth restricted development, which, combined with new snow and low density, ultimately resulted in low rates of densification. Thus, snowfall and temperature were the most useful explanatory terms for seasonal variability in snow density in the TP.
Despite a large body of available in situ observations utilized in this study, one of the uncertainties was the uneven distribution of in situ snow and meteorological measurements, especially in the Canadian Arctic, where meteorological stations were extremely scarce. Different snow density variation behaviors can be seen under different rainfall conditions. On the one hand, snow cover could absorb rain causing an increase in snow density, while repeated rainfall damages the ice structure and reduces the water absorption capacity of the snow cover. As a result, rainfall reduces snow density [18]. However, the Arctic winters were long in duration and generally too cold for rainfall to occur. Hence, we did not take rainfall into account and only considered factors that highlight climatic conditions: temperature, snowfall, and wind speed.

5. Conclusions

This research examined the spatio-temporal characteristics of snow density, which was supported by extensive in situ observations of 677 sites across the TP and the Arctic from 1950 to 2019. We investigated the different snow density regimes between the TP and the Arctic and the associated climate factors driving these differences.
In general, the Arctic had a large amount of snowfall, deeper and colder snow cover with higher wind speeds, a longer snowfall duration, and the existence of perennial snow cover. In contrast, the TP had less snowfall and lower wind speeds, shallower and relatively warmer snow cover, the duration of snowfall was shorter, and less (more) snowfall occurred in winter (spring). These factors caused the long-term mean snow density in the TP, 138 ± 61 kg/m3, to be lower than that in the Arctic, 223 ± 54 kg/m3. Seasonally, the monthly snow density in the Arctic exhibited strong intra-annual variability from October to June, particularly during the late snow cover season. In the TP, however, only slight differences were noted among monthly snow densities that ranged from 122 ± 29 to 158 ± 52 kg/m3. A comparison of the seasonal evolution of snow density among the different snow classes revealed similar variations in the Arctic. In the TP, however, no clear consistent variation between the months was noted in the snow classes. Moreover, we found that strong vertical temperature gradients in the Arctic resulted in low densification rates in winter. In the TP, however, weak vertical temperature gradients and negligible overburden pressure resulted in fluctuations in snow density. Despite the limited consistency and continuity, as well as the inhomogeneous spatial distribution of the observations examined in this study, the results are critical for investigating the spatio-temporal patterns and differences in snow density between the TP and the Arctic. Therefore, the results of this study will enhance our understanding of the regional characteristics and discrepancies in snow density, particularly those occurring in cold and remote regions where monitoring is sparse.

Supplementary Materials

The following supporting information can be downloaded at: https://www.mdpi.com/article/10.3390/rs15163976/s1, Figure S1: Snow site number for snow classes; Figure S2: Time series of average snow density; Figure S3: Geographical location of snow sites with elevation as background in Alaska; Figure S4: Snow site number of per month; Table S1: Monthly mean snow densities with one standard deviation of each snow class over the TP and the Arctic. (kg/m3); Table S2: Monthly mean snow densities with standard deviation over the TP and the Arctic. (kg/m3).

Author Contributions

Conceptualization, T.Z. and W.Z.; methodology, T.Z., W.Z., X.Z. and Y.L.; formal analysis, W.Z. and T.Z.; data curation, W.Z., Y.S. and B.L.; writing—original draft preparation, W.Z. and T.Z.; writing—review and editing, W.Z., C.M., X.W., X.Z. and X.P.; visualization, W.Z. and X.P.; supervision, T.Z. and C.M.; project administration, C.M. and T.Z.; funding acquisition, C.M. and T.Z. All authors have read and agreed to the published version of the manuscript.

Funding

This research was funded by the National Key Research and Development Program of China (2019YFA0607003), the Strategic Priority Research Program of Chinese Academy of Sciences (XDA20100313), National Natural Science Foundation of China (42161160328), Gansu Science and Technology Program (23JRRA1171), and Fundamental Research Funds for the Central Universities (lzujbky-2023-eyt01, lzujbky-2021-ct13).

Data Availability Statement

Russian station observations [dataset] are from the Russian Research Institute for Hydro-Meteorological Information-World Data Center [82], http://meteo.ru/data (accessed on 21 July 2020). DSI-3200 data [dataset] for Alaska can be downloaded from the National Center for Atmospheric Research [83], https://rda.ucar.edu/datasets/ds510.0/ (accessed on 1 September 2020). SNOTEL data [dataset] and Snow Course data [dataset] for Alaska are available from the National Water and Climate Center [84], https://www.nrcs.usda.gov/wps/portal/wcc/home/snowClimateMonitoring/snowpack (accessed on 11 October 2020). The snow depth and SWE in Canada [dataset] are available from the Meteorological Service of Canada [85], https://data.ec.gc.ca/data/climate/systems/canadian-historical-snow-survey-data/ (accessed on 25 August 2020). Meteorological station data [dataset] for Canada are from the Meteorological Service of Canada [85], https://dd.weather.gc.ca/climate/observations/daily/csv/ (accessed on 9 July 2020). The snow depth, SWE, air temperature, and precipitation data [dataset] in the TP are available to scientific researchers in China via application from the China Meteorological Administration [86], http://data.cma.cn/en/ (accessed on 28 July 2020). The wind speed data [dataset] were collected from the Copernicus Climate Change Service Climate Data Store [56], https://cds.climate.copernicus.eu/cdsapp#!/dataset/reanalysis-era5-land?tab=form (accessed on 11 June 2022). The Global Seasonal-Snow Classification, Version 1 [dataset] can be downloaded from the National Snow and Ice Data Center [54], https://nsidc.org/data/NSIDC-0768/versions/1 (accessed on 12 April 2022).

Acknowledgments

We are greatly indebted to Liyun Dai from Northwest Institute of Eco-Environment and Resources, Chinese Academy of Science, and Guanghui Huang from the College of Earth and Environmental Sciences, Lanzhou University, whose comments have improved this manuscript.

Conflicts of Interest

The authors declare no conflict of interest.

References

  1. Proksch, M.; Rutter, N.; Fierz, C.; Schneebeli, M. Intercomparison of snow density measurements: Bias, precision, and vertical resolution. Cryosphere 2016, 10, 371–384. [Google Scholar] [CrossRef]
  2. Zhang, T.; Osterkamp, T.; Stamnes, K. Influence of the Depth Hoar Layer of the Seasonal Snow Cover on the Ground Thermal Regime. Water Resour. Res. 1996, 32, 2075–2086. [Google Scholar] [CrossRef]
  3. Domine, F.; Picard, G.; Morin, S.; Barrere, M.; Madore, J.-B.; Langlois, A. Major Issues in Simulating Some Arctic Snowpack Properties Using Current Detailed Snow Physics Models: Consequences for the Thermal Regime and Water Budget of Permafrost. J. Adv. Model. Earth Syst. 2019, 11, 34–44. [Google Scholar] [CrossRef] [Green Version]
  4. Osokin, N.; Sosnovskiy, A.V.; Chernov, R.A. Effective thermal conductivity of snow and its variations. Earth’s Cryosphere 2017, 21, 60–68. [Google Scholar]
  5. Sugiyama, S.; Enomoto, H.; Fujita, S.; Fukui, K.; Nakazawa, F.; Holmlund, P.; Surdyk, S. Snow density along the route traversed by the Japanese-Swedish Antarctic Expedition 2007/08. J. Glaciol. 2012, 58, 529–539. [Google Scholar] [CrossRef]
  6. Mizukami, N.; Perica, S. Spatiotemporal Characteristics of Snowpack Density in the Mountainous Regions of the Western United States. J. Hydrometeorol. 2008, 9, 1416–1426. [Google Scholar] [CrossRef]
  7. Hannula, H.-R.; Lemmetyinen, J.; Kontu, A.; Derksen, C.; Pulliainen, J. Spatial and temporal variation of bulk snow properties in northern boreal and tundra environments based on extensive field measurements. Geosci. Instrum. Methods Data Syst. 2016, 5, 347–363. [Google Scholar] [CrossRef] [Green Version]
  8. Gergely, M.; Schneebeli, M.; Roth, K. First experiments to determine snow density from diffuse near-infrared transmittance. Cold Reg. Sci. Technol. 2010, 64, 81–86. [Google Scholar] [CrossRef]
  9. Zermatten, E.; Schneebeli, M.; Arakawa, H.; Steinfeld, A. Tomography-based determination of porosity, specific area and permeability of snow and comparison with measurements. Cold Reg. Sci. Technol. 2014, 97, 33–40. [Google Scholar] [CrossRef]
  10. Nayak, A.; Marks, D.; Chandler, D.; Seyfried, M. Long-Term Snow, Climate, and Streamflow Trends at the Reynolds Creek Experimental Watershed, Owyhee Mountains, Idaho, United States. Water Resour. Res. 2010, 46, W06519. [Google Scholar] [CrossRef]
  11. Venäläinen, P.; Luojus, K.; Lemmetyinen, J.; Pulliainen, J.; Moisander, M.; Takala, M. Impact of dynamic snow density on GlobSnow snow water equivalent retrieval accuracy. Cryosphere 2021, 15, 2969–2981. [Google Scholar] [CrossRef]
  12. Xiao, X.; Zhang, T.; Zhong, X.; Shao, W.; Li, X. Support vector regression snow-depth retrieval algorithm using passive microwave remote sensing data. Remote Sens. Environ. 2018, 210, 48–64. [Google Scholar] [CrossRef]
  13. Sturm, M.; Taras, B.; Liston, G.; Derksen, C.; Jonas, T.; Lea, J. Estimating Snow Water Equivalent Using Snow Depth Data and Climate Classes. J. Hydrometeorol. 2010, 11, 1380–1394. [Google Scholar] [CrossRef]
  14. Jörg-Hess, S.; Griessinger, N.; Zappa, M. Probabilistic Forecasts of Snow Water Equivalent and Runoff in Mountainous Areas. J. Hydrometeorol. 2015, 16, 2169–2186. [Google Scholar] [CrossRef]
  15. Fayad, A.; Gascoin, S.; Faour, G.; López-Moreno, J.; Drapeau, L.; Le Page, M.; Escadafal, R. Snow hydrology in Mediterranean mountain regions: A review. J. Hydrol. 2017, 551, 374–396. [Google Scholar] [CrossRef]
  16. Bormann, K.; Westra, S.; Evans, J.; McCabe, M. Spatial and temporal variability in seasonal snow density. J. Hydrol. 2013, 484, 63–73. [Google Scholar] [CrossRef]
  17. Judson, A.; Doesken, N. Density of Freshly Fallen Snow in the Central Rocky Mountains. Bull. Am. Meteorol. Soc. 2000, 81, 1577–1588. [Google Scholar] [CrossRef]
  18. Meløysund, V.; Leira, B.; Høiseth, K.; Lisø, K. Predicting snow density using meteorological data. Meteorol. Appl. 2007, 14, 413–423. [Google Scholar] [CrossRef]
  19. Arenson, L.; Colgan, W.; Marshall, H.P. Chapter 2-Physical, thermal, and mechanical properties of snow, ice, and permafrost. In Snow and Ice-Related Hazards, Risks, and Disasters, 2nd ed.; Haeberli, W., Whiteman, C., Eds.; Elsevier: Amsterdam, The Netherlands, 2021. [Google Scholar]
  20. Rasmus, S. Spatial and temporal variability of snow bulk density and seasonal snow densification behavior in Finland. Geophysica 2013, 49, 53–74. [Google Scholar]
  21. Colbeck, S.C. An overview of seasonal snow metamorphism. Rev. Geophys. 1982, 20, 45–46. [Google Scholar] [CrossRef]
  22. Seibert, J.; Jeníček, M.; Huss, M.; Ewen, T. Chapter 4—Snow and ice in the hydrosphere. In Snow and Ice-Related Hazards, Risks, and Disasters; Shroder, J.F., Haeberli, W., Whiteman, C., Eds.; Academic Press: Boston, MA, USA, 2015. [Google Scholar]
  23. Jepsen, S.; Molotch, N.; Williams, M.; Rittger, K.; Sickman, J. Interannual variability of snowmelt in the Sierra Nevada and Rocky Mountains, United States: Examples from two alpine watersheds. Water Resour. Res. 2012, 48, W02529. [Google Scholar] [CrossRef] [Green Version]
  24. Anderson, E.A. A Point Energy and Mass Balance Model of a Snow Cover; Technical Report; National Weather Service: Silver Spring, MD, USA, 1976.
  25. Derksen, C.; Lemmetyinen, J.; Toose, P.; Silis, A.; Pulliainen, J.; Sturm, M. Physical properties of Arctic versus subarctic snow: Implications for high latitude passive microwave snow water equivalent retrievals. J. Geophys. Res. Atmos. 2014, 119, 7254–7270. [Google Scholar] [CrossRef]
  26. Helfricht, K.; Hartl, L.; Koch, R.; Marty, C.; Olefs, M. Obtaining sub-daily new snow density from automated measurements in high mountain regions. Hydrol. Earth Syst. Sci. 2018, 22, 2655–2668. [Google Scholar] [CrossRef] [Green Version]
  27. Takala, M.; Luojus, K.; Pulliainen, J.; Derksen, C.; Lemmetyinen, J.; Kärnä, J.-P.; Koskinen, J.; Bojkov, B. Estimating Northern Hemisphere snow water equivalent for climate research through assimilation of space-borne radiometer data and ground-based measurements. Remote Sens. Environ. 2011, 115, 3517–3529. [Google Scholar] [CrossRef]
  28. Cao, B.; Gruber, S.; Zheng, D.; Li, X. The ERA5-Land soil temperature bias in permafrost regions. Cryosphere 2020, 14, 2581–2595. [Google Scholar] [CrossRef]
  29. Cao, B.; Arduini, G.; Zsoter, E. Brief communication: Improving ERA5-Land soil temperature in permafrost regions using an optimized multi-layer snow scheme. Cryosphere 2022, 16, 2701–2708. [Google Scholar] [CrossRef]
  30. Xue, Y.; Sun, S.; Kahan, D.; Jiao, Y. Impact of parameterizations in snow physics and interface processes on the simulation of snow cover and runoff at several cold region sites. J. Geophys. Res. 2003, 108, 8859. [Google Scholar] [CrossRef]
  31. Schwank, M.; Matzler, C.; Wiesmann, A.; Wegmuller, U.; Pulliainen, J.; Lemmetyinen, J.; Rautiainen, K.; Derksen, C.; Toose, P.; Drusch, M. Snow Density and Ground Permittivity Retrieved from L-Band Radiometry: A Synthetic Analysis. IEEE J. Sel. Top. Appl. Earth Obs. Remote Sens. 2015, 8, 3833–3845. [Google Scholar] [CrossRef]
  32. Conger, S.; McClung, D. Instruments and Methods Comparison of density cutters for snow profile observations. J. Glaciol. 2009, 55, 163–169. [Google Scholar] [CrossRef] [Green Version]
  33. Matzl, M.; Schneebeli, M. Stereological measurement of the specific surface area of seasonal snow types: Comparison to other methods, and implications for mm-scale vertical profiling. Cold Reg. Sci. Technol. 2010, 64, 1–8. [Google Scholar] [CrossRef]
  34. Lundy, C.; Edens, M.; Brown, R. Measurement of snow density and microstructure using computed tomography. J. Glaciol. 2002, 48, 312–316. [Google Scholar] [CrossRef] [Green Version]
  35. Kaur, S.; Satyawali, P. Estimation of snow density from SnowMicroPen measurements. Cold Reg. Sci. Technol. 2016, 134, 1–10. [Google Scholar] [CrossRef]
  36. Sheng, J.; Mind’je, R.; Ting, F.; Li, L. Performance of snow density measurement systems in snow stratigraphies. Hydrol. Res. 2021, 52, 834–846. [Google Scholar]
  37. Valt, M.; Guyennon, N.; Salerno, F.; Petrangeli, A.B.; Salvatori, R.; Cianfarra, P.; Romano, E. Predicting new snow density in the Italian Alps: A variability analysis based on 10 years of measurements. Hydrol. Process. 2018, 32, 3174–3187. [Google Scholar] [CrossRef]
  38. Fassnacht, S.R.; Heun, C.; López-Moreno, J.I.; Latron, J. Variability of Snow Density Measurements in the Rio Esera Valley, Pyrenees Mountains, Spain. Cuad. Investig. Geogr. 2013, 36, 59–72. [Google Scholar] [CrossRef] [Green Version]
  39. You, Q.; Cai, Z.; Pepin, N.; Chen, D.; Ahrens, B.; Jiang, Z.; Wu, F.; Kang, S.; Zhang, R.; Wu, T.; et al. Warming amplification over the Arctic Pole and Third Pole: Trends, mechanisms and consequences. Earth-Sci. Rev. 2021, 217, 103625. [Google Scholar] [CrossRef]
  40. Cohen, J.; Screen, J.; Furtado, J.; Barlow, M.; Whittleston, D.; Coumou, D.; Francis, J.; Dethloff, K.; Entekhabi, D.; Overland, J.; et al. Recent Arctic amplification and extreme mid-latitude weather. Nat. Geosci. 2014, 7, 627–637. [Google Scholar] [CrossRef] [Green Version]
  41. Tang, Z.; Deng, G.; Hu, G.; Zhang, H.; Pan, H.; Sang, G. Satellite observed spatiotemporal variability of snow cover and snow phenology over high mountain Asia from 2002 to 2021. J. Hydrol. 2022, 613, 128438. [Google Scholar] [CrossRef]
  42. Tang, Z.; Wang, X.; Deng, G.; Wang, X.; Jiang, Z.; Sang, G. Spatiotemporal variation of snowline altitude at the end of melting season across High Mountain Asia, using MODIS snow cover product. Adv. Space Res. 2020, 66, 2629–2645. [Google Scholar] [CrossRef]
  43. Wang, J.; Tang, Z.; Deng, G.; Hu, G.; You, Y.; Zhao, Y. Landsat Satellites Observed Dynamics of Snowline Altitude at the End of the Melting Season, Himalayas, 1991–2022. Remote Sens. 2023, 15, 2534. [Google Scholar] [CrossRef]
  44. He, L.; Li, Z.-L.; Wang, X.; Xie, Y.; Ye, J.-S. Lagged precipitation effect on plant productivity is influenced collectively by climate and edaphic factors in drylands. Sci. Total Environ. 2021, 755, 142506. [Google Scholar] [CrossRef] [PubMed]
  45. He, L.; Xie, Y.; Wang, J.; Zhang, J.; Si, M.; Guo, Z.; Ma, C.; Bie, Q.; Li, Z.-L.; Ye, J.-S. Precipitation regimes primarily drive the carbon uptake in the Tibetan Plateau. Ecol. Indic. 2023, 154, 110694. [Google Scholar] [CrossRef]
  46. Tang, Z.; Wang, J.; Li, H.; Liang, J.; Li, C.; Wang, X. Extraction and assessment of snowline altitude over the Tibetan plateau using MODIS fractional snow cover data (2001 to 2013). J. Appl. Remote Sens. 2014, 8, 084689. [Google Scholar] [CrossRef]
  47. Kershaw, G.; McCulloch, J. Midwinter Snowpack Variation Across the Arctic Treeline, Churchill, Manitoba, Canada. Arct. Antarct. Alp. Res. 2007, 39, 9–15. [Google Scholar] [CrossRef] [Green Version]
  48. King, J.; Howell, S.; Brady, M.; Toose, P.; Derksen, C.; Haas, C.; Beckers, J. Local-scale variability of snow density on Arctic sea ice. Cryosphere 2020, 14, 4323–4339. [Google Scholar] [CrossRef]
  49. Ma, L.; Qin, D. Spatial-Temperal Characteristics of Observed Key Parameters for Snow Cover in China during 1957–2009. J. Glaciol. Geocryol. 2012, 34, 1–11. (In Chinese) [Google Scholar]
  50. Dai, L.; Che, T. The Spatio-Temperal Distribution of Snow Density and Its Influence Factors from 1999 to 2008 in China (in Chinese). J. Glaciol. Geocryol. 2010, 32, 861–866. [Google Scholar]
  51. Stuefer, S.L.; Kane, D.L.; Dean, K.M. Snow Water Equivalent Measurements in Remote Arctic Alaska Watersheds. Water Resour. Res. 2020, 56, e2019WR025621. [Google Scholar] [CrossRef] [Green Version]
  52. AMAP. Snow, Water, Ice and Permafrost in the Arctic (SWIPA) 2017; Arctic Monitoring and Assessment Programme (AMAP); AMAP: Oslo, Norway, 2017; pp. xiv + 269. [Google Scholar]
  53. Zhong, X.; Zhang, T.; Wang, K. Snow density climatology across the former USSR. Cryosphere 2014, 8, 785–799. [Google Scholar] [CrossRef] [Green Version]
  54. Liston, G.E.; Sturm, M. Global Seasonal-Snow Classification, Version 1; [Dataset]; National Snow and Ice Data Center: Boulder, CO, USA, 2021; Available online: https://nsidc.org/data/NSIDC-0768/versions/1 (accessed on 12 April 2022).
  55. Sturm, M.; Liston, G. Revisiting the Global Seasonal Snow Classification: An Updated Dataset for Earth System Applications. J. Hydrometeorol. 2021, 22, 2917–2938. [Google Scholar] [CrossRef]
  56. Muñoz Sabater, J. ERA5-Land Hourly Data from 1981 to Present; [Dataset]; Copernicus Climate Change Service (C3S) Climate Data Store (CDS): Reading, UK, 2019; Available online: https://cds.climate.copernicus.eu/cdsapp#!/dataset/reanalysis-era5-land?tab=form (accessed on 11 June 2022).
  57. Tolsdorf, T. Part622 National Engineering Handbook; United States Department of Agriculture, Natural Resources Conservation Service: Washington, DC, USA, 2010.
  58. Dawson, N.; Broxton, P.; Zeng, X.; Leuthold, M.; Barlage, M.; Holbrook, P. An Evaluation of Snow Initializations in NCEP Global and Regional Forecasting Models. J. Hydrometeorol. 2016, 17, 1885–1901. [Google Scholar] [CrossRef]
  59. Serreze, M.; Clark, M.; Armstrong, R.; McGinnis, D.; Pulwarty, R. Characteristics of the Western United States Snowpack from Snowpack Telemetry (SNOTEL) Data. Water Resour. Res. 1999, 35, 2145–2160. [Google Scholar] [CrossRef] [Green Version]
  60. Fassnacht, S.R.; López-Moreno, J.I. Patterns of trends in niveograph characteristics across the western United States from snow telemetry data. Front. Earth Sci. 2020, 14, 315–325. [Google Scholar] [CrossRef]
  61. Bulygina, O.; Groisman, P.; Razuvaev, V.; Korshunova, N. Changes in snow cover characteristics over Northern Eurasia since 1966. Environ. Res. Lett. 2011, 6, 045204. [Google Scholar] [CrossRef]
  62. Krenke, A. Former Soviet Union Hydrological Snow Surveys, 1966–1996; Version 1; NSIDC, National Snow and Ice Data Center: Boulder, CO, USA, 2002. [Google Scholar]
  63. NCDC. Documention for Data Set 3200 (DSI-3200); National Climatic Data Center: Asheville, NC, USA, 2006; p. 16.
  64. Doesken, N.J.; Judson, A. The Snow Booklet: A Guide to the Science, Climatology, and Measurement of Snow in the United States; Colorado Climate Center, Department of Atmospheric Science, Colorado State University: Fort Collins, CO, USA, 1997. [Google Scholar]
  65. Mote, T.; Grundstein, A.; Leathers, D.; Robinson, D. A comparison of modeled, remotely sensed, and measured snow water equivalent in the Northern Great Plains. Water Resour. Res. 2003, 39, 1209. [Google Scholar] [CrossRef] [Green Version]
  66. Dixon, D.; Boon, S. Comparison of the SnowHydro snow sampler with existing snow tube designs. Hydrol. Process. 2012, 26, 2555–2562. [Google Scholar] [CrossRef]
  67. Braaten, R. Canadian Snow Water Equivalent Database Main Documentation; Environment Canada, Climate Processes and Earth Observation Division: Dorval, QC, Canada, 1995; p. 25. [Google Scholar]
  68. Fang, B. Update of Canadian Historical Snow Survey Dataset; Environment and Climate Change Canada, Climate Research Division: Toronto, ON, Canada, 2017; p. 30.
  69. Brown, R.; Fang, B.; Mudryk, L. Update of Canadian Historical Snow Survey Data and Analysis of Snow Water Equivalent Trends, 1967–2016. Atmosphere-Ocean 2019, 57, 149–156. [Google Scholar] [CrossRef]
  70. CMA. Specifications for Surface Meteorological Observation-Snow Depth and Snow Pressure; China Meteorological Press: Beijing, China, 2017.
  71. Oyler, J.; Dobrowski, S.; Ballantyne, A.; Klene, A.; Running, S. Artificial Amplification of Warming Trends Across the Mountains of the Western United States. Geophys. Res. Lett. 2014, 42, 153–161. [Google Scholar] [CrossRef] [Green Version]
  72. Currier, W.; Thorson, T.; Lundquist, J. Independent Evaluation of Frozen Precipitation from WRF and PRISM in the Olympic Mountains, WA, USA. J. Hydrometeorol. 2017, 18, 2681–2703. [Google Scholar] [CrossRef]
  73. ECCC. Digital Archive of Canadian Climatological Data; Environment and Climate Change Canada: Montréal, QC, Canada, 2018.
  74. CMA. Standard Format of Documentation for Meteorological Dataset; China Meteorological Data Service Center: Beijing, China, 2012.
  75. Jennings, K.S.; Winchell, T.S.; Livneh, B.; Molotch, N.P. Spatial variation of the rain–snow temperature threshold across the Northern Hemisphere. Nat. Commun. 2018, 9, 1148. [Google Scholar] [CrossRef] [Green Version]
  76. Brown, R.D. Northern Hemisphere Snow Cover Variability and Change, 1915–1997. J. Clim. 2000, 13, 2339–2355. [Google Scholar] [CrossRef]
  77. Derksen, C.; Sturm, M.; Liston, G.; Holmgren, J.; Huntington, H.; Silis, A.; Solie, D. Northwest Territories and Nunavut Snow Characteristics from a Subarctic Traverse: Implications for Passive Microwave Remote Sensing. J. Hydrometeorol. 2009, 10, 448–463. [Google Scholar] [CrossRef]
  78. Wang, H.; Zhang, X.; Xiao, P.; Che, T.; Zheng, Z.; Dai, L.; Luan, W. Towards Large-Scale Daily Snow Density Mapping with Spatiotemporally Aware Model and Multi-Source Data. Cryosphere Discuss. 2022, 17, 33–50. [Google Scholar] [CrossRef]
  79. Guyennon, N.; Valt, M.; Salerno, F.; Petrangeli, A.B.; Romano, E. Estimating the snow water equivalent from snow depth measurements in the Italian Alps. Cold Reg. Sci. Technol. 2019, 167, 102859. [Google Scholar] [CrossRef]
  80. Pulliainen, J.; Hallikainen, M. Retrieval of Regional Snow Water Equivalent from Space-Borne Passive Microwave Observations. Remote Sens. Environ. 2001, 75, 76–85. [Google Scholar] [CrossRef]
  81. Dutra, E.; Balsamo, G.; Viterbo, P.; Miranda, P.M.A.; Beljaars, A.; Schär, C.; Elder, K. An Improved Snow Scheme for the ECMWF Land Surface Model: Description and Offline Validation. J. Hydrometeorol. 2010, 11, 899–916. [Google Scholar] [CrossRef]
  82. RIHMI-WDC: Russian Research Institute for Hydro-Meteorological Information-World Data Center. [Dataset]. Available online: http://meteo.ru/data (accessed on 21 July 2020).
  83. NCAR: National Center for Atmospheric Research. [Dataset]. Available online: https://rda.ucar.edu/datasets/ds510.0/ (accessed on 1 September 2020).
  84. NWCC: National Water and Climate Center. [Dataset]. Available online: https://www.nrcs.usda.gov/wps/portal/wcc/home/snowClimateMonitoring/snowpack (accessed on 11 October 2020).
  85. MSC: Meteorological Service of Canada. [Dataset]. Available online: https://dd.weather.gc.ca/climate/observations/daily/csv/ (accessed on 9 July 2020).
  86. CMA: China Meteorological Administration. [Dataset]. Available online: http://data.cma.cn/en/ (accessed on 28 July 2020).
Figure 2. Average climatological snow densities (a) over the TP and the Arctic, (b) over different regions in the Arctic, and (c) from different datasets in Alaska. Error bars represent standard deviations.
Remotesensing 15 03976 g002
Figure 3. (a) Snow site number with elevation, (b) Snow density with elevation, (c) Average snow depth with one standard deviation from the mean in Alaska.
Remotesensing 15 03976 g003
Figure 4. Average snow densities (colored columns) with one standard deviation (black bars) for each snow class over the TP and the Arctic.
Remotesensing 15 03976 g004
Figure 5. Monthly mean snow densities (mean ± sd) over the TP (a) and the Arctic (b).
Remotesensing 15 03976 g005
Figure 6. Monthly mean snow densities (mean ± sd) for each snow class (af) over the TP and the Arctic.
Remotesensing 15 03976 g006
Figure 7. Monthly air temperature (a,d), snowfall (b,e), and wind (c,f) over the TP and the Arctic (black bars denote one standard deviation).
Remotesensing 15 03976 g007
Figure 8. Dependence of average snow density on average air temperature (a,d), average snowfall (b,e), and average wind speed (c,f) over the TP and the Arctic. (Snowfall and wind speed were averages for January).
Remotesensing 15 03976 g008
Figure 9. Accumulative snowfall, daily snowfall, air temperature, and snow density from three sites at Qing Shuihe (ac), Monument Creek (df), and Salehard (gi) during the snow season. The orange line (middle) indicates the duration from the beginning to the end of the snowfall.
Remotesensing 15 03976 g009
Table 1. Meta information on the different datasets.
Disclaimer/Publisher’s Note: The statements, opinions and data contained in all publications are solely those of the individual author(s) and contributor(s) and not of MDPI and/or the editor(s). MDPI and/or the editor(s) disclaim responsibility for any injury to people or property resulting from any ideas, methods, instructions or products referred to in the content.

