Article

Edge Real-Time Object Detection and DPU-Based Hardware Implementation for Optical Remote Sensing Images

College of Computer and Control Engineering, Northeast Forestry University, Harbin 150040, China
*
Author to whom correspondence should be addressed.
Remote Sens. 2023, 15(16), 3975; https://doi.org/10.3390/rs15163975
Submission received: 3 July 2023 / Revised: 3 August 2023 / Accepted: 7 August 2023 / Published: 10 August 2023

Abstract

:
The accuracy of current deep learning algorithms has certainly increased. However, deploying deep learning networks on edge devices with limited resources is challenging due to their inherent depth and high parameter count. Here, we proposed an improved YOLO model based on an attention mechanism and receptive field (RFA-YOLO) model, applying the MobileNeXt network as the backbone to reduce parameters and complexity, adopting the Receptive Field Block (RFB) and Efficient Channel Attention (ECA) modules to improve the detection accuracy of multi-scale and small objects. Meanwhile, an FPGA-based model deployment solution was proposed to implement parallel acceleration and low-power deployment of the detection algorithm model, which achieved real-time object detection for optical remote sensing images. We implement the proposed DPU and Vitis AI-based object detection algorithms with FPGA deployment to achieve low power consumption and real-time performance requirements. Experimental results on DIOR dataset demonstrate the effectiveness and superiority of our RFA-YOLO model for object detection algorithms. Moreover, to evaluate the performance of the proposed hardware implementation, it was implemented on a Xilinx ZCU104 board. Results of the experiments for hardware and software simulation show that our DPU-based hardware implementation are more power efficient than central processing units (CPUs) and graphics processing units (GPUs), and have the potential to be applied to onboard processing systems with limited resources and power consumption.

Graphical Abstract

1. Introduction

Target detection can efficiently identify and extract various object information in images, such as buildings, roads, crops, etc. It is an essential method for Earth observation and has a wide range of applications in environmental monitoring, ocean monitoring, urban planning and forestry engineering. However, there are various challenges in object detection from large amounts of data. First, images with high spatial resolution contain hundreds of millions of pixels. Thus, it is difficult to detect from a huge amount of data. Moreover, objects with multi-scale features present challenges when training with natural images for remote sensing object detection, resulting in suboptimal detection performance.
Traditional techniques for object recognition use artificial features and prior knowledge, Deep learning object detection techniques are the main approaches for recognition. Traditional target identification techniques based on the template sliding window approach include Histogram of Oriented Gradient (HOG) [1] and Scale Invariant Feature Transform (SIFT) [2]. The approach is complex and places undue reliance on manually aggregating and summarizing past knowledge of colors, textures, edges, and other properties. Deep-learning-based object detection algorithms use convolutional neural networks to automatically learn features instead of relying on prior knowledge to manually design templates, and have stronger feature extraction capabilities, higher adaptability to complex scenes, and clear advantages in terms of detection accuracy and speed. Deep learning has made significant advances in computer vision related fields in recent years.The 2012 ImageNet Large Scale Visual Recognition Challenge (ILSVR 2012), which was won by AlexNet offered by A. Krizhevsky et al. [3], considerably advanced the study of deep learning in the area of image processing [4]. Since then, a wide range of excellent deep learning algorithms have developed; most of them not only increase the detection accuracy, but also add a large number of model parameters [5]. Currently, central processing units (CPUs) and graphics processing units (GPUs) are mostly used in terms of deep learning algorithm training and inference, while CPUs have better computing ability, and definitely could achieve better efficiency and results. GPUs are commonly employed due to their superior parallel processing capabilities. However, due to their extreme power consumption, they cannot achieve a perfect performance-to-power ratio. In some specific applications, extra stringent power consumption constraints are necessary [6]. General purpose CPUs and GPUs, for example, are not easy to adapt to the application requirements in embedded application.
The large number of parameters in deep convolutional neural models makes it challenging to deploy them from large servers to embedded devices with constrained memory and processing capabilities. It is now necessary to find more efficient models and hardware implementations of object detection algorithms for remote sensing photos. Thanks to emerging communication technologies such as 5G, everything can be connected. In remote sensing observation scenarios such as UAV dynamic real-time monitoring, on-board intelligent information processing systems can not only significantly reduce transmission bandwidth, processing time, and resource consumption, but also perform monitoring tasks more efficiently, adaptively, and quickly [7,8]. Consequently, the task of developing accurate and lightweight algorithmic models that can seamlessly integrate with edge computing systems like aerial information processing systems has become increasingly challenging. In this context, researchers start to develop on-board real-time information processing systems using Field Programmable Gate Arrays (FPGAs) and application-specific Integrated Circuits (ASICs) [9]. FPGAs and ASICs offer the benefits of superior performance and low power consumption compared to CPUs and GPUs. FPGA is the perfect deployment platform for CNN due to its short development period and greater reconfiguration than ASIC. A FPGA-based YOLOv4 road surface detection system was proposed by Chen et al. [10]. The Vitis AI framework was used for the quantization and deployment of YOLOv4. The network structure of YOLOv4 was not improved or made lighter by its design, which resulted in lower average detection accuracy and detection speed for their final detection system.
Zynq UltraScale+ MPSoC is a system-on-chip (SOC) that integrates a processor system and programmable logic. The DPU of the Zynq UltraScale+ MPSoC is co-designed with both ARM processors and FPGA programmable logic. Specifically, the DPU is located in the FPGA section of the Zynq UltraScale+ MPSoC chip, while the accompanying ARM processor is used for system-level control and management. The DPU is a hardware acceleration unit in the Zynq UltraScale+ MPSoC architecture, specifically designed for deep learning inference tasks. It utilizes the programmable logic resources of an FPGA to accelerate the inference process of neural network models through efficient matrix operations and hardware optimizations. The design and implementation of the DPU is based on FPGA technology. Meanwhile, the Zynq UltraScale+ MPSoC chip also incorporates ARM Cortex-A series processors, which are responsible for system-level control, management, and processing tasks. The ARM processor handles communication, data transfer, neural network control, and other operations with the FPGA section. They provide software support and interfaces that enable collaboration between FPGA and ARM processors to achieve high performance acceleration for deep learning inference tasks.
Overall, we present an optimized real-time object recognition model for optical remote sensing images specifically designed for the Xilinx DPU. Our approach involves compressing the model with minimal accuracy loss while leveraging the Xilinx Zynq UltraScale+ architecture to implement a hardware acceleration system. The result is a solution that effectively balances detection speed, accuracy, and power usage. These are our primary contributions, in brief:
  • We proposed a lightweight backbone network and feature fusion neck network YOLO model with attention mechanism and receptive field (RFA-YOLO) for optical remote sensing images. Depth separable convolution and SandGlass block was used to reduce the model parameters, and the RFB and the ECA module was carried out to improve the detection accuracy for small object detection;
  • We adopt Vitis AI platform and Deep learning Processing Unit (DPU) on a Field Programmable Gate Array (FPGA) to achieve parallelism acceleration and low power deployment, thus implement airborne real-time object detection of aerial remote sensing images;
  • We evaluate the efficiency of the proposed RFA-YOLO model and hardware implementation through experimental and simulation validation. The RFA-YOLO model has better performance compared to several other popular algorithmic models on the DIOR dataset.

2. Related Work

2.1. Object Detection of Remote Sensing Images

Deep-learning-based object detection algorithms have achieved good results on general purpose images, but not in remote sensing images, where the scale of remote sensing image objects varies greatly due to different imaging principles, which leads to increased detection difficulties. Recently, scholars have started to research on multi-scale object detection from different aspects such as improving the backbone network, increasing the receptive field, multi-scale feature fusion, and model training strategies. UAV-YOLO [11] optimizes the residual block in the Darknet53 network by connecting two residual units on the basis of YOLOv3 structure and increasing the number of convolutional layers to achieve small object detection in UAV view; Osco et al. [12] estimated citrus trees in high-density orchards by using the confidence level of plant occurrence in each pixel to estimate the dense map; the DetNet network [13] improved the quality of feature extraction by modifying the output of stage 4 and stage 5 and adding the output of stage 6 while retaining the first three stages of ResNet50; the DenseNet network [14] significantly reduced parameters through the use of dense blocks and the connections between them and, to some extent, the problem of gradient disappearance and model degradation is alleviated, making the network easier to train and extract more effective features; RFB-Net [15] adds an inflated convolution to Inception [16], which effectively increases the perceptual field and improves the detection accuracy. Although these deep learning networks are showing better and better performance, there are many limitations to their application at the edge computing.
The attention mechanism of deep learning is an imitation of human attention, which could allocate computing resources appropriately and solve the problem of information overload [17,18]. Squeeze Excitation (SE) attention [19], as a typical representation of channel attention, is an excellent method to construct the inter-dependence between channels, but the position dimension is often ignored in semantic segmentation. Convolutional Block Attention (CBAM) could connect channel and spatial attention with two independent dimensions by global average pooling. However, its long-term dependence information cannot be obtained because of the lack of correlation between the two dimensions [20,21]. As a supplement, Coordinated Attention (CA) can decompose channel attention into two one-dimensional encoding processes and rearrange features in two spatial directions. This allows for capturing dependencies in one spatial direction while retaining accurate positional information in another spatial direction [22]. Unlike SE, Efficient Channel Attention (ECA) implements a local cross-channel interaction strategy without the need for dimensionality reduction and can be effectively implemented through one-dimensional convolution [23]. Therefore, incorporating the attention module into the object detection network for remote sensing images can effectively improve the performance of the network.

2.2. Hardware Accelerator of Deep Learning

In addition, deep learning models require very high computational and storage capacities, which usually need the support of high-performance graphics processing units (GPUs). In 2006, NVIDIA published CUDA [24], which is a parallel computing platform for NVIDIA’s GPUs in order to solve more complex computing problems more efficiently. However, edge devices such as airborne intelligent information processing systems have strict limitations on power, latency, and resources, so more and more scholars are committed to the research of convolutional neural network (CNN) hardware accelerators to explore the parallelization and low-power potential of CNNs on different hardware architectures. The rich logic resources of Field Programmable Gate Array (FPGA) can highly parallelize the accelerated computation of CNNs with high performance, low power consumption, and high flexibility, and has been applied in many fields. The Roofline model [25] has achieved a theoretical limit value calculation of FPGA resource utilization, and Neuraghe architecture [26] has achieved software and hardware collaborative CNN acceleration. The Eyeriss team [27] proposed a new data flow structure to further improve the parallelism of data flow acceleration CNNs, and in the same year, Meloni et al. also proposed the Neuraghe architecture [26], which realizes CNN acceleration of software and hardware collaboration. Kyungho Kim et al. [28] modeled the backbone network based on SqueezeNet and proposed an energy-efficient processing unit for 3D tensor computation to achieve real-time object detection on Xilinx ZC702 FPGA hardware. Lin Li, Shengbing Zhang, et al. [29] use parallel and hierarchical on-chip memory organization for parallel data processing, weight sharing and reuse, and efficient data caching, which reduces the performance bottleneck caused by memory IO and realizes the hardware acceleration processing of remote sensing image target detection algorithm. Wei Dinga, Zeyu Huanga, et al. [30] realized FPGA-based deep separable convolutional hardware acceleration by using double-buffered-based memory channels to process data flow between adjacent layers, and using data slicing technology to decompose matrix multiplication from large dimensions to small matrices. Duy Thanh Nguyen et al. [31] used parameter binary quantization and low-level activation function to compress the YOLO model, and designed a fully streamlined convolutional neural network accelerator to realize the high-performance accelerated computing of the YOLO algorithm on VC707 FPGA hardware.
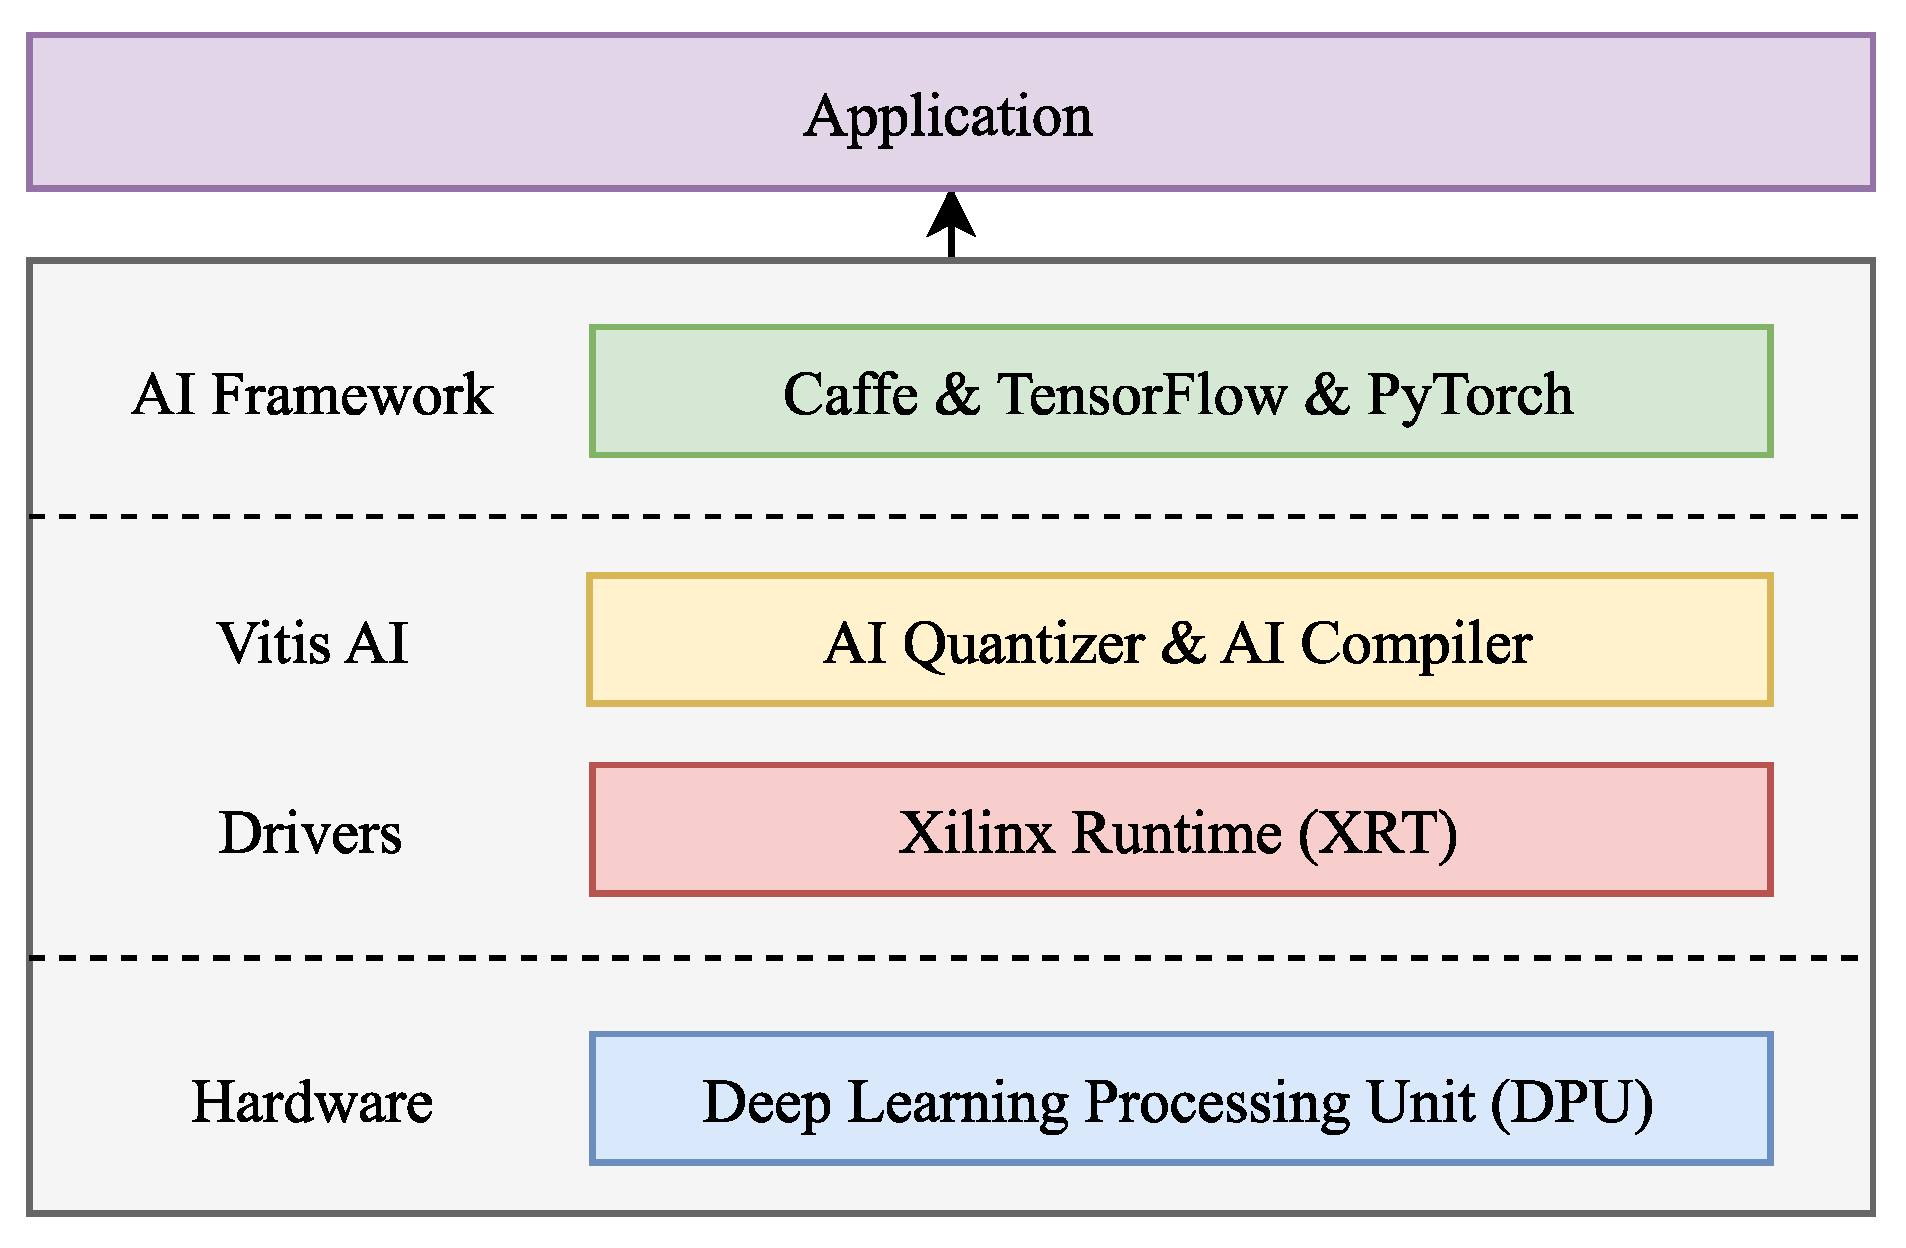
The DPU intellectual property cores (IP cores) released by Xilinx support rich basic functions of deep learning, using pipelining, batch processing, and cyclic unfolding to achieve parallel computation of convolutional neural networks, supporting the acceleration of convolutional and recurrent neural networks, and developers have the option to utilize the Vitis AI development kit provided, enabling them to convert widely-used deep learning models.
This facilitates the porting and adaptation of deep learning models to the DPU platform. However, DPU also supports very limited basic operators, and it is still difficult to directly accelerate the adaptation of existing advanced complex models.
Research on hardware accelerators for CNN and object detection algorithm models typically fall under different domains, with many researchers focusing on them independently. However, we adopt a collaborative approach that combines software algorithm optimization with hardware structure optimization. By employing a universal and straightforward hardware acceleration scheme, we enhance the software algorithm to better suit the target hardware platform. This integrated methodology allows us to successfully implement a comprehensive real-time object detection system for optical remote sensing images.

3. Methods

In this section, we initially selected YOLO and DPU as the baseline for object detection algorithms and hardware acceleration architectures, respectively.
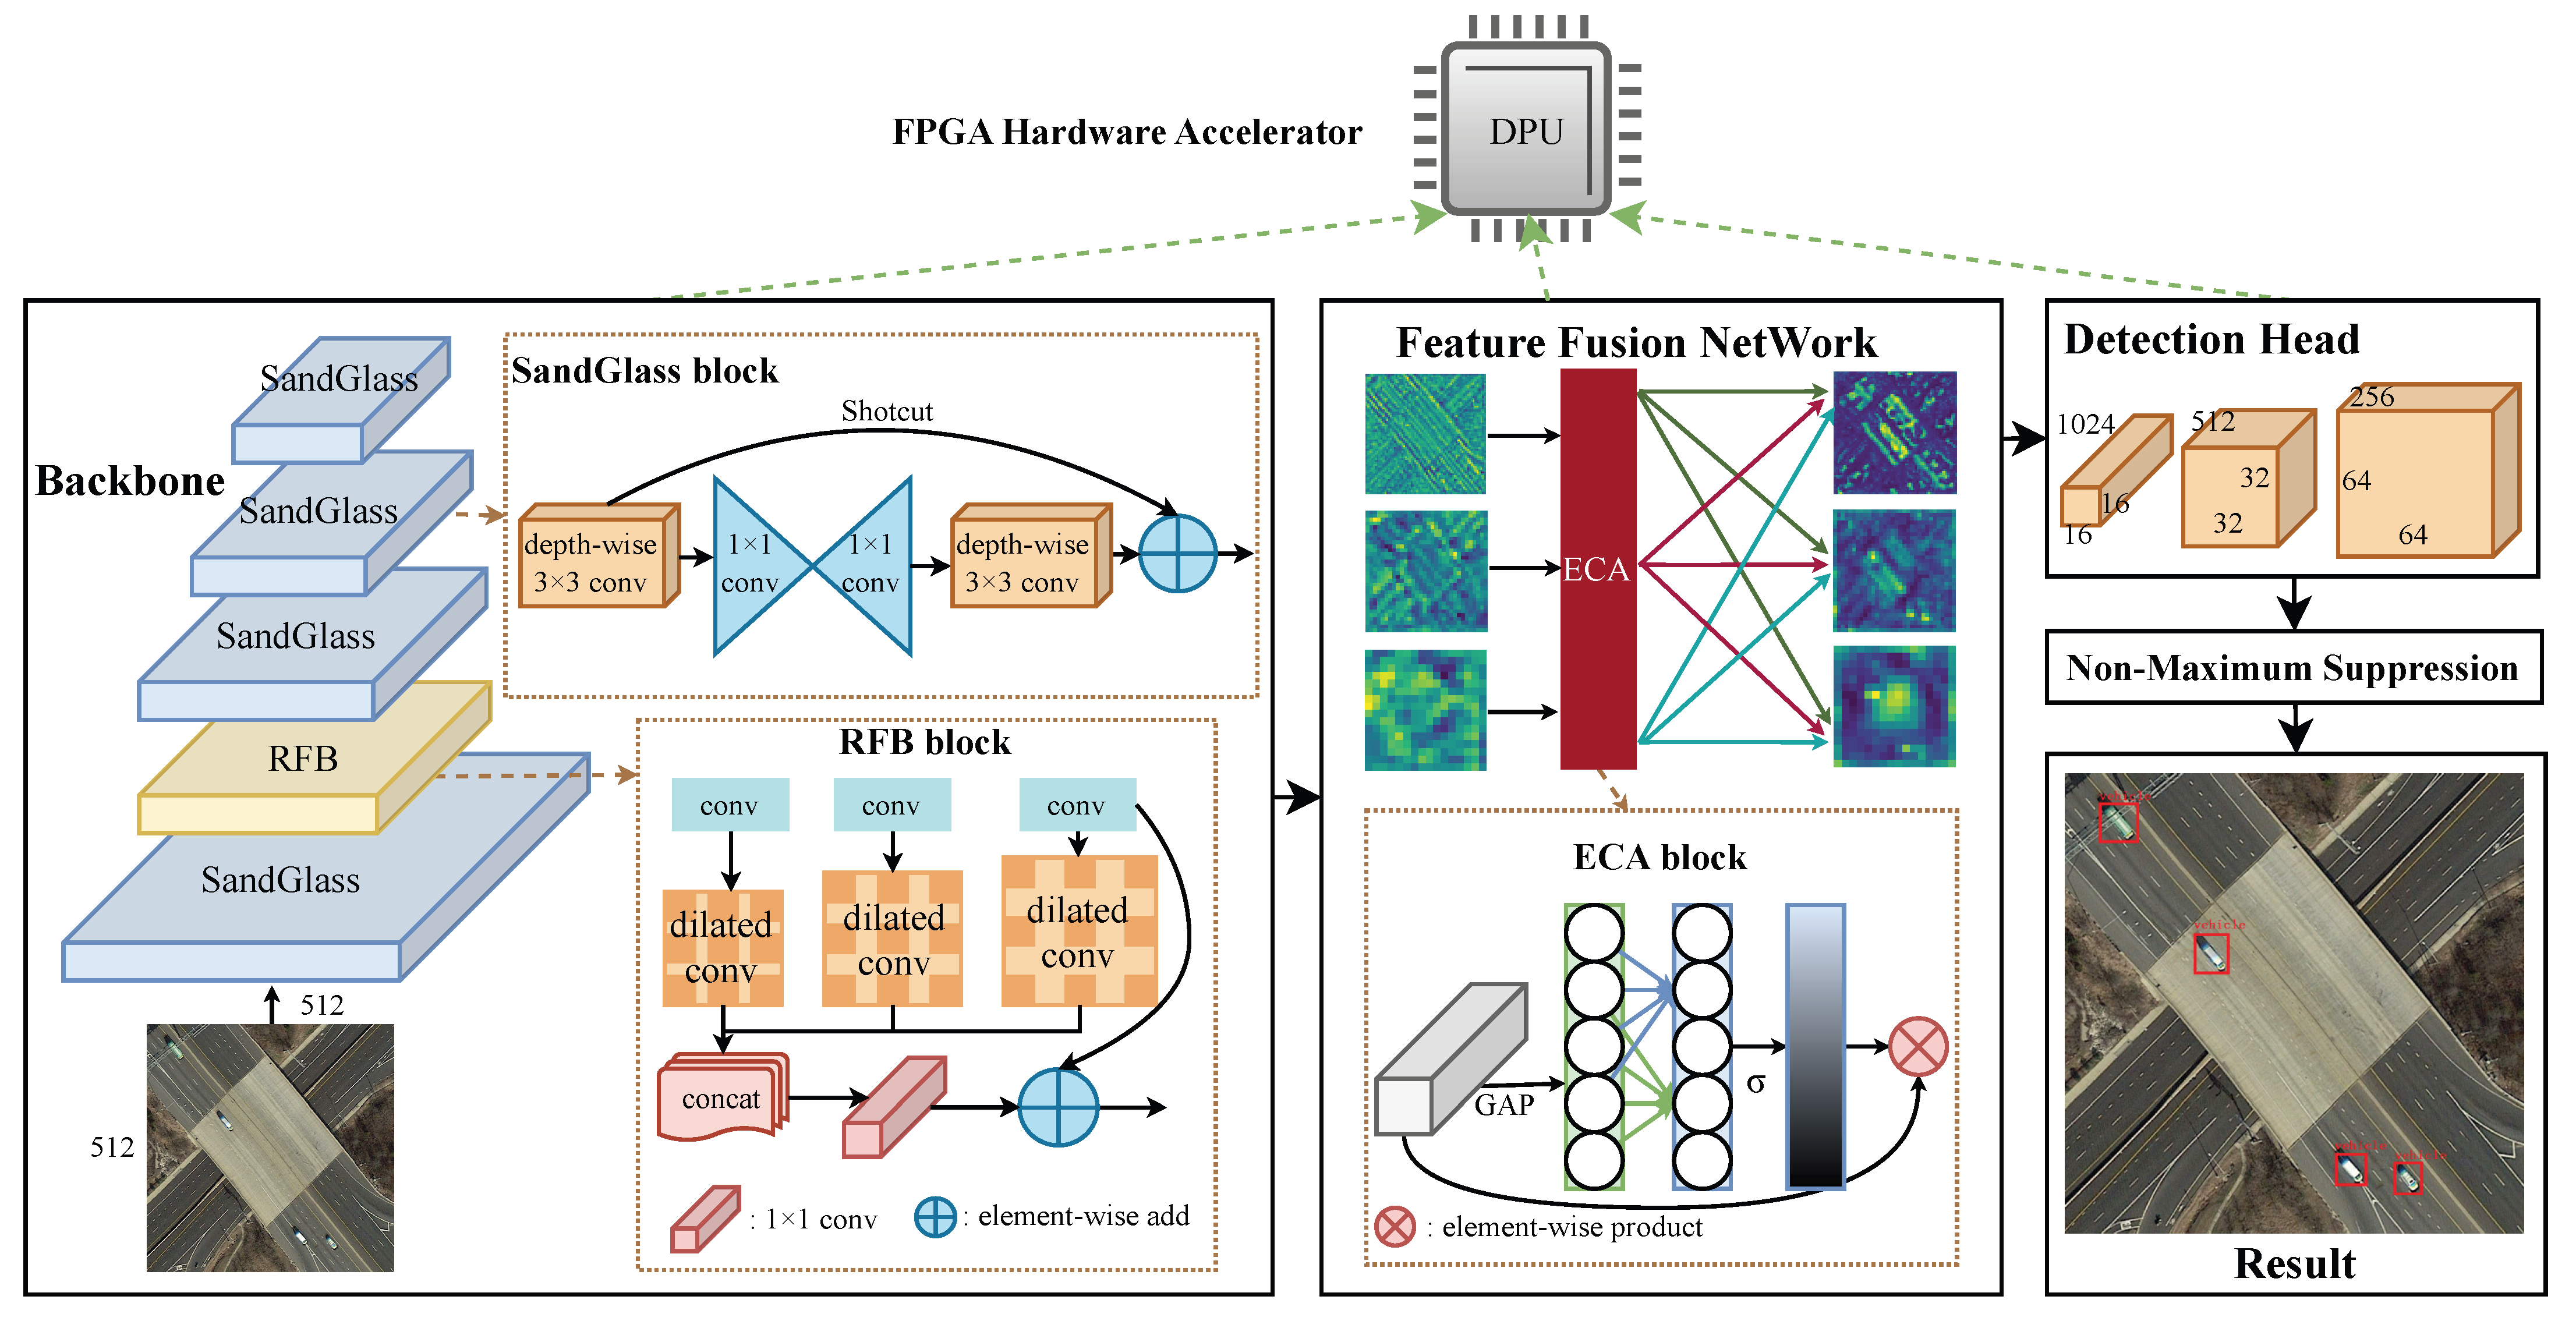
We then introduced a novel YOLO model, called RFA-YOLO, which incorporates attention mechanism and receptive field for improved performance on optical remote sensing images. The model comprises a lightweight MobileNext-RFB backbone network for multi-scale feature extraction, followed by a lightweight PAN-lite feature fusion network and ECA module to enhance and fuse semantic information from different scales of feature maps. The fused features are then used for regression to predict the detection results. Furthermore, we demonstrate the adaptation of the object detection model to the DPU Accelerator, enabling low-power embedded deployment. The design framework flowchart is illustrated in Figure 1.

3.1. MobileNext-RFB Backbone

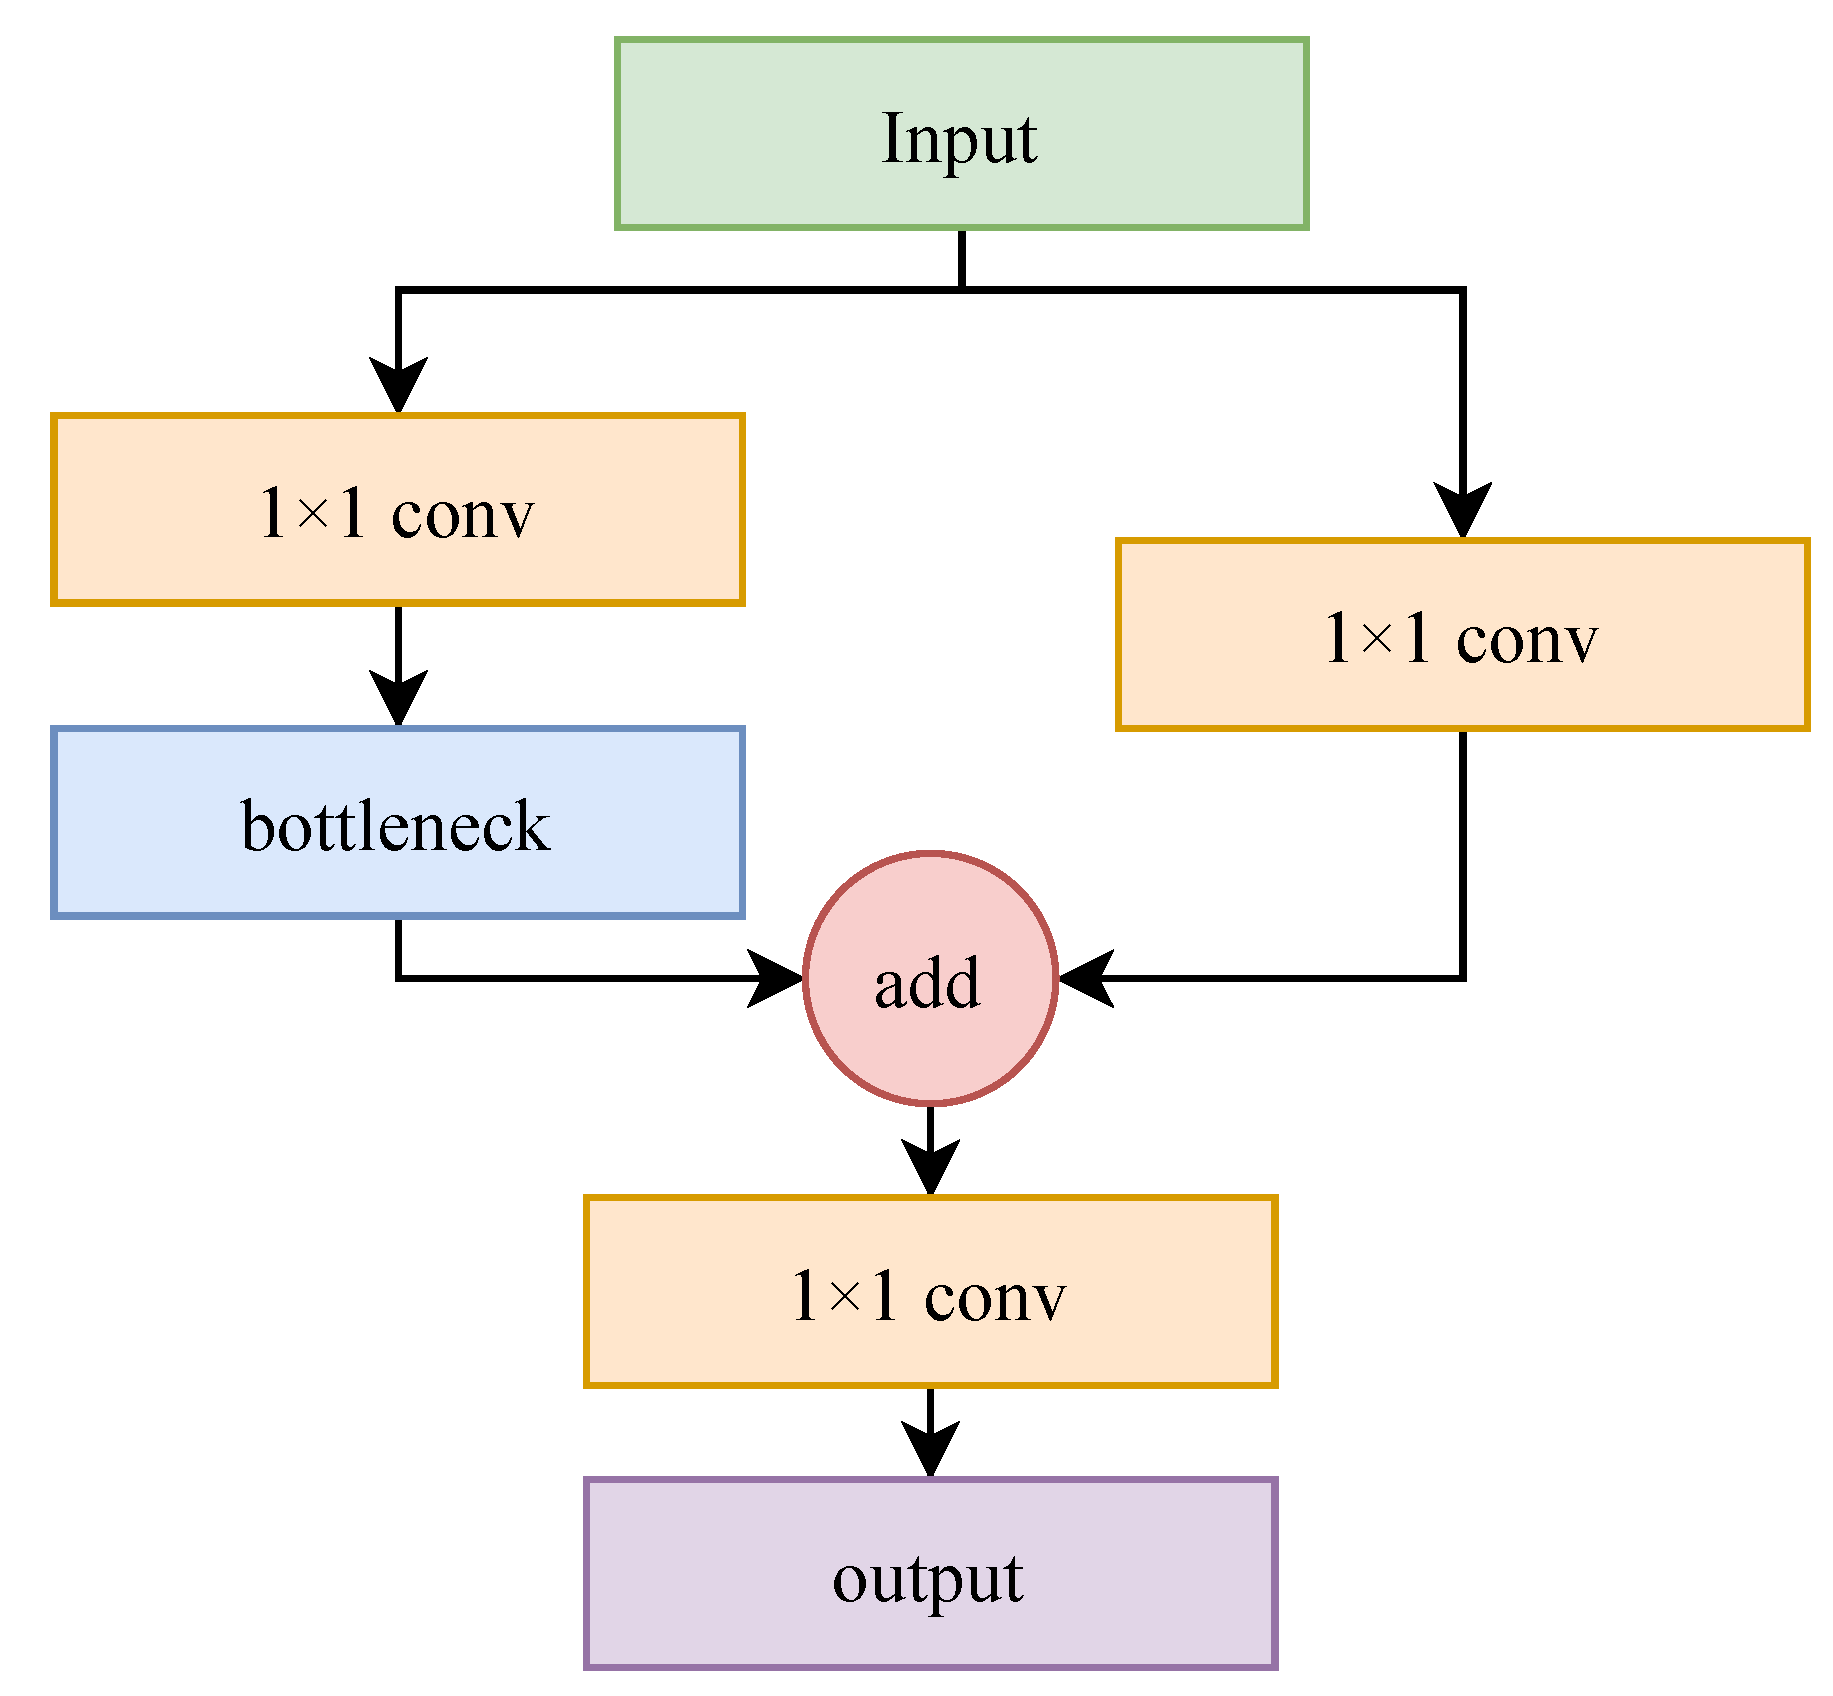
YOLOv4 uses CSPDarknet53 as the backbone network based on cross-stage partial connection (CSP). As shown in Figure 2, CSP is a structure that divides feature maps into two parts (one part for direct transmission and the other part involving complex operations), and then merges them together; this structure reduces the redundancy of the feature map and improves the efficiency of the network. CSPDarknet53 uses the Dense Block structure to connect the output of each layer with the previous layer to increase the diversity and complexity of the feature map and improve the expressiveness of the model. CSPDarknet53 uses the Mish activation function, which can avoid gradient disappearance and explosion, improving the stability and accuracy of the model.
While the CSP module structure and Mish activation function used in the CSPDarknet53 backbone network can indeed enhance the feature extraction quality, it comes with certain drawbacks. The complexity of the structure and the computational intensity make the network deep with a large number of layers and parameters. Moreover, the computing process of the Mish activation function is complex and not optimized for hardware implementation. Additionally, the model requires substantial memory and computing resources, making it challenging to compress and accelerate the model and deploy it in resource-constrained edge environments. Therefore, we use the SandGlass [32] module and the RFB [15] module to build a lightweight MobileNeXt-RFB network to replace the original backbone network of YOLOv4.

SandGlass Block

The SandGlass module is adopted instead of the CSP module to construct the MobileNeXt network as the backbone network of the target detection model. SandGlass improves the loss of feature information and gradient disappearance of the inverse residual module in the MobileNetv2 network.
The SandGlass module first performs spatial information transformation on the input features through a 3 × 3 convolutional layer, and then performs channel information transformation through two 1 × 1 convolutions for dimensionality reduction and expansion, before finally extracting features through another 3 × 3 convolutional layer.
The SandGlass block reduces dimensions and then expands dimensions of input features, which are in a shape resembling an hourglass, as shown in Figure 3. The module adopts a linear bottleneck design, where only the first 3 × 3 convolution and the second 1 × 1 convolution use the ReLU6 activation function, while other layers use the linear activation function. Additionally, the 3 × 3 convolution in the module is replaced by a depthwise separable convolution to reduce model computation. The module uses the ReLU6 activation function, whose mathematical expression is shown in Equation (1). The advantage of ReLU6 is that it leads to fast convergence, but it may cause gradient vanishing due to the zeroing of values less than 0. To avoid this issue, we replace the original ReLU6 activation function in the SandGlass module with the LeakyReLU activation function, whose mathematical expression is shown in Equation (2).
R e L U 6 ( x ) = m a x ( 6 , m a x ( 0 , x ) )
L e a k y R e L U x = m a x 0 , x + l e a k y × m i n 0 , x

3.2. Receptive Field Block

The receptive field refers to the portion of the input image that each pixel on the feature map corresponds to, indicating the extent to which a pixel “sees” the input image. The size of the receptive field has an impact on the network’s performance. In general, a larger receptive field allows the network to capture more image information, thereby enhancing its recognition ability. The size of the receptive field is determined by the network’s structure, including factors such as the size of the convolution kernel and the stride. The receptive field of a feature map can be calculated recursively using a formula, such as Equation (3). The receptive field of the m-layer is equal to the receptive field of the m 1 layer plus the convolution kernel or pooling kernel of the m-layer covering the range, and the size of the receptive field is calculated layer by layer from back to front. Assuming that the receptive field of the first input feature is R F m 1 , the receptive field after m-layer convolution is R F m as in Equation (3), where k m is the convolution kernel size (or pooling kernel size) of the m-layer, s n is the convolution step (or pooling step) of the nth layer.
R F m = R F m 1 + ( k m 1 ) × n = 1 m 1 s n
The receptive field of convolutional operations is primarily determined by the size of the convolution kernel. Increasing the size of the kernel can expand the receptive field. However, this also results in a substantial increase in model parameters. Dilated convolution, also known as atrous convolution, overcomes this challenge by introducing holes in the convolution kernel. By doing so, it enlarges the receptive field without altering the number of parameters or the size of the output feature map. This allows the network to capture a broader range of spatial information, enhancing its ability to understand larger contextual patterns.
The comparison between regular convolution and dilated convolution is shown in Figure 4. The key parameter of expansion convolution is the dilated rate, which indicates that the convolution of different dilated rates of the size of the cavity has different receptive fields, and the fused features contain both the characteristics of large-scale receptive fields and the characteristics of small-scale receptive fields, and which has more contextual information, reduces the loss of detail information in the downsampling process, and is conducive to improving the detection accuracy.
However, the dilated convolution structure as a whole has a drawback commonly referred to as the grid effect, where not all pixels on the feature map are covered. This leads to a loss of continuity in contextual information. To address this issue, a sawtooth-shaped mixed convolution structure called Hybrid Dilated Convolution (HDC) has been introduced. HDC consists of a series of dilated convolutions with different dilation rates operating in parallel. This structure allows for complete coverage of the image features and effectively avoids the grid effect, ensuring better preservation of contextual information.
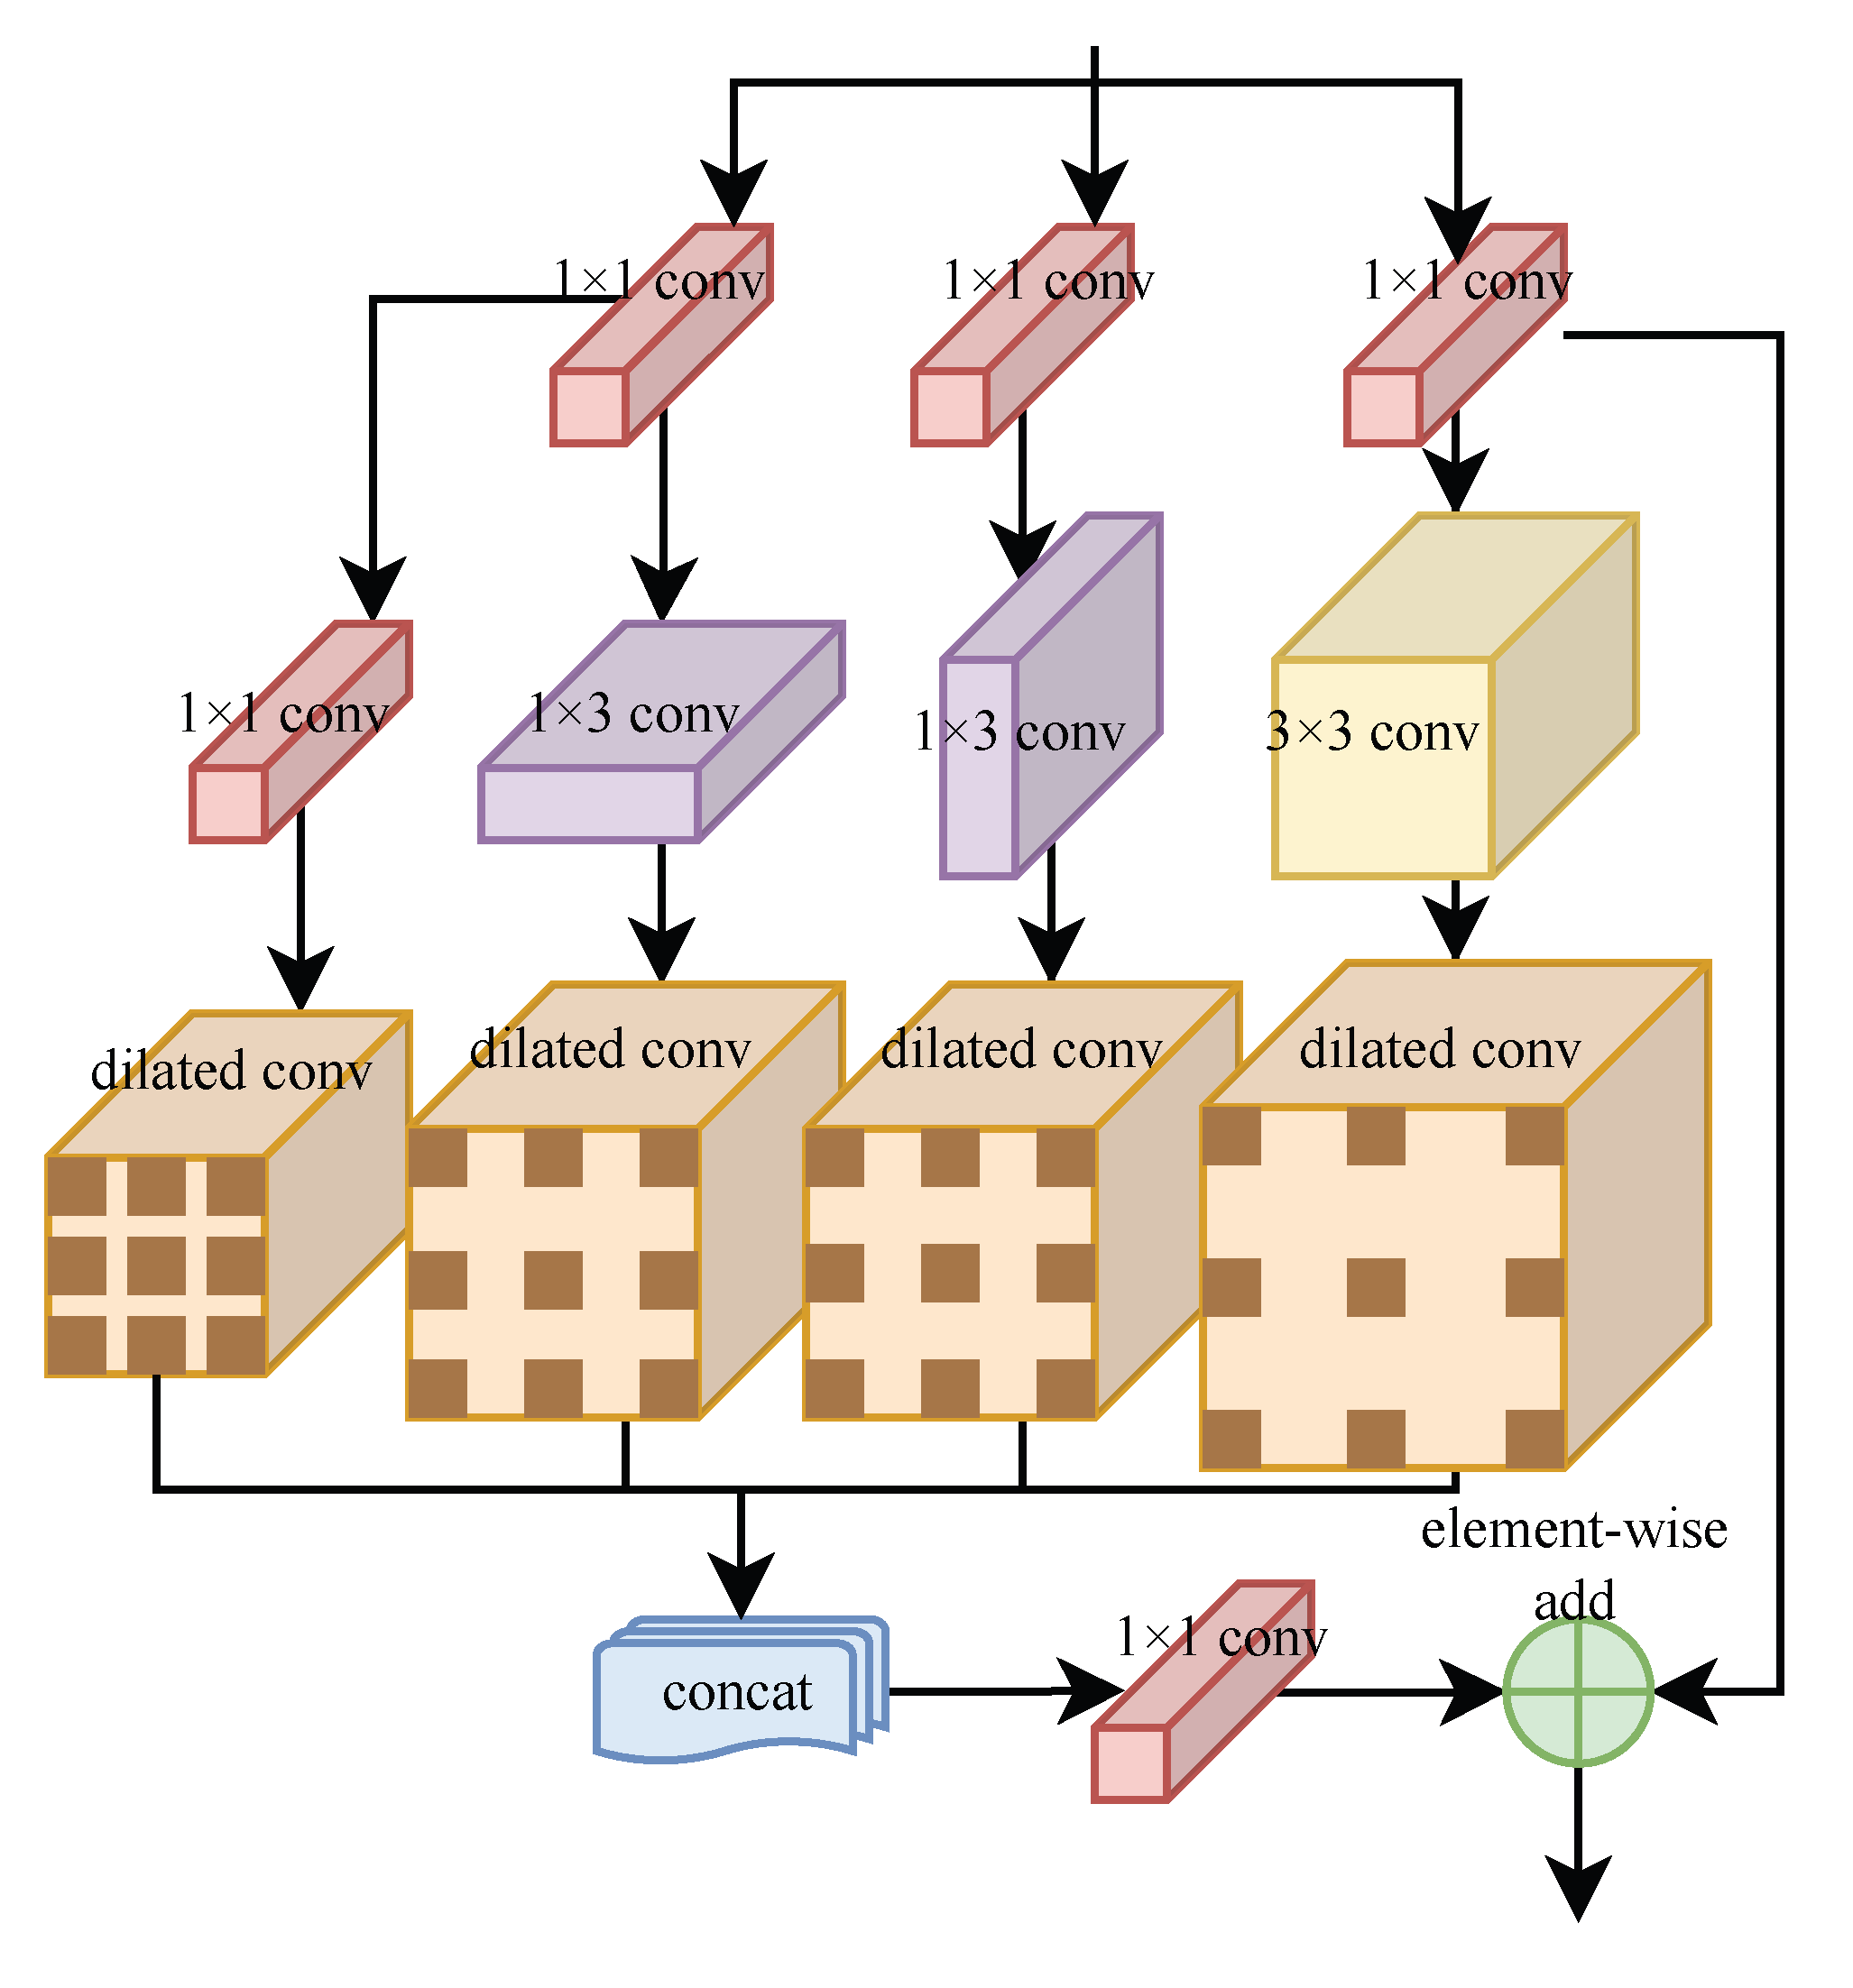
The RFB module utilizes multiple expansion convolutions with different dilated rates to sample the input features independently. These sampled features are then overlaid and fused to enhance the model’s receptive field. By increasing the receptive field, the network becomes capable of extracting a broader range of spatial information. This improves its understanding of long-distance spatial relationships, implicit spatial structures, and enables the model to adapt to targets of different scales. Additionally, it enhances the extraction and fusion capabilities of multi-scale features, facilitating better feature representation and understanding of complex spatial patterns.
To improve the multi-scale detection accuracy of the model, we introduce the RFB module into the backbone network, whose network structure is shown in Figure 5.
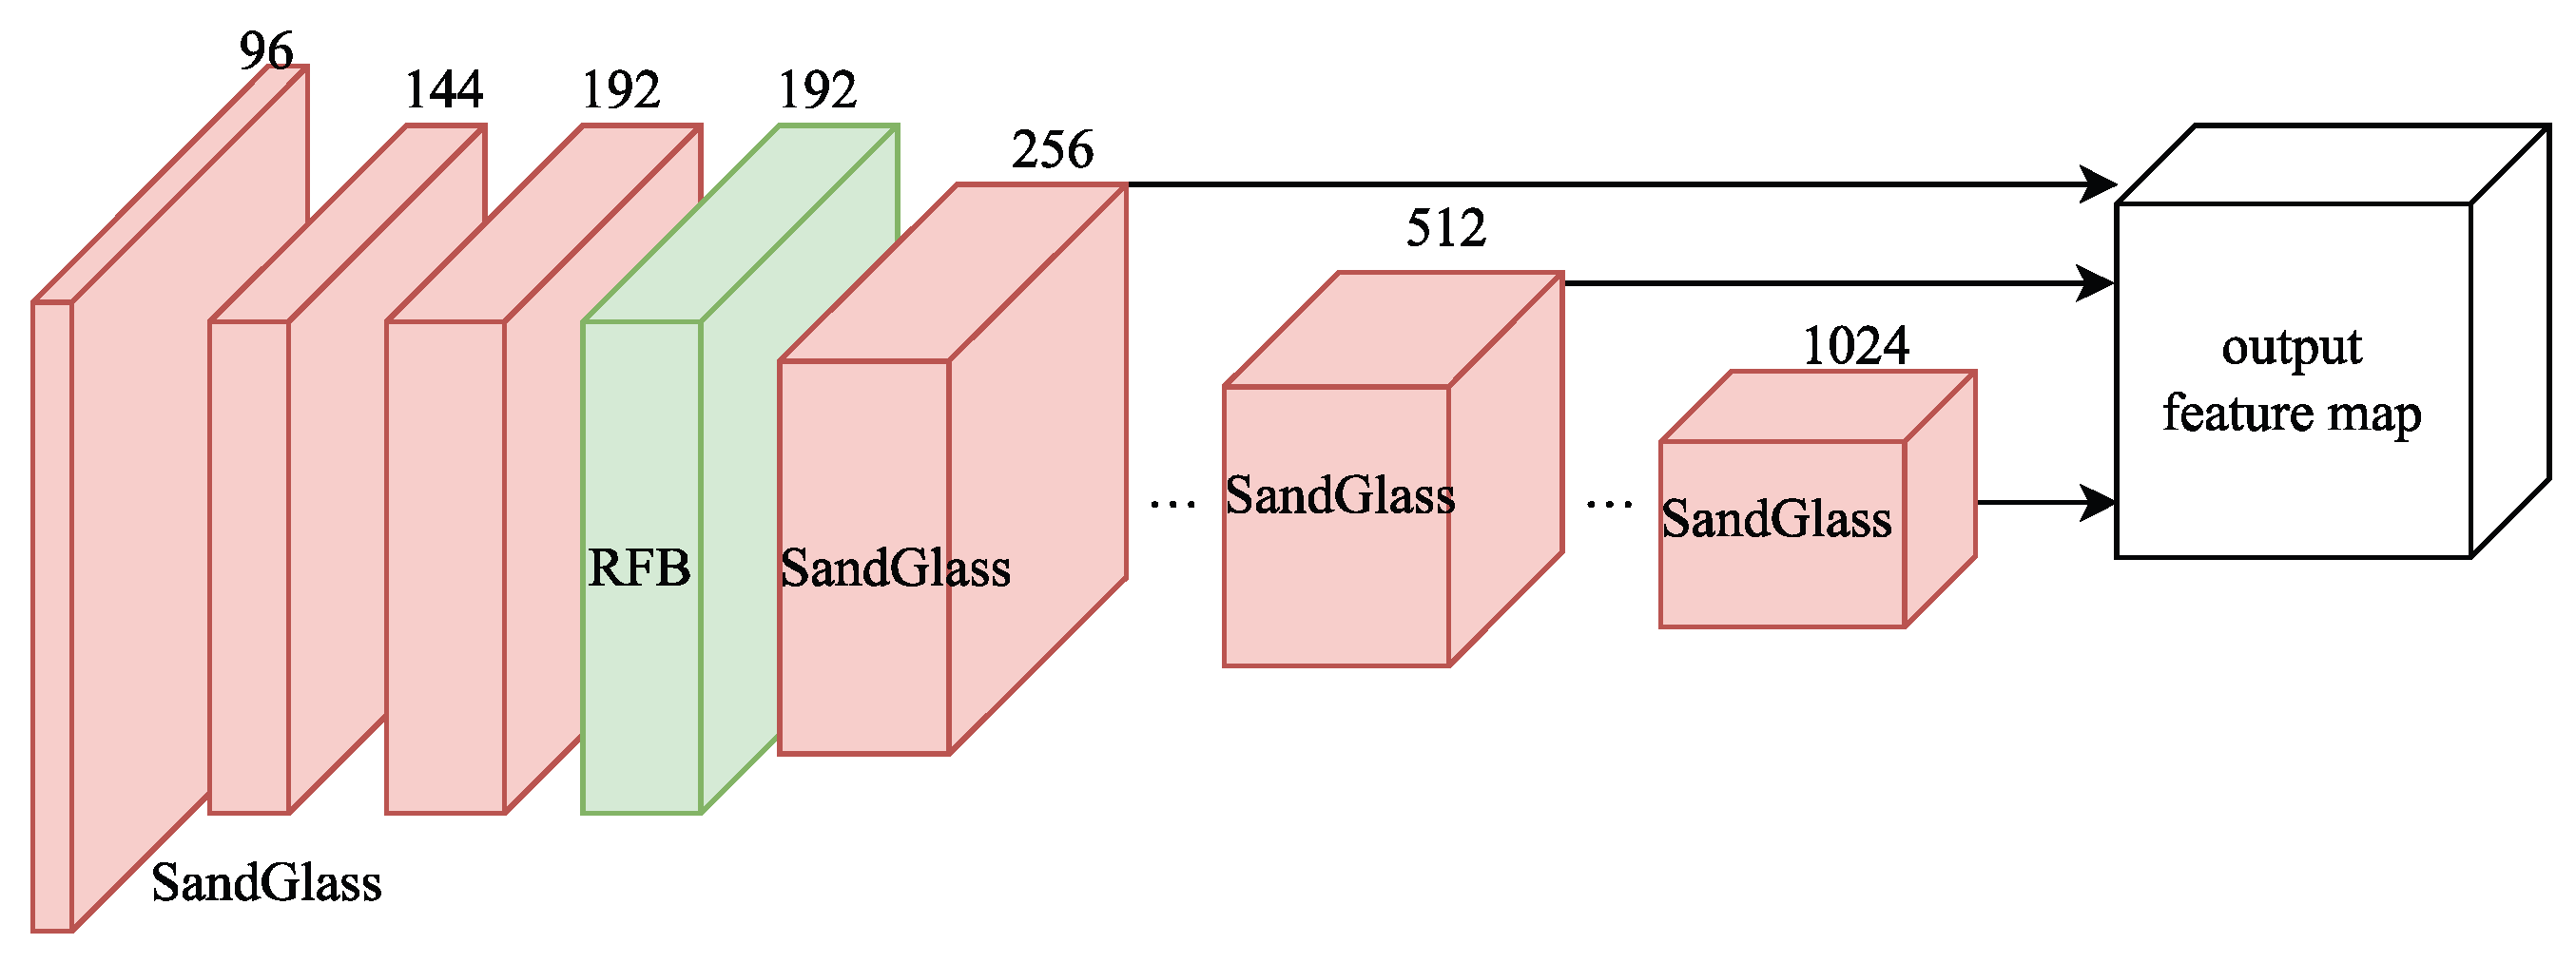
RFB uses a series of dilated convolutions with different dilation rates to sample the input features, and then superimposes and fuses the sampled features. Convolutions with different dilation rates have different receptive fields. The fused features contain both large-scale receptive field features and small-scale receptive field features, providing more contextual information and reducing the loss of detailed information during downsampling, which is beneficial to improve detection accuracy. The backbone network is a continuous downsampling process (the deeper the network layer, the more small target information loss); therefore, we choose to add RFB module in the shallow part of the backbone network to improve the accuracy of small target detection as much as possible, and the structure of the constructed MobileNeXt-RFB network is shown in Figure 6.

3.3. PAN-Lite Feature Fusion Network

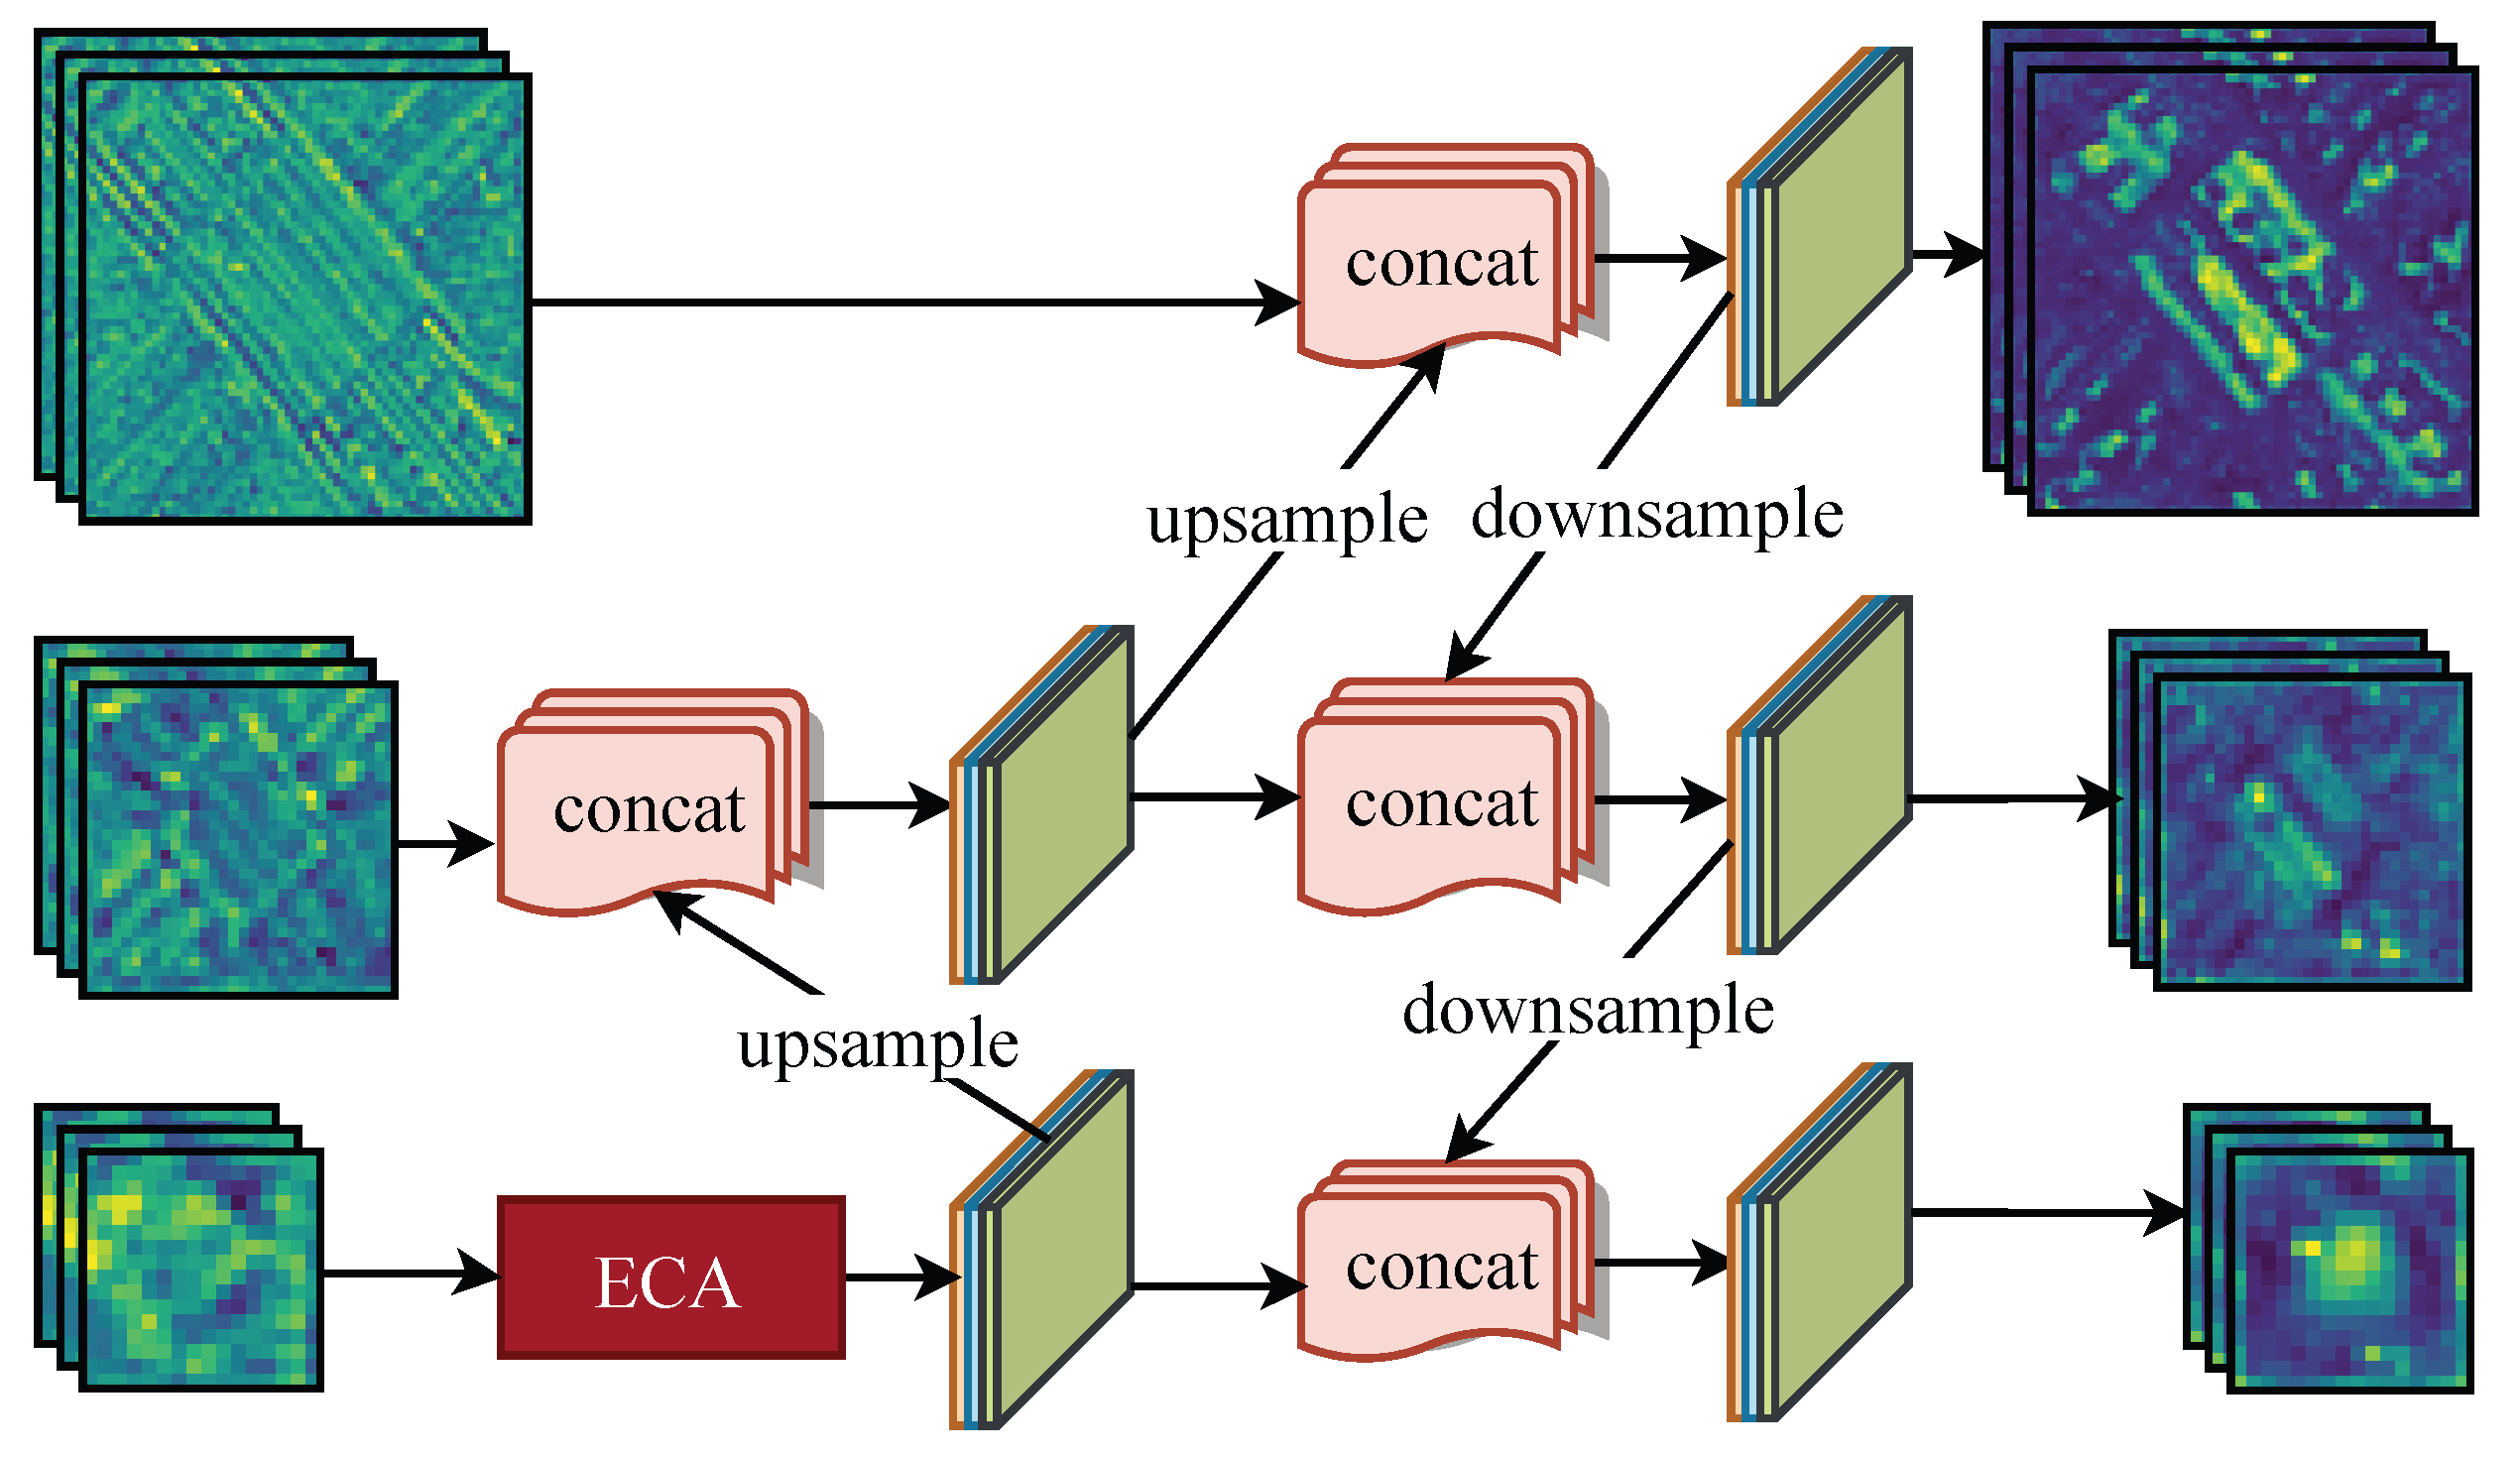
After downsampling the input image through the backbone network, three different scales of feature maps are outputted, where the large-scale feature map contains richer semantic information, including more complete global feature information of the target, and the small-scale feature map contains strong positional information, which better reflects the local texture and coordinates position of the objects. In order to better utilize the target feature information of different scales of feature maps while ensuring detection speed, we use the PAN-lite network, which is based on the PAN network, for multi-scale feature fusion. Firstly, the number of channels of the input feature map is adjusted, and then the bi-directional fusion of self-upward and self-downward sampling with other scale feature maps is performed. The PAN-lite network structure is shown in Figure 7.

3.4. Depthwise Separable Convolution

To avoid the stacking effect caused by the superposition of feature maps at different levels, the feature fusion network needs to transform the spatial and channel information of the stacked features. In YOLOv4, a convolution group composed of three 1 × 1 convolutions and two 3 × 3 convolutions is used to enhance features. However, this design significantly increases the model’s size, which is not conducive to improving detection speed. Therefore, we use two 1 × 1 convolutions and one depthwise separable convolution instead of the five convolution operations.
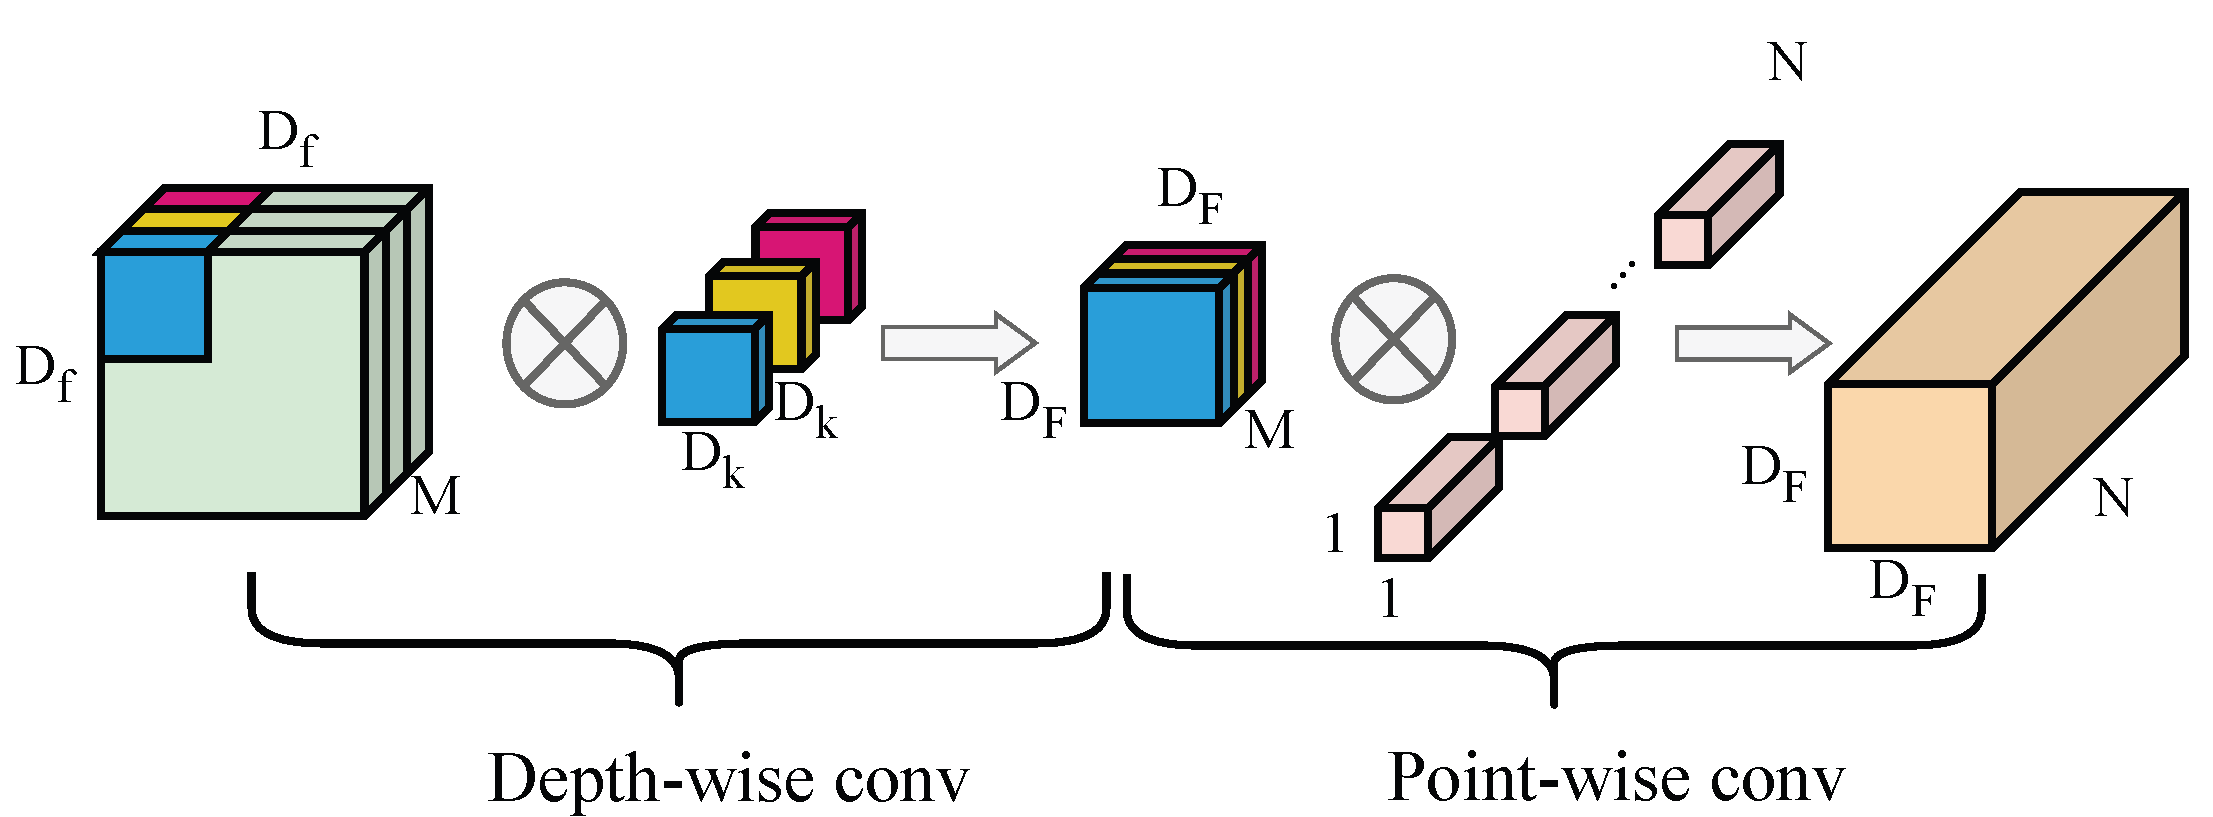
The depthwise separable convolution [33] consists of depthwise and pointwise convolutions, as shown in Figure 8. The input feature map size is D f × D f × M , the output feature map size is D F × D F × N , and the kernel size is D k × D k . The computation and parameter sizes of standard convolution are shown in Equations (4) and (5), respectively.
M A C = D k 2 × M × D F 2 × N
P a r a m e t e r s = D k 2 × M × N
The computation and parameter sizes of depthwise separable convolution are the sum of the computation sizes of depthwise and pointwise convolutions, as shown in Equations (6) and (7), respectively. Compared with standard convolution operations, the parameter count and computational cost of depthwise separable convolution are relatively low.
M A C = D k 2 × M × D F 2 + M × N × D F 2
P a r a m e t e r s = D k 2 × M + M × N

3.5. An Efficient Channel-Attention Mechanism

Many soft attention modules do not modify the output size, so they can be flexibly inserted into various parts of the convolutional network, but increase the training parameters, resulting in an increased computational cost. As a result, an increasing number of modules focus on the trade-off between the number of parameters and accuracy, and various lightweight attention modules have been proposed [34,35].
The ECA network is a cross-channel interaction mechanism in which dimensionality reduction is not needed. In addition, an adaptive choice of 1D convolution kernel is used to implement local cross-channel interactions. The feature maps are fed into the ECA module and the weight vectors are generated by pooling the input feature maps by global average. The weight vector was adjusted by a 1D convolution kernel and the sigmoid function, and the input features were dot product by the weight vector. Suppose the feature mapping input of the ECA module is F U C × H × W , and then convert it to 1 × 1 × C one-dimensional vector using global average pooling (GAP).
y c = 1 H × W i = 1 H × W ω c ( i )
As shown in Equation (8), y c Ω C × 1 , the weight values after reshape are multiplied with the original feature map, C is the channel number, ω c is the local feature of channel c, H is the row of the feature vector, and W is the column of the feature vector. The weight of channel i can be calculate by Equation (9), where Ω i j represent the set of k adjacent channels of y i .
ω i = σ ( j = 1 k w i j y i j ) , y i j Ω i j
Due to FPGA hardware limitations, it is difficult to perform complex and accurate floating-point calculations, so we use the Hard Sigmoid function to approximate instead of the Sigmoid function. The calculation formula of Hard Sigmoid and Sigmoid is shown in Equations (10) and (11).
H a r d S i g m o i d ( x ) = 0 x 2.5 0.2 x + 0.5 2.5 x 2.5 1 x > 2.5
S i g m o i d ( x ) = 1 1 + e x

3.6. Data Augmentation

Due to environmental factors and the influence of the viewing angle of the aerial platform (such as airplanes and drones), the images collected by remote sensing platforms have complex backgrounds, lighting, viewing angles, and occlusion conditions that cannot be fully covered by the existing dataset.
To mitigate overfitting during the model training process and enhance the model’s generalization ability and robustness, we employed data augmentation techniques on the existing dataset. This involved applying various transformations and modifications to the images. The specific data augmentation methods used are illustrated in Figure 9. These techniques help to introduce diversity in the training data and expose the model to a wider range of variations, thereby improving its performance on unseen data.
In order to simulate real-world scenarios and enhance the dataset, we employed various data augmentation techniques. These included random scaling, rotation, brightness adjustment, occlusion addition, and motion blur. By applying these transformations, we aimed to introduce variability and better prepare the model for handling diverse and challenging real-world conditions. Additionally, given the importance of accurately detecting small objects, we incorporated the Copy–Paste data augmentation method. This technique involves randomly copying bounding boxes of small objects to augment the dataset. By doing so, we provided the network with more examples of small objects, aiding its ability to learn effective feature representations for detecting and localizing such objects accurately. This approach can improve the model’s performance specifically on small object detection tasks.

3.7. K-Means Anchor Box Clustering

In the YOLOv4 model, the initial anchor box sizes are calculated based on the COCO image dataset. However, these anchor box sizes may not be suitable for the optical remote sensing image dataset used in this work due to the significant differences in object scale distribution. To improve the accuracy of the detection model, we employ the k-means clustering algorithm to determine appropriate anchor box sizes specifically for the DIOR optical remote sensing dataset. The k-means clustering algorithm starts by randomly selecting k samples as the initial centroids. Then, it calculates the distance between each sample in the dataset and the selected initial centroids. Based on the distance, each sample is assigned to the cluster represented by the nearest centroid. This process is repeated iteratively until the results stabilize, ensuring that the assignment of samples to clusters becomes consistent. By using the k-means clustering algorithm, we can calculate anchor box sizes that better suit the characteristics of the DIOR optical remote sensing dataset. This approach improves the accuracy of the detection model by providing anchor boxes that are more appropriate for the specific objects and scale distribution present in the dataset.
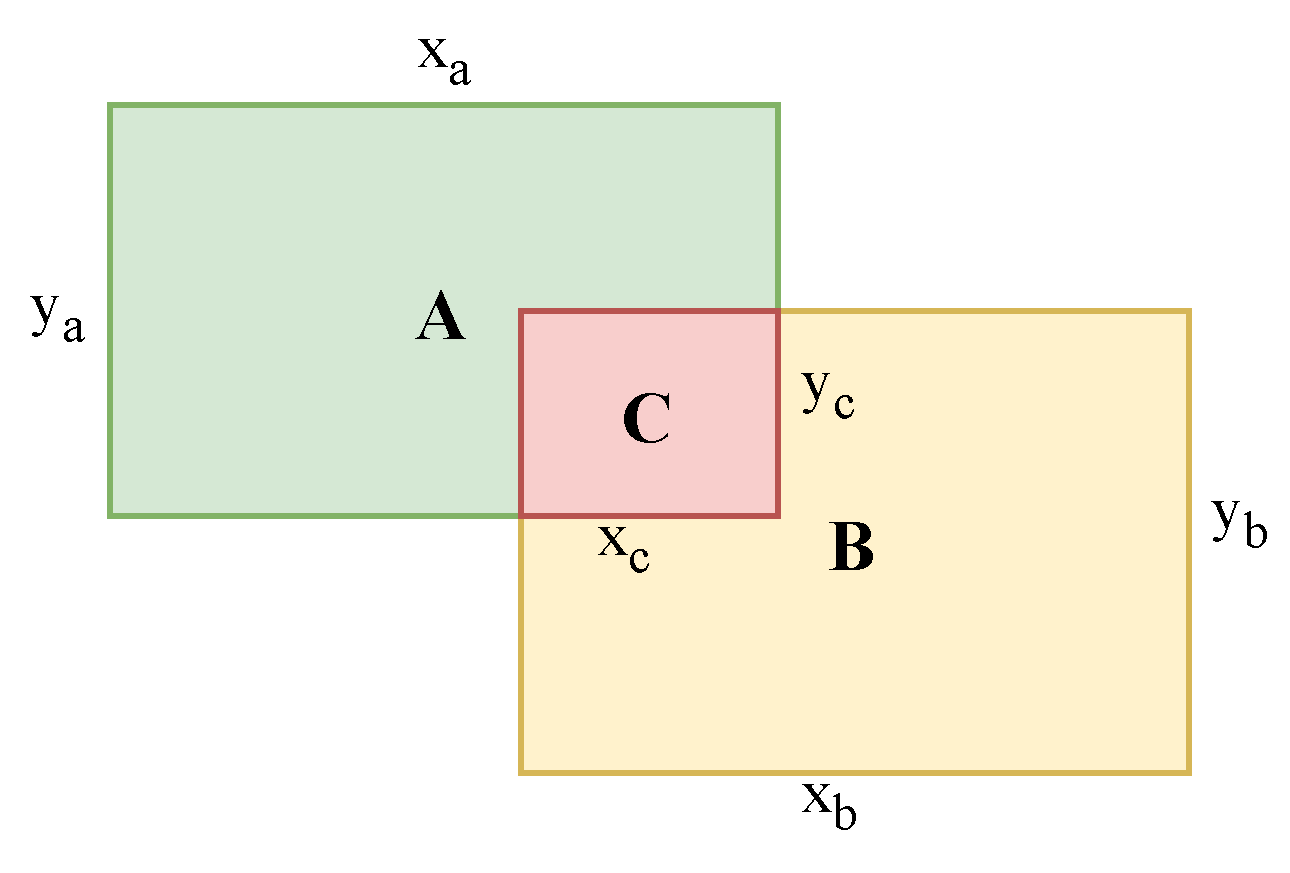
To avoid the impact of ignoring the area factor on the clustering results of large objects, we use the intersection over union (IoU) of the area as the metric for measuring the distance between samples. IOU stands for Intersection over Union. It is a commonly used evaluation metric in computer vision and object detection tasks to measure the overlap between the predicted bounding box and the ground truth bounding box of an object. It is calculated by dividing the intersection area of the two bounding boxes by their union area, the effect is shown in Figure 10. Equation (12) shows the IoU calculation formula.
I o U = A B A B = S c S A + S B = x c × y c x a × y a + x b × y b

3.8. FPGA Hardware Accelerator

We propose a high-performance and low-power ARM + FPGA architecture neural network hardware acceleration system based on the Xilinx ZYNQ UltraScale+ MPSoC chip and Xilinx DPU IP core for power-constrained airborne information processing systems. The hardware acceleration system architecture is shown in Figure 11.
The part of the neural network with dense calculations, including feature extraction, feature fusion, and prediction regression is deployed to the neural network accelerator on the FPGA for parallel acceleration, while pre-processing and post-processing operations with relatively less computational complexity are deployed to the CPU to reduce the occupancy of FPGA resources and balance the system’s computational load.

3.8.1. Configurations of DPU

The DPU offers an architectural parameter that determines its scale, specifically the degree of parallelism. This parameter determines the number of logical resources allocated to the DPU. Depending on the FPGA chip or computing task at hand, the DPU can be customized by adjusting these architectural parameters. Table 1 provides an overview of different configurations. In this work, the ZCU104 FPGA board and the complexity of the model are considered when selecting the configuration parameter for the DPU architecture. After evaluating the available hardware logic resources and model requirements, a configuration parameter of B4096 is chosen for the DPU. This specific choice ensures compatibility between the DPU and the ZCU104 board while accommodating the model’s complexity effectively.
Deep learning models on FPGA platforms are generally loaded with model structure and parameters in a one-time initialization stage through dedicated data reading interfaces. This approach requires loading a large amount of data during initialization, which occupies a significant amount of on-chip resources and affects the efficiency of model inference. Therefore, we propose a software–hardware co-design model deployment method based on Xilinx Runtime (XRT) to dynamically load the model structure and parameters.
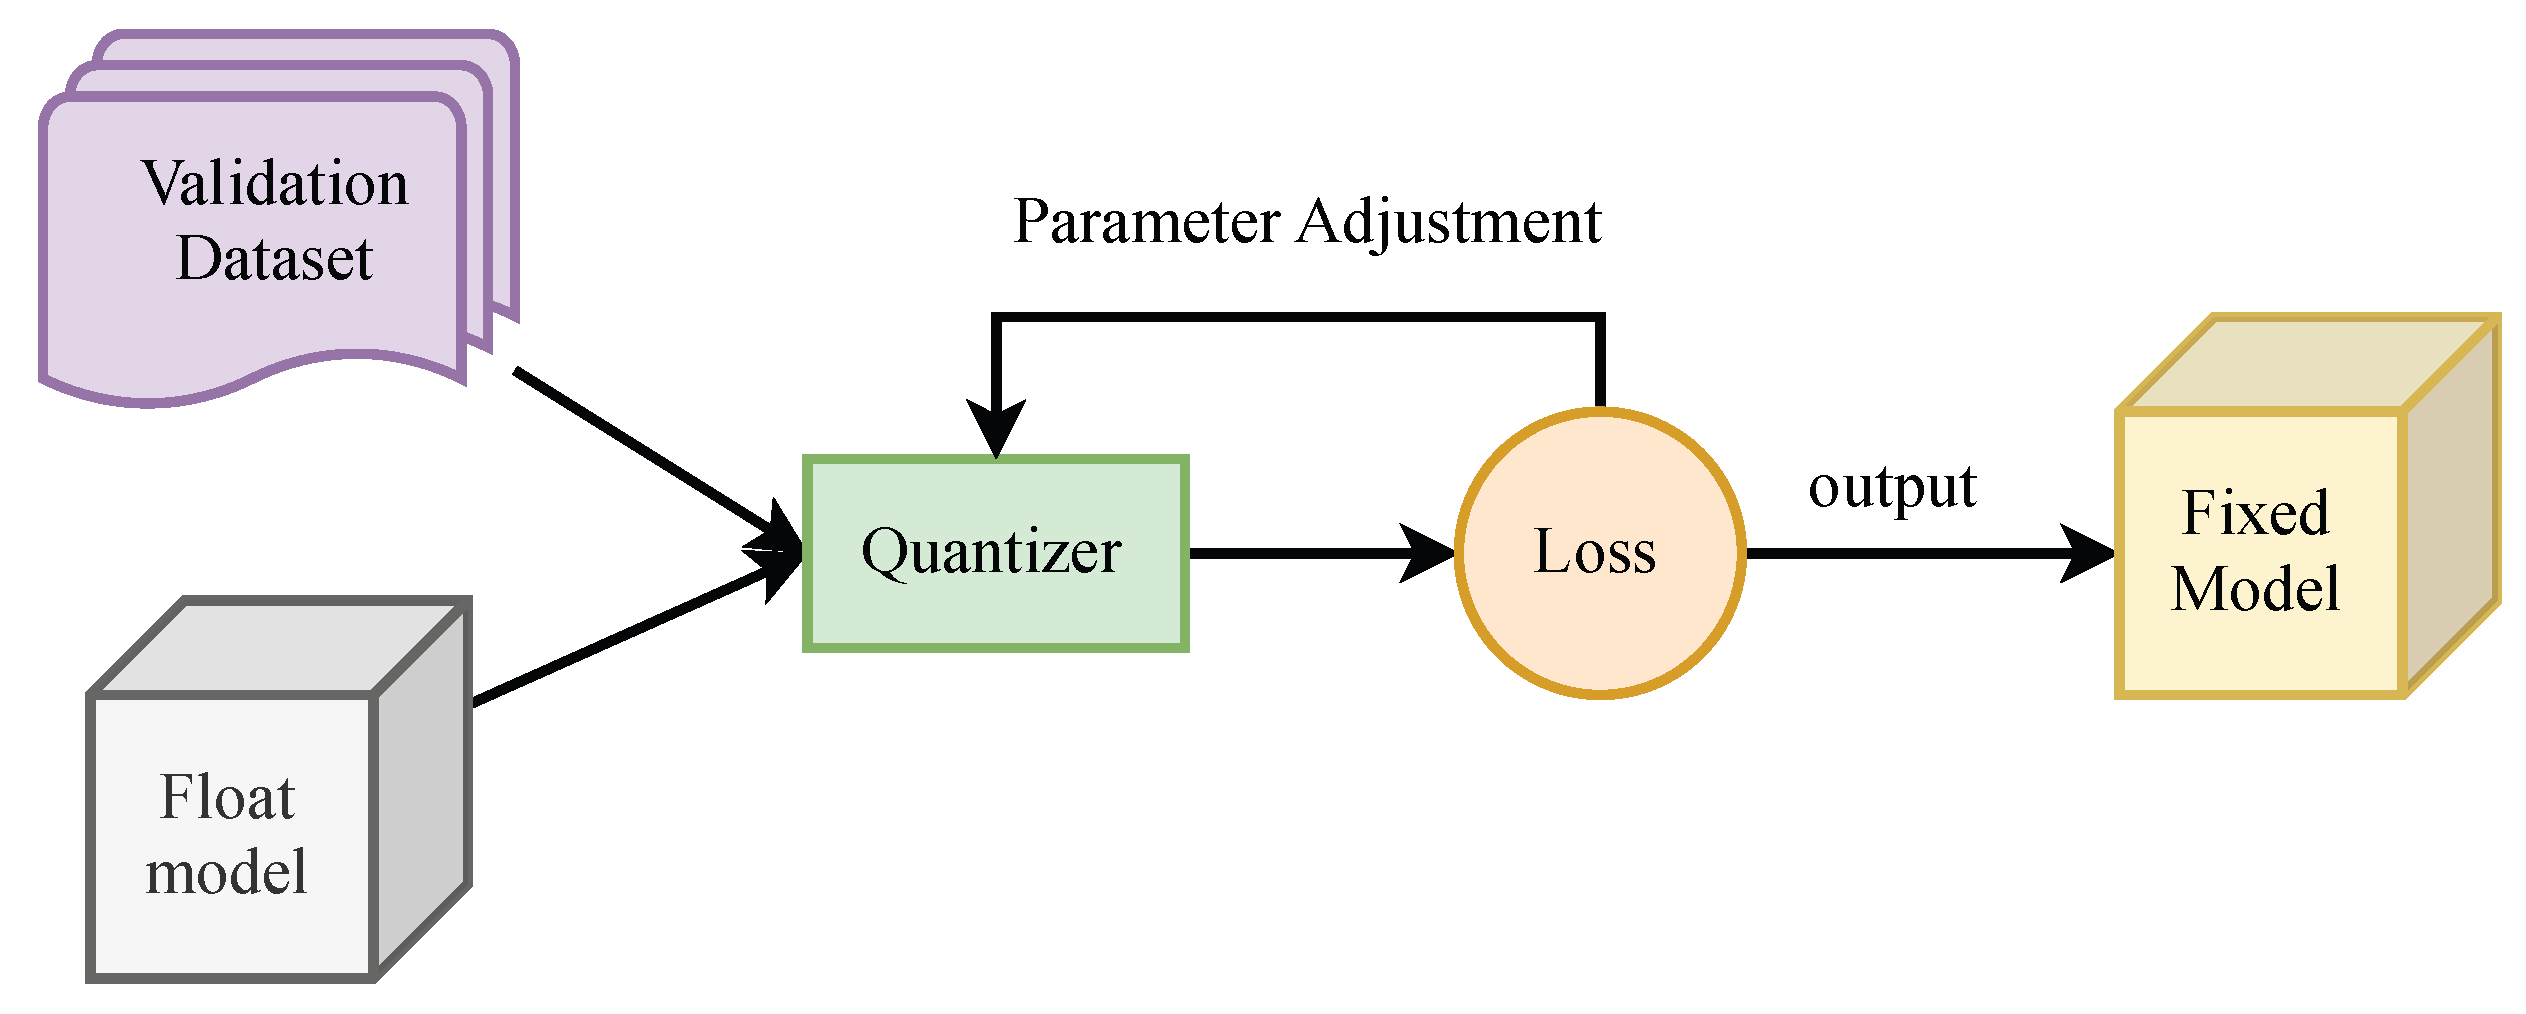
Firstly, the network model is quantized into an 8-bit fixed-point type to adapt to the FPGA hardware structure and reduce computational complexity and memory bandwidth usage. Then, the quantized model is compiled, and the model structure is compiled into a binary file adapted to the DPU hardware structure based on the hardware design. Finally, the implemented DPU hardware structure is loaded onto the target hardware platform, and the construction of the model acceleration application on the target hardware platform is completed.

3.8.2. 8-Bit Fixed-Point Quantization

The computational units in the ZYNQ UltraScale+ FPGA chip used in this work are DSP48E2, which can handle two parallel INT8 multiplication–accumulation (MACC) operations when sharing the same kernel weight. Therefore, we adopt the 8-bit fixed-point number mapping weight and activation value quantization method to compress the model data. After mapping floating-point numbers to lower-bit 8-bit fixed-point numbers, higher parallelism and efficient utilization of resources can be achieved, and the required memory and computational resources are greatly reduced.
The model is quantized using an iterative refinement method. The 32-bit floating-point model trained by TensorFlow and a validation dataset composed of a subset of training data (about 1000 image samples) are simultaneously input into the quantizer. During each quantization, the forward inference of the model is checked, the accuracy loss is calculated, and the model quantization parameters are adjusted. Through multiple iterations, the 32-bit floating-point model input is gradually quantized into an 8-bit fixed-point number model with minimal accuracy loss, as shown in Figure 12.

3.8.3. Model Compilation

The hardware structure of the model and the quantized 8-bit fixed-point number model are input to the compiler to generate a binary file that can run on the DPU. This binary file can be read by the DPU through Xilinx Runtime (XRT) and implement the forward inference of the model.

4. Results

We conducted model ablation experiments on different datasets to verify the effectiveness of the proposed model method and performed comparative evaluations on different hardware platforms including CPU, GPU, and FPGA to evaluate the effectiveness of the FPGA acceleration solution.

4.1. Experimental Platform and Dataset

The hardware platforms used in the experiments were an Intel i7-6700 for CPU, NVIDIA Tesla V100 for the GPU, and Xilinx ZCU104 Evaluation Kit for the FPGA (As shown in Figure 13). In all the experiments, the same model training framework and parameters were used. The model training framework used TensorFlow version 1.15.0 with the SGD optimizer, a momentum of 0.9, an initial learning rate of 0.01, and cosine annealing learning rate decay.
The DIOR dataset used were the publicly available DIOR [36] remote sensing monitoring dataset, Partial images of the DIOR dataset are shown in the Figure 14.
DIOR is a dataset specifically designed for object detection in optical remote sensing images. It encompasses a wide range of 23,463 image samples of different seasons, weather conditions, and locations with a size of 800 × 800 pixels and a resolution ranging from 0.5 to 30 m.

4.2. Evaluation Metrics

In the model ablation and comparison experiments, the mean average precision (mAP) is utilized as the evaluation metric to assess the detection accuracy of the model, and the number of parameters is used to evaluate the complexity of the model. In the hardware acceleration comparison experiment, the average power consumption is used to evaluate the system’s power consumption, and the frames per second (FPS) are used to evaluate the real-time performance of detection.

4.2.1. FPS

The calculation method of FPS is shown in Equation (13), where N s a m p l e s is the number of detected images and T is the time cost for detection.
FPS = N s a m p l e s T
FPS represents the number of images detected in a unit of time, and a higher FPS value indicates a faster detection speed.

4.2.2. Mean Average Precision

The mAP is a metric that measures the average precision across multiple categories or classes. For each category, a precision–recall curve is plotted based on different thresholds. The average precision is then calculated as the area under this curve, considering precision values at various recall levels, ranging from 0 to 1. The mAP is obtained by taking the average of these individual category average precision values. It is usually used evaluation metric in object detection tasks to assess the overall performance of a model across multiple classes.
A P = 0 1 p r d r
Specifically, it can be represented as Equation (14). The definitions of precision and recall are shown in Equations (15) and (16), where T P represents the number of true positive samples, F N represents the number of false negative samples, and F P represents the number of false positive samples.
P r e c i s i o n = T P T P + F P
R e c a l l = T P T P + F N
As the P–R curve may not be a continuous curve, the MS COCO interpolation method is used to calculate the mAP in the experiment.

4.2.3. Average Power

Average power refers to the energy consumption per unit time of the equipment in a certain period of time, and the theoretical value calculation formula is such as Equation (17), where T represents the total time and p ( t ) represents the function of power change over time.
P ¯ = 0 T p ( t ) d t T
P ¯ P ^ = i = 1 n p i n
Since the power change function p ( t ) cannot be obtained by measurement, this paper uses the sampling method to estimate the average power, and measures the power p every T n in the total time T, and finally sum the n sampling results and divide it by n to obtain the estimated value of the average power. n is the sampling frequency; the higher the sampling frequency, the closer the estimation result is to the theoretical value. The sampling method calculates the average power as in Equation (18).

4.3. Comparison Experiments of RFA-YOLO

To evaluate the effectiveness of our improved RFA-YOLO model, we conducted a comparison with several mainstream remote sensing object detection algorithms. This comparison aimed to evaluate the performance of our model against existing approaches widely used in the field. Five models, including Faster R-CNN [37], YOLOv3 [38], SSD [39], Cascade R-CNN [40], RetinaNet [41], and CenterNet [42], were compared with the proposed method. As shown in Table 2 and Table 3, compared with these algorithms, our proposed algorithm achieves the second-highest accuracy, slightly lower than RetinaNet. This is because RetinaNet is a target detection model based on the Feature Pyramid Network (FPN) structure, which has a more complex network structure and more parameters, so it can obtain higher accuracy in general. Although our proposed algorithm does not achieve the best accuracy, the parameter size metric yielded the best results, which is crucial for efficient deployment on the FPGA side.

4.4. Comparison Experiments of the Hardware Accelerator

To assess the efficiency of hardware acceleration, we performed a comparative experiment where we deployed the improved model on GPU, CPU, and FPGA. This allowed us to assess and compare the performance of each hardware platform. The experimental results are shown in Table 4. Compared with the CPU deployment scheme, the FPGA deployment scheme reduced power consumption by 62.11% and increased FPS by 189.84%. Compared with the GPU deployment scheme, FPS increased by 34.47%, and the average power consumption was reduced by 89.72%. The FPGA architecture showed significant improvement in performance while achieving a balance between power consumption and performance due to its lower frequency and highly parallelized structure compared to the CPU with low parallelism.

5. Discussion

In order to assess the efficacy of our model enhancement, we performed model ablation experiments specifically on the DIOR with the goal of achieving improvement.

5.1. Ablation Experiments of the Improved Object Detection Model

The ablation experiment for the lightweight backbone network involved replacing the CSP-Darknet backbone network of YOLOv4 with the lightweight MobileNext network. The experimental dataset, frameworks, and training parameters remained consistent with the previous experiments. The trained and tested model was evaluated on a remote sensing image dataset, and the results are presented in Table 5 and Table 6.

5.1.1. Ablation Experiments of Lightweight Backbone

The results show that the mAP of the improved model with the replaced backbone network on the DIOR dataset was 58.63%, slightly lower than the baseline model. This is because the complexity of the lightweight MobileNext network is reduced, which weakened its feature extraction ability, and to some extent affected the characterization of the objects to be detected. However, the number of parameters in the model was reduced to 36.44 M, which is more favorable for deployment on edge devices.

5.1.2. Ablation Experiments of RFB

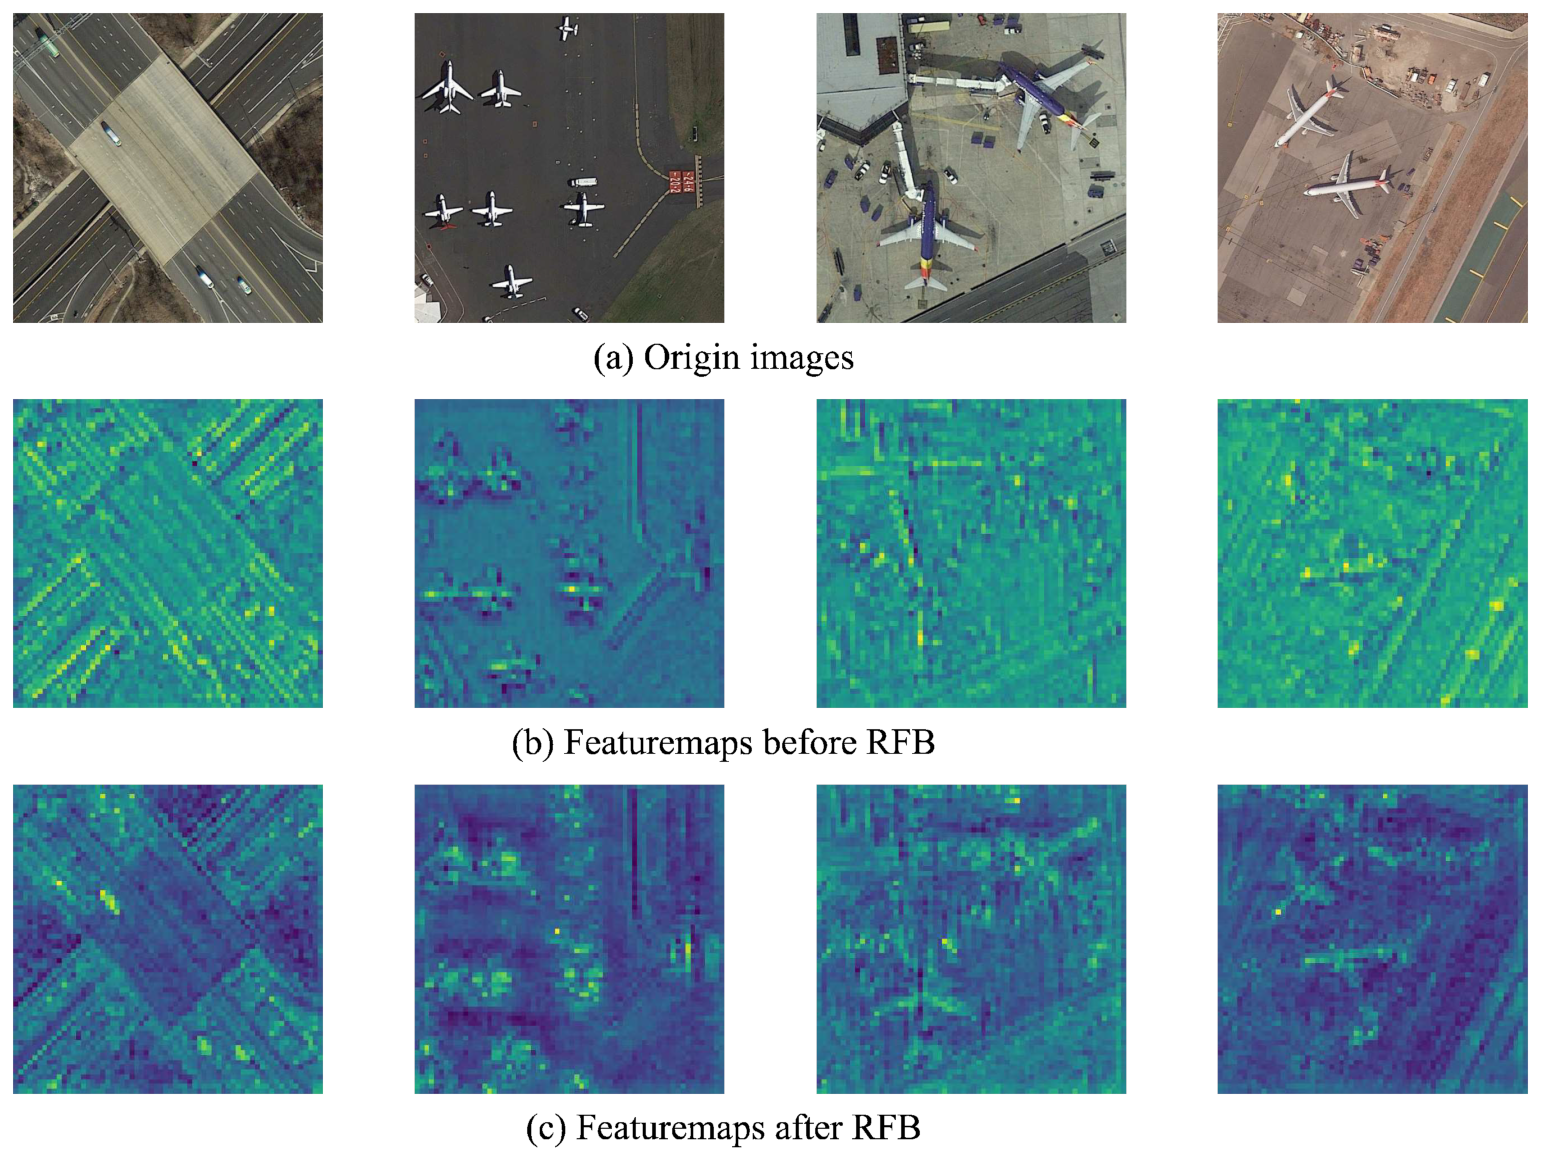
This section discusses the RFB module ablation experiment, in which the RFB module was embedded into a lightweight backbone network and trained and tested on remote sensing image dataset. The model with the embedded RFB module achieved an average precision mAP of 60.75%, improving by 2.12%, while the parameter count slightly increased by less than 1%. From the experimental results, it can be concluded that the addition of the RFB module only slightly increased the model complexity, but significantly enhanced the feature extraction capability and improved the detection accuracy compared to the baseline model, effectively compensating for the negative impact of lightweight feature extraction on detection performance. The background area has become darker, indicating that this area is suppressed, reducing the probability of misidentifying the background as an object.
To study the effectiveness of the RFB module in the backbone network, the input and output feature maps of the RFB module were visualized and compared, as shown in Figure 15. Figure 15 is a heatmap created by superimposing all the channels of the feature map together. The lighter colors indicate higher response values, and it reflects the spatial distribution of feature responses. After RFB processing, it is evident that the color of background noise areas, such as ground markings, has become darker compared to before. This indicates that the response of noise information has been suppressed, leading to a lower probability of misidentifying the background as objects.

5.1.3. Ablation Experiments of PAN-Lite Network and ECA Module

In the ablation experiment of the PAN-lite network, on the basis of using a lightweight backbone network and embedding the RFB module, an improved PAN-lite network was used to replace the original feature fusion network.
The model using the PAN-lite feature fusion network has a slightly lower average precision mAP on the DIOR dataset, which is 60.03%. Due to the applying of lighter depth-wise separable convolution and simplified network structure, the quality of feature fusion has been reduced to some extent, resulting in a slight loss in the model’s detection accuracy. However, the model’s complexity has been significantly reduced, with a reduction of over 50%.
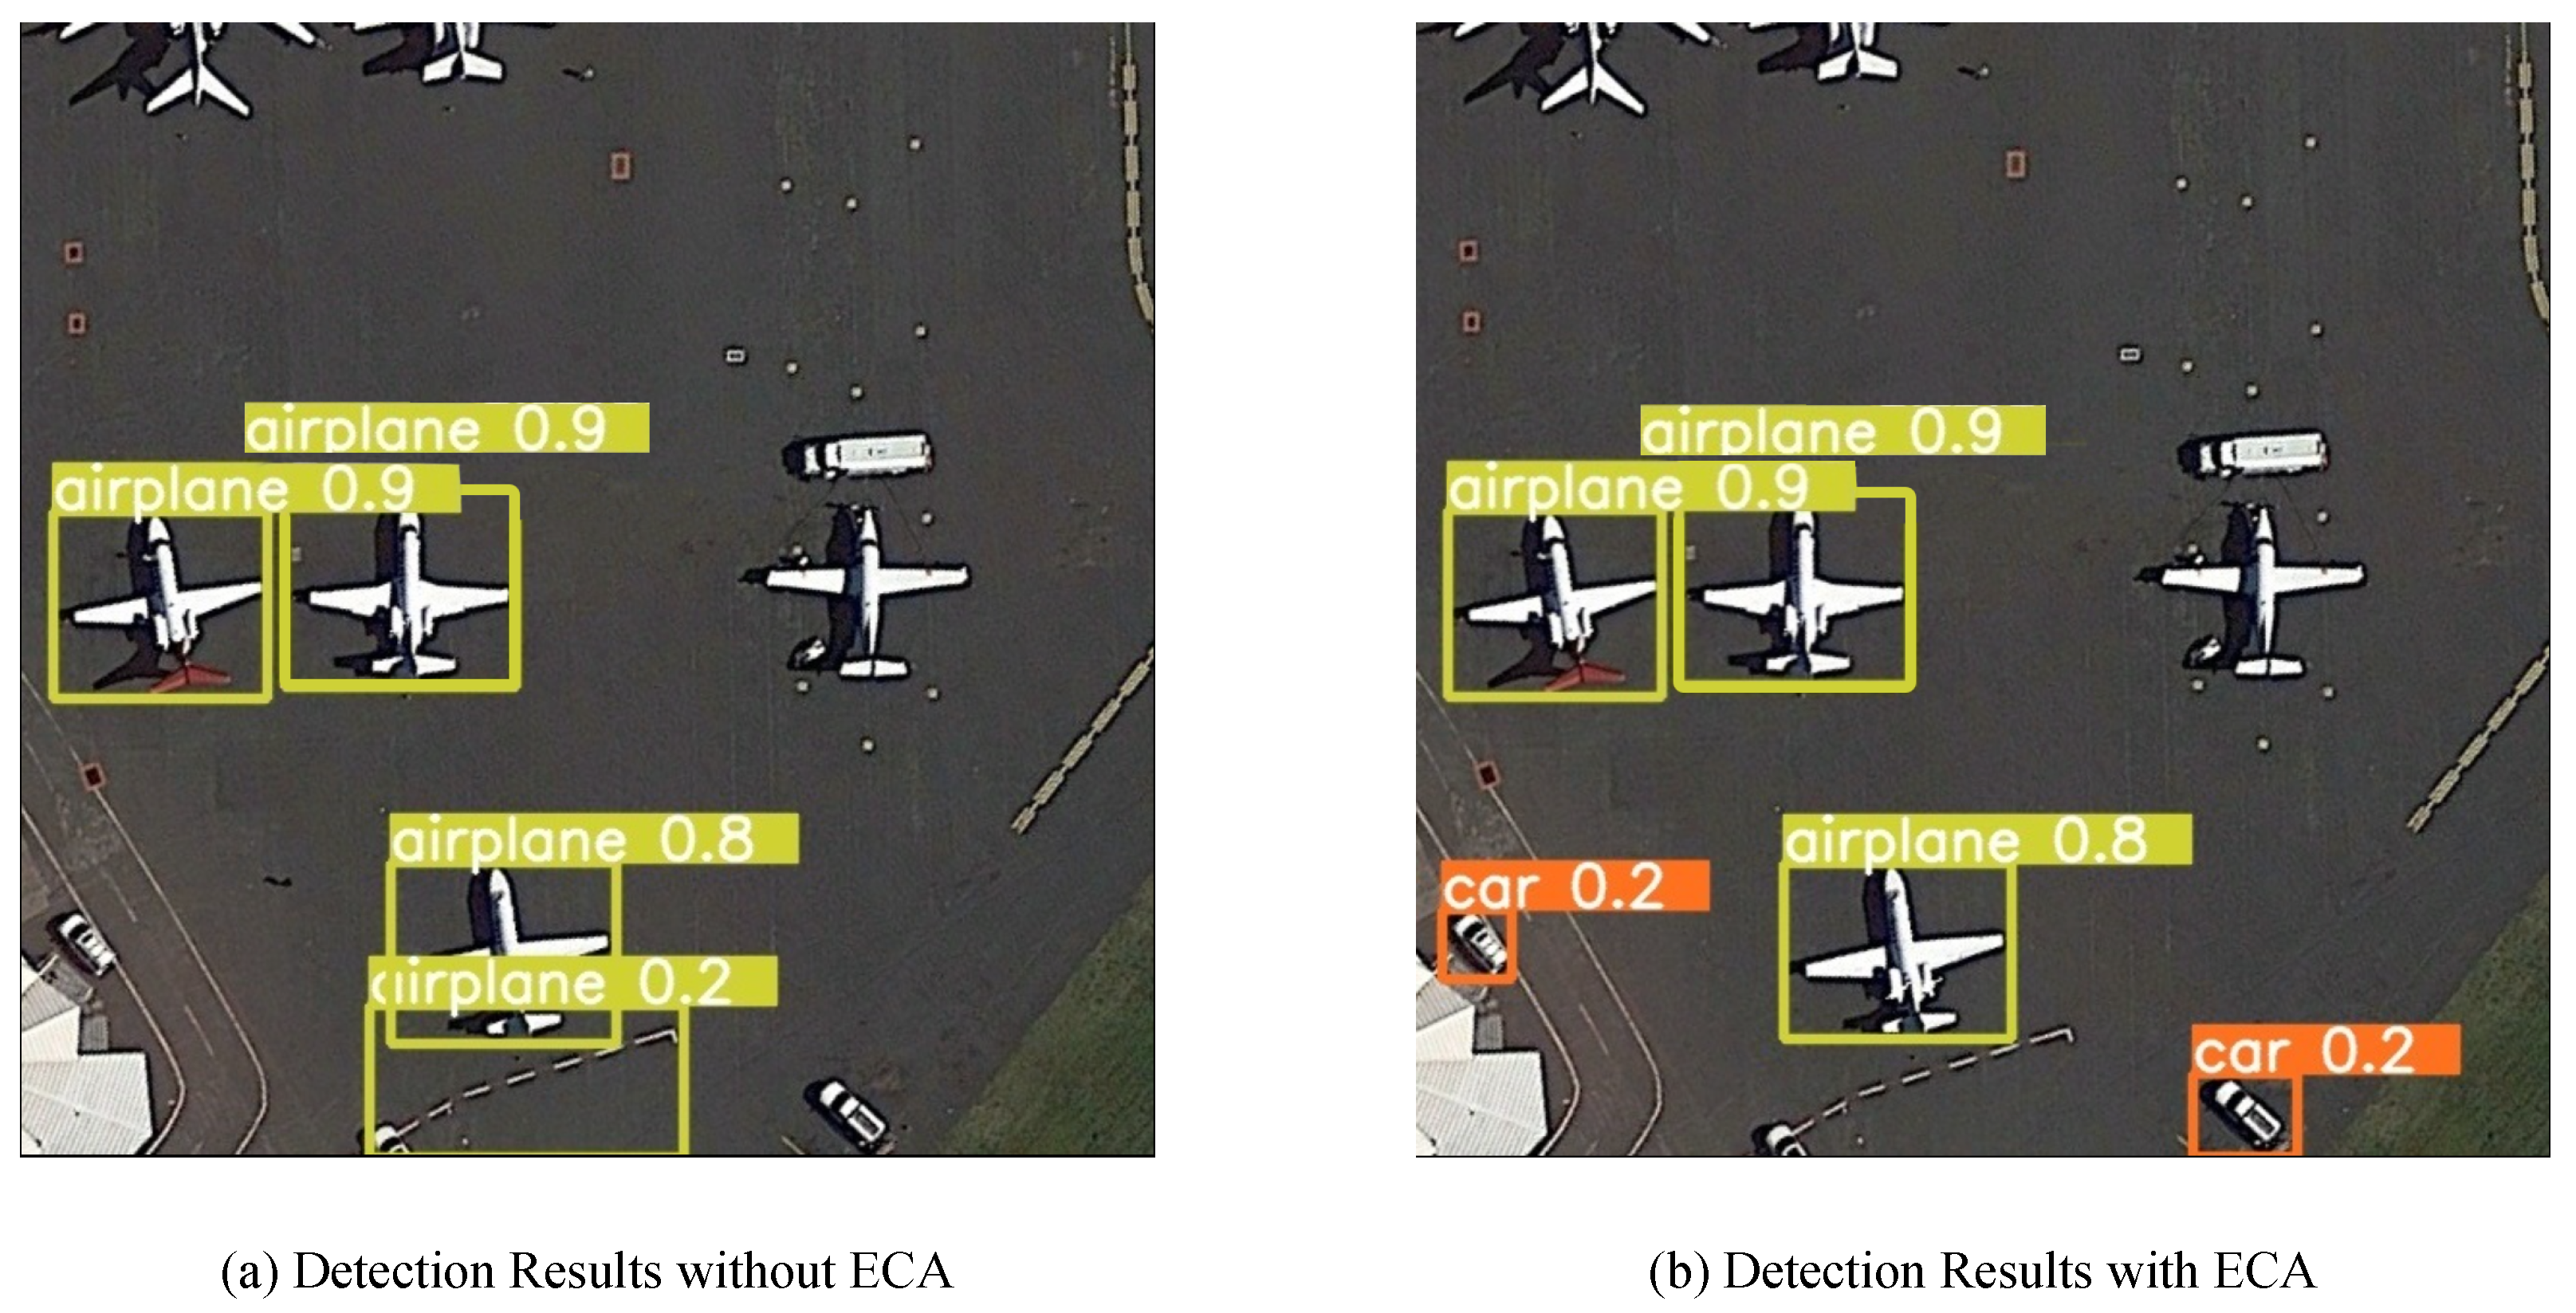
In the PAN-lite network, the ECA module was embedded. The model’s mAP was improved after embedding the ECA module, with a value of 64.48%. The addition of the ECA module improved the multi-scale feature fusion effect of the model, compensating for the accuracy loss caused by the PAN-lite’s streamlined design. To further study the multi-scale feature fusion effect of the ECA module, this study conducted a visual analysis of the detection results. As shown in Figure 16, after embedding the ECA module, the number of missed small objects such as vehicles are reduced, and the detection accuracy is improved.

5.1.4. Ablation Experiments of Data Augmentation

To verify the effectiveness of the proposed data augmentation method, we conducted ablation experiments by adding the data augmentation method during training. The model trained with data augmentation achieved an average precision mAP of 64.85 on the DIOR dataset, an improvement of 0.37%. It proved that adding data augmentation methods can help the model learn more representative information and improve detection accuracy.

6. Conclusions

Based on the existing target detection algorithm, we have proposed an enhanced attention mechanism and receptive field for the YOLO optical remote sensing model, which we refer to as RFA-YOLO. The key improvements in our approach include the utilization of lightweight backbone and feature fusion neck networks, aiming to enhance both model accuracy and detection speed. To reduce the model’s parameters without compromising performance, we employ deep separable convolution and SandGlass blocks. Additionally, we incorporate Receptive Field Block (RFB) and Efficient Channel Attention (ECA) modules to improve the precision scales of multiple detections and enable better detection of small targets. These enhancements allow for more accurate and detailed object detection capabilities. Furthermore, we prioritize detection speed by incorporating lightweight architectures such as MobileNext and PAN-lite networks. These networks help optimize the computational efficiency without sacrificing accuracy. Moreover, we enhance the detection accuracy by employing dilated convolutional-based receptive field blocks and ECA modules, which enable the model to capture more contextual information and improve object detection performance. By combining these techniques, our RFA-YOLO model achieves improved accuracy, faster detection speeds, and enhanced capabilities in handling various detection scenarios in optical remote sensing applications. The model is then fixed to the FPGA and deployed with low power consumption, achieving a better compromise between detection speed, accuracy, and power consumption. To demonstrate the effectiveness of the proposed object detection model and FPGA hardware acceleration scheme, we conduct a series of ablation experiments on different dataset, as well as comparative experiments on three hardware platforms: CPU, GPU, and FPGA. The experimental results show that the improved model achieves a mAP improvement of 4.57% compared to the baseline model, and achieves a detection speed of 27.97 FPS and an average power consumption of 15.82 W on the FPGA, reducing the power consumption by 89.72% compared to the GPU, and increasing the detection speed by 189.84% compared to the CPU, which can meet the requirements of onboard real-time detection applications. However, there are still some aspects of the proposed approach that can be improved, such as complex decoding and non-maximally suppressed post-processing operations that can easily lead to performance bottlenecks. Therefore, future research will focus on further optimizing the network model to achieve end-to-end detection. This involves refining the architecture, exploring advanced techniques, and integrating additional components to enhance the overall performance and efficiency of the detection process. By continuously improving the network model, we aim to achieve more accurate and robust end-to-end detection capabilities for various applications.
Author Contributions

Conceptualization, C.L. and R.X.; methodology, C.L. and R.X.; software, C.L. and R.X.; validation, C.L.; investigation, Y.L. and Y.Z.; writing—original draft preparation, C.L., R.X. and W.J.; writing—review and editing, C.L., Y.L. and Y.Z.; visualization, R.X.; supervision, W.J.; funding acquisition, C.L. All authors have read and agreed to the published version of the manuscript.

Funding

This research was funded by Natural Science Foundation of Heilongjiang Province (LH2023F003).

Data Availability Statement

The raw data required to reproduce these findings cannot be shared at this time as the data also forms part of an ongoing study.

Acknowledgments

Thanks to the Natural Science Foundation of Heilongjiang Province (LH2023F003) for providing financial support for this article.

Conflicts of Interest

The authors declare no conflict of interest.

References

  1. Dalal, N.; Triggs, B. Histograms of oriented gradients for human detection. In Proceedings of the 2005 IEEE Computer Society Conference on Computer Vision and Pattern Recognition (CVPR’05), San Diego, CA, USA, 20–25 June 2005; Volume 1, pp. 886–893. [Google Scholar]
  2. Lowe, D.G. Distinctive image features from scale-invariant keypoints. Int. J. Comput. Vis. 2004, 60, 91–110. [Google Scholar] [CrossRef]
  3. Krizhevsky, A.; Sutskever, I.; Hinton, G.E. Imagenet classification with deep convolutional neural networks. Adv. Neural Inf. Process. Syst. 2012, 25, 1–9. [Google Scholar] [CrossRef] [Green Version]
  4. LeCun, Y.; Bengio, Y.; Hinton, G. Deep learning. Nature 2015, 521, 436–444. [Google Scholar] [CrossRef]
  5. Simonyan, K.; Zisserman, A. Very deep convolutional networks for large-scale image recognition. arXiv 2014, arXiv:1409.1556. [Google Scholar]
  6. Arnold, S.S.; Nuzzaci, R.; Gordon-Ross, A. Energy budgeting for CubeSats with an integrated FPGA. In Proceedings of the 2012 IEEE Aerospace Conference, Big Sky, MT, USA, 3–10 March 2012; pp. 1–14. [Google Scholar]
  7. Tijtgat, N.; Van Ranst, W.; Goedeme, T.; Volckaert, B.; De Turck, F. Embedded real-time object detection for a UAV warning system. In Proceedings of the IEEE International Conference on Computer Vision Workshops, Venice, Italy, 22–29 October 2017; pp. 2110–2118. [Google Scholar]
  8. Vaddi, S. Efficient Object Detection Model for Real-Time UAV Applications. Ph.D. Thesis, Iowa State University, Ames, IA, USA, 2019. [Google Scholar]
  9. Amara, A.; Amiel, F.; Ea, T. FPGA vs. ASIC for low power applications. Microelectron. J. 2006, 37, 669–677. [Google Scholar] [CrossRef]
  10. Chen, W.H.; Hsu, H.J.; Lin, Y.C. Implementation of a Real-time Uneven Pavement Detection System on FPGA Platforms. In Proceedings of the 2022 IEEE International Conference on Consumer Electronics-Taiwan, Taipei, Taiwan, 6–8 July 2022; pp. 587–588. [Google Scholar]
  11. Liu, M.; Wang, X.; Zhou, A.; Fu, X.; Ma, Y.; Piao, C. UAV-YOLO: Small Object Detection on Unmanned Aerial Vehicle Perspective. Sensors 2020, 20, 2238. [Google Scholar] [CrossRef] [Green Version]
  12. Osco, L.P.; dos Santos de Arruda, M.; Marcato, J., Jr.; da Silva, N.B.; Ramos, A.P.M.; Akemi Saito Moryia, É.; Imai, N.N.; Pereira, D.R.; Creste, J.E.; Matsubara, E.T.; et al. A convolutional neural network approach for counting and geolocating citrus-trees in UAV multispectral imagery. ISPRS J. Photogramm. Remote Sens. 2020, 160, 97–106. [Google Scholar] [CrossRef]
  13. Li, Z.; Peng, C.; Yu, G.; Zhang, X.; Deng, Y.; Sun, J. DetNet: Design Backbone for Object Detection. In Proceedings of the European Conference on Computer Vision (ECCV), Munich, Germany, 8–14 September 2018. [Google Scholar]
  14. Huang, G.; Liu, Z.; van der Maaten, L.; Weinberger, K.Q. Densely Connected Convolutional Networks. In Proceedings of the IEEE Conference on Computer Vision and Pattern Recognition (CVPR), Honolulu, HI, USA, 21–26 July 2017. [Google Scholar]
  15. Liu, S.; Huang, D.; Wang, a. Receptive Field Block Net for Accurate and Fast Object Detection. In Proceedings of the European Conference on Computer Vision (ECCV), Munich, Germany, 8–14 September 2018. [Google Scholar]
  16. Szegedy, C.; Vanhoucke, V.; Ioffe, S.; Shlens, J.; Wojna, Z. Rethinking the Inception Architecture for Computer Vision. In Proceedings of the IEEE Conference on Computer Vision and Pattern Recognition (CVPR), Las Vegas, NV, USA, 27–30 June 2016. [Google Scholar]
  17. Vaswani, A.; Shazeer, N.; Parmar, N.; Uszkoreit, J.; Jones, L.; Gomez, A.N.; Kaiser, L.u.; Polosukhin, I. Attention is All you Need. In Advances in Neural Information Processing Systems; Guyon, I., Luxburg, U.V., Bengio, S., Wallach, H., Fergus, R., Vishwanathan, S., Garnett, R., Eds.; Curran Associates, Inc.: Red Hook, NY, USA, 2017; Volume 30. [Google Scholar]
  18. Han, L.; Zhao, Y.; Lv, H.; Zhang, Y.; Liu, H.; Bi, G. Remote Sensing Image Denoising Based on Deep and Shallow Feature Fusion and Attention Mechanism. Remote Sens. 2022, 14, 1243. [Google Scholar] [CrossRef]
  19. Rundo, L.; Han, C.; Nagano, Y.; Zhang, J.; Hataya, R.; Militello, C.; Tangherloni, A.; Nobile, M.S.; Ferretti, C.; Besozzi, D.; et al. USE-Net: Incorporating Squeeze-and-Excitation blocks into U-Net for prostate zonal segmentation of multi-institutional MRI datasets. Neurocomputing 2019, 365, 31–43. [Google Scholar] [CrossRef] [Green Version]
  20. Woo, S.; Park, J.; Lee, J.Y.; Kweon, I.S. CBAM: Convolutional Block Attention Module. In Proceedings of the European Conference on Computer Vision (ECCV), Munich, Germany, 8–14 September 2018. [Google Scholar]
  21. Li, H.; Qiu, K.; Chen, L.; Mei, X.; Hong, L.; Tao, C. SCAttNet: Semantic Segmentation Network With Spatial and Channel Attention Mechanism for High-Resolution Remote Sensing Images. IEEE Geosci. Remote Sens. Lett. 2021, 18, 905–909. [Google Scholar] [CrossRef]
  22. Hou, Q.; Zhou, D.; Feng, J. Coordinate Attention for Efficient Mobile Network Design. In Proceedings of the IEEE/CVF Conference on Computer Vision and Pattern Recognition (CVPR), Nashville, TN, USA, 20–25 June 2021; pp. 13713–13722. [Google Scholar]
  23. Wang, Q.; Wu, B.; Zhu, P.; Li, P.; Zuo, W.; Hu, Q. ECA-Net: Efficient Channel Attention for Deep Convolutional Neural Networks. In Proceedings of the IEEE/CVF Conference on Computer Vision and Pattern Recognition (CVPR), Seattle, WA, USA, 13–19 June 2020. [Google Scholar]
  24. Cheng, J.; Grossman, M.; McKercher, T. Professional CUDA c Programming; John Wiley & Sons: Hoboken, NJ, USA, 2014. [Google Scholar]
  25. Zhang, C.; Li, P.; Sun, G.; Guan, Y.; Xiao, B.; Cong, J. Optimizing FPGA-Based Accelerator Design for Deep Convolutional Neural Networks. In Proceedings of the 2015 ACM/SIGDA International Symposium on Field-Programmable Gate Arrays, Monterey, CA, USA, 22–24 February 2015; FPGA’15. pp. 161–170. [Google Scholar] [CrossRef]
  26. Meloni, P.; Capotondi, A.; Deriu, G.; Brian, M.; Conti, F.; Rossi, D.; Raffo, L.; Benini, L. NEURAghe: Exploiting CPU-FPGA Synergies for Efficient and Flexible CNN Inference Acceleration on Zynq SoCs. ACM Trans. Reconfig. Technol. Syst. 2018, 11, 1–24. [Google Scholar] [CrossRef] [Green Version]
  27. Chen, Y.H.; Yang, T.J.; Emer, J.; Sze, V. Eyeriss v2: A Flexible Accelerator for Emerging Deep Neural Networks on Mobile Devices. IEEE J. Emerg. Sel. Top. Circuits Syst. 2019, 9, 292–308. [Google Scholar] [CrossRef] [Green Version]
  28. Kim, K.; Jang, S.J.; Park, J.; Lee, E.; Lee, S.S. Lightweight and Energy-Efficient Deep Learning Accelerator for Real-Time Object Detection on Edge Devices. Sensors 2023, 23, 1185. [Google Scholar] [CrossRef]
  29. Li, L.; Zhang, S.; Wu, J. Efficient Object Detection Framework and Hardware Architecture for Remote Sensing Images. Remote Sens. 2019, 11, 2376. [Google Scholar] [CrossRef] [Green Version]
  30. Ding, W.; Huang, Z.; Huang, Z.; Tian, L.; Wang, H.; Feng, S. Designing efficient accelerator of depthwise separable convolutional neural network on FPGA. J. Syst. Archit. 2019, 97, 278–286. [Google Scholar] [CrossRef]
  31. Nguyen, D.T.; Nguyen, T.N.; Kim, H.; Lee, H.J. A High-Throughput and Power-Efficient FPGA Implementation of YOLO CNN for Object Detection. IEEE Trans. Very Large Scale Integr. (VLSI) Syst. 2019, 27, 1861–1873. [Google Scholar] [CrossRef]
  32. Zhou, D.; Hou, Q.; Chen, Y.; Feng, J.; Yan, S. Rethinking Bottleneck Structure for Efficient Mobile Network Design. In Proceedings of the Computer Vision—ECCV 2020: 16th European Conference, Glasgow, UK, 23–28 August 2020; Proceedings, Part III. pp. 680–697. [Google Scholar] [CrossRef]
  33. Chollet, F. Xception: Deep Learning With Depthwise Separable Convolutions. In Proceedings of the IEEE Conference on Computer Vision and Pattern Recognition (CVPR), Honolulu, HI, USA, 21–26 July 2017. [Google Scholar]
  34. Niu, Z.; Zhong, G.; Yu, H. A review on the attention mechanism of deep learning. Neurocomputing 2021, 452, 48–62. [Google Scholar] [CrossRef]
  35. Guo, M.H.; Xu, T.X.; Liu, J.J.; Liu, Z.N.; Jiang, P.T.; Mu, T.J.; Zhang, S.H.; Martin, R.R.; Cheng, M.M.; Hu, S.M. Attention mechanisms in computer vision: A survey. Comput. Vis. Media 2022, 8, 331–368. [Google Scholar] [CrossRef]
  36. Li, K.; Wan, G.; Cheng, G.; Meng, L.; Han, J. Object detection in optical remote sensing images: A survey and a new benchmark. ISPRS J. Photogramm. Remote Sens. 2020, 159, 296–307. [Google Scholar] [CrossRef]
  37. Girshick, R. Fast r-cnn. In Proceedings of the IEEE International Conference on Computer Vision, Santiago, Chile, 7–13 December 2015; pp. 1440–1448. [Google Scholar]
  38. Redmon, J.; Farhadi, A. Yolov3: An incremental improvement. arXiv 2018, arXiv:1804.02767. [Google Scholar]
  39. Liu, W.; Anguelov, D.; Erhan, D.; Szegedy, C.; Reed, S.; Fu, C.Y.; Berg, A.C. Ssd: Single shot multibox detector. In Proceedings of the Computer Vision–ECCV 2016: 14th European Conference, Amsterdam, The Netherlands, 11–14 October 2016; Proceedings, Part I 14. pp. 21–37. [Google Scholar]
  40. Cai, Z.; Vasconcelos, N. Cascade R-CNN: High Quality Object Detection and Instance Segmentation. IEEE Trans. Pattern Anal. Mach. Intell. 2021, 43, 1483–1498. [Google Scholar] [CrossRef] [PubMed] [Green Version]
  41. Lin, T.Y.; Goyal, P.; Girshick, R.; He, K.; Dollar, P. Focal Loss for Dense Object Detection. In Proceedings of the IEEE International Conference on Computer Vision (ICCV), Venice, Italy, 22–29 October 2017. [Google Scholar]
  42. Duan, K.; Bai, S.; Xie, L.; Qi, H.; Huang, Q.; Tian, Q. CenterNet: Keypoint Triplets for Object Detection. In Proceedings of the IEEE/CVF International Conference on Computer Vision (ICCV), Seoul, Republic of Korea, 27 October–2 November 2019. [Google Scholar]
Figure 1. Flow of object detection. The CNN parts of feature extraction, feature fusion, and regression prediction will be deployed on FPGA to achieve hardware acceleration.
Remotesensing 15 03975 g001
Figure 2. CSP Block Structure. YOLOv4 uses CSPDarknet53 as the backbone network based on a cross-stage partial connection (CSP).
Remotesensing 15 03975 g002
Figure 3. SandGlass network structure. The SandGlass block reduces dimensions and then expands dimensions of input features, which are in a shape resembling an hourglass.
Remotesensing 15 03975 g003
Figure 4. A 3 × 3 standard convolution, and a 3 × 3 dilated convolution for which the dilation rate is 2.
Remotesensing 15 03975 g004
Figure 5. RFB network structure.
Remotesensing 15 03975 g005
Figure 6. Network structure of backbone.
Remotesensing 15 03975 g006
Figure 7. PAN-lite Neck network structure.
Remotesensing 15 03975 g007
Figure 8. The depthwise separable convolution.
Remotesensing 15 03975 g008
Figure 9. Visualizations of data augmentation.
Remotesensing 15 03975 g009
Figure 10. IoU of bounding boxes.
Remotesensing 15 03975 g010
Figure 11. Architecture of the DPU acceleration application.
Remotesensing 15 03975 g011
Figure 12. Flow of iterative quantization.
Remotesensing 15 03975 g012
Figure 13. Xilinx ZCU104 Board.
Remotesensing 15 03975 g013
Figure 14. Some samples of the DIOR optical remote sensing dataset.
Remotesensing 15 03975 g014
Figure 15. Feature heatmap of RFB module.
Remotesensing 15 03975 g015
Figure 16. Detection results of model without ECA module and model without ECA module.
Remotesensing 15 03975 g016
Table 1. Parameters of DPU architectures.
Hardware
Architecture
Pixel
Parallelism
Channel
Parallelism
LUTsRegistersPeak Ops
B5124835,43527,893512
B80041042,77330,468800
B10248850,76334,4711024
B115241249,04033,2381152
B160081063,03338,7161600
B230481273,32642,8422304
B313681485,77847,6673136
B4096816105,00853,5404096
Table 2. Comparison experiments on DIOR dataset.
MethodBackbonemAP
Faster R-CNNVGG1654.16
SSDVGG1658.67
YOLOv3Darknet5357.17
Cascade R-CNNResnet5064.71
RetinaNetResnet5065.71
CenterNetHourglass-10452.39
OursMobilenext-RFB 64.85
Table 3. Comparison experiments for parameters.
MethodBackboneParameters
Faster R-CNNVGG16130.70 M
SSDVGG1625.07 M
YOLOv3Darknet5359.13 M
Cascade R-CNNResnet50270.31 M
RetinaNetResnet5035.07 M
CenterNetHourglass-104182.50 M
OursMobilenext-RFB24.75 M
Table 4. Comparison experiments for different Hardware Accelerator.
FPGACPUGPU
PlatformXCZU7EVi7-6700Tesla-V100
Frequency (MHz)20037001370
FPS 27.97 9.6520.80
Average (W) 15.82 41.75153.86
Table 5. Ablation experiments on DIOR dataset.
BackboneNeckData AugmentationmAP
CSP-Darknet53PANno60.28
MobileNextPANno58.63
MobileNext-RFBPANno60.75
MobileNext-RFBPAN-liteno60.03
MobileNext-RFBPAN-lite-ECAno64.48
MobileNext-RFBPAN-lite-ECAyes64.85
Table 6. Ablation experiments for parameters.
BackboneNeckParameters
CSP-Darknet53PAN60.08 M
MobileNextPAN36.44 M
MobileNext-RFBPAN36.58 M
MobileNext-RFBPAN-lite13.52 M
MobileNext-RFBPAN-lite-ECA24.75 M
Disclaimer/Publisher’s Note: The statements, opinions and data contained in all publications are solely those of the individual author(s) and contributor(s) and not of MDPI and/or the editor(s). MDPI and/or the editor(s) disclaim responsibility for any injury to people or property resulting from any ideas, methods, instructions or products referred to in the content.