Communication

Accuracy Improvement of High-Resolution Wide-Swath Spaceborne Synthetic Aperture Radar Imaging with Low Pule Repetition Frequency

1
School of Electronic Science and Engineering, Nanjing University, Nanjing 210023, China
2
Nanjing Research Institute of Electronics Technology, Nanjing 210039, China
*
Author to whom correspondence should be addressed.
Remote Sens. 2023, 15(15), 3811; https://doi.org/10.3390/rs15153811
Submission received: 18 June 2023 / Revised: 26 July 2023 / Accepted: 27 July 2023 / Published: 31 July 2023
(This article belongs to the Special Issue Spaceborne High-Resolution SAR Imaging)

Abstract

:
For a single-channel spaceborne synthetic aperture radar (SAR), the usage of a low pulse repetition frequency (PRF) is an effective technical way to extend the range swath. The sub-aperture imaging strategy is usually used to solve the problem of azimuth spectrum aliasing under the condition of a low PRF. However, the required up-sampling processing before the coherent synthesis of sub-images will lead to spectrum discontinuity between adjacent sub-images, which leads to an obvious grating lobe phenomenon after the process of sub-image synthesis, resulting in a significant decrease in image quality. For this issue, a high-resolution wide-swath (HRWS) imaging algorithm for a spaceborne SAR with a low PRF is proposed in this paper based on optimal spectrum shift processing. First, each sub-aperture is imaged using the typical range migration algorithm (RMA), and then all sub-images are up-sampled at the same time. Then, based on the criterion of the minimum grating lobe, the optimal spectrum shift is estimated. Finally, the spectrum of all sub-images is shifted and then all the shifted sub-images are synthesized coherently. The simulation data processing results verify the effectiveness of the proposed method.

1. Introduction

Spaceborne synthetic aperture radar (SAR) can actively achieve high-resolution, wide-swath, all-day, and all-weather imaging of the observation area [1,2,3,4,5,6,7]. Therefore, it has been widely used in military reconnaissance, mapping, resource surveys, and other fields. It is well known that high-resolution and wide-range swaths have always been two important imaging indicators of spaceborne SAR. With the continuous increase in the demand for radar imaging, one usually hopes to meet the demand for high resolutions and a large range swath simultaneously, so that high-resolution wide-swath (HRWS) SAR has become a hot issue in spaceborne SAR technology research [8,9,10,11,12].
However, in traditional single-channel spaceborne SAR, the limitation on the minimum antenna area makes it impossible to enhance the azimuth resolution and enlarge the range swath simultaneously. For this problem, one method is to use azimuth multi-channel technology, that is, to first obtain the radar echo signal with no aliasing of the azimuth spectrum through azimuth multi-channel signal reconstruction and then use standard imaging algorithms to achieve precise focusing, therefore achieving HRWS imaging [13,14,15,16,17]. However, with the continuous improvement in imaging indicators, the number of azimuth channels may increase significantly, and it will be insufficient to rely on azimuth multi-channel technology to improve imaging performance. At the same time, the amplitude and phase errors between multiple channels can adversely affect image quality [18,19,20]. Another method is to use a single-channel, low pulse repetition frequency (PRF) technique. Under the premise of avoiding range ambiguity and azimuth instantaneous bandwidth ambiguity, the lowest possible PRF can be selected to maximize the range swath. Compared with the multi-channel imaging system, the single-channel low-PRF imaging system greatly reduces the hardware cost and system complexity, so the low-PRF SAR could become a research hotspot in the future.
For a single-channel low-PRF imaging system, the sliding spotlight mode is usually required to meet the requirements of a high resolution and a wide range swath, which will make the entire Doppler bandwidth much larger than the PRF, resulting in serious aliasing in the azimuth spectrum. To solve the problem of azimuth spectrum aliasing, there are currently two types of mainstream methods: the classical two-step method [21] and the baseband azimuth scaling (BAS) method [22]. The two-step method is a full-aperture method based on a two-step processing strategy, which first performs azimuth filtering via spectrum analysis to remove azimuth aliasing and then uses the traditional striping algorithm to process it. The BAS method belongs to the sub-aperture method. It divides the radar echo data into multiple sub-apertures in the azimuth direction for range cell migration correction (RCMC), stitches together the multiple sub-aperture data after RCMC to obtain the full-aperture data, and finally performs azimuth compression on the full-aperture data to obtain full-aperture SAR images. Both methods are based on a full-aperture strategy during the final azimuth compression process, so their real-time imaging performance may be poor. Alternatively, this paper adopts the idea of sub-image synthesis. In the algorithm, the sub-aperture data are first imaged, and then all sub-images are coherently synthesized. It should be noted that the azimuth resolution unit of each sub-image is much larger than the azimuth resolution of the full-aperture image, so if one directly synthesizes all the sub-images, the resolution of the final image cannot be enhanced. Therefore, all the sub-images are required to be up-sampled before synthesis. However, the up-sampling of sub-images may lead to discontinuities in the spectrum between adjacent sub-images, resulting in obvious grating lobes in the synthesized image. To solve this problem, an HRWS SAR imaging algorithm with a low PRF based on the minimum gating lobe is proposed, which can effectively suppress the gating lobe phenomenon after sub-image synthesis through the optimal spectrum shift of adjacent sub-images. Here, the spectrum shift of adjacent sub-images is estimated by optimal modeling, and the estimation criterion is the optimal image quality criterion, which can maximize the imaging quality of spaceborne HRWS SAR. In summary, the contribution of this paper is that we proposed an HRWS SAR imaging algorithm with a low PRF based on the minimum grating lobe, in which, by using sub-aperture processing and optimal spectrum shift, the grating lobe in the image can be maximally suppressed.
Section 2 of this paper mainly presents the design of the system parameters of the low-PRF spaceborne SAR. Section 3 discusses the imaging algorithm proposed in this paper in detail based on parameter design. Section 4 verifies the effectiveness of the proposed algorithm using simulation data. Section 5 summarizes the content of this paper.

2. Parameter Design of the Low-PRF SAR System

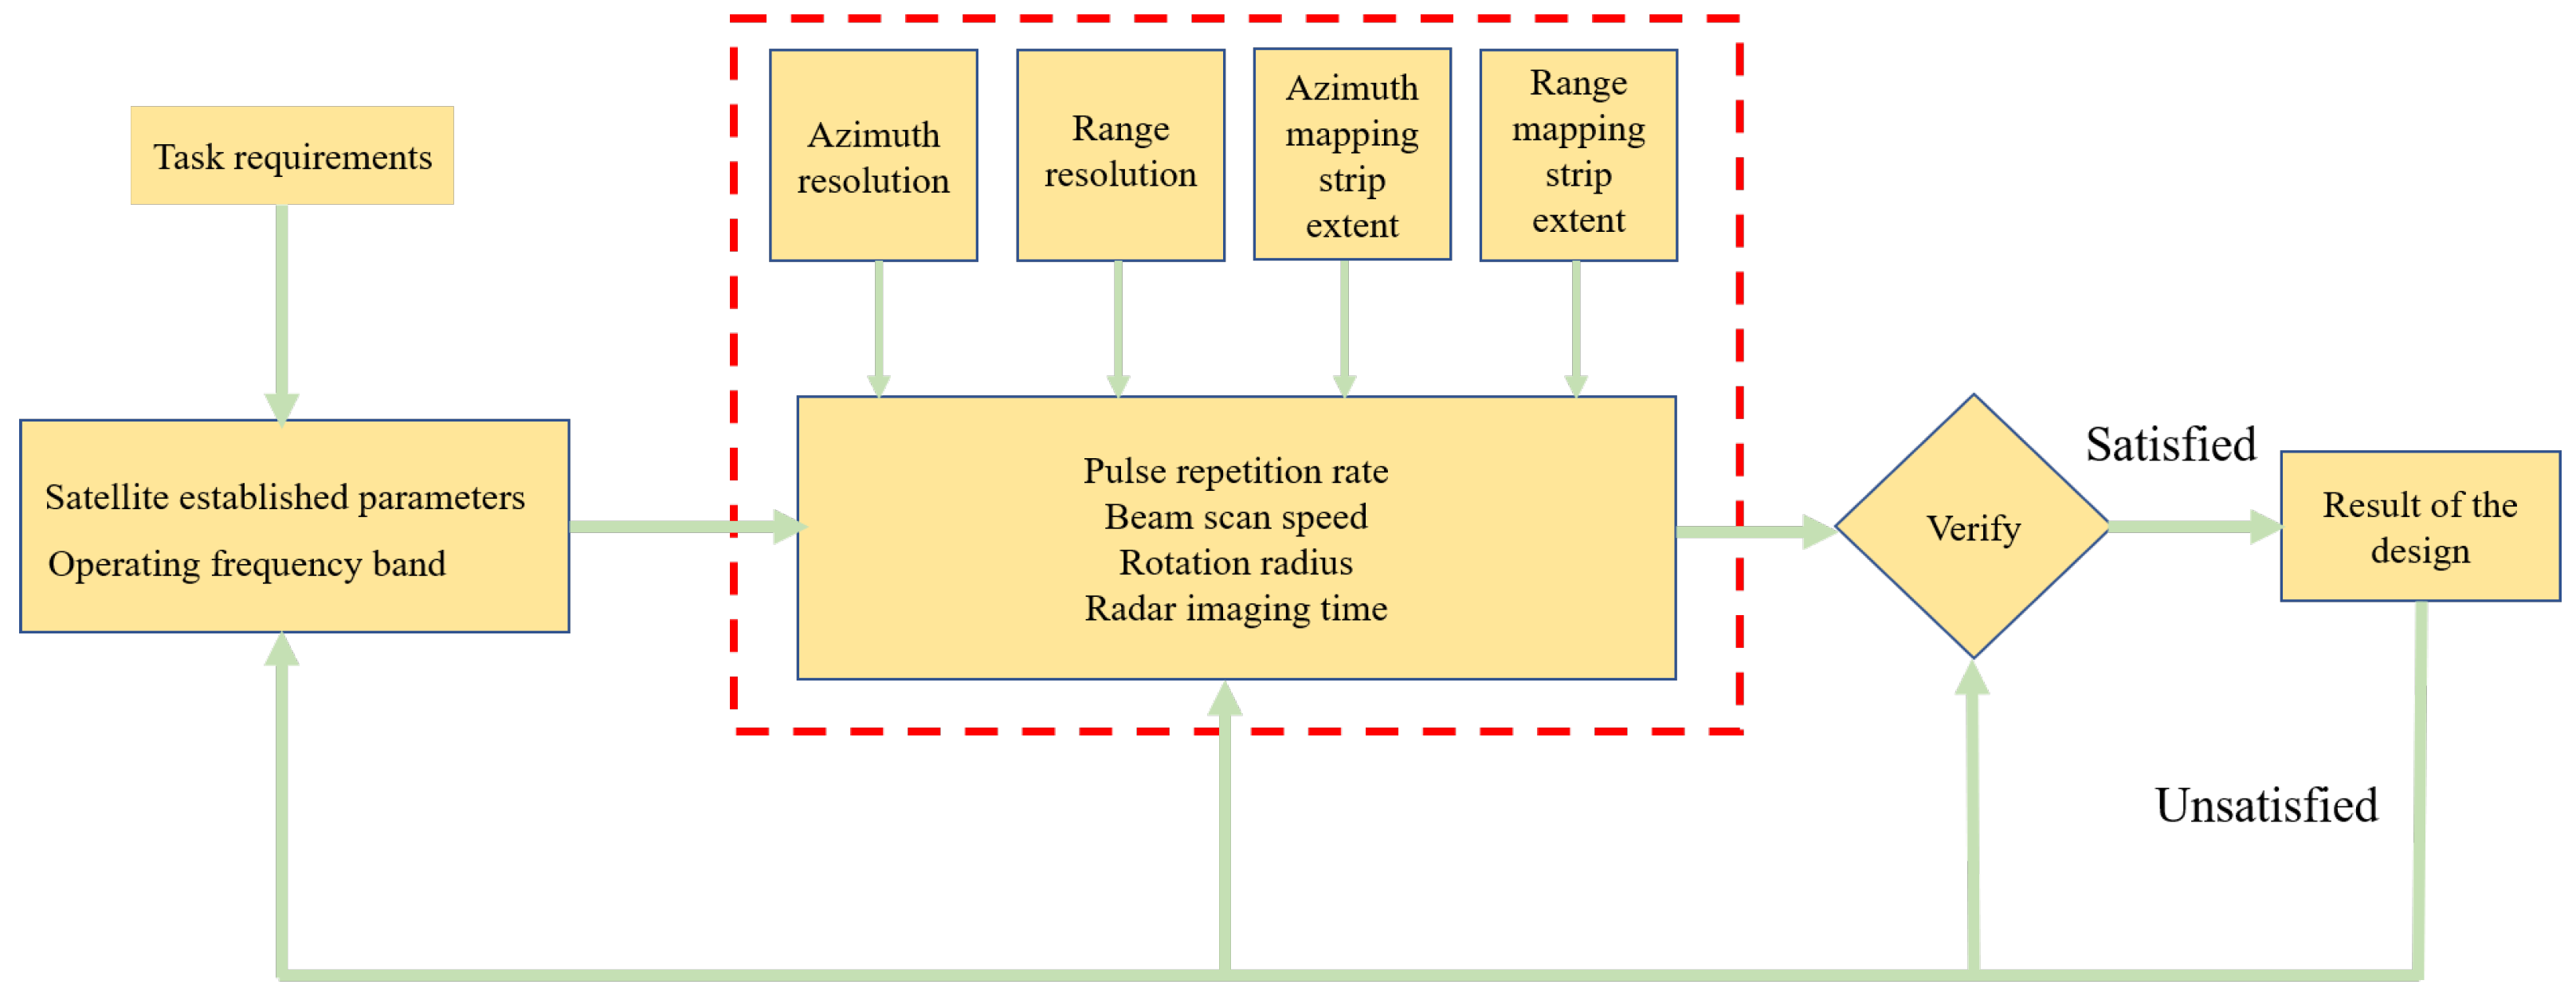
2.1. Parameter Design Process

A practical spaceborne SAR system usually needs to consider many parameters in the system design, and there is a certain relationship between the various parameters. Before the design of system parameters, it is necessary to analyze the radar system in combination with the task requirements. Firstly, the optimal working mode is determined according to the application requirements, and then some simple parameters such as the frequency band, antenna size, and pulse width are determined. Finally, based on the established parameters and imaging indicators, the PRF, transmitted signal bandwidth, and some undetermined parameters are determined for a specific working mode. At present, the modes of the SAR system mainly include the strip-map mode, spotlight mode, and sliding spotlight mode, etc. Considering that its scene size is wider than that of the spotlight mode, and its resolution is finer than that of the strip-map mode with the same antenna size, the sliding spotlight mode is adopted to achieve spaceborne HRWS SAR imaging.
After the sliding spotlight mode is determined, TerraSAR-X, currently in orbit, is used as a reference to set the system parameters and imaging indicators, as shown in Table 1. In Table 1, W r ,   W a ,   ρ a ,   ρ r are the defined imaging indicators, and H , T p ,   f c ,   D a are the established parameters, where W r represents the range swath, W a is the azimuth swath, ρ a represents the azimuth resolution, and ρ r represents the range resolution. Furthermore, H is the satellite altitude, T p denotes the pulse width, f c is the signal carrier frequency, and D a denotes the antenna azimuth size. The overall design flowchart of specific system parameters is shown in Figure 1. Firstly, the working mode of the sliding spotlight is determined based on application requirements. Then, the PRF is optimized. Finally, the other main azimuth scanning parameters corresponding to the sliding spotlight mode are optimized. It should be emphasized that there is no significant difference between the parameter design in this section and the traditional design methods. The main purpose of presenting the parameter design is to provide the optimal system parameters for subsequent imaging processing.

2.2. Design of PRF

The selection of PRF is key to system parameter design. The design goal of this paper is to select the lowest PRF under the premise of meeting the imaging indicators and imaging feasibility. Choosing the appropriate PRF mainly requires the consideration of three aspects: firstly, the mask of the emission pulse should be avoided (see ① in Equation (1)); secondly, it needs to avoid the influence of the echo from the sub-satellite point (see ② in Equation (1)); thirdly, the PRF should be bigger than the instantaneous Doppler bandwidth (see ③ in Equation (1)). Therefore, this paper models the problem of PRF design as the following optimization problem:
  min   PRF   s . t . i 2 R n c t p Δ t P R F i + 1 2 R f c + t p + Δ t     i 2 R n c t n a d i r Δ t 2 H c P R F i + 1 2 R f c + t p + Δ t 2 H c   P R F 4 v a λ sin θ a 2  
where i indicates the ith transmitted pulse, R n is the nearest slant range, R f denotes the farthest slant range, t p is the pulse duration, Δ t denotes the protection time between the transmitted and received signals, t n a d i r is the time delay of the sub-satellite point echo, H is the satellite altitude, θ a is the azimuth beam width, V a denotes the equivalent speed of the radar platform, λ denotes the signal wavelength, and c denotes the speed of light.

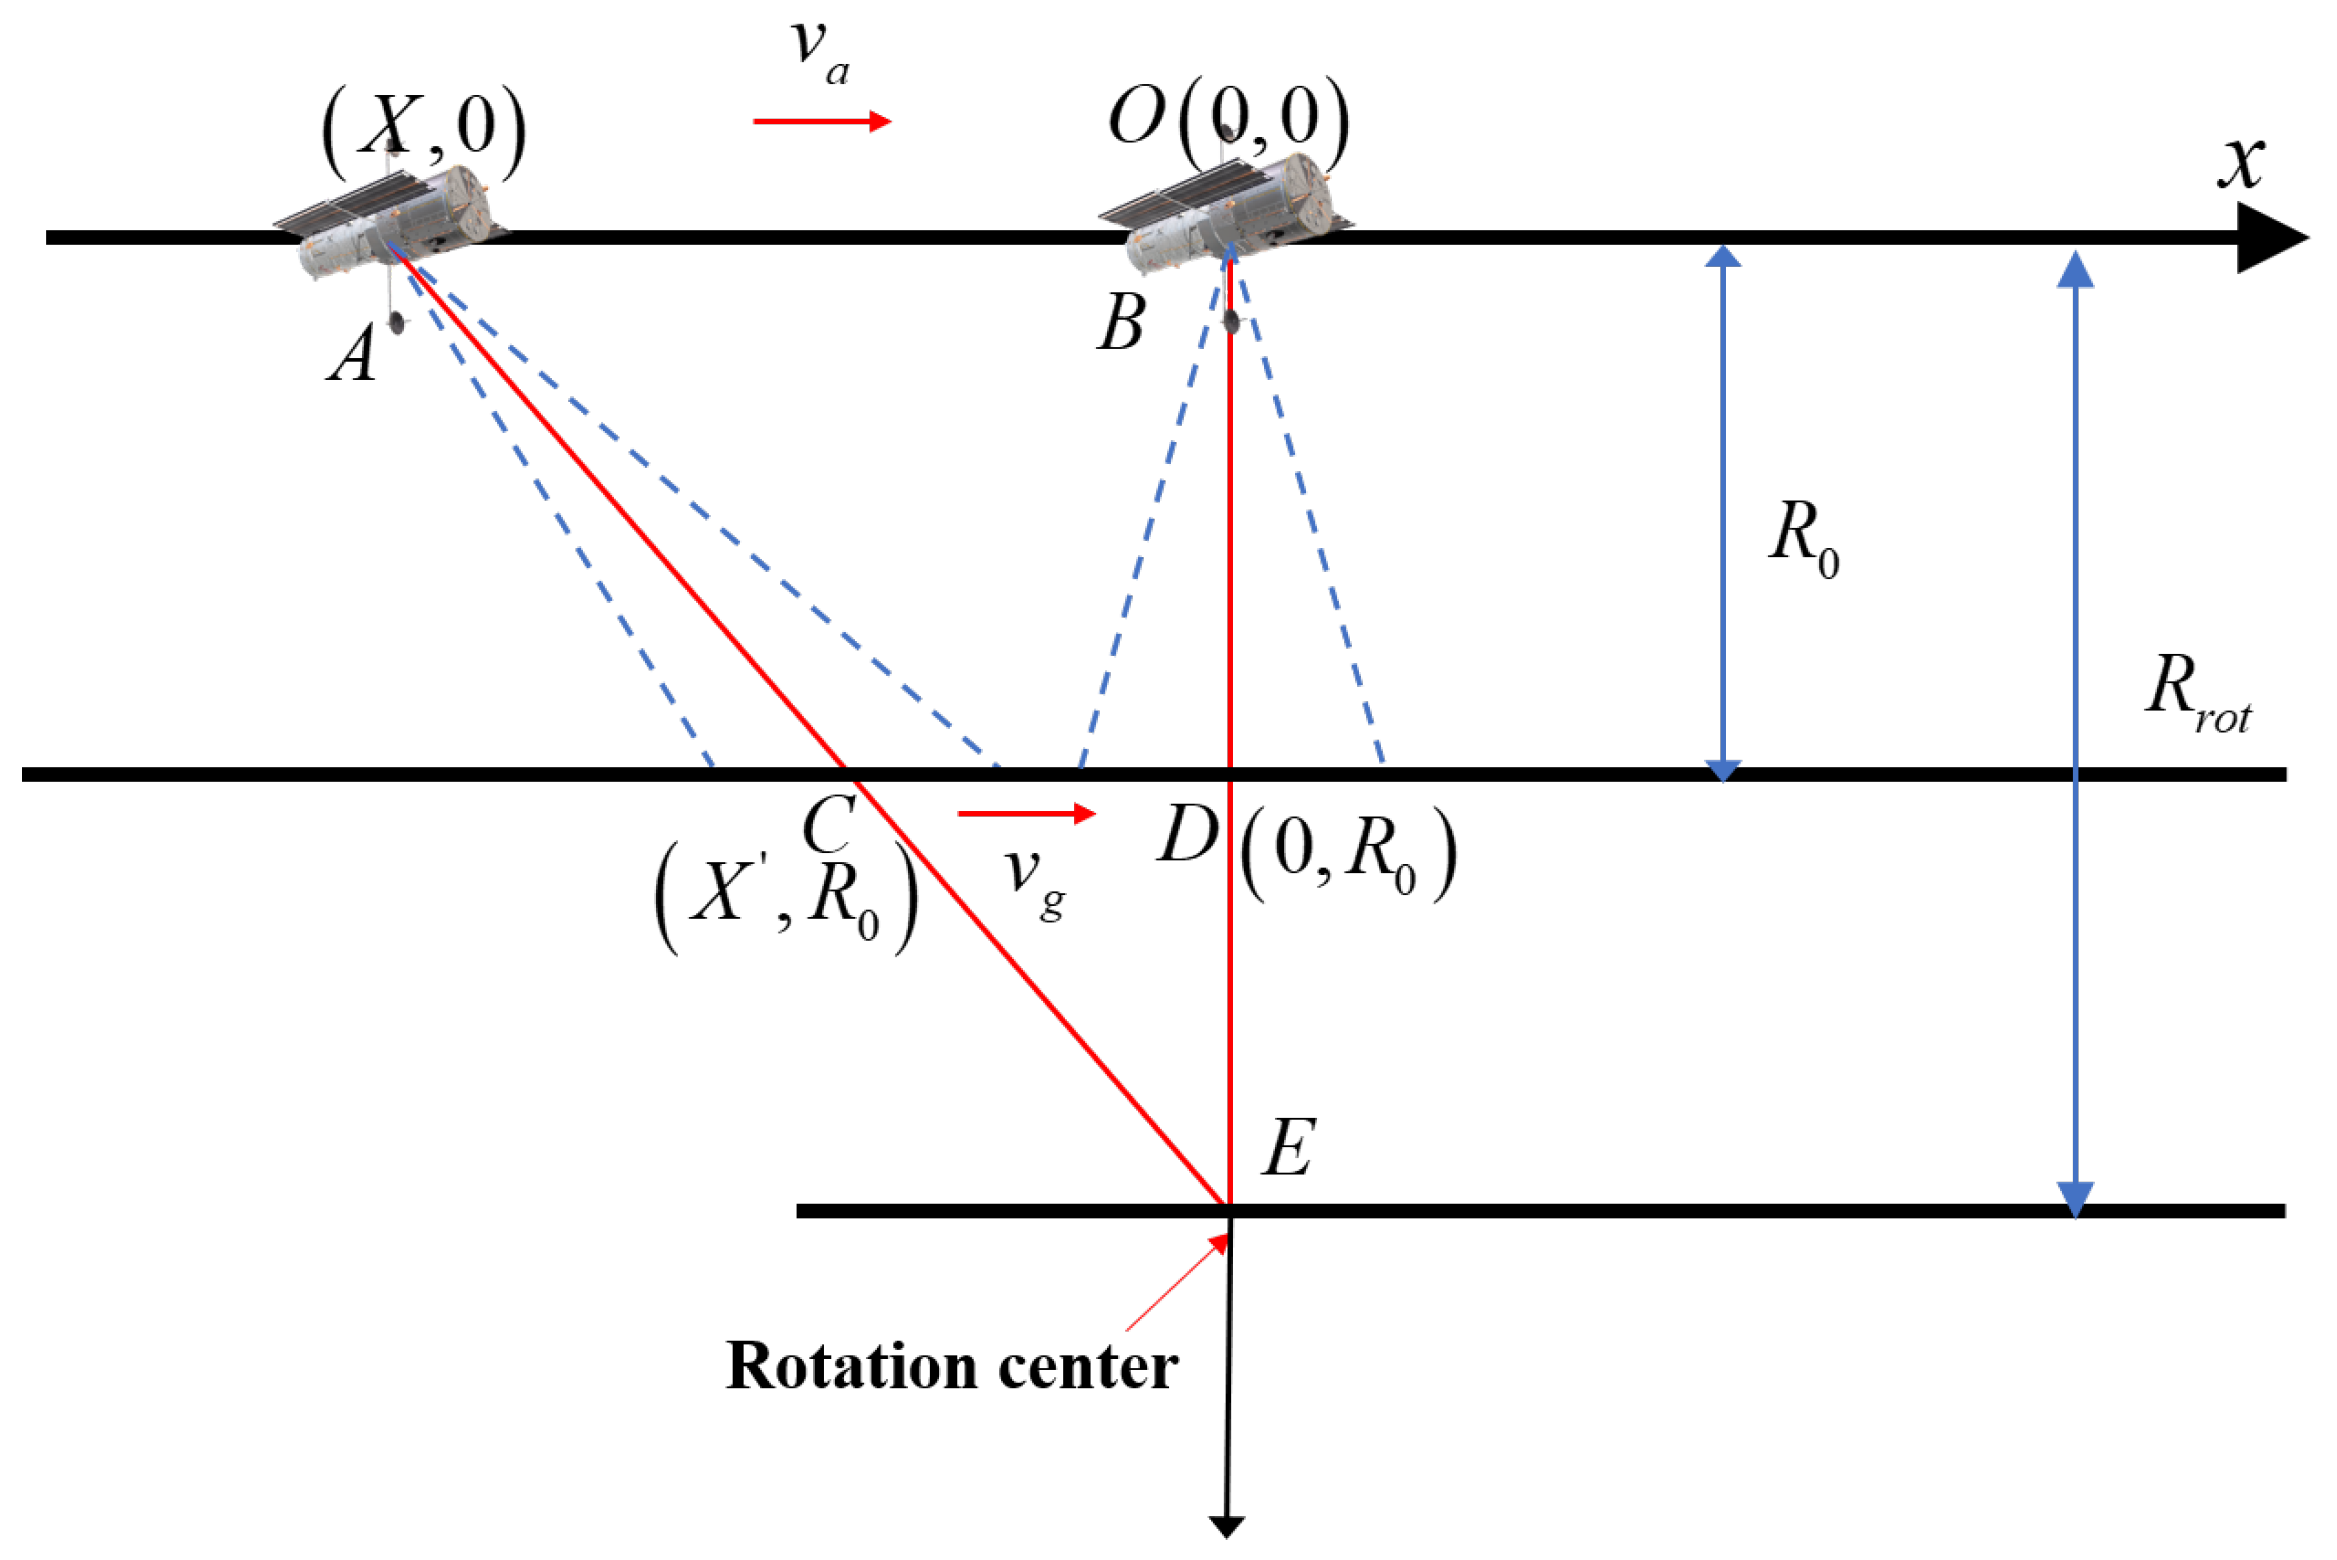
2.3. Design of Azimuth Sweep Parameters

A schematic of the sliding spotlight SAR is shown in Figure 2. During a short period, the trajectory of the spaceborne SAR can be approximated as a linear trajectory. In Figure 2, we assume that the aircraft is flying in the direction x. The radar beam is irradiated at a point of C on the ground. R 0 represents the nearest slant range. R r o t represents the nearest range from the radar to the rotation center. v g indicates the speed of the radar beam moving on the ground.
We suppose that the squint angle of the spaceborne SAR is θ s c ; then, its azimuth resolution can be expressed as [23]
ρ a = D a 2 cos θ s c V g V a
where D a denotes the azimuth size of the antenna. The beam scanning speed on the ground can be calculated as follows:
V g = 2 V a · ρ a D a
For the sliding spotlight mode, the sliding factor K m is often introduced. The pointing of the antenna beam can be described by parameter K m as [24]
K m = V g V a = R r o t R 0 R r o t
where R r o t is the rotation radius. From (4), R r o t can be expressed as
R r o t = R 0 1 K m
We suppose that the spaceborne SAR antenna scanning range is denoted as θ max , θ max , and then its azimuth scene size can be expressed as [25]
W a = 2 θ max R 0 v a v g v g + L s
where L s is the beam width on the ground. Then, the antenna scanning range can be obtained according to the azimuth swath:
θ max = W a L s 2 v g R 0 v a v g
According to the geometry of Figure 3, the angular velocity of the antenna beam scan is calculated as
ω V a V g R
After that, the synthetic aperture time can be obtained as
T s = 2 θ max v a v g R 0

2.4. Parameter Design Results

In this paper, the minimum PRF to meet the imaging requirements is designed to be about 3000 Hz. Then, the signal transmission bandwidth is calculated. To meet the range resolution of 0.3 m, the signal bandwidth designed in this paper should be higher than 1.1 GHz. Subsequently, the azimuth scanning parameters are designed, in which the radar beam speed on the ground is calculated as 979 m/s, and then the sliding factor is calculated as 0.13. The rotation radius is calculated as 982 km. Finally, the synthetic aperture time is designed as 11 s. To date, all the undetermined parameters of the sliding spotlight SAR that meet the imaging indicators have been calculated, which are summarized in Table 1.

3. Spaceborne HRWS SAR Imaging Algorithm
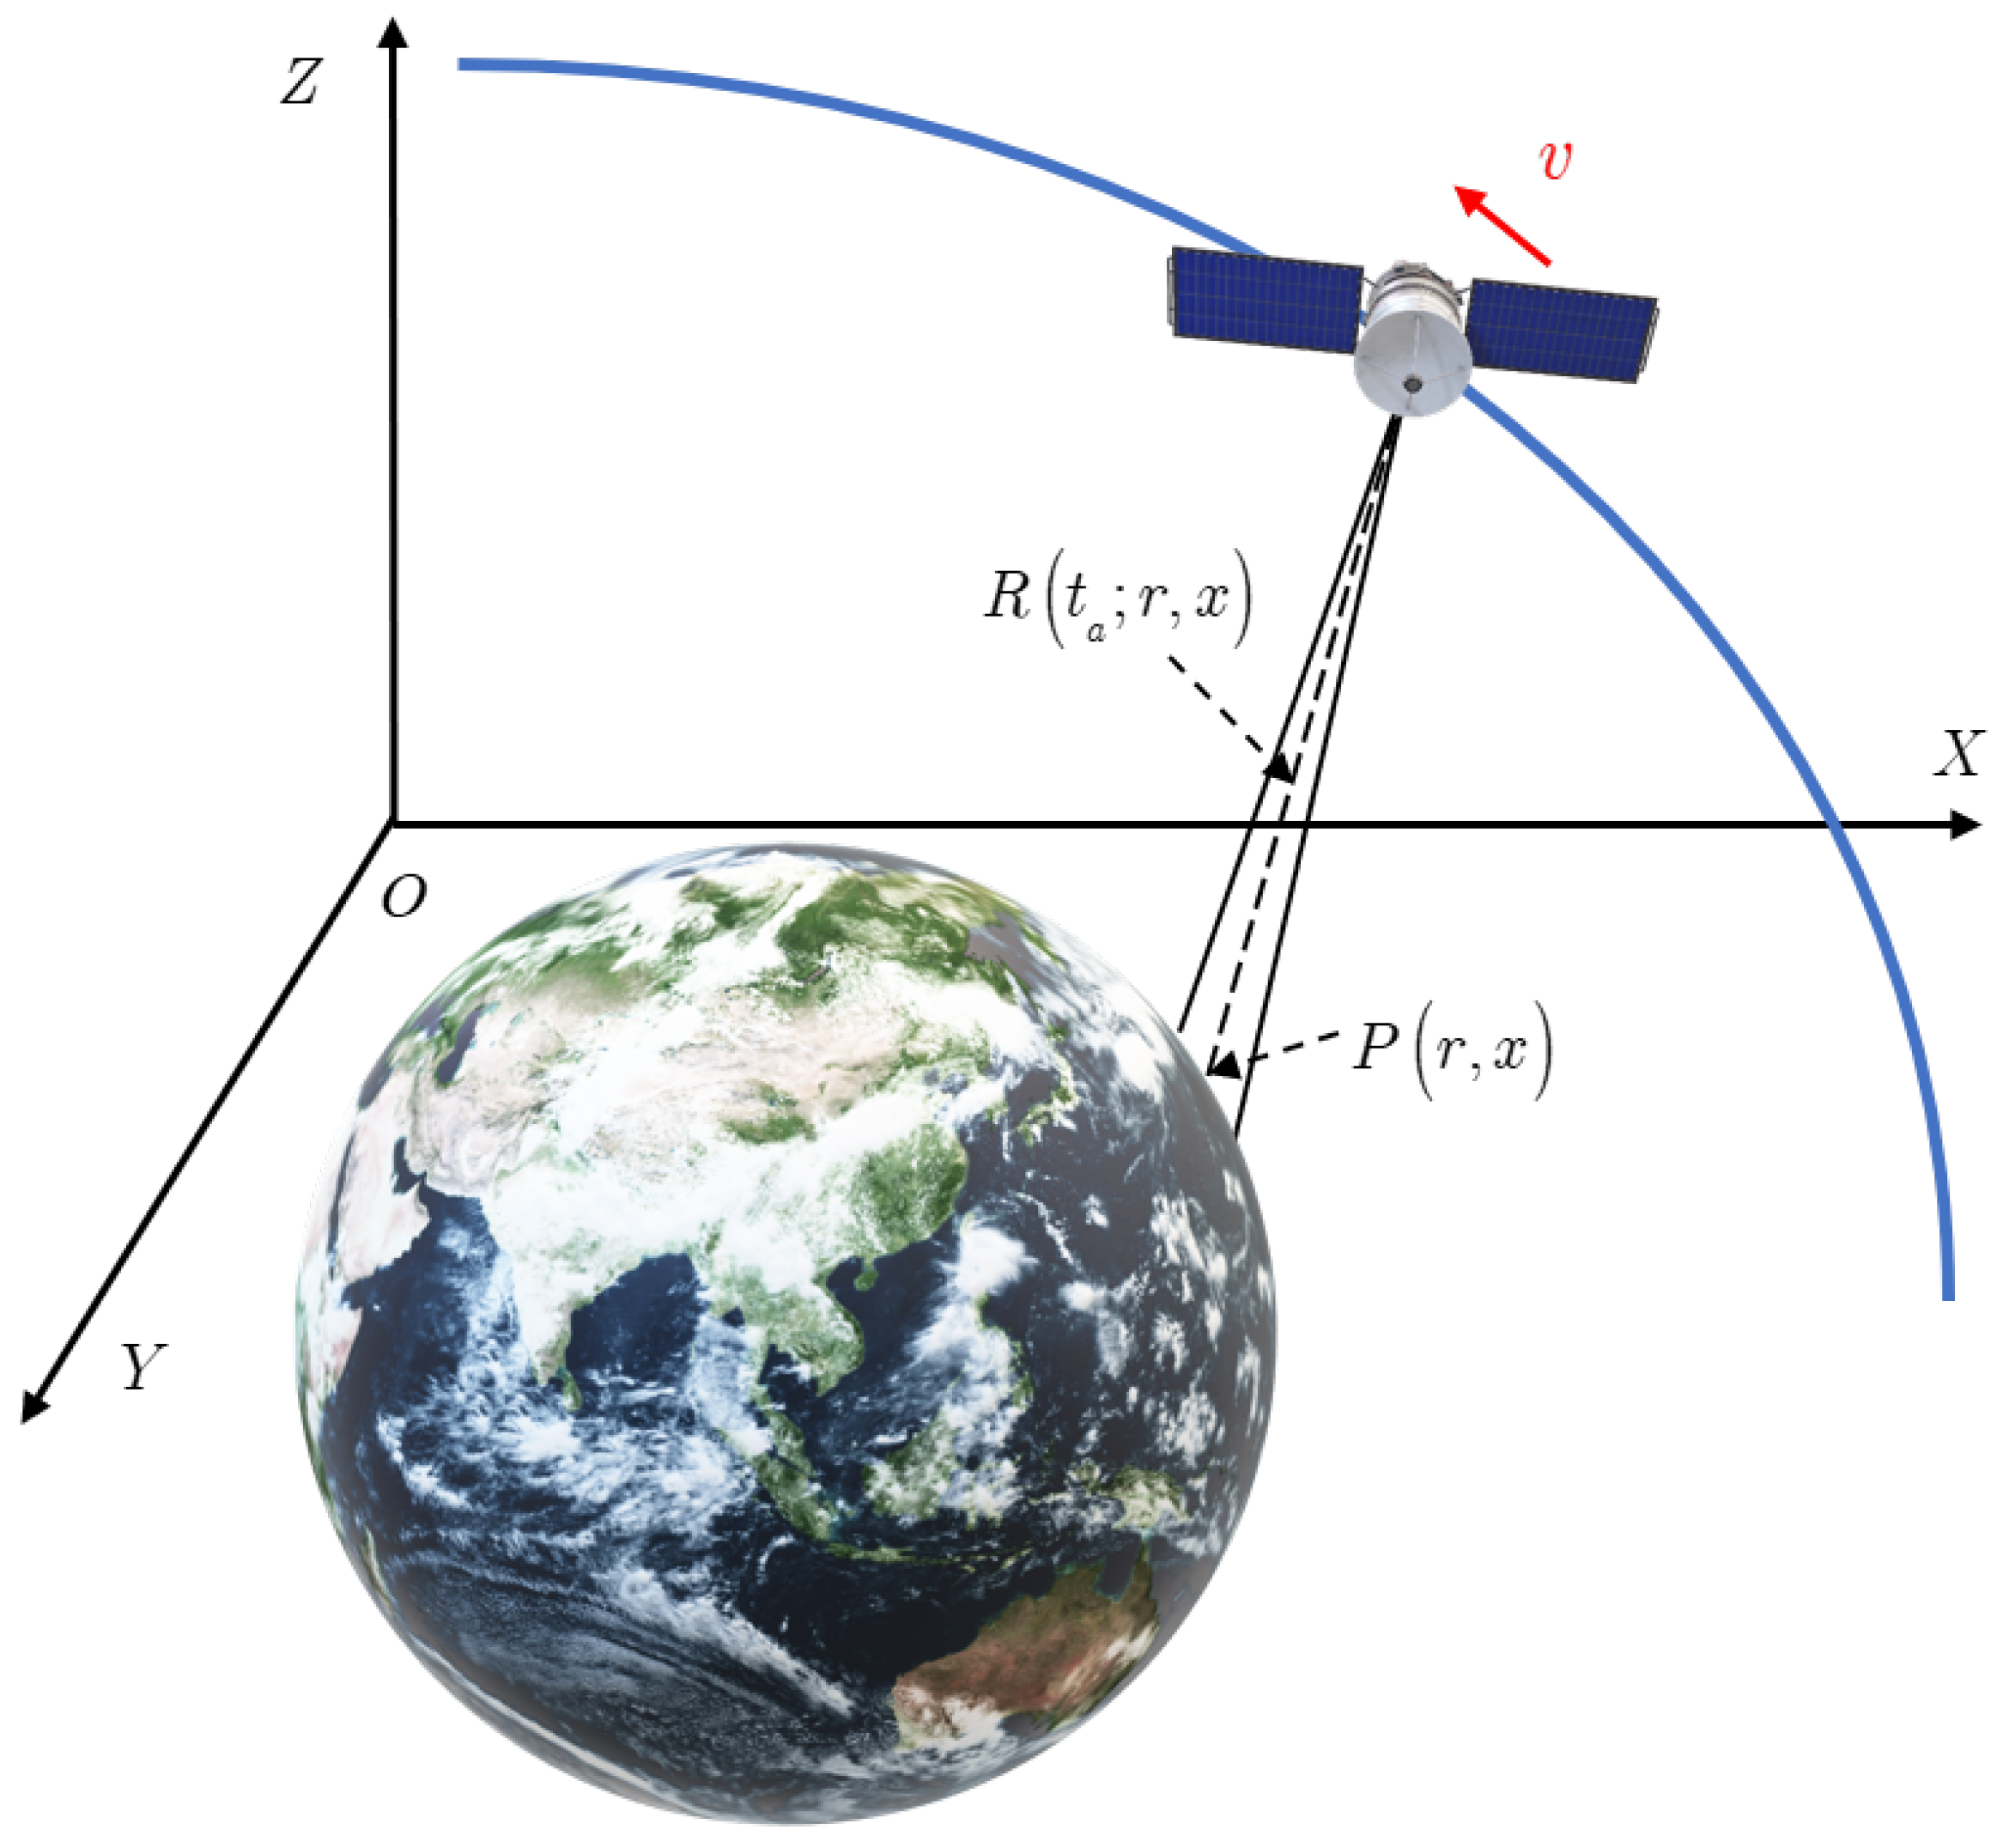
The flowchart of the proposed algorithm is shown in Figure 3. To solve the problem of azimuth spectrum aliasing, a sub-aperture processing strategy is required so that the Doppler bandwidth of the sub-aperture is smaller than the PRF. Firstly, the standard RMA algorithm is used to process each sub-aperture datum and obtain the sub-aperture image. Then, the sub-aperture images are up-sampled, and the spectrum of adjacent sub-aperture images is shifted. Finally, the sub-aperture images after the spectrum shift are synthesized coherently. To maximize the image quality after the coherent synthesis of sub-aperture images, the spectrum shift estimation between adjacent sub-aperture images is modeled as an optimization problem based on the image quality optimization criterion, and the typical line search method is used to solve the optimization problem.

3.1. Signal Model

For spaceborne SAR, the orbit can be approximated as a circular orbit (see Figure 4). In the figure, the blue line is the actual moving trajectory of the radar. R t a , r , x is the instantaneous range between the radar and an arbitrary target P. r , x represents the two-dimensional coordinates of target P.
We assume that the spaceborne HRWS SAR transmits a linear frequency modulation signal. After range compression, the radar echo signal can be expressed as [21,26,27]
s s t r , t a ; r , x = sin c B r t r 2 R t a , r , x c exp j 4 π f c R t a , r , x / c
where t a denotes the azimuth time, B r denotes the transmitted signal bandwidth, t r denotes the range time, c denotes the speed of light, and f c denotes the signal carrier frequency.

3.2. Sub-Aperture Division and Imaging

In the first step, the full-aperture data are divided into several sub-apertures, in which the sub-aperture division is critical to data processing efficiency and, ultimately, image quality. The primary issue to be considered in sub-aperture imaging is the choice of sub-aperture size, and the main principle of division is to ensure that the spectrum bandwidth of the sub-aperture does not exceed the PRF. The calculation formula of sub-aperture time length T s u b is
T s u b P R F B a k r o t
where B a is the instantaneous bandwidth and k r o t is the Doppler tuning frequency for the center of the rotation. The full aperture is divided into N sub-apertures in the azimuth time domain, and each sub-aperture echo signal can be represented as
s s t r , t a ; R , x = sin c B r t r 2 R t s u b , t k c exp j 4 π f c R t s u b , t k / c
where t s u b is the sub-aperture azimuth time and t k denotes the center time of the kth sub-aperture. The signal of the kth sub-aperture can be expressed as [28,29,30]
s s k t r , t s u b   , t k = sin c B r t r 2 r c p a t s u b   + t k t 0
where p a · is the sinc function.

3.3. Coherent Synthesis of Sub-Aperture Images

In order to achieve the accurate coherence synthesis of adjacent sub-aperture images, the focus position and remaining phase of the same target in the two adjacent sub-aperture images needs to be consistent. As can be seen from Equation (13), no phase difference between the adjacent sub-aperture images exists. The time-domain focus position is t 0 t k , which depends on t k . Therefore, the difference in the azimuth focus position is corrected by
H f a , t k = exp j 2 π f a t k
Due to the low PRF, the pixels of each sub-aperture image are much larger than the full-aperture resolution. If all sub-aperture images are directly synthesized coherently, the image resolution cannot be improved. Therefore, all sub-aperture images need to be up-sampled before coherent synthesis. The specific up-sampling factor M should be expressed as
M = V a P R F · ρ a
However, the spectrum discontinuity phenomenon will occur after up-sampling processing, and direct coherent synthesis will cause an obvious grating lobe, resulting in a deterioration in image quality. In order to solve the grating lobe problem, a spectrum shift is required, and the formula of the spectrum shift can be expressed as H 1 α , t a = exp j 2 π α t a , where α denotes the spectrum shift factor. In this paper, the optimal image quality is taken as the criterion and the estimation problem of spectrum shift is modeled as
α ^ = max α   Q s s t r , t a ; α
where s s t r , t a ; α denotes the image after the coherent synthesis of all sub-aperture images. The quality of the synthesized images relies on the spectrum shift factor α . Q is the image quality. In this paper, the peak grating lobe ratio (PGLR) is used to evaluate the focusing quality. The smaller the PGLR, the higher the focusing quality. The PGLR is defined as the ratio of the grating lobe peak to the main lobe peak, which can be expressed as
P G L R = 20 lg P g P m
where P g is the peak of the first grating lobe and P m is the peak of the first main lobe. According to Equation (16), the optimal estimation of the spectrum shift is a one-dimensional optimization problem. Therefore, this problem can be solved by the typical line search methods. The smaller the grating lobe of the synthesized image, the higher the image quality. When there is no grating lobe in the synthesized image, the PGLR of the image is at the minimum, and the algorithm for estimating the spectrum shift can be summarized in Algorithm 1. It should be noted that establishing an analytical model to calculate the spectrum shift may also be a feasible approach, but it is currently difficult to obtain the analytical mapping relationship between the spectrum shift and the grating lobe, making it difficult to establish an analytical model. This is also a problem that we will solve in the future.
Algorithm 1 Algorithm of spectrum shift estimation
  • Input: Sub-aperture images after up-sampling
  • Initialization: The search interval of α is set as α α s , α e . The iteration termination condition is set as ε
  • While  α s α e > ε  do
    • Set α 1 = α e + 0.382 α e α s , and perform spectrum shift in the time domain. Then, all the sub-aperture images are coherently synthesized and the PGLR of the image is calculated.
    • Set α 2 = α e + 0.618 α e α s , and perform spectrum shift in the time domain. Then, all the sub-aperture images are coherently synthesized and the PGLR of the image is calculated.
    • If α 1 α 2 , α s = α 1
    • Else α e = α 2
    • end
  • End while
  • Output: The optimal spectrum shift α ^

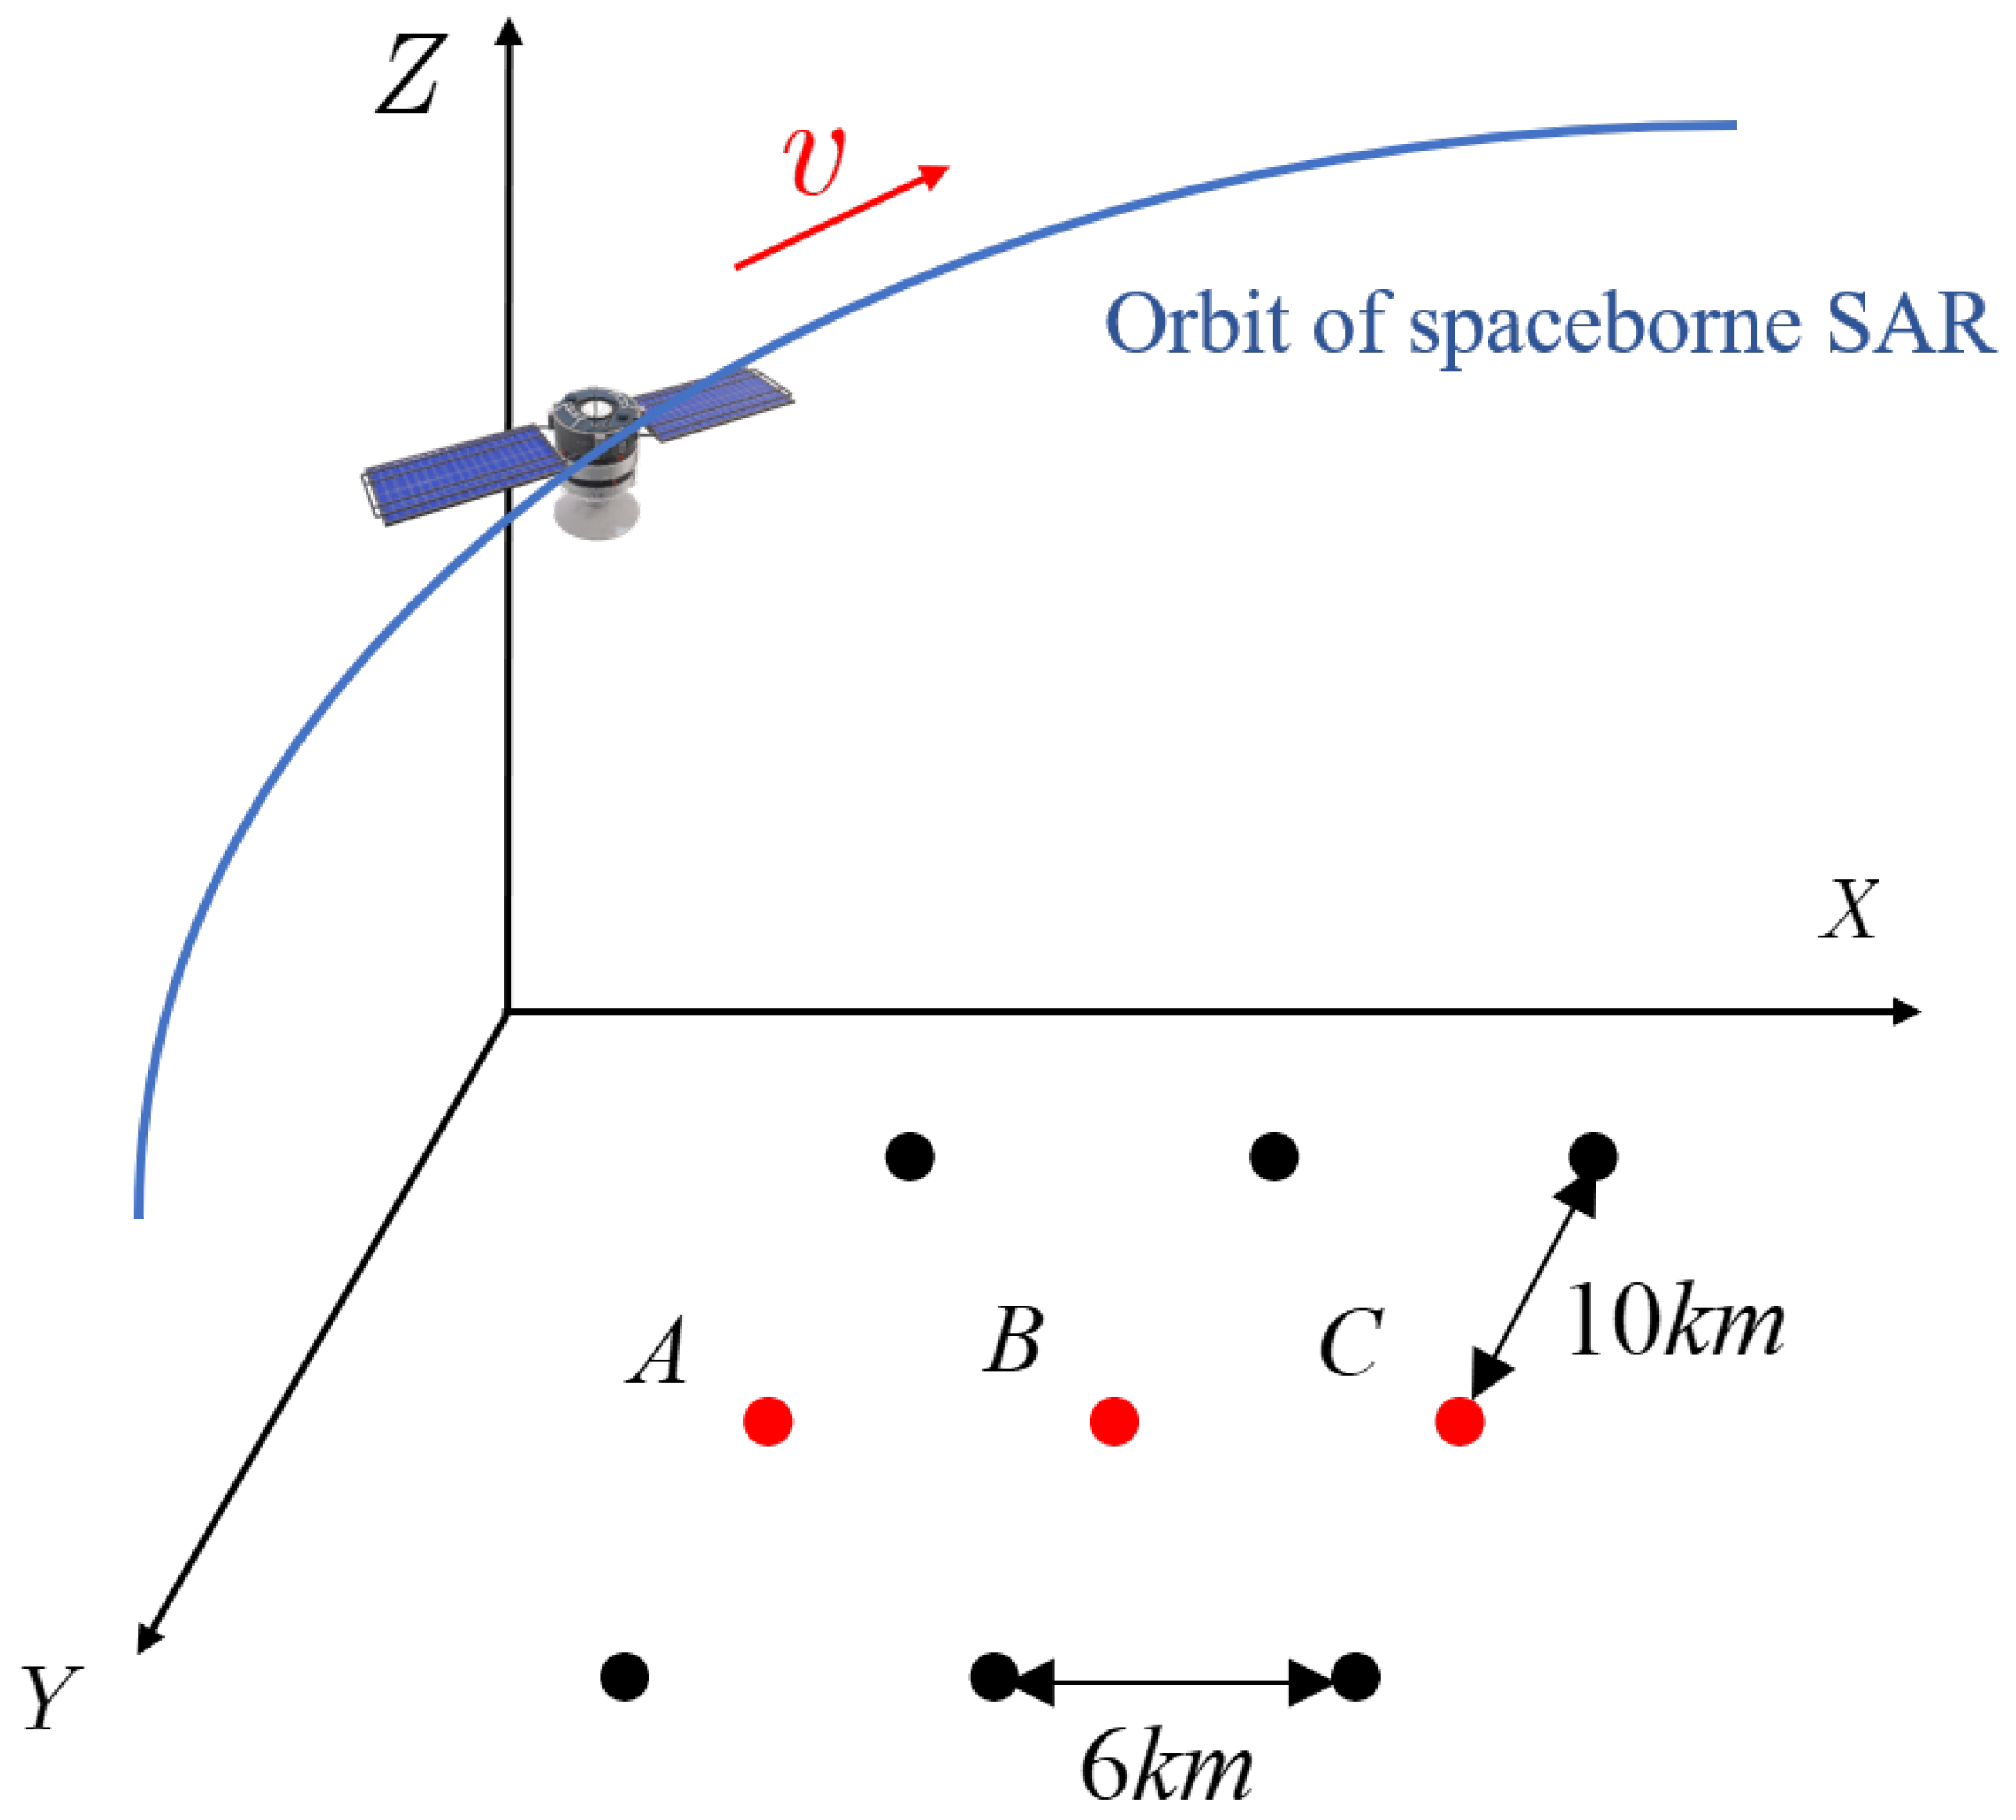
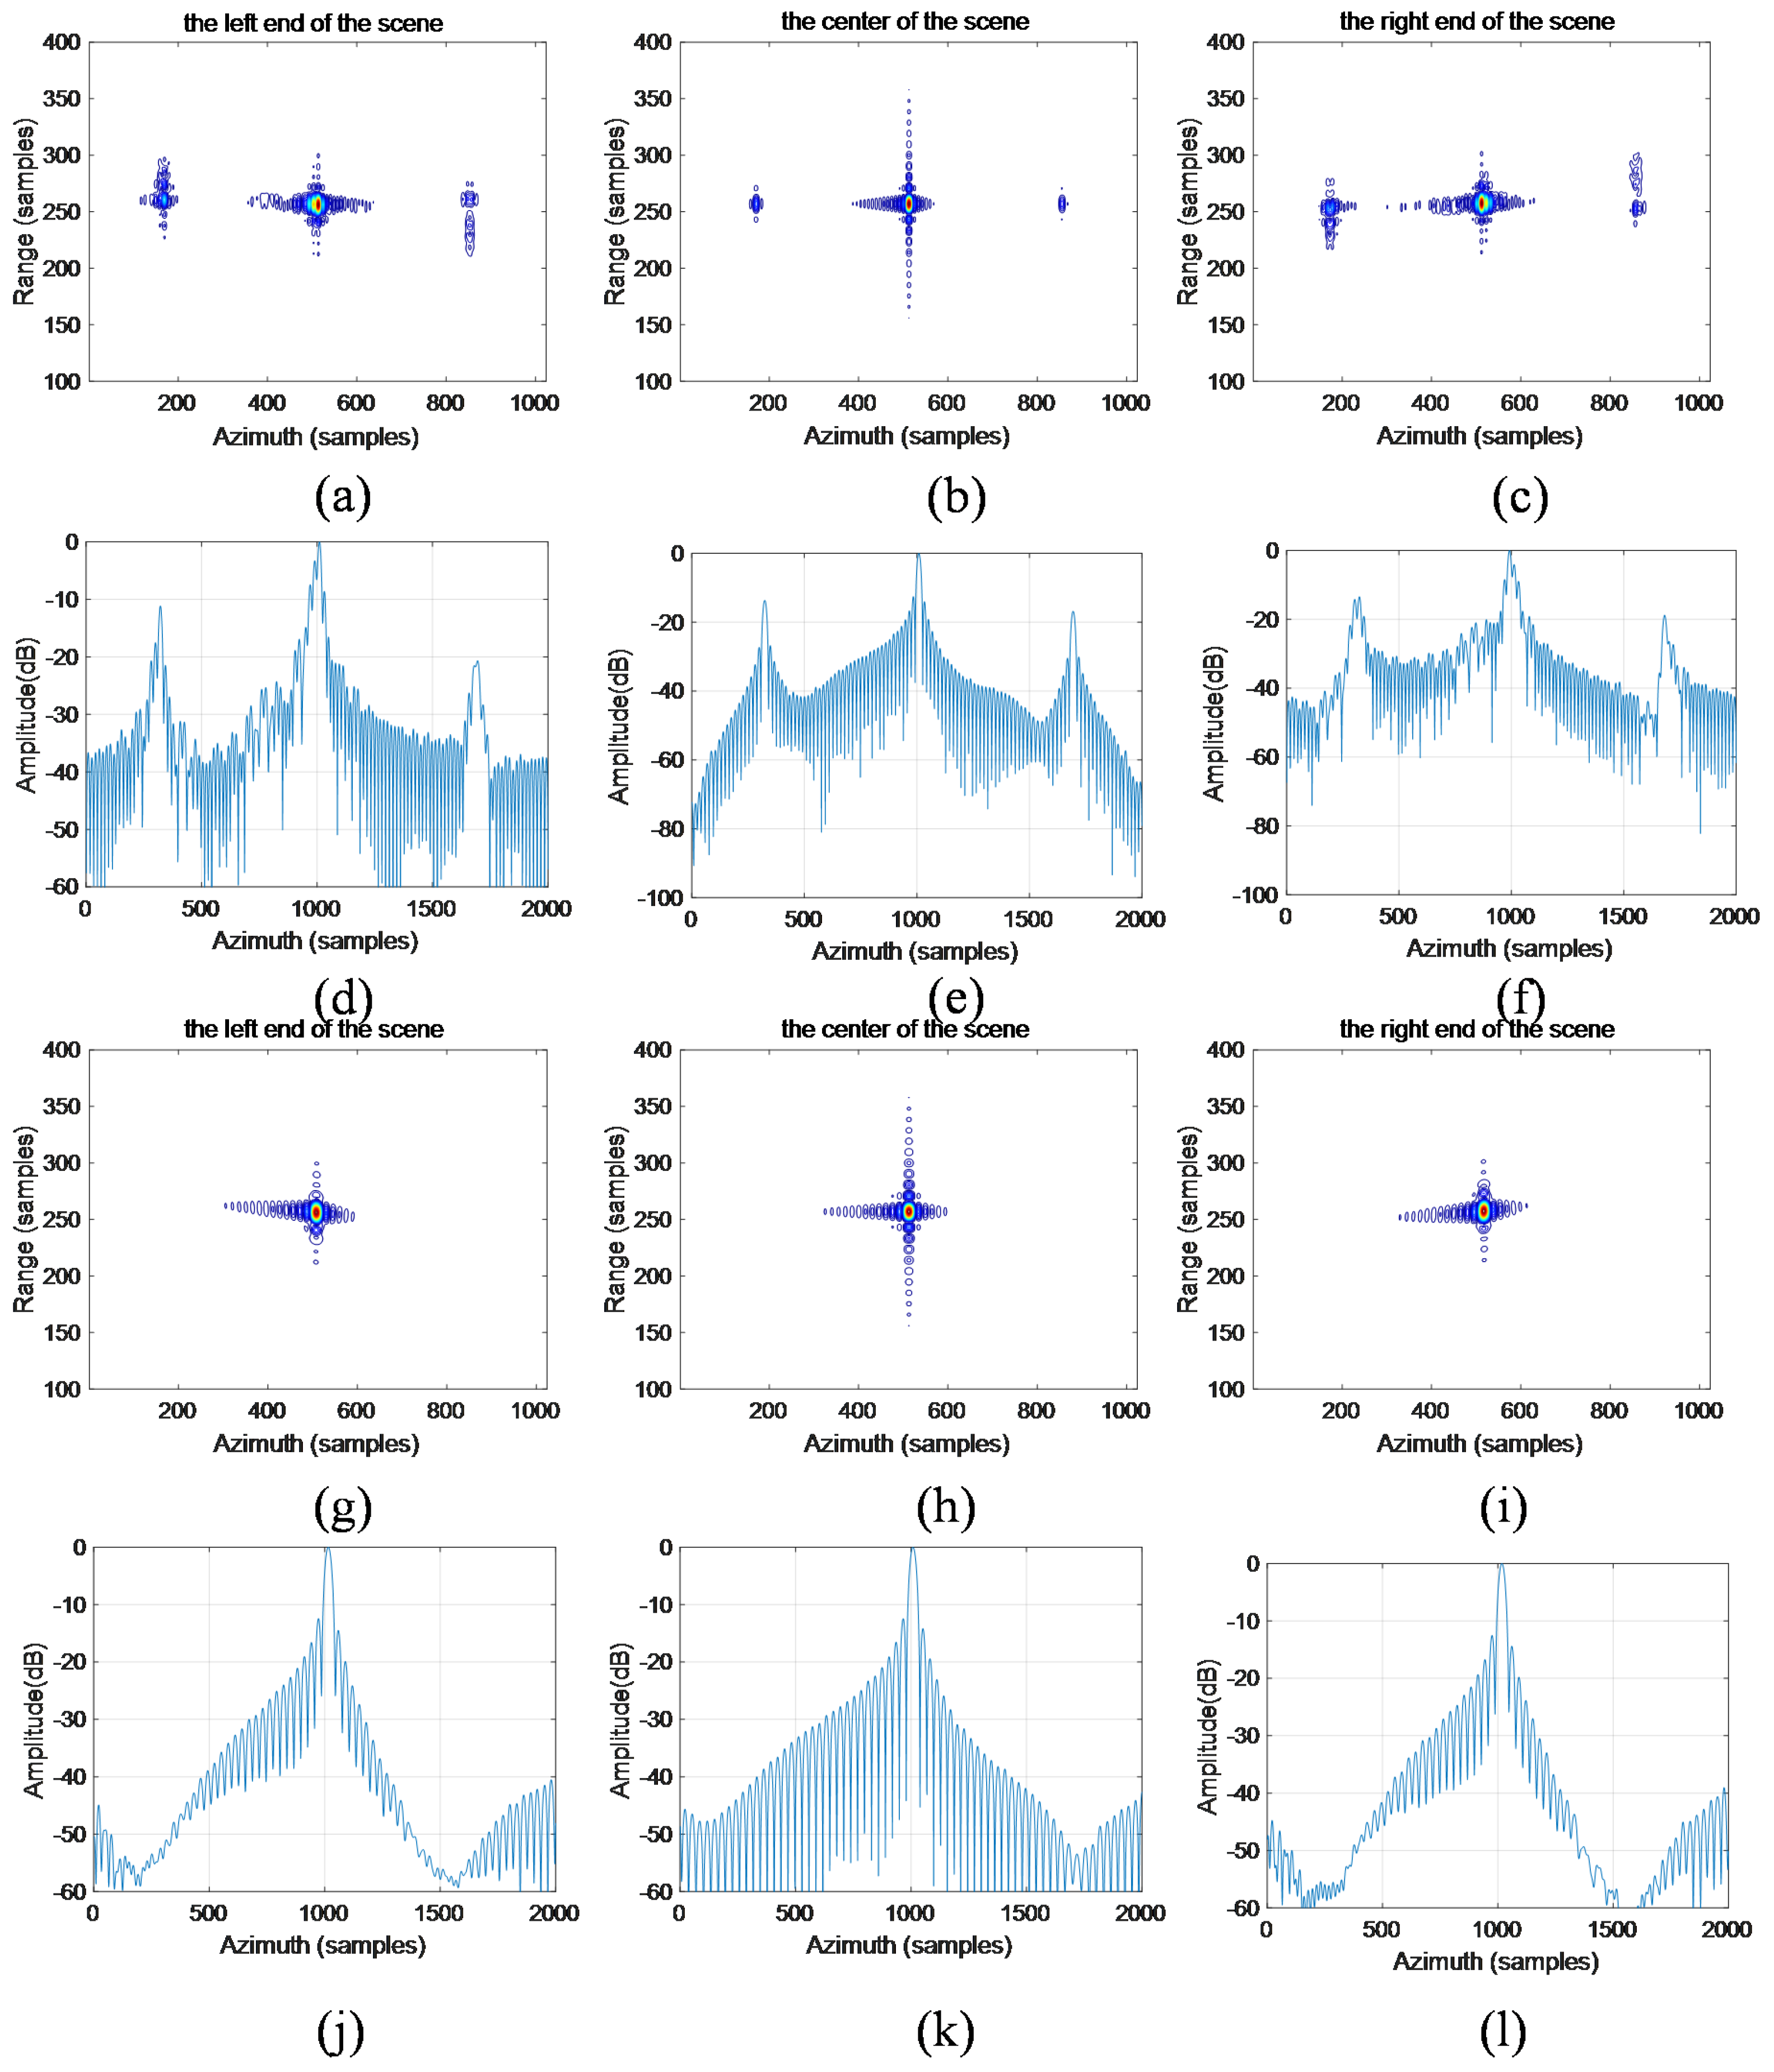
4. Simulated Data Processing Results

In this section, a point target distribution containing nine point targets is shown in Figure 5. The nine point targets have an azimuth interval of 6 km and a range interval of 10 km. Since the sub-aperture segmentation and spectrum shift of the proposed algorithm is performed in the azimuth direction, the imaging results in the azimuth direction are mainly verified. Three targets, A, B, and C, were selected for algorithm verification before and after grating lobe suppression, in which targets A, B, and C are at the left edge, the center, and the right edge of the scene, respectively. The imaging results before and after grating lobe suppression are shown in Figure 6. The first to third columns are the contours and azimuth profiles of target A, target B, and target C, respectively. In Figure 6a–c, denote the contours of the three-point targets without grating lobe suppression; Figure 6g–i are the contours of the three point targets with grating lobe suppression; Figure 6d–f are the azimuth profiles of the three-point targets without grating lobe suppression; and Figure 6j–l are the azimuth profiles of the three-point targets with grating lobe suppression. By comparing the imaging results of the two cases, it can be seen that there is a significant grating lobe phenomenon in the results before the grating lobe suppression, and the grating lobe disappears after the treatment by the algorithm proposed in this paper.
To further analyze the imaging results, we use the peak grating lobe ratio (PGLR) and impulse response width (IRW) as evaluation indicators. Table 2 shows the quantitative azimuth evaluation results of the targets A, B, and C. It can be seen that, before grating lobe suppression, the results of the three targets have an excessively high grating lobe, leading to an increase in the PGLR. After grating lobe suppression, the PGLRs of the three point targets significantly decrease. It should be noted that, due to the spectrum shift in the proposed algorithm, the IRWs of the three-point targets are broadened to some extent.

5. Conclusions

In this paper, a spaceborne HRWS imaging processing algorithm under a low PRF is proposed, which provides a new technical approach to solving the contradiction between the range swath and azimuth resolution in spaceborne SAR. The proposed algorithm can achieve the best imaging effect at the lowest PRF, and the final simulation results also show that the algorithm has a good effect in the suppression of the grating lobe. The image quality of the whole scene target is greatly improved, which verifies the effectiveness of the proposed algorithm.

Author Contributions

X.W. developed the proposed approach and wrote the manuscript. X.W. and Y.R. conducted the experiments and organized the manuscript. X.W., Y.R. and X.Z. commented on the manuscript and made useful suggestions. All authors have read and agreed to the published version of the manuscript.

Funding

This research received no external funding.

Institutional Review Board Statement

Not applicable.

Informed Consent Statement

Not applicable.

Data Availability Statement

Not applicable.

Acknowledgments

The authors thank all the anonymous reviewers for their valuable comments, which helped improve the quality of this article.

Conflicts of Interest

The authors declare no conflict of interest.

References

  1. Inggs, M. Synthetic Aperture Radar During the 50 Years of the Aerospace and Electronic Systems Society. IEEE Aerosp. Electron. Syst. Mag. 2023, 38, 22–31. [Google Scholar] [CrossRef]
  2. Lu, J.; Zhang, L.; Wei, S.; Li, Y. Resolution Enhancement for Forwarding Looking Multi-Channel SAR Imagery With Exploiting Space—Time Sparsity. IEEE Trans. Geosci. Remote Sens. 2023, 61, 5200617. [Google Scholar] [CrossRef]
  3. Zakharov, I.; Henschel, M.D.; Power, D.; Burke, P.; Puestow, T.; Warren, S. Signatures of Small Boats With TerraSAR-X Staring Spotlight Data. IEEE Geosci. Remote Sens. Lett. 2023, 20, 4001005. [Google Scholar] [CrossRef]
  4. K.R., G.P.; Gande, A.K.; Ram, G. A Novel Very Low Power Leakage Factor Window for Image Processing Applications. IEEE Geosci. Remote Sens. Lett. 2023, 20, 4001505. [Google Scholar] [CrossRef]
  5. Luomei, Y.; Xu, F. Segmental Aperture Imaging Algorithm for Multirotor UAV-Borne MiniSAR. IEEE Trans. Geosci. Remote Sens. 2023, 61, 5202318. [Google Scholar] [CrossRef]
  6. Han, S.; Addabbo, P.; Biondi, F.; Clemente, C.; Orlando, D.; Ricci, G. Innovative Solutions Based on the EM-Algorithm for Covariance Structure Detection and Classification in Polarimetric SAR Images. IEEE Trans. Aerosp. Electron. Syst. 2023, 59, 209–227. [Google Scholar] [CrossRef]
  7. Nie, G.; Liao, G.; Zeng, C.; Zhang, X.; Li, D. Joint Radio Frequency Interference and Deceptive Jamming Suppression Method for Single-Channel SAR via Subpulse Coding. IEEE J. Sel. Top. Appl. Earth Obs. Remote Sens. 2023, 16, 787–798. [Google Scholar] [CrossRef]
  8. Zhou, L.; Zhang, X.; Xu, Y. An Efficient HRWS Sar Reconstruction Method Based on Frequency Domain Back Projection. In Proceedings of the IGARSS 2022-2022 IEEE International Geoscience and Remote Sensing Symposium, Kuala Lumpur, Malaysia, 17–22 July 2022; pp. 767–770. [Google Scholar] [CrossRef]
  9. Zhang, Z.; Yu, W.; Zheng, M.; Zhou, Z.X. Doppler Centroid Estimation for Ground Moving Target in Multichannel HRWS SAR System. IEEE Geosci. Remote Sens. Lett. 2022, 19, 4012105. [Google Scholar] [CrossRef]
  10. Zhang, S.X.; Li, S.; Liu, Y.; Xing, M.D.; Chen, J. A Novel Azimuth Doppler Signal Reconstruction Approach for the GEO-LEO Bi-Static Multi-Channel HRWS SAR System. IEEE Access 2019, 7, 39539–39546. [Google Scholar] [CrossRef]
  11. Ji, P.; Xing, S.; Dai, D.; Pang, B.; Feng, D. The Imaging Characteristics of Doppler-Modulation Jamming Against HRWS-SIMO-SAR. IEEE Geosci. Remote Sens. Lett. 2022, 19, 4029005. [Google Scholar] [CrossRef]
  12. Jianlai CHEN, H.Y. Wide-beam SAR autofocus based on blind resampling. Sci. China Inf. Sci. 2023, 66, 140304. [Google Scholar]
  13. Bartusch, M.; Quiroz, A.E.N.; Stettner, S.; Moreira, A.; Zink, M. German X-Band Spaceborne SAR Heritage and the Future HRWS Mission. In Proceedings of the 2021 IEEE International Geoscience and Remote Sensing Symposium IGARSS, Brussels, Belgium, 11–16 July 2021; pp. 804–807. [Google Scholar] [CrossRef]
  14. Guo, X.; Gao, Y.; Liu, X. Moving target detection in HRWS mode. In Proceedings of the 2017 IEEE International Geoscience and Remote Sensing Symposium (IGARSS), Fort Worth, TX, USA, 23–28 July 2017; pp. 1169–1172. [Google Scholar] [CrossRef]
  15. Liu, Y.; Li, Z.; Wang, Z.; Bao, Z. On the Baseband Doppler Centroid Estimation for Multichannel HRWS SAR Imaging. IEEE Geosci. Remote Sens. Lett. 2014, 11, 2050–2054. [Google Scholar] [CrossRef]
  16. Baumgartner, S.V.; Schaefer, C.; Krieger, G. Simultaneous Low PRF GMTI and HRWS SAR Imaging without Changing the System Operation Mode. In Proceedings of the EUSAR 2014; 10th European Conference on Synthetic Aperture Radar, Berlin, Germany, 3–5 June 2014; pp. 1–4. [Google Scholar]
  17. Zhang, L.; Gao, Y.; Wang, K.; Liu, X. A blind reconstruction of azimuth signal for multichannel HRWS SAR system. In Proceedings of the 2017 IEEE Radar Conference (RadarConf), Seattle, WA, USA, 8–12 May 2017; pp. 1020–1023. [Google Scholar] [CrossRef]
  18. Guo, X.; Gao, Y.; Wang, K.; Liu, X. Unambiguous SAR imaging algorithm via spotlight mode for multichannel SAR systems. In Proceedings of the 2016 IEEE Radar Conference (RadarConf), Philadelphia, PA, USA, 2–6 May 2016; pp. 1–4. [Google Scholar] [CrossRef]
  19. Xu, W.; Deng, Y. Multichannel SAR With Reflector Antenna for High-Resolution Wide-Swath Imaging. IEEE Antennas Wirel. Propag. Lett. 2010, 9, 1123–1126. [Google Scholar] [CrossRef]
  20. Liu, Y.; Liu, C.; Liu, S.; Huang, Y. Design and Control of a Novel Wireless Energy Router With Independent Power Transmission Channels. IEEE Trans. Power Electron. 2023, 38, 2940–2955. [Google Scholar] [CrossRef]
  21. Lanari, R.; Tesauro, M.; Sansosti, E.; Fornaro, G. Spotlight SAR data focusing based on a two-step processing approach. IEEE Trans. Geosci. Remote Sens. 2001, 39, 1993–2004. [Google Scholar] [CrossRef]
  22. Prats, P.; Scheiber, R.; Mittermayer, J.; Meta, A.; Moreira, A. Processing of Sliding Spotlight and TOPS SAR Data Using Baseband Azimuth Scaling. IEEE Trans. Geosci. Remote Sens. 2010, 48, 770–780. [Google Scholar] [CrossRef] [Green Version]
  23. Men, Z.R.; Wang, P.B.; Li, C.S.; Cui, Z.M.; Wen, X.Z.; Li, S. A refined geometric correction algorithm for spotlight and sliding spotlight spaceborne SAR. In Proceedings of the 2013 IEEE International Geoscience and Remote Sensing Symposium—IGARSS, Melbourne, VIC, Australia, 21–26 July 2013; pp. 1302–1304. [Google Scholar] [CrossRef]
  24. Han, S.; Zhu, D.; Mao, X. A Novel Imaging Algorithm for Spotlight SAR Based on Scaling Transform. IEEE Geosci. Remote Sens. Lett. 2022, 19, 4508905. [Google Scholar] [CrossRef]
  25. Ge, B.; Chen, L.; An, D.; Zhou, Z. GPU-based FFBP algorithm for high-resolution spotlight SAR imaging. In Proceedings of the 2017 IEEE International Conference on Signal Processing, Communications and Computing (ICSPCC), Xiamen, China, 22–25 October 2017; pp. 1–5. [Google Scholar] [CrossRef]
  26. Zanin, K.A.; Moskatinev, I.V. Improvement of Methods for Evaluating the Resolving Power of a Space Synthetic Aperture Radar. Sol. Syst. Res. 2018, 52, 666–672. [Google Scholar] [CrossRef]
  27. Chien, W.; Dilworth, D.; Liu, E.; Leith, E. Synthetic-aperture chirp confocal imaging. Appl. Opt. 2006, 45, 501–510. [Google Scholar] [CrossRef]
  28. Chen, J.; Zhang, J.; Jin, Y.; Yu, H.; Liang, B.; Yang, D.G. Real-Time Processing of Spaceborne SAR Data With Nonlinear Trajectory Based on Variable PRF. IEEE Trans. Geosci. Remote Sens. 2022, 60, 5205212. [Google Scholar] [CrossRef]
  29. Zanin, K.A. Quality analysis of image geolocation for a space synthetic aperture radar. Sol. Syst. Res. 2014, 48, 555–560. [Google Scholar] [CrossRef]
  30. Doody, S.G.; Hughes, N.; Ramio-Tomas, L.; Mak, E.; Muff, D.G.; Nottingham, M.R. Low-frequency synthetic aperture radar data-dome collection with the Bright Sapphire II instrument. Electron. Lett. 2017, 53, 981–983. [Google Scholar] [CrossRef]
Figure 1. Parameter design flowchart.
Remotesensing 15 03811 g001
Figure 2. Geometry of the sliding spotlight SAR.
Remotesensing 15 03811 g002
Figure 3. Flowchart of the proposed algorithm.
Remotesensing 15 03811 g003
Figure 4. Geometric configuration of spaceborne HRWS SAR.
Remotesensing 15 03811 g004
Figure 5. Target distributions for simulation.
Remotesensing 15 03811 g005
Figure 6. Comparative imaging results before and after grating lobe suppression: (af) are the results before grating lobe suppression, and (gl) are the results after grating lobe suppression.
Remotesensing 15 03811 g006
Table 1. Imaging indicators and parameter design results.
Image IndicatorsValuesEstablished ParametersValuesDesigned ParametersValues
W r 20 kmH400 km R r o t 982 km
W a 12 km f c 35 GHz v g 979 m/s
ρ a 0.3 m T p 0.2 μ s P R F 3000 Hz
ρ r 0.3 m D a 4.5 m B r 1.1 GHz
T s 11s
Table 2. Quantitative evaluation of the azimuth imaging quality before and after grating lobe suppression.
TargetsScenarioPGLR (dB)IRW (m)
ABefore suppression−11.050.30
After suppression−52.950.42
BBefore suppression−13.680.31
After suppression−43.570.44
CBefore suppression−13.850.30
After suppression−52.040.42
Disclaimer/Publisher’s Note: The statements, opinions and data contained in all publications are solely those of the individual author(s) and contributor(s) and not of MDPI and/or the editor(s). MDPI and/or the editor(s) disclaim responsibility for any injury to people or property resulting from any ideas, methods, instructions or products referred to in the content.

