Communication

Comparison of Spring Wind Gusts in the Eastern Part of the Tibetan Plateau and along the Coast: The Role of Turbulence

1
College of Meteorology and Oceanography, National University of Defense Technology, Changsha 410073, China
2
High Impact Weather Key Laboratory of CMA, Changsha 410073, China
3
Unit No. 92192 of Chinese People’s Liberation Army, Ningbo 315000, China
*
Author to whom correspondence should be addressed.
Remote Sens. 2023, 15(14), 3655; https://doi.org/10.3390/rs15143655
Submission received: 8 June 2023 / Revised: 8 July 2023 / Accepted: 20 July 2023 / Published: 21 July 2023

Abstract

:
Wind gusts are sudden, brief increases in wind speed that have important implications for wind power generation, building design, aviation and marine safety. However, wind gusts in the Plateau and coastal plain are very different. In this paper, the gust characteristics are explored and compared at two sites in the same latitude—Xining, a city in the eastern Tibetan Plateau, and Qingdao, a city in the coast in China—using Doppler lidar data. The results indicate that the wind gusts in Xining are more intense and occur at a higher height than those in Qingdao. Though mean winds and turbulence significantly influence gusts, the turbulence intensity is responsible for the differences in gust, and high turbulence in the eastern part of the Tibetan Plateau is inferred. These results provide observational evidence for wind gusts over the complex terrain of the Tibetan Plateau and are useful for studying their impact on important aspects, such as flight safety.

1. Introduction

Wind gusts are sudden, brief increases in wind speed that play a critical role in wind power generation, building design, aviation, and marine safety [1,2]. Wind gusts and extreme winds can cause extensive damage to coastal areas and urban communities, and this damage is even more powerful on the Tibetan Plateau [3].
Wind gusts are closely related to atmospheric variables such as mean wind speed, boundary layer turbulence, bottom surface and atmospheric stability, as many studies have found in recent years with the increasing number of ground-based observations [4,5,6]. Many studies [7,8] have indicated that turbulence is one of the most important factors affecting gust formation. For example, Hu et al. [5] showed that near-surface wind gusts are closely related to mean wind speed and turbulence intensity. Luchetti et al. [9] further assessed the changes in meteorological elements during gust passage and found that vertical airflow and turbulence kinetic energy were enhanced in most cases. He et al. [10] used meteorological tower data to analyze the structure of wind and turbulence and showed a tendency for turbulence to intensify prior to the passage of wind gusts. These results highlight the important role of turbulence in the development of wind gusts.
Turbulence may arise from complex topography and may contribute to the strong local characteristics of the wind gusts [11,12,13]. Harper et al. [14] reported that the various bottom surface properties of the ocean and land lead to distinct turbulence and wind gusts under diverse substrates (e.g., inland, off-land, off-sea and offshore), indicating that wind gusts have significant sea–land differences. Similarly, Wang et al. [13] classified the Bohai Sea and its coastal areas into four regions based on topography and analyzed every region’s peak gust climatology through observations. They found that a rough bottom surface stimulated stronger turbulence and increased the peak gust and gust factor. Moreover, wind speed can be affected by the unevenness of the terrain, which creates complex flow patterns [15]. For example, wind can be channeled or accelerated by topographic features such as hills or valleys [16,17,18]. Complex terrain also leads to more frequent and stronger wind gusts [6,19,20]. Wind gusts are amplified by the effects of topography on the formation and structure of large-scale weather systems and mountain waves [21,22]. However, the lack of adequate observational data in complex terrain limits the understanding and prediction of wind gusts, and more research is needed to explore the features and causes of wind gusts in different environments [23,24,25,26].
The Qinghai–Tibet Plateau, the highest plateau on Earth, has complex topography and is one of the key drivers of regional atmospheric circulation and climate [27]. Thus far, the characterization of wind gusts on the Tibetan Plateau remains inadequate, leading to difficulties in forecasting blowing snow and low-visibility events [28,29,30,31]. The Tibetan Plateau has complex topography that may cause turbulence and wind gusts with strong local features. However, it is unknow how these wind gusts differ from those in a typical coastal plain because of the lack of wind data in the Tibetan Plateau [3]. To date, the estimation of local wind gusts in weather and climate prediction algorithms remains challenging due to the lack of understanding of the spatial and temporal characteristics of wind gusts in plateau areas with complex terrain [25]. An analysis of the characteristics of wind gusts influenced by the complex terrain in the Plateau based on measured data could help to improve the forecasting of wind gusts, assessment of potential hazards and aircraft safety.
Long-term wind gust observations in plateau areas with complex terrain are challenging to conduct. In addition, meteorological towers are costly and limited in height, while conventional radiosondes cannot provide continuous wind data. Doppler lidar can overcome the limitations of weather towers and radiosondes with its large vertical detection range and high temporal resolution. That makes it more suitable for observing complex turbulence and wind gusts [32,33]. Indeed, Doppler lidar has been used to estimate wind gusts and turbulence in many pioneering works [16,34], demonstrating its potential ability to support gust and turbulence studies in complex environments.
This study analyzed wind gusts using data from the same type of Doppler lidar in Xining, on the eastern part of the Tibetan Plateau, and Qingdao, a coastal city at a similar latitude. The aim was to compare the wind gust characteristics of these two typical locations and to explore the influence of complex topography on wind gusts. We also discuss how turbulence affects the development of wind gusts over the eastern part of the Tibetan Plateau.

2. Materials and Methods

2.1. Scope

This paper chose two sites with similar latitudes and surface wind speed (Figure 1d) but very different topography to avoid the influence of latitude. Xining (at approximately 102.0°E, 36.5°N, 2594 m above mean sea level; Figure 1b) is located in the eastern part of the Tibetan Plateau and is surrounded by two mountains about 4000 m in height. In contrast, Qingdao (at approximately 120.4°E, 36.1°N, 11 m above mean sea level; Figure 1c) is near the northern coast of the Yellow Sea with no tall steep peaks nearby. Moreover, the high concentration of human activities and transportation in Xining and Qingdao makes the wind gusts in these two sites influential and noteworthy.
The study used a dataset derived from Doppler lidar observations at both sites between 24 March and 10 June 2022, the period examined by our experiment. During this period, although the western Pacific subtropical high was located between 15 and 30°N and the rainband covered South Central China, they did not directly influence the weather in Qingdao. Moreover, neither typhoons nor strong fronts directly affected Qingdao during the study period; only local convection occurred occasionally. In April, the Xining site experienced several cold air activities and strong convection due to the high pressure from the eastern part of Lake Baikal. However, these factors did not significantly affect the statistical results. Most of the time, the winds at these two sites were free from strong weather system disturbances, which facilitated the study of wind gusts and turbulence in the lower troposphere.

2.2. Doppler Lidar Data Quality Control

Doppler lidar can detect low-level tropospheric winds continuously, unlike conventional weather towers and radio sounders. Therefore, it is increasingly used in aviation weather services and local weather studies [35,36,37]. To compare the data from the two sites and ensure their consistency, we used the same model of Doppler lidar (FC-II) in the experiment. The device uses a 1.55 µm wavelength Doppler beam swing (DBS) technique. The lidar measures the wind with four beams that are oriented at an elevation angle of 70°. By varying the zenith angle of each beam at four different azimuths, the lidar scans the radial wind field and estimates the horizontal and vertical components of the wind speed and direction at various heights. The device has a 50 m vertical resolution and a 5 s temporal resolution, with a wind speed detection error of less than 0.5 m·s−1.
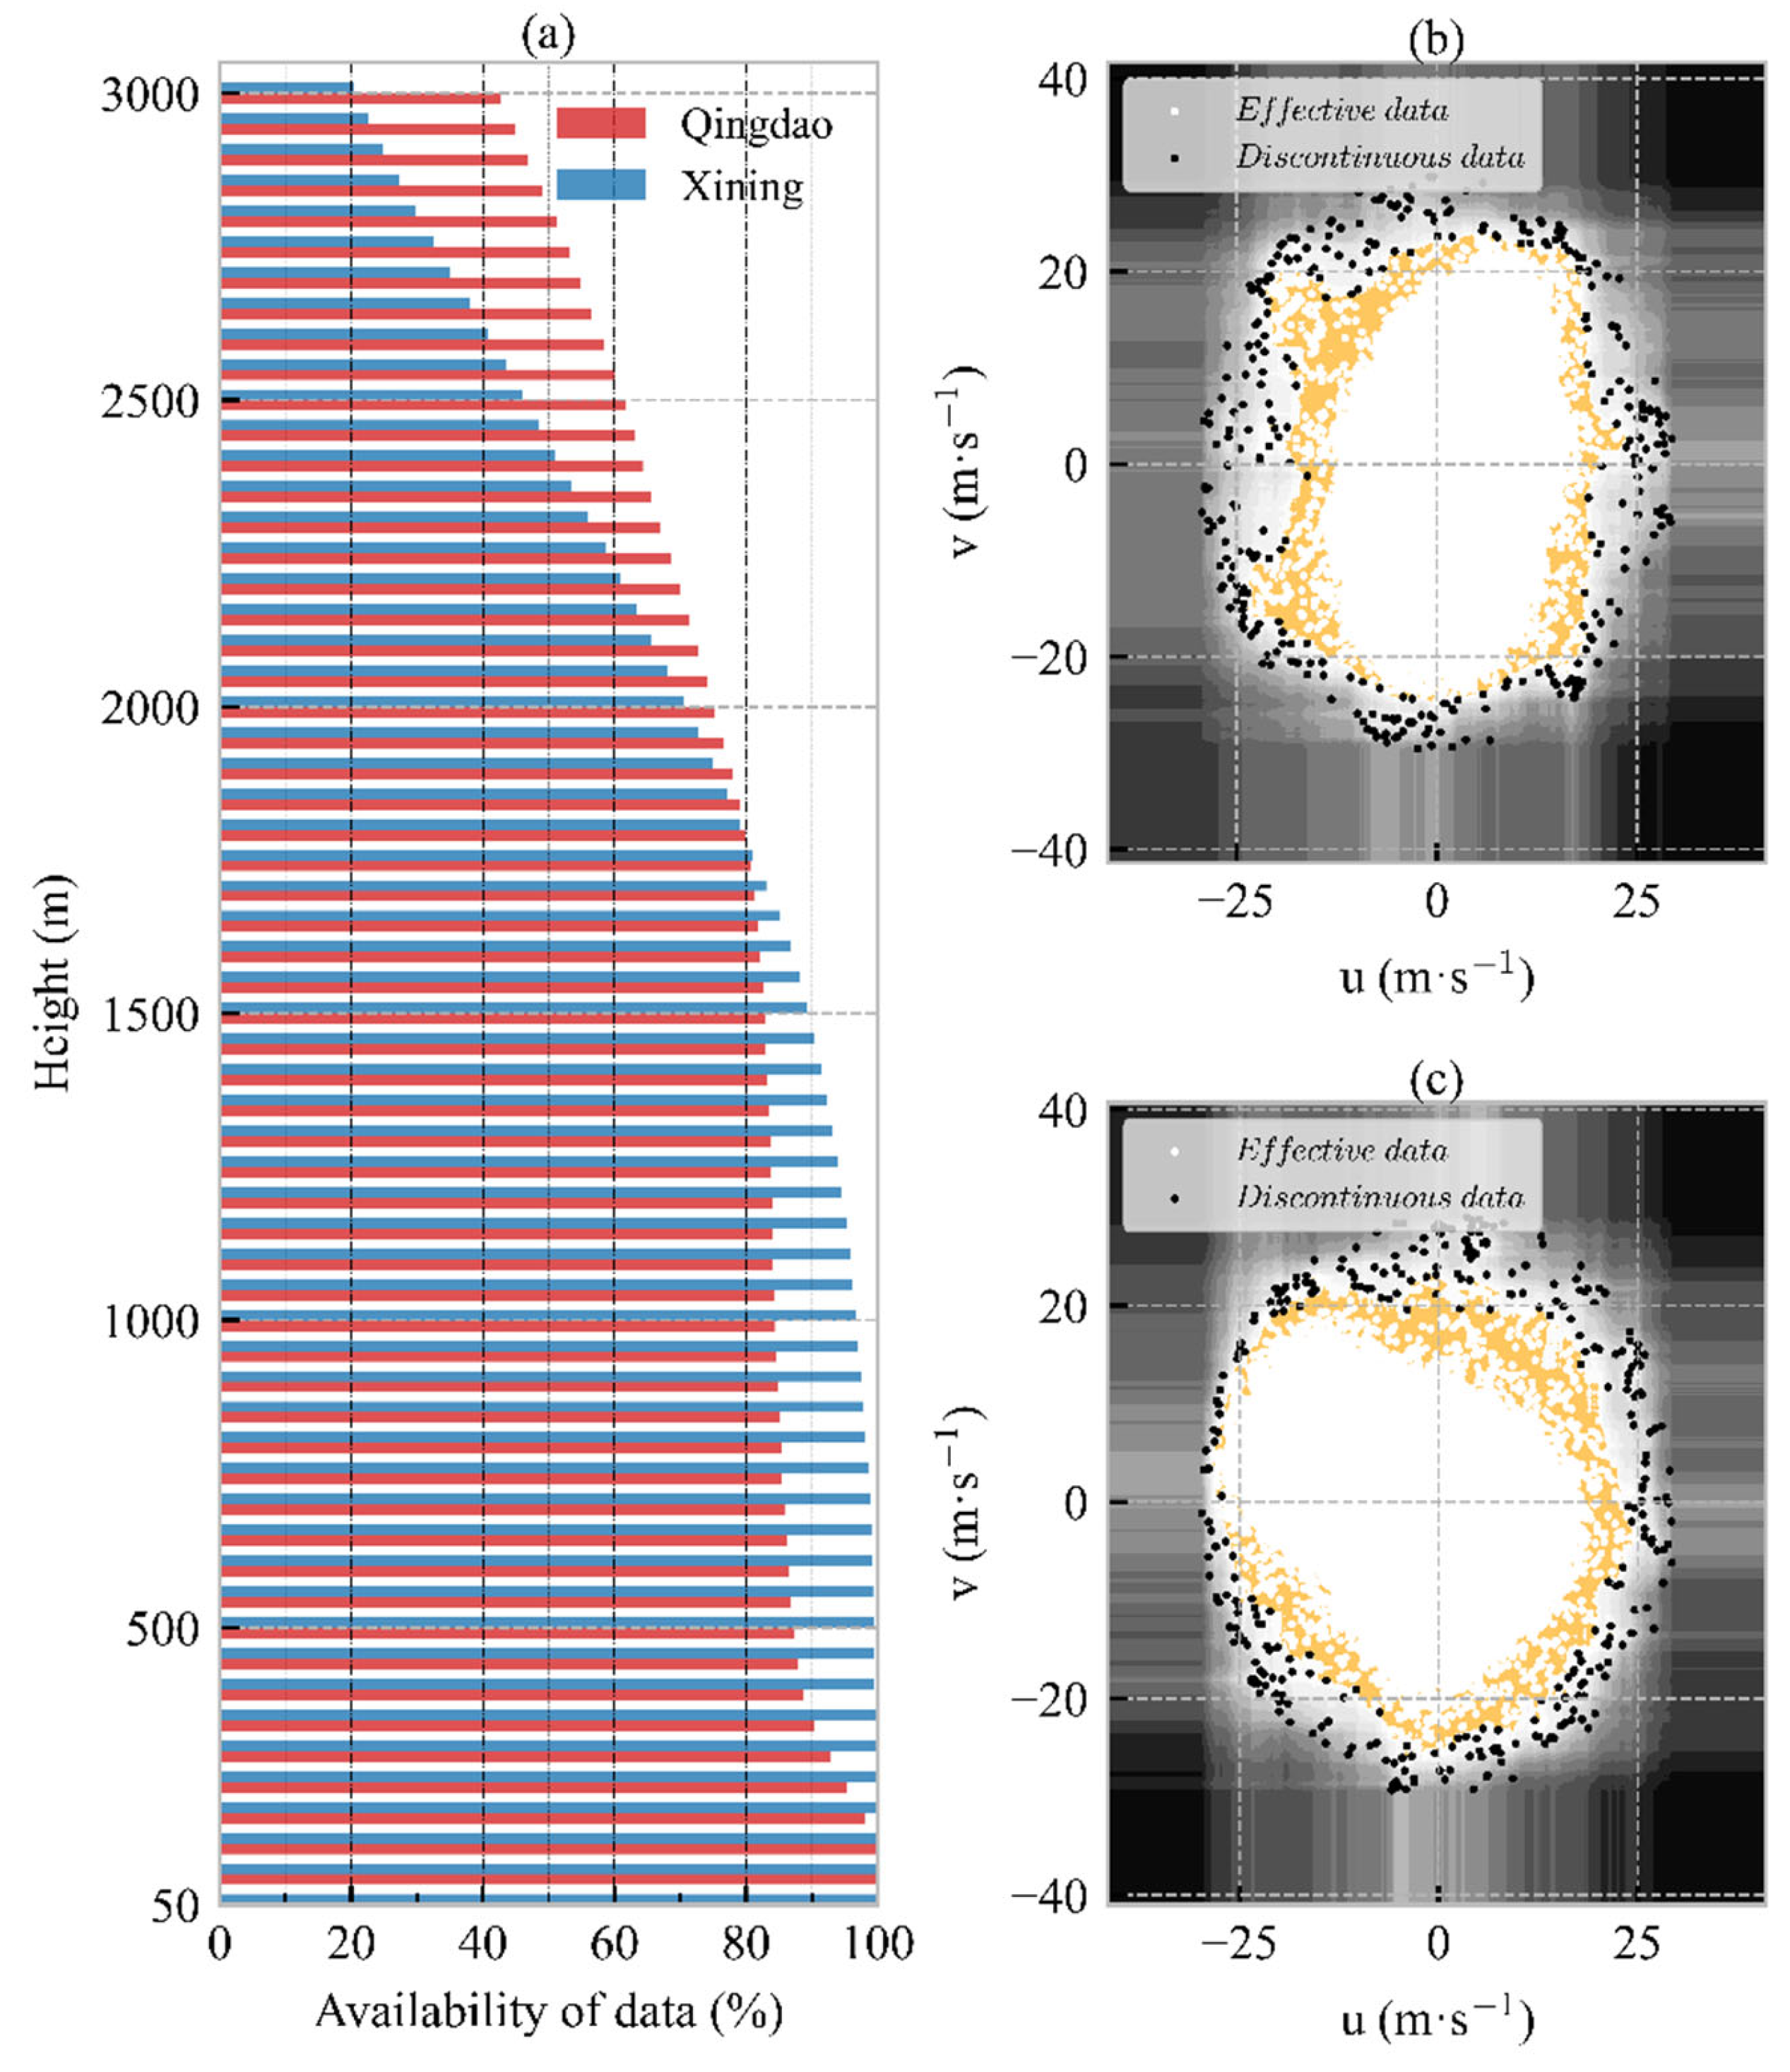
The efficacy and quantity of obtainable data for lidar are influenced by the rapid attenuation of aerosol particles, which are the indicators for lidar, with increasing height [38,39]. As depicted in Figure 2a, the data availability diminishes considerably with increasing height, but it is satisfactory below 2000 m. Erroneous data from Doppler lidar can contaminate gust studies and need to be eliminated. We applied an unsupervised machine learning technique based on the isolated forest algorithm to ensure the quality of the raw data.
The isolated forest algorithm works by splitting the data space with a random hyperplane into two subspaces and repeating this step until each subspace has only one data node. Each leaf node contains a single data node, forming an isolated tree [40].
We split the wind data into longitudinal and latitudinal components and normalized their sum. The outlier points had sparse data density and remained in a subspace after the hyperspace was repeatedly divided by a multidimensional plane. We set the threshold to the path length from the longest leaf node to the root node in the first 0.15% of each height layer and considered any data longer than this length as singular. The wind data at a certain height should be continuous with high resolution. The isolated forest algorithm tends to eliminate isolated points in the multidimensional space that have poor continuity. The black points in Figure 2b,c represent some of the data that were eliminated. This method eliminates data that may be affected by other noise disturbances while preserving gust turbulence disturbances. A possible limitation of our method is that removing isolated points of poor continuity may also filter out strong turbulence signals. However, as a previous experiment [41] has discussed, this does not significantly affect the results.
We note that the conventional carrier-to-noise ratio (CNR) thresholding method can also produce reliable results after adjusting the thresholds [42,43]. However, the CNR of lidar can vary considerably under different seasonal, weather, or terrain conditions, and different thresholds are needed for data from both sites. Machine learning methods for quality control based on data continuity have better portability and can offer a convenient basis for experiments under different environmental conditions.

2.3. Parameters and Definitions

Wind gusts can be measured using several parameters, and different sampling intervals can have an impact on the gust factor values [44]. While the WMO recommendations do not specify a strict limit, most studies on near-surface wind gusts adopted 10 min and 5 s sampling intervals to measure mean and instantaneous winds.
The mean wind speed ( V T ) is the average of all 5 s wind speeds in the same interval, while the instantaneous wind speed ( V t , T ) is any 5 s running mean wind speed observed. And the peak gust ( V t , T max ) is the highest 5 s running mean wind speed in a 10 min interval.
The gust amplitude ( V t , T a ) is described as the difference between the peak gust ( V t , T max ) and the 10 min mean wind speed:
V t , T a = V t , T max V T
The gust factor ( G T ) is the ratio of the peak gust to the 10 min mean wind speed:
G T = V t , T max V T
The turbulence intensity ( I T ) is defined as
I T = σ T V T
where σ T is the standard deviation of the wind component and is expressed as
σ T = σ u 2 + σ v 2 + σ w 2

3. Comparison of Wind Gusts Parameters at Two Sites: Phenomenon

To compare the wind gusts in the eastern part of the Qinghai–Tibet Plateau and the wind gusts along the coast at the same latitude, we took Xining and Qingdao as examples, respectively. These two locations show different characteristics of wind gusts, as illustrated in Figure 3.
Figure 3 shows the different characteristics of wind gusts at the two sites with increasing height. Above 200 m, the average wind speed in Qingdao is significantly higher than that in Xining (Figure 3a). This may be because the complex canyon topography on both sides of Xining hinders the wind, while the sea–land wind in Qingdao strengthens it [45,46]. However, the difference in peak gust ( V t , T max ) over the two sites is small (Figure 3b). This means that Xining may experience transient wind gusts of the same magnitude as Qingdao, even though the background wind field is weaker. Moreover, Xining has a larger gust amplitude ( V t , T a ) and gust factor ( G T ) (Figure 3c,d). These are the difference and ratio between instantaneous and mean winds when wind gusts occur. These results suggest that the gusts in the eastern part of the Tibetan Plateau are more complex and unpredictable than those at the coast. They also imply that wind gusts in Xining may cause more powerful damage when they occur.
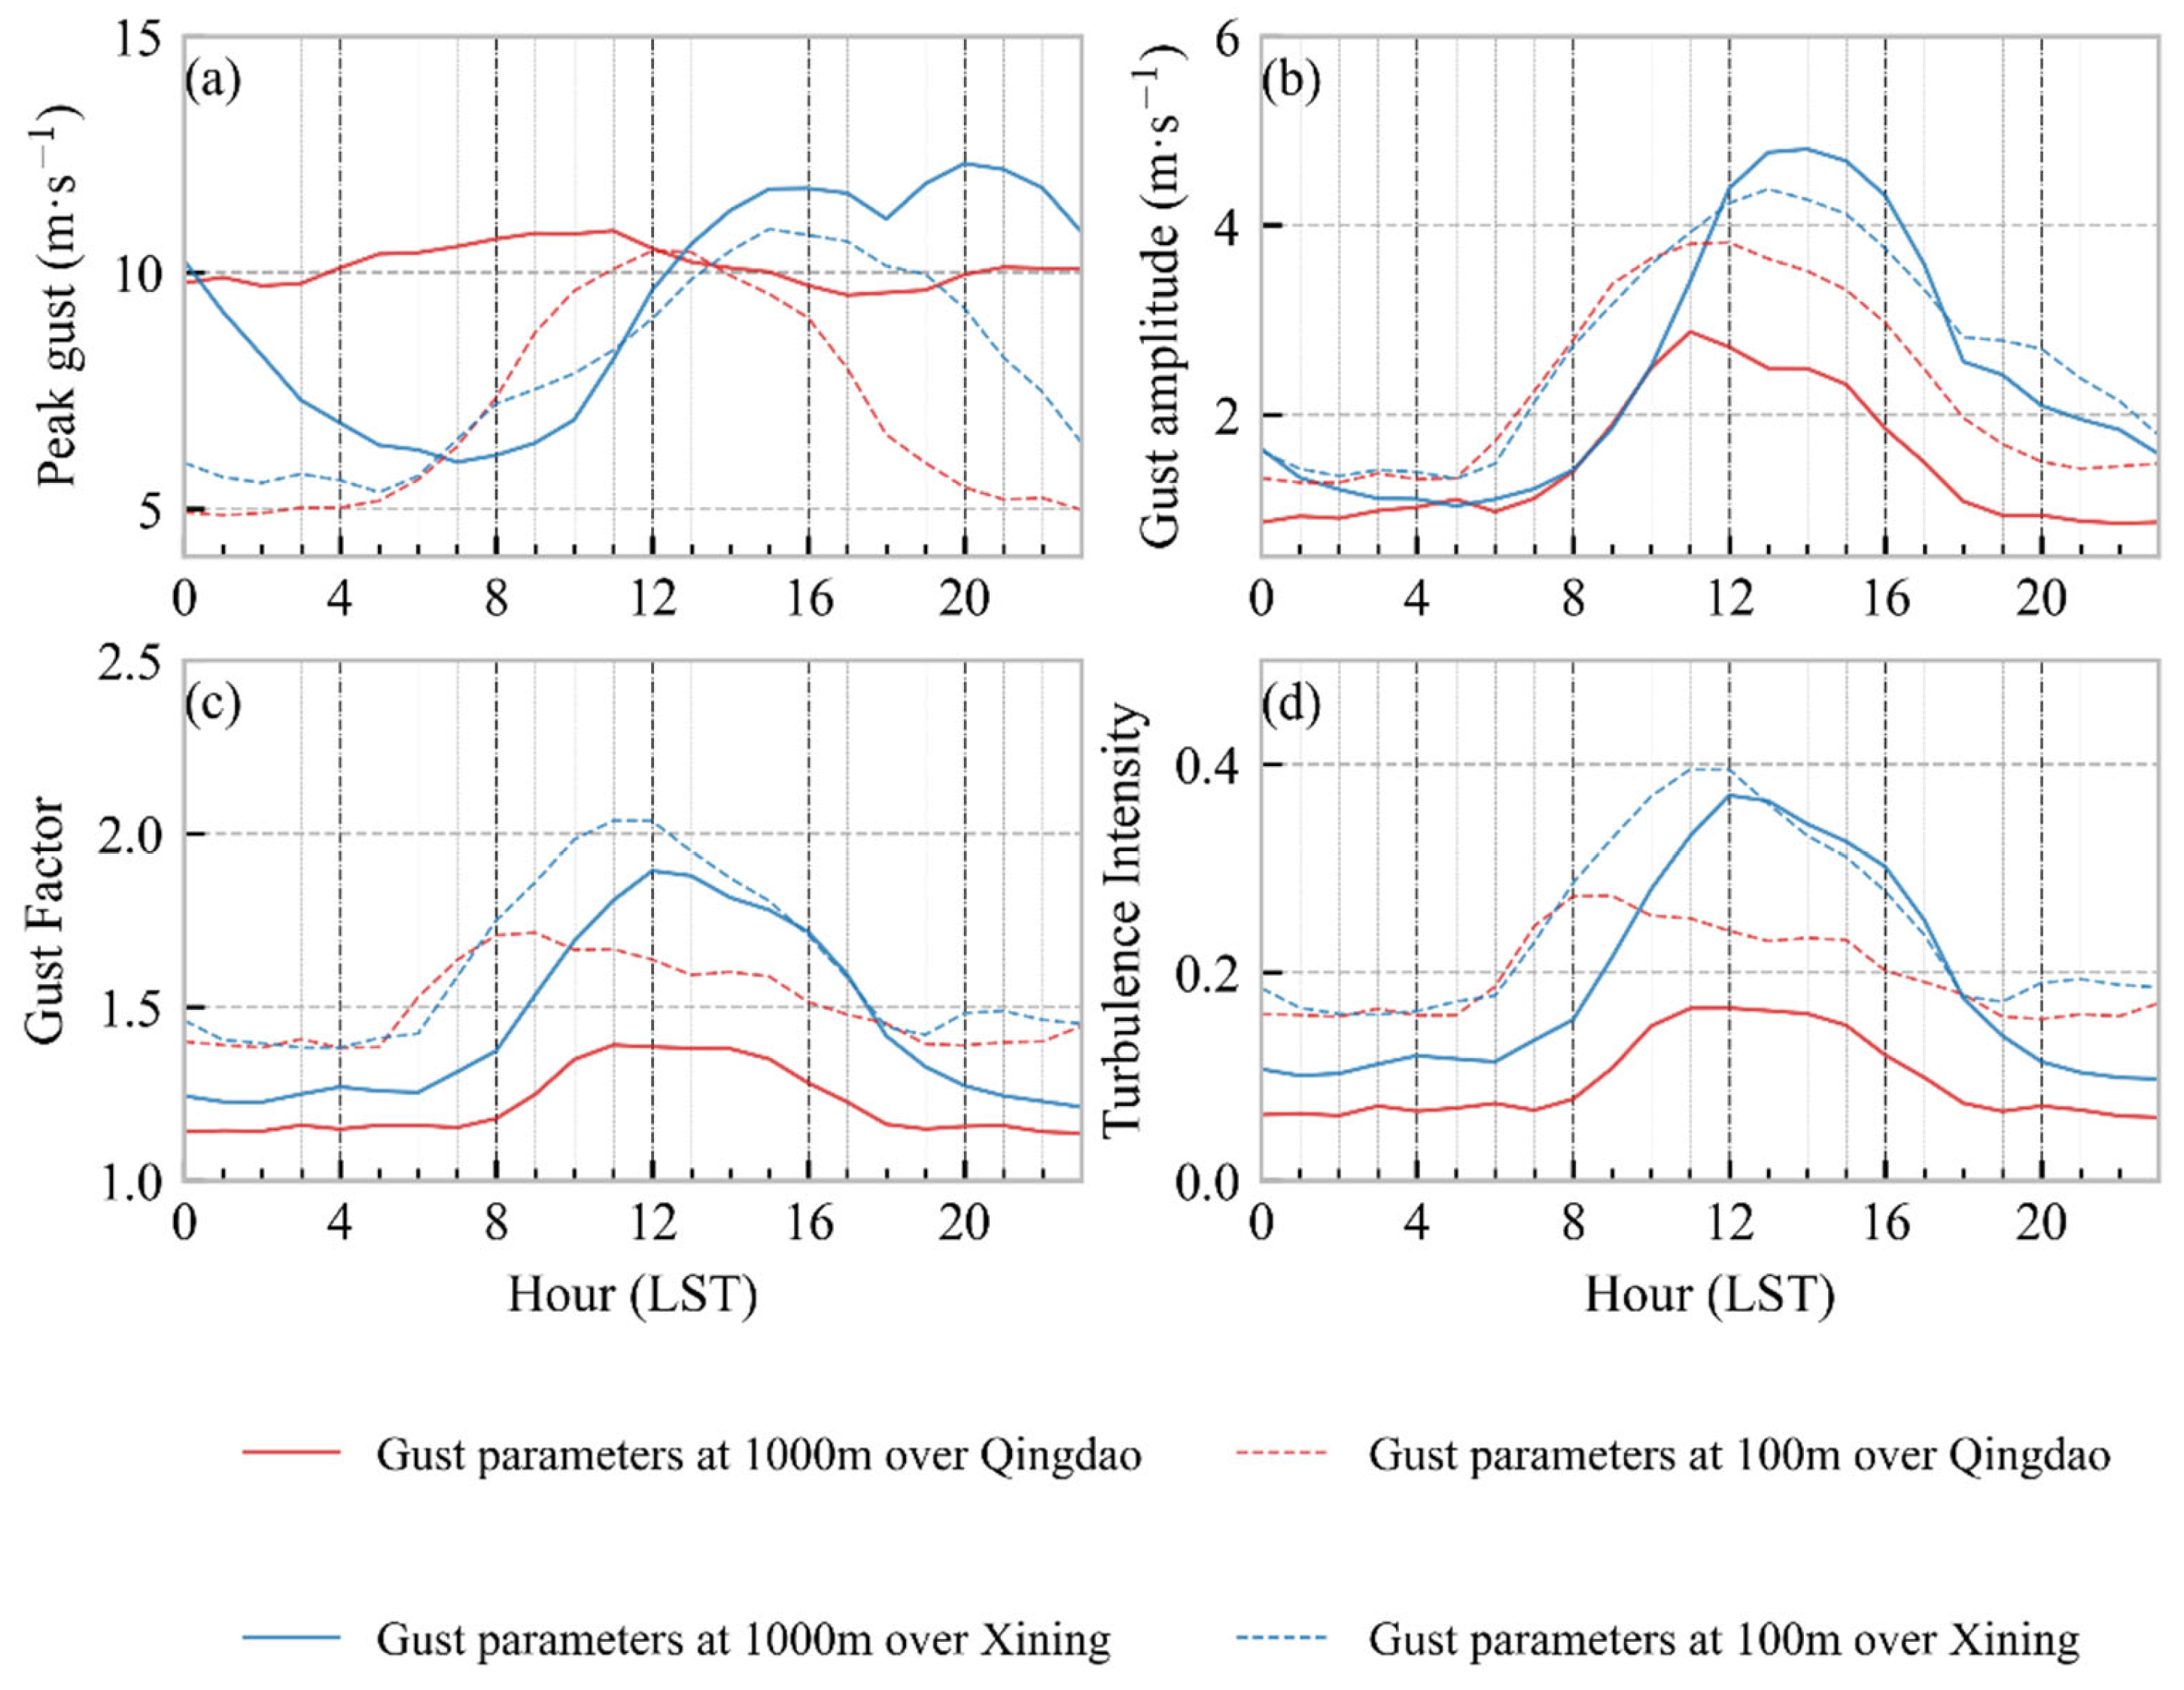
Previous studies [43] have shown that wind gusts vary significantly with diurnal conditions. We studied the diurnal variation in gust parameters at different heights for both sites (Figure 4).
Figure 4 shows the diurnal variation in gust parameters at two typical height layers: 100 m and 1000 m. These layers represent the near-surface mass and low height, respectively. For Qingdao, the gust parameters vary more at the bottom layer than at the upper layer diurnally. The most notable difference is that the peak gust ( V t , T max ) at 100 m reaches its maximum at noon and is weakest at night. However, this feature disappears at 1000 m. Moreover, the gust amplitude ( V t , T a ), gust factor ( G T ) and turbulence intensity ( I T ) are also weaker at 1000 m than at 100 m. This result confirms Suomi et al.’s [43] report that the gust phenomenon becomes less prevalent with height.
In Xining, the gust parameters and turbulence intensity still vary significantly with time of day at 1000 m. In fact, the peak of the gust amplitude ( V t , T a ) and peak gust ( V t , T max ) at 1000 m are higher than those at 100 m (Figure 4a,b). This indicates that strong wind gusts occur above the near-surface mass in Xining. The gust factor ( G T ) and turbulence intensity ( I T ) at 1000 m in Xining are lower than those at 100 m, but still much higher than those in Qingdao (Figure 4c,d). This indicates that the gust phenomenon in Xining can extend to higher heights and is not limited to the near-surface mass, which poses a threat to aviation activities.
The possible reasons for the significant differences in the gust characteristics between Xining and Qingdao are worth exploring. We note that the gust factor ( G T ) and turbulence intensity ( I T ) vary similarly with time of day for both Xining and Qingdao, at both 1000 m and 100 m (Figure 4c,d). This may imply that turbulence influences the gust development. We will discuss this in the next section.

4. The Role of Turbulence: A Possible Explanation

As discussed in Section 3, the gust characteristics in Xining and Qingdao are very different, and turbulence may play some role in gust development. In studying this, Yus-Díez et al. [47] indicated that wind gusts are influenced not only by the mean wind speed but also by turbulence intensity. To investigate further, we analyzed the correlation of gust parameters with mean wind speed and turbulence intensity for both sites, respectively (Figure 5).
As shown in Figure 5, the mean wind speed ( V T ) had a good correlation with the peak gust ( V t , T max ) in Qingdao and Xining, but a weak correlation with the gust amplitude ( V t , T a ). Likewise, the gust factor ( G T ) had a weakly negative correlation with the mean wind speed ( V T ). On the other hand, turbulence intensity ( I T ) has a significant positive correlation with both gust amplitude ( V t , T a ) and gust factor ( G T ), while its correlation with peak gust ( V t , T max ) is weak.
Based on the approach of Zeng et al. [48], we consider wind gusts a superposition of mean winds and turbulence. The peak gust ( V t , T max ) correlates well with the mean wind speed ( V T ), but not with the turbulence intensity ( I T ), suggesting that the peak gust may be influenced by background wind. Moreover, turbulence intensity acts on the magnitude of instantaneous wind, and the stronger the turbulence intensity ( I T ), the higher the gust factor ( G T ) and gust amplitude ( V t , T a ). These results indicate that the mean wind and turbulence intensity may be responsible for the differences in wind gusts.
To examine how turbulence affects gust formation, we classified the 50 m winds in Xining into two groups based on their turbulence intensity ( I T ): strong-turbulence winds (0.365 < I T ) and weak-turbulence winds ( I T < 0.161). The lower and upper quartiles of I T at this height are 0.161 and 0.365, respectively. We then analyzed the wind gusts for each group separately and compared them in Figure 6.
Figure 6 shows that the peak gust ( V t , T max ) increases rapidly with the mean wind speed ( V T ) under strong turbulence conditions. However, this does not mean that the peak gust ( V t , T max ) are always higher under strong turbulence conditions. Under strong turbulence conditions, the mean wind speed ( V T ) is mostly below 5 m·s−1 and the peak gust ( V t , T max ) is below 10 m·s−1. Under weak turbulence conditions, however, the mean wind speed ( V T ) can reach up to 10 m·s−1 and the peak gust ( V t , T max ) can reach up to 15 m·s−1. A possible explanation is that a strong mean wind reduces the turbulence intensity.
This indicates that both the mean wind and the turbulence affect the wind gusts. However, strong turbulence conditions can produce higher wind gusts than weak turbulence conditions at the same mean wind speed, which supports our previous experiments [41].
As discussed above, turbulence and mean winds jointly influence the development of wind gusts, which may explain the different gust characteristics between Xining and Qingdao. These two sites are in the eastern part of the Tibetan Plateau and the coastal area, respectively, and their background wind and turbulence activities need to be analyzed to further explain the reasons for the differences in wind gusts between Xining and Qingdao.
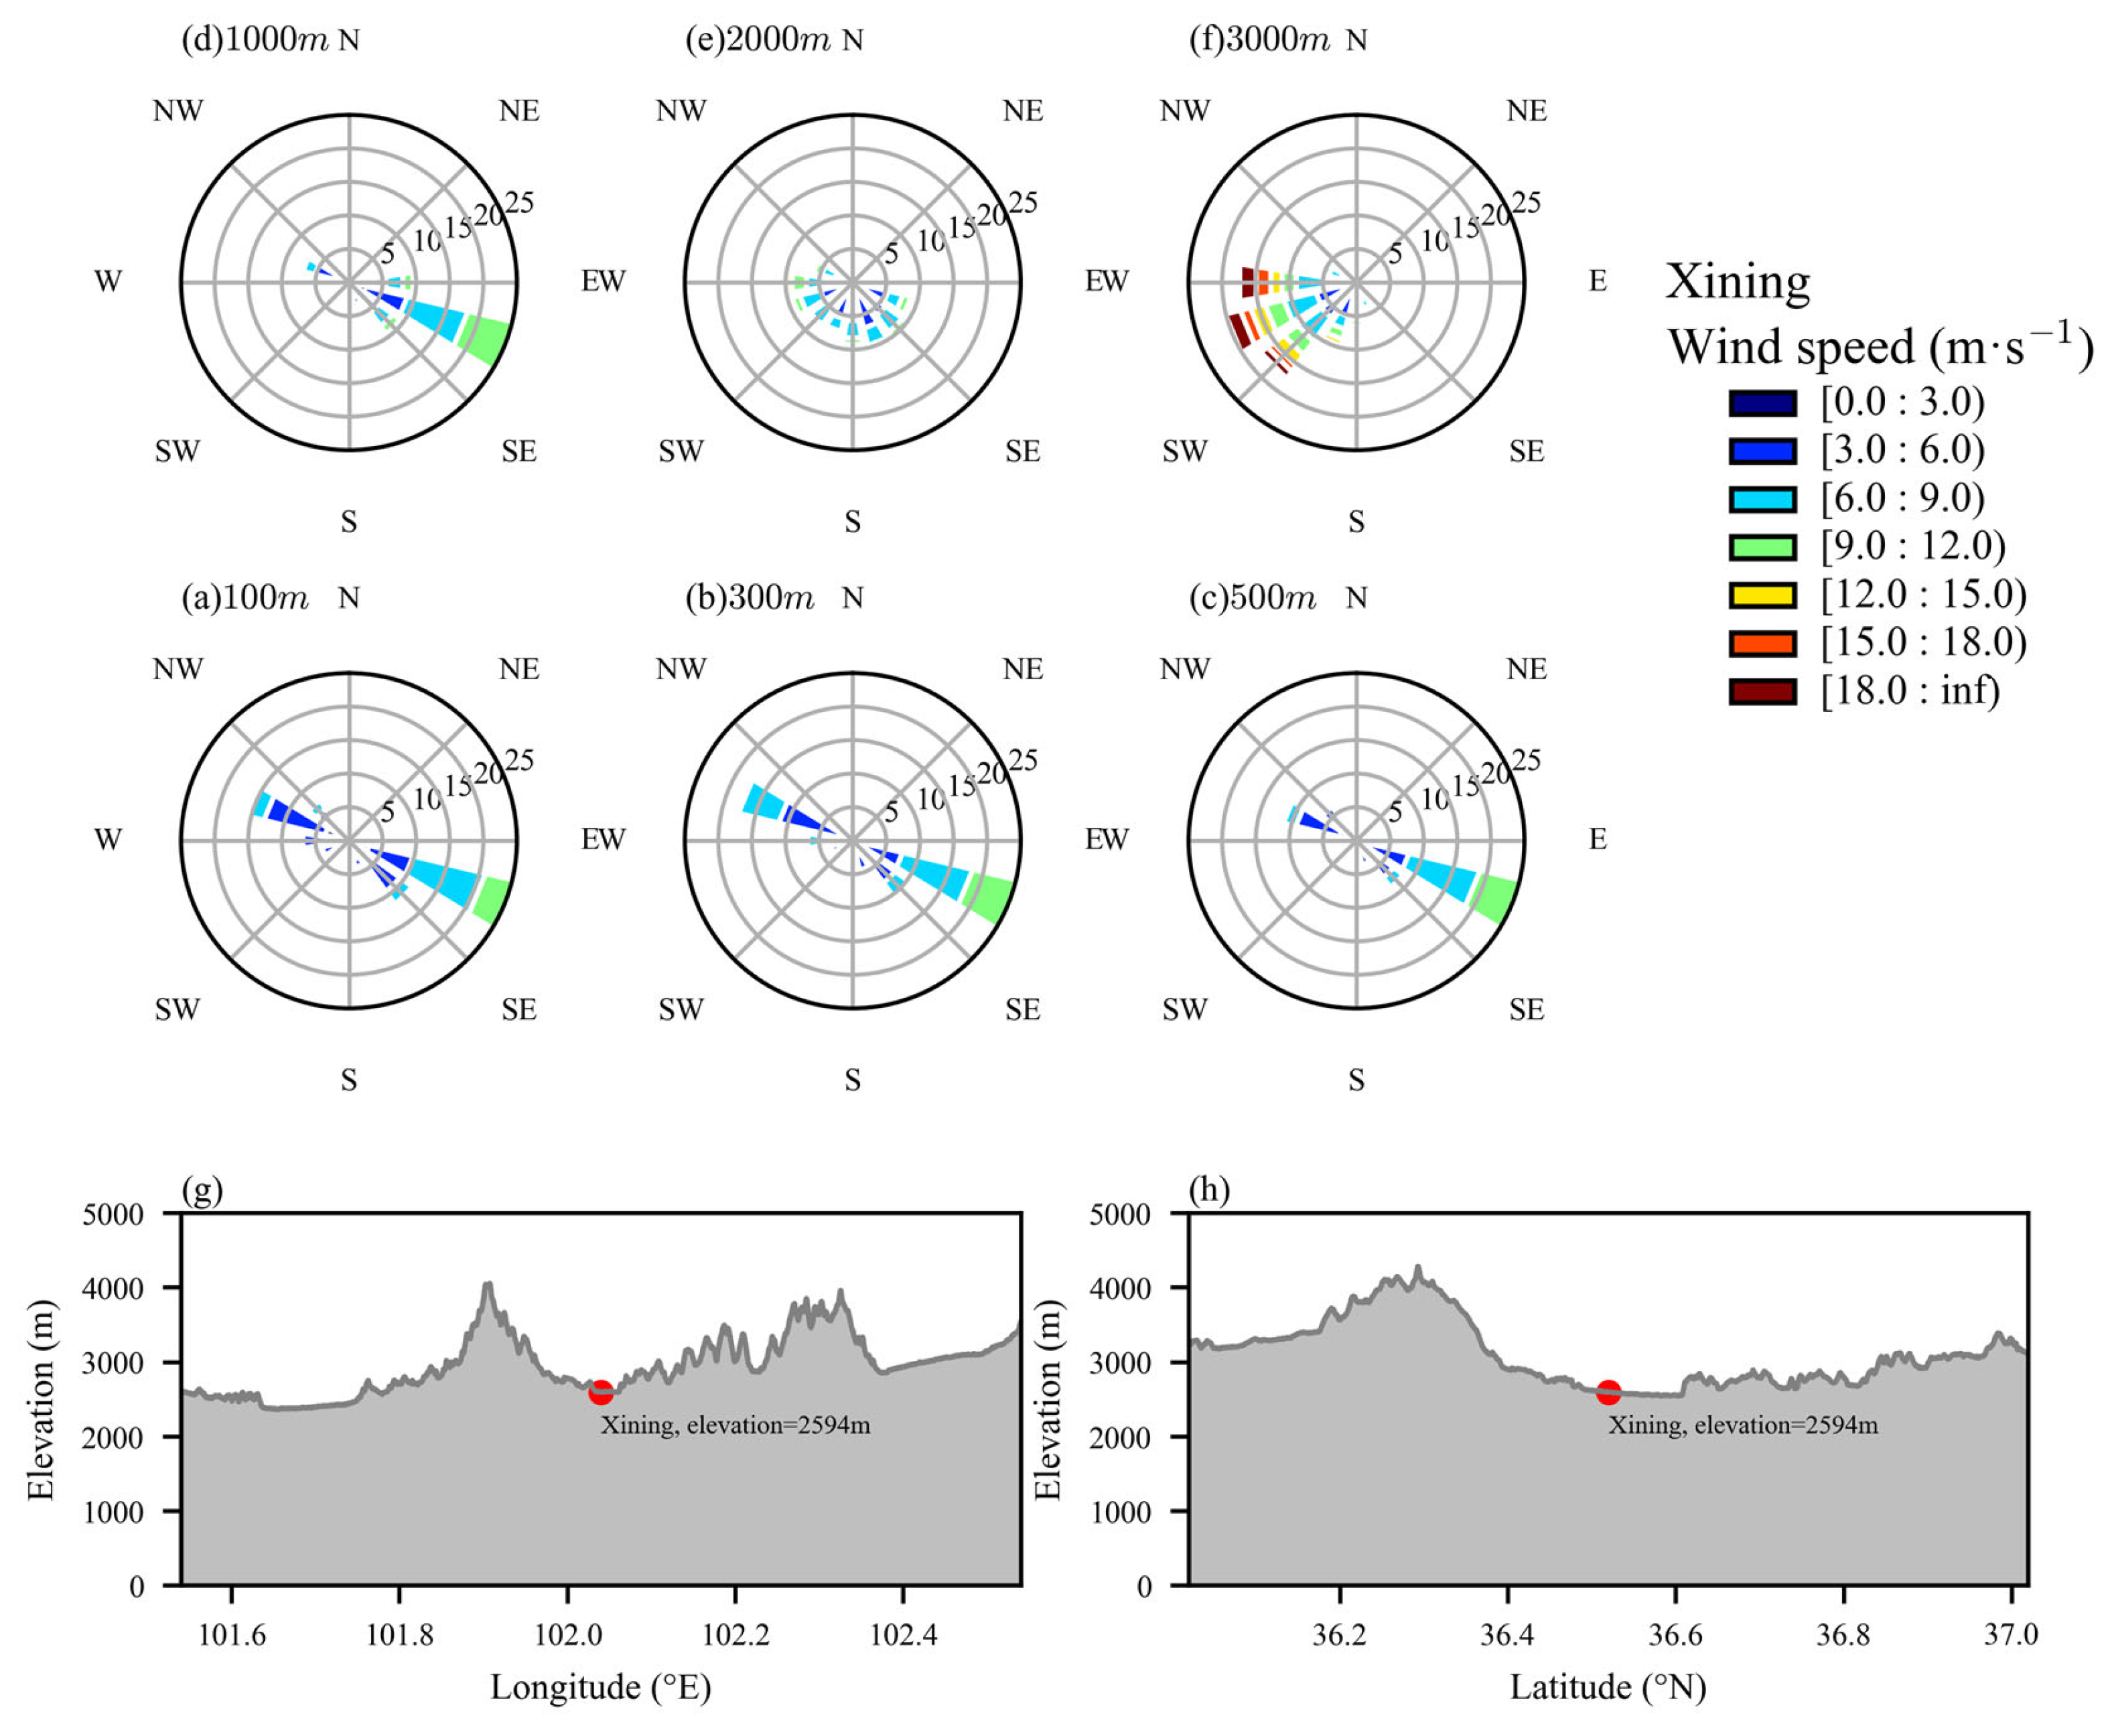
Figure 7 and Figure 8 show the average wind speed and wind direction at different height levels in Qingdao and Xining, respectively. In Qingdao, the lower layer has a smaller wind speed and a southwesterly flow, being influenced by the secondary circulation of the sea and land. The upper layer has a strong westerly wind, consistent with the geostrophic wind theory. The wind speed increases and the wind direction shifts westerly with the increase in height.
The wind field in Xining is strongly influenced by the complex topography of the plateau. The mean winds are weak and constant in direction (either southeast or northwest) below 1000 m, but they change abruptly to strong westerlies above 2000 m. This suggests that the high mountains on the north and south sides of Xining increase friction and obstruct air flow.
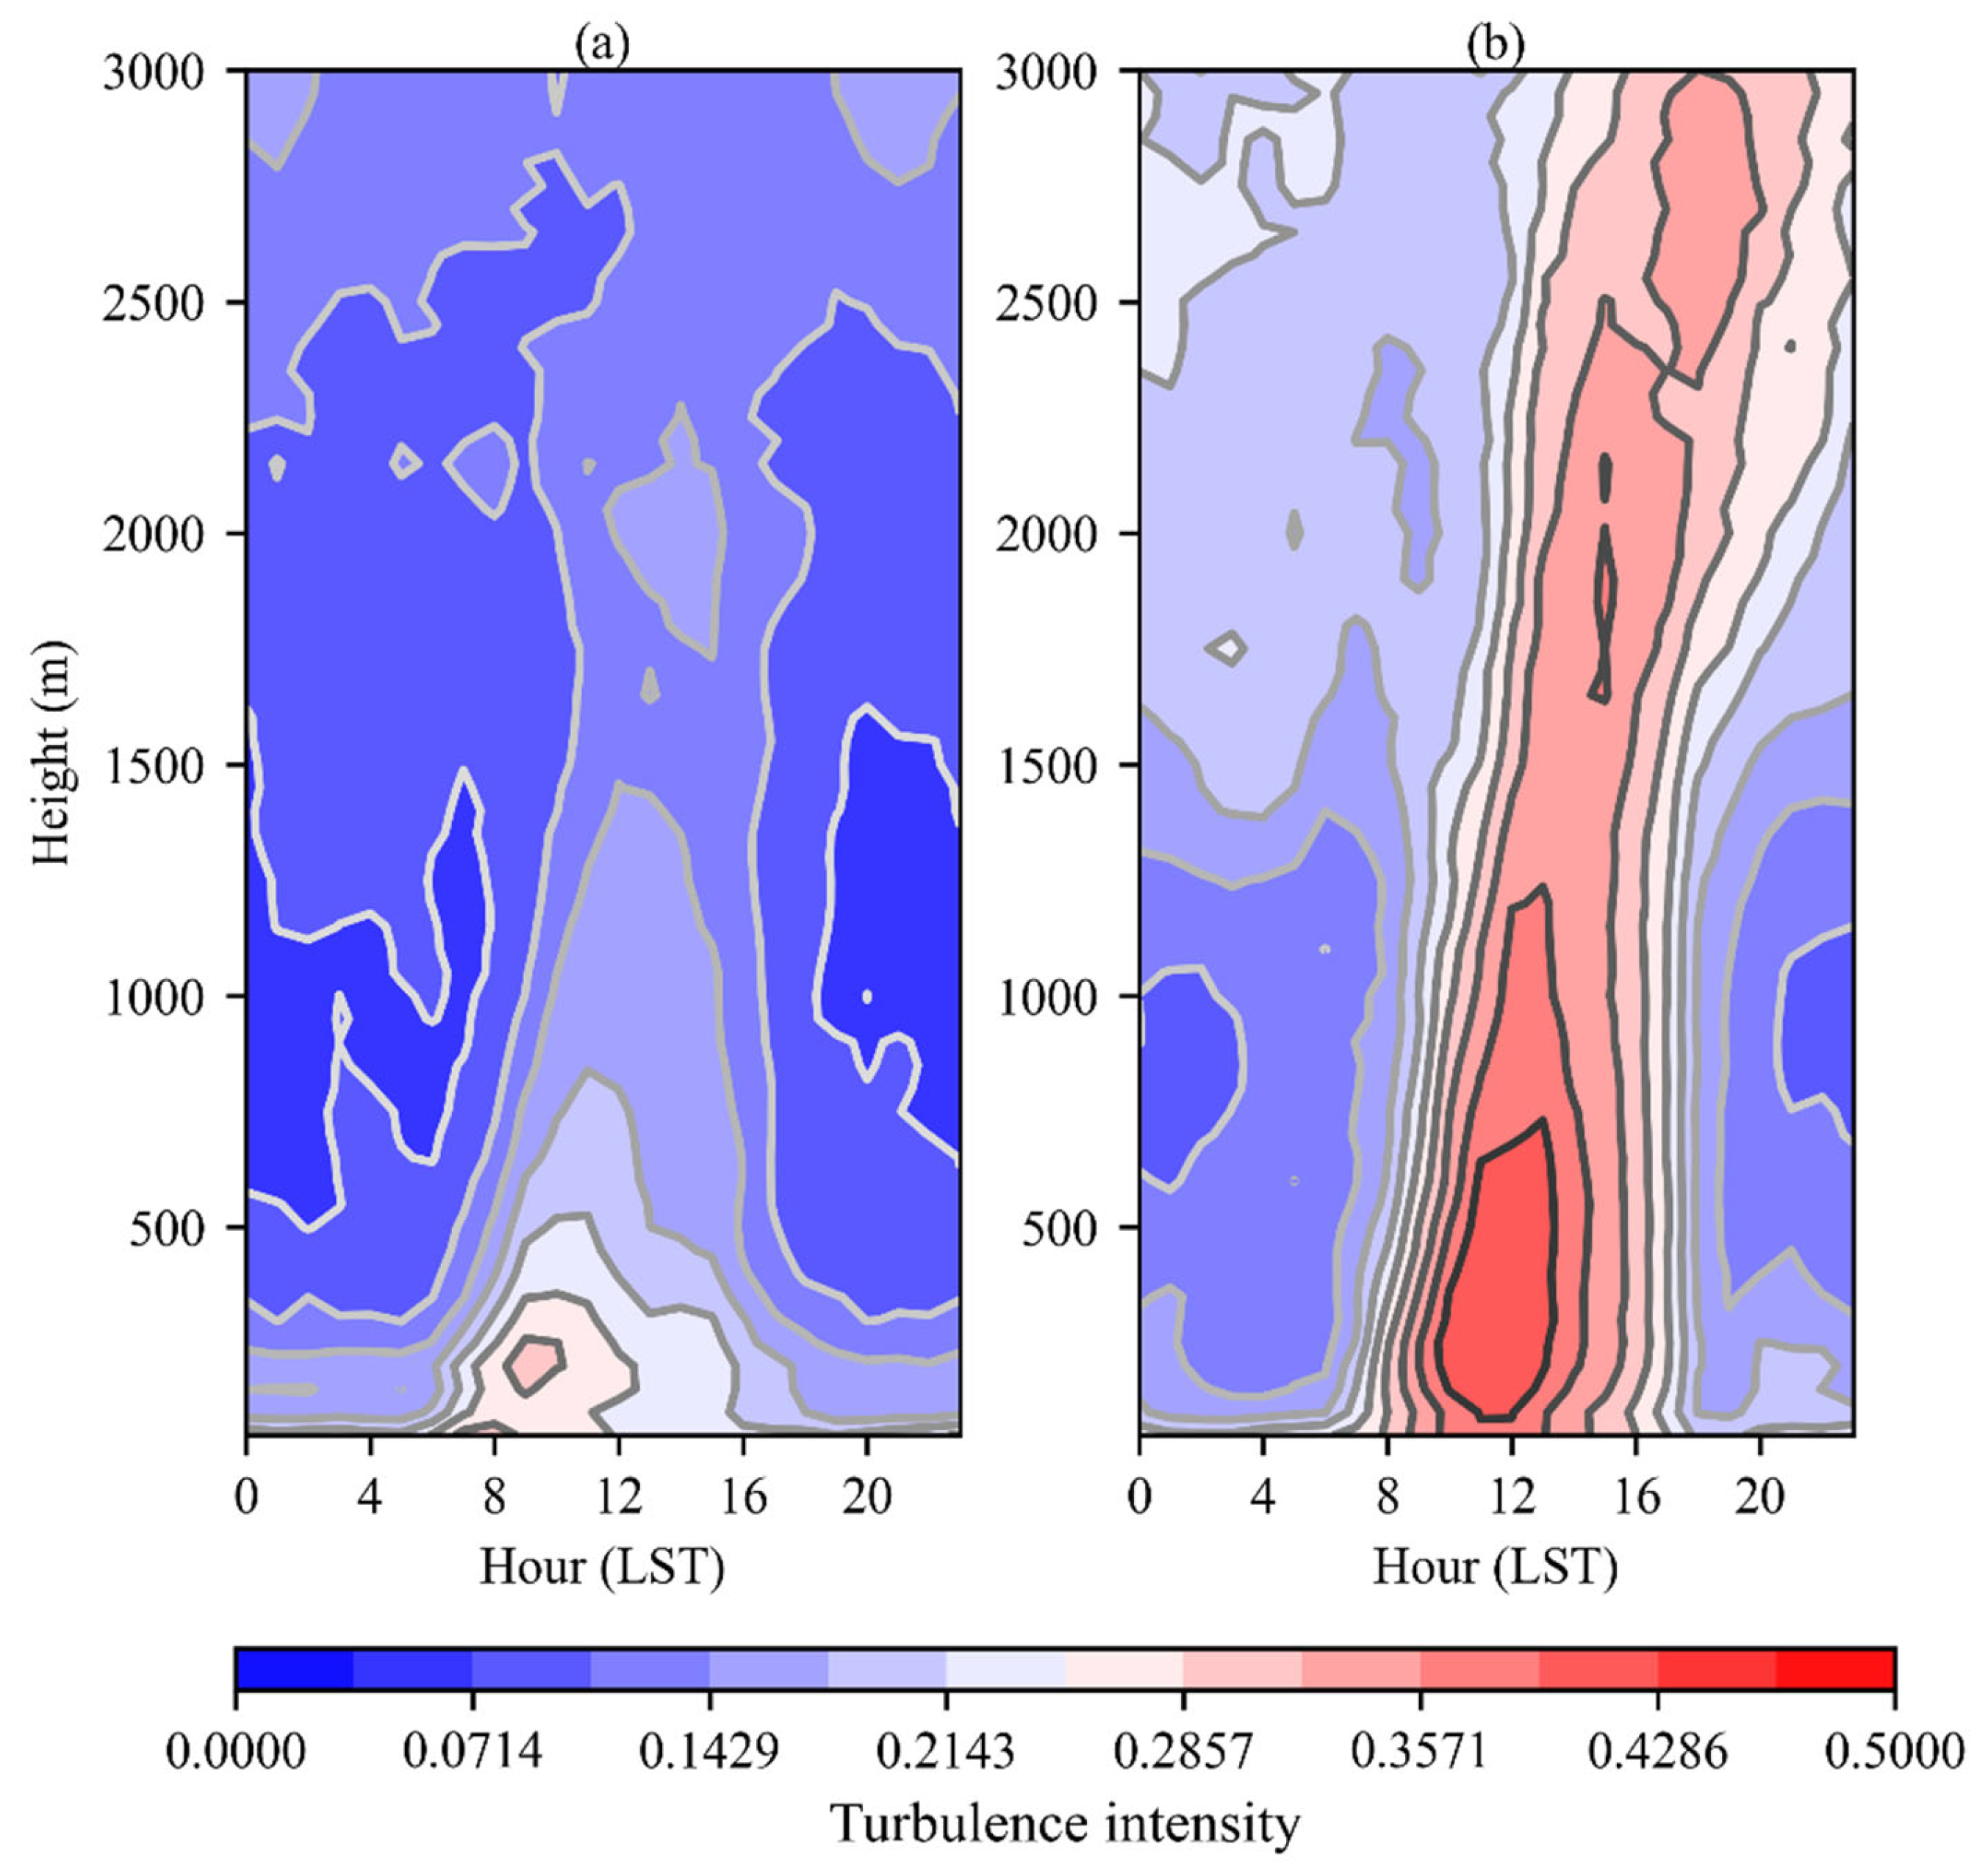
Figure 9 shows the diurnal variation in turbulence intensity at different height layers in Qingdao and Xining. The turbulence intensity ( I T ) of the near-surface mass increases sharply after sunrise in Qingdao and starts to decrease in the late afternoon, at up to 500 m in height (Figure 9a). In contrast, very strong turbulence is observed in Xining during the daytime, and its intensity is much greater than that in Qingdao. Furthermore, the turbulence development in Xining is very vigorous and can reach very high heights of up to 3000 m (Figure 9b).
One possible cause of the special gust characteristics of Xining is the strong turbulence intensity at this site. As shown in Figure 5, turbulence intensity ( I T ) has a strong positive correlation with gust factor ( G T ) and gust amplitude ( V t , T a ). The strong turbulence in Xining may result from various factors, such as strong radiation and topographic friction in the eastern part of the Tibetan Plateau. Further work is needed to analyze the exact causes.
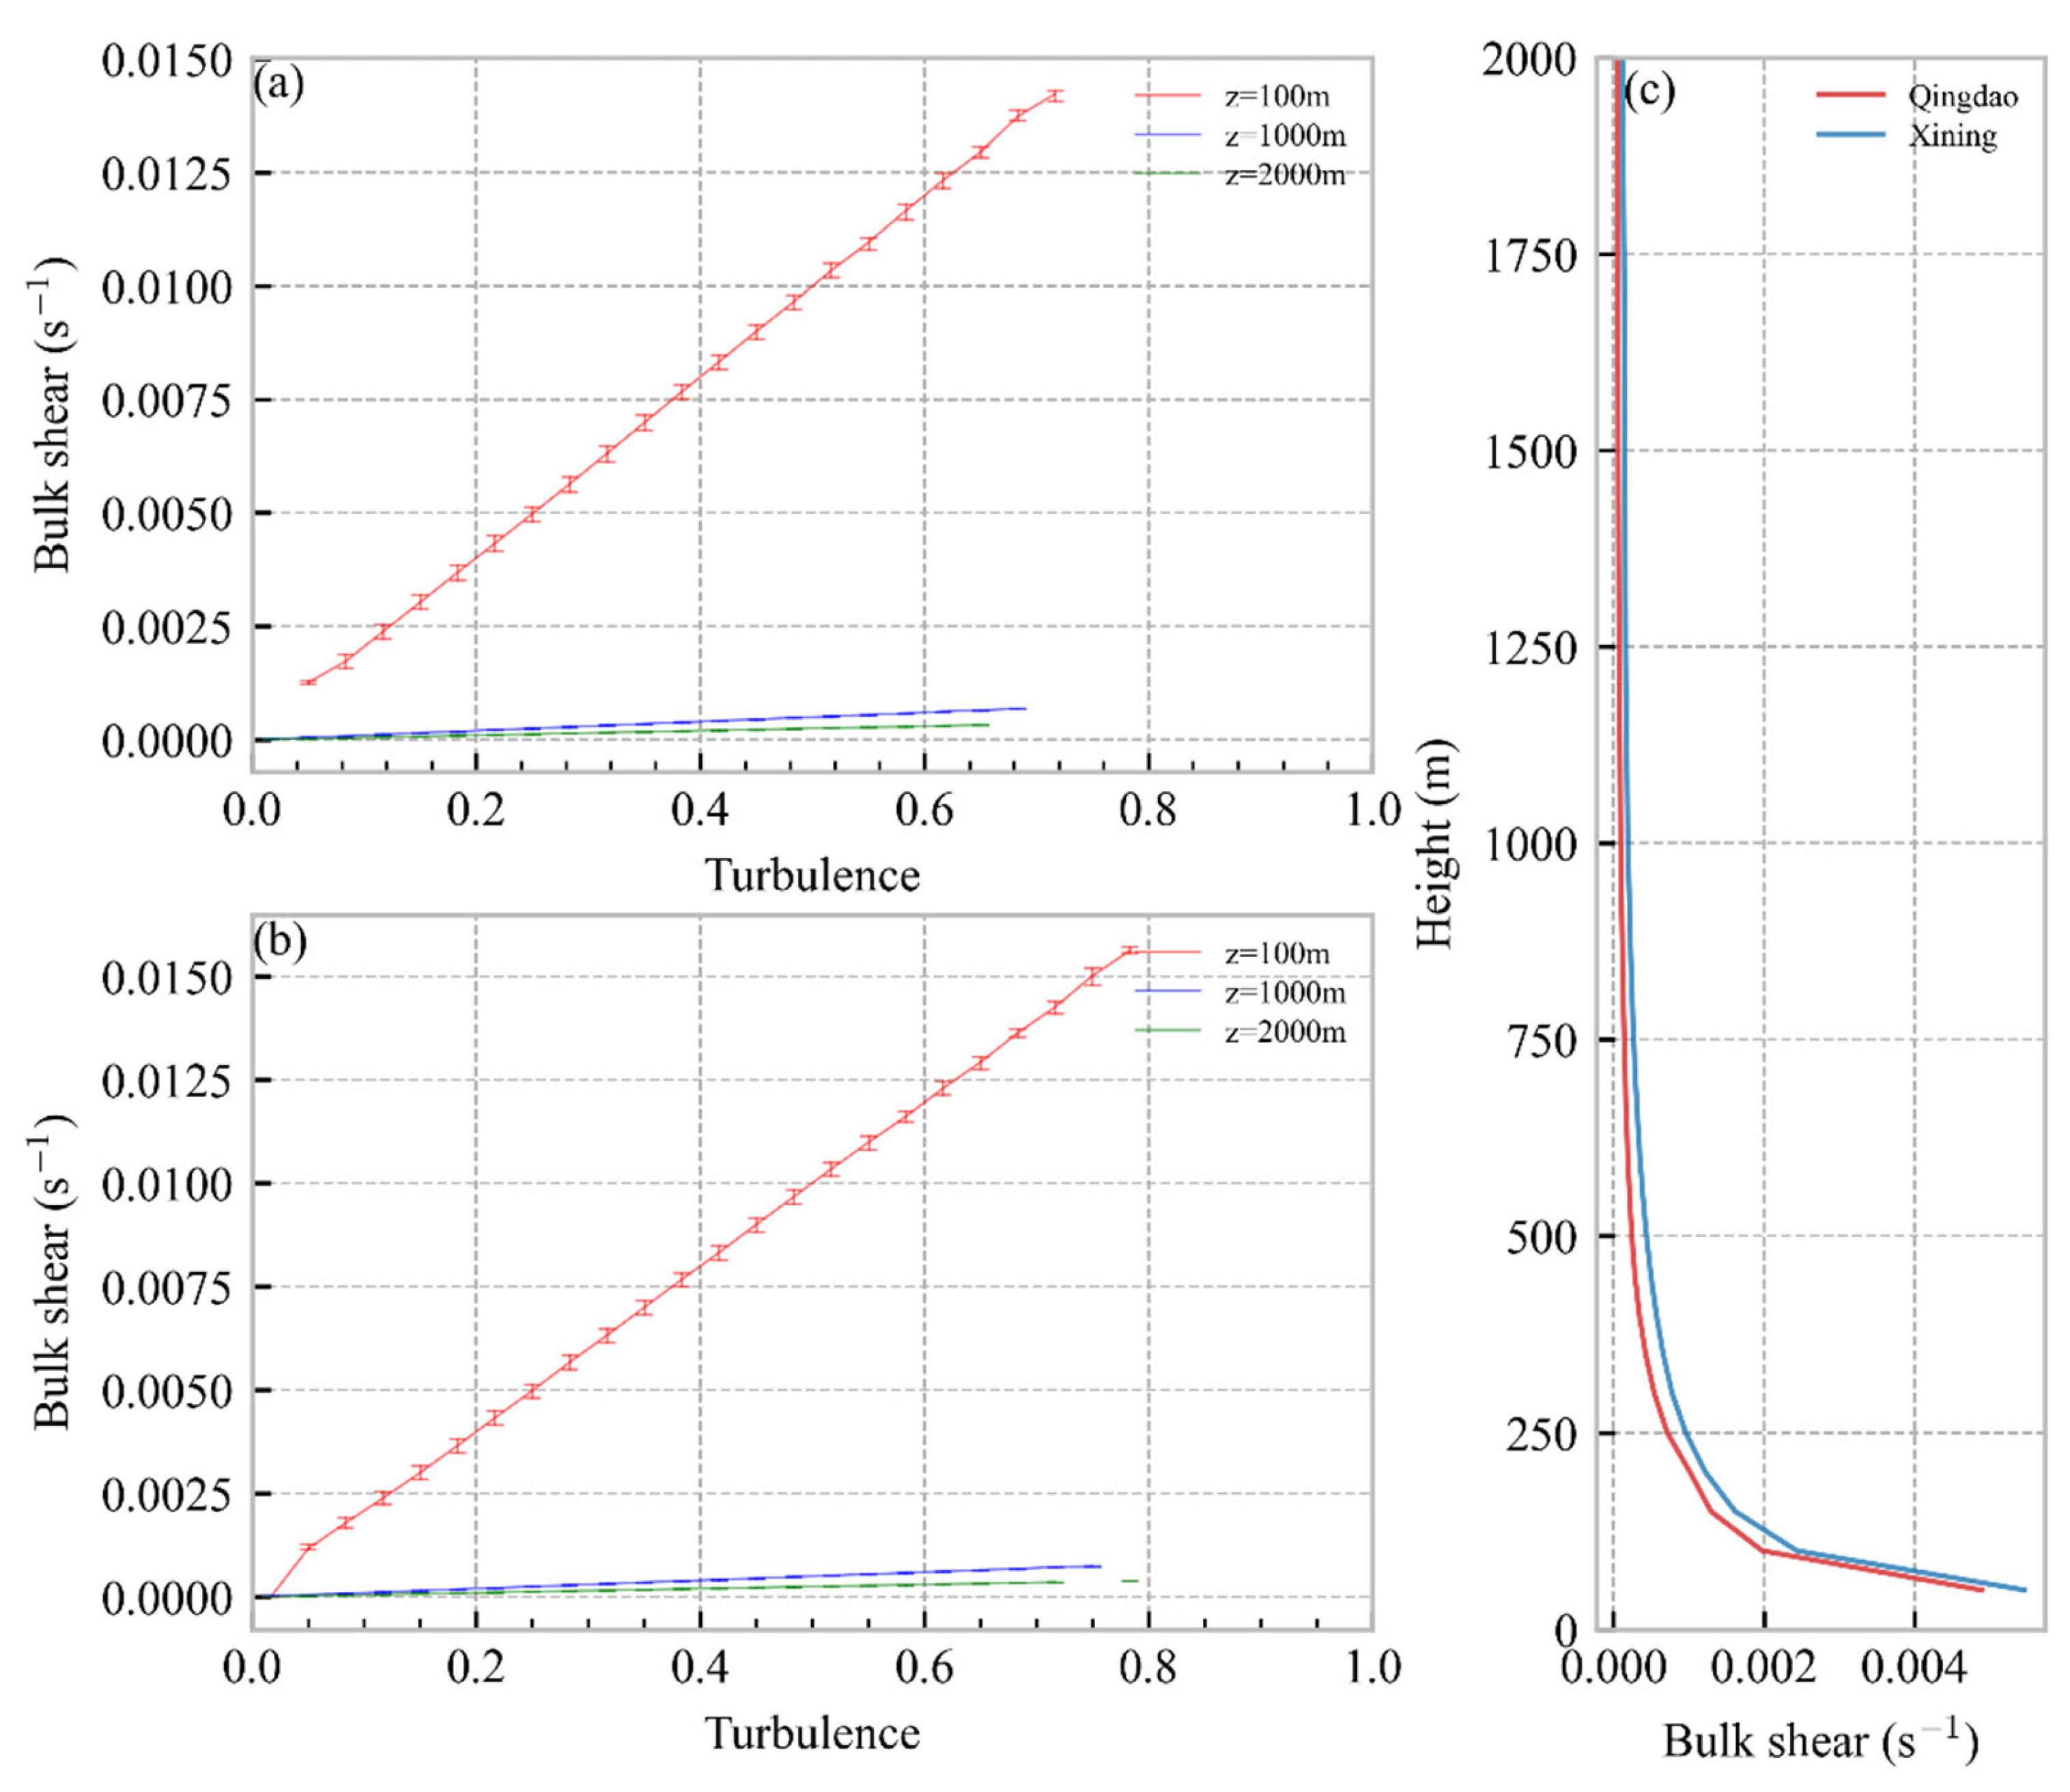
We propose that the bulk shear, which is the ratio of the vertical airflow to the height [49,50], is the main driver of the strong turbulence near the surface of Xining. To examine this hypothesis, we compared the bulk shear characteristics at different heights between the two sites, Xining and Qingdao (Figure 10).
According to Figure 10, the bulk shear in both Xining and Qingdao is strong near the surface and decreases rapidly with increasing height. However, the bulk shear in Xining is always stronger than that in Qingdao. Moreover, the bulk shear has a significant positive correlation with turbulence intensity at 100 m, but not at 1000 m or 2000 m. This result supports the work of Yus-Díez et al. [47], which demonstrates that low-level turbulence is mainly driven by shear. Therefore, we infer that due to the complex topography in the eastern part of the Qinghai–Tibet Plateau, there can be stronger friction and shear, thus driving stronger near-surface turbulence. To measure terrain complexity, the standard deviation of the elevation based on the ASTER Global Digital Elevation Model was calculated [51]. The results show that the standard deviation of topography within 1° centered on Xining (624.59) is much higher than that of Qingdao (66.02), which supports our inference.
However, this result still does not explain why turbulence can develop at very high heights in Xining. This could be related to mountain waves, gravity waves and density flow [52,53,54], but more evidence is still needed.

5. Conclusions and Discussion

Wind gusts and their hazards have been extensively studied in recent years. However, the characteristics of wind gusts under the influence of complex topography on the Tibetan Plateau are still poorly understood [3,43]. This paper compares the wind gust characteristics of the eastern Qinghai–Tibet Plateau and the coastal areas at the same latitude, using Doppler lidar data from Xining and Qingdao stations. We also analyze the causes of these differences.
Although Doppler lidar is highly reliable, some erroneous data still exist. In this paper, data quality control is performed by machine learning methods to remove significant erroneous data while preserving turbulence perturbations. The gust parameters and turbulence were analyzed using the data after data quality control, and the conclusions are as follows.
Previous studies have shown that wind gusts have different properties in the vertical direction and vary greatly with diurnal conditions [6,36,41,55]. In this study, we analyzed the gust parameters and their diurnal variation at different heights at the two sites (Figure 3 and Figure 4).
The results show that the vertical wind speed over Qingdao is significantly higher than that over Xining, but the difference in peak gust between the two sites is small (Figure 3b). Moreover, the gust amplitude and gust factor are larger for Xining than for Qingdao. For Qingdao, the gust phenomenon decreases with height, confirming the report of Suomi et al. [43], which showed that wind gusts near the surface are more influenced by surface properties and subject to stronger frictional effects. However, for Xining, the gust parameters and turbulence intensity are still strong at 1000 m above ground.
The complex canyon topography on both sides of Xining impedes the winds, while the sea–land winds from Qingdao strengthen the winds [45,46]. However, the results indicate that the gust phenomenon in Xining is stronger and can extend to higher altitudes, not being limited to near the surface. This poses a threat to aviation activities. Therefore, wind gusts on the eastern Tibetan Plateau may be more complex and unpredictable than wind gusts on the coast, and wind gusts in Xining may cause more powerful damage when they occur.
We analyzed the relationship between mean wind and turbulence intensity and its effect on gust parameters (Figure 5), referring to the work of Yus-Díez et al. [47]. The aim was to identify the factors that influence the differences in wind gusts between the two sites. The results show that the peak gust is significantly correlated with mean wind speed, while gust factors and gust amplitudes are strongly correlated with turbulence intensity. These results suggest that the mean wind and turbulence intensity may be responsible for the differences in gust. Moreover, strong turbulence conditions can generate higher wind gusts than weak turbulence conditions at the same mean wind speed. However, a high mean wind speed may also reduce the turbulence (Figure 6).
Finally, we analyzed the background wind and turbulence at both sites. We found that the wind field in Qingdao is consistent with the ground-rotation wind theory, where the wind speed increases with increasing height and the wind direction shifts to the west. In contrast, the wind in Xining is strongly influenced by the complex topography of the plateau, and the high mountains to the north and south of Xining increase friction and impede the air flow. We also observed that very strong turbulence is present in Xining during the daytime, and its intensity is much greater than that in Qingdao. In addition, turbulence development in Xining is very strong and can reach very high altitudes of up to 3000 m (Figure 9b). Turbulence and mean wind jointly influence the development of wind gusts, and the strong differences in turbulence may explain the different gust characteristics between Xining and Qingdao.
However, the cause of such strong turbulence in the eastern part of the Tibetan Plateau is not well understood. We compared the bulk shear at different heights between two sites, Xining and Qingdao, and found that Xining had stronger bulk shear than Qingdao. This result is consistent with that of Yus-Díez et al. [47], who suggested that shear is the main driver of low-level turbulence. We hypothesize that the complex topography of the eastern Tibetan Plateau creates more friction and shear, which enhances the near-surface turbulence.
In conclusion, this study compares the different characteristics of wind gusts at two sites, Xining and Qingdao, and analyzes the reasons behind them. We found that complex topography and turbulence may contribute greatly to the development of wind gusts over the eastern part of the Tibetan Plateau. These results provide observational evidence for wind gusts over the complex terrain of the Tibetan Plateau. That will contribute to the understanding of the mechanism of wind gust development, regional differences in wind gusts and the study of the impact of wind gusts on flight safety in the eastern part of the Tibetan Plateau. However, the generalizability of these findings needs to be tested on a larger scale, and the causes of strong turbulence at high altitude over the eastern Tibetan Plateau need to be further analyzed. In addition, topography and bulk shear do not adequately account for the complex wind gusts and turbulence on the Tibetan Plateau. It also depends on thermal and radiative factors that need more comprehensive data analysis.

Author Contributions

The study was completed with cooperation among all authors. C.Z. and Y.L. designed this study; X.Z. and Z.Z. conducted the experiment and wrote the manuscript with input from all coauthors; C.Z. and Y.L. checked the experimental results. All authors have read and agreed to the published version of the manuscript.

Funding

This research was supported by the National Natural Science Foundation of China (grant U2242201, 42075077), the Hunan Provincial Natural Science Foundation of China (grant 2021JC0009, 2023JJ30629) and the Fengyun Application Pioneering Project (FY-APP-2022.0605).

Acknowledgments

We gratefully acknowledge Jie Zhang from the College of Atmospheric Science, Chengdu University of Information Technology, Plateau Atmosphere and Environment Key Laboratory of Sichuan Province for providing the Doppler lidar data on Xining with stable performance.

Conflicts of Interest

The authors declare no conflict of interest.

References

  1. Black, A.W.; Ashley, W.S. Fatalities Associated with Nonconvective High-Wind Events in the United States. J. Appl. Meteorol. Climatol. 2008, 47, 717–725. [Google Scholar] [CrossRef]
  2. Pryor, S.C.; Conrick, R.; Miller, C.; Tytell, J.; Barthelmie, R.J. Intense and Extreme Wind Speeds Observed by Anemometer and Seismic Networks: An Eastern U.S. Case Study. J. Appl. Meteorol. Climatol. 2014, 53, 2417–2429. [Google Scholar] [CrossRef]
  3. Yao, Z.; Li, X.; Xiao, J. Characteristics of daily extreme wind gusts on the Qinghai-Tibet Plateau, China. J. Arid Land 2018, 10, 673–685. [Google Scholar] [CrossRef] [Green Version]
  4. Cheng, X.; Wu, L.; Hu, F.; Zeng, Q.-C. Parameterizations of some important characteristics of turbulent fluctuations and gusty wind disturbances in the atmospheric boundary layer. J. Geophys. Res. Atmos. 2012, 117. [Google Scholar] [CrossRef] [Green Version]
  5. Hu, W.; Letson, F.; Barthelmie, R.J.; Pryor, S.C. Wind Gust Characterization at Wind Turbine Relevant Heights in Moderately Complex Terrain. J. Appl. Meteorol. Climatol. 2018, 57, 1459–1476. [Google Scholar] [CrossRef]
  6. Letson, F.; Barthelmie, R.J.; Hu, W.; Pryor, S.C. Characterizing wind gusts in complex terrain. Atmos. Chem. Phys. 2019, 19, 3797–3819. [Google Scholar] [CrossRef] [Green Version]
  7. Monahan, A.H.; Rees, T.; He, Y.; McFarlane, N. Multiple Regimes of Wind, Stratification, and Turbulence in the Stable Boundary Layer. J. Atmos. Sci. 2015, 72, 3178–3198. [Google Scholar] [CrossRef]
  8. Xie, J.; Lan, C.; Yang, H.; Gao, R.; Lu, C.; Wang, B.; Chan, P.W.; Fan, S.; Li, L. Tower-observed structural evolution of the low-level boundary layer before, during, and after gust front passage in a coastal area at low latitude. Weather Clim. Extrem. 2022, 36, 100429. [Google Scholar] [CrossRef]
  9. Luchetti, N.T.; Friedrich, K.; Rodell, C.E.; Lundquist, J.K. Characterizing Thunderstorm Gust Fronts near Complex Terrain. Mon. Weather Rev. 2020, 148, 3267–3286. [Google Scholar] [CrossRef]
  10. He, J.Y.; Chan, P.W.; Li, Q.S.; Li, L.; Zhang, L.; Yang, H.L. Observations of wind and turbulence structures of Super Typhoons Hato and Mangkhut over land from a 356 m high meteorological tower. Atmos. Res. 2022, 265, 105910. [Google Scholar] [CrossRef]
  11. Lee, Y.-H.; Lee, G.; Joo, S.; Ahn, K.-D. Observational study of surface wind along a sloping surface over mountainous terrain during winter. Adv. Atmos. Sci. 2018, 35, 276–284. [Google Scholar] [CrossRef]
  12. Xia, J.; Li, H.; Kang, Y.; Yu, C.; Ji, L.; Wu, L.; Lou, X.; Zhu, G.; Wang, Z.; Yan, Z.; et al. Machine Learning-based Weather Support for the 2022 Winter Olympics. Adv. Atmos. Sci. 2020, 37, 927–932. [Google Scholar] [CrossRef]
  13. Wang, K.; Lyu, X.; Huang, J.; Luo, M.; Xu, F. Influence of Topography and the Underlying Surface of the Bohai Sea on Wind and Gust Forecasts. Earth Space Sci. 2022, 10, e2022EA002705. [Google Scholar] [CrossRef]
  14. Harper, B.A.; Kepert, J.D.; Ginger, J.D. Guidelines for Converting between Various Wind Averaging Periods in Tropical Cyclone Conditions. World Meteorological Organization Technical Document WMO/TD-1555. Available online: https://library.wmo.int/index.php?lvl=notice_display&id=135 (accessed on 1 January 2010).
  15. Wood, N. Wind Flow Over Complex Terrain: A Historical Perspective and the Prospect for Large-Eddy Modelling. Bound. Layer Meteorol. 2000, 96, 11–32. [Google Scholar] [CrossRef]
  16. Barthelmie, R.J.; Wang, H.; Doubrawa, P.; Giroux, G.; Pryor, S.C. Effects of an escarpment on flow parameters of relevance to wind turbines. Wind Energy 2016, 19, 2271–2286. [Google Scholar] [CrossRef]
  17. Wagenbrenner, N.S.; Forthofer, J.M.; Lamb, B.K.; Shannon, K.S.; Butler, B.W. Downscaling surface wind predictions from numerical weather prediction models in complex terrain with WindNinja. Atmos. Chem. Phys. 2016, 16, 5229–5241. [Google Scholar] [CrossRef] [Green Version]
  18. Jubayer, C.M.; Hangan, H. A hybrid approach for evaluating wind flow over a complex terrain. J. Wind Eng. Ind. Aerodyn. 2018, 175, 65–76. [Google Scholar] [CrossRef]
  19. Hasager, C.B.; Nielsen, N.W.; Jensen, N.O.; Boegh, E.; Christensen, J.H.; Dellwik, E.; Soegaard, H. Effective Roughness Calculated from Satellite-Derived Land Cover Maps and Hedge-Information used in a Weather Forecasting Model. Bound. Layer Meteorol. 2003, 109, 227–254. [Google Scholar] [CrossRef]
  20. Earl, N.; Dorling, S.; Starks, M.; Finch, R. Subsynoptic-scale features associated with extreme surface gusts in UK extratropical cyclone events. Geophys. Res. Lett. 2017, 44, 3932–3940. [Google Scholar] [CrossRef] [Green Version]
  21. Tieleman, H.W. Wind characteristics in the surface layer over heterogeneous terrain. J. Wind Eng. Ind. Aerodyn. 1992, 41, 329–340. [Google Scholar] [CrossRef]
  22. Markowski, P.M.; Dotzek, N. A numerical study of the effects of orography on supercells. Atmos. Res. 2011, 100, 457–478. [Google Scholar] [CrossRef] [Green Version]
  23. Bechmann, A.; Sørensen, N.N.; Berg, J.; Mann, J.; Réthoré, P.E. The Bolund Experiment, Part II: Blind Comparison of Microscale Flow Models. Bound. Layer Meteorol. 2011, 141, 245–271. [Google Scholar] [CrossRef] [Green Version]
  24. Berg, J.; Mann, J.; Bechmann, A.; Courtney, M.S.; Jørgensen, H.E. The Bolund Experiment, Part I: Flow Over a Steep, Three-Dimensional Hill. Bound. Layer Meteorol. 2011, 141, 219–243. [Google Scholar] [CrossRef] [Green Version]
  25. Butler, B.W.; Wagenbrenner, N.S.; Forthofer, J.M.; Lamb, B.K.; Shannon, K.S.; Finn, D.; Eckman, R.M.; Clawson, K.; Bradshaw, L.; Sopko, P.; et al. High-resolution observations of the near-surface wind field over an isolated mountain and in a steep river canyon. Atmos. Chem. Phys. 2015, 15, 3785–3801. [Google Scholar] [CrossRef] [Green Version]
  26. Suomi, I.; Vihma, T. Wind Gust Measurement Techniques—From Traditional Anemometry to New Possibilities. Sensors 2018, 18, 1300. [Google Scholar] [CrossRef] [Green Version]
  27. Guo, J.; Zhai, P.; Wu, L.; Cribb, M.; Li, Z.; Ma, Z.; Wang, F.; Chu, D.; Wang, P.; Zhang, J. Diurnal variation and the influential factors of precipitation from surface and satellite measurements in Tibet. Int. J. Climatol. 2014, 34, 2940–2956. [Google Scholar] [CrossRef]
  28. Fang, X.; Han, Y.; Ma, J.; Song, L.; Yang, S.; Zhang, X. Dust storms and loess accumulation on the Tibetan Plateau: A case study of dust event on 4 March 2003 in Lhasa. Chin. Sci. Bull. 2004, 49, 953–960. [Google Scholar] [CrossRef]
  29. Han, Y.; Fang, X.; Kang, S.; Wang, H.; Kang, F. Shifts of dust source regions over central Asia and the Tibetan Plateau: Connections with the Arctic oscillation and the westerly jet. Atmos. Environ. 2008, 42, 2358–2368. [Google Scholar] [CrossRef]
  30. Li, J.; Liu, H.; Su, Z.; Fan, X. Changes in wind activity from 1957 to 2011 and their possible influence on aeolian desertification in northern China. J. Arid Land 2015, 7, 755–764. [Google Scholar] [CrossRef]
  31. Ding, J.; Cuo, L.; Zhang, Y.; Zhang, C. Varied spatiotemporal changes in wind speed over the Tibetan Plateau and its surroundings in the past decades. Int. J. Climatol. 2021, 41, 5956–5976. [Google Scholar] [CrossRef]
  32. Yang, Y.; Fan, S.; Wang, L.; Gao, Z.; Zhang, Y.; Zou, H.; Miao, S.; Li, Y.; Huang, M.; Yim, S.H.L.; et al. Diurnal Evolution of the Wintertime Boundary Layer in Urban Beijing, China: Insights from Doppler Lidar and a 325-m Meteorological Tower. Remote Sens. 2020, 12, 3935. [Google Scholar] [CrossRef]
  33. De Arruda Moreira, G.; Guerrero-Rascado, J.L.; Benavent-Oltra, J.A.; Ortiz-Amezcua, P.; Román, R.; Bedoya-Velásquez, A.E.; Bravo-Aranda, J.A.; Olmo Reyes, F.J.; Landulfo, E.; Alados-Arboledas, L. Analyzing the turbulent planetary boundary layer by remote sensing systems: The Doppler wind lidar, aerosol elastic lidar and microwave radiometer. Atmos. Chem. Phys. 2019, 19, 1263–1280. [Google Scholar] [CrossRef] [Green Version]
  34. Steinheuer, J.; Detring, C.; Beyrich, F.; Löhnert, U.; Friederichs, P.; Fiedler, S. A new scanning scheme and flexible retrieval for mean winds and gusts from Doppler lidar measurements. Atmos. Meas. Tech. 2022, 15, 3243–3260. [Google Scholar] [CrossRef]
  35. Liu, J.; Song, X.; Long, W.; Fu, Y.; Yun, L.; Zhang, M. Structure Analysis of the Sea Breeze Based on Doppler Lidar and Its Impact on Pollutants. Remote Sens. 2022, 14, 324. [Google Scholar] [CrossRef]
  36. Suomi, I.; Gryning, S.E.; O’Connor, E.J.; Vihma, T. Methodology for obtaining wind gusts using Doppler lidar. Q. J. R. Meteorol. Soc. 2017, 143, 2061–2072. [Google Scholar] [CrossRef] [Green Version]
  37. Clifton, A.; Clive, P.; Gottschall, J.; Schlipf, D.; Simley, E.; Simmons, L.; Stein, D.; Trabucchi, D.; Vasiljevic, N.; Würth, I. IEA Wind Task 32: Wind Lidar Identifying and Mitigating Barriers to the Adoption of Wind Lidar. Remote Sens. 2018, 10, 406. [Google Scholar] [CrossRef] [Green Version]
  38. Hill, C. Coherent Focused Lidars for Doppler Sensing of Aerosols and Wind. Remote Sens. 2018, 10, 466. [Google Scholar] [CrossRef] [Green Version]
  39. Yuan, J.; Wu, K.; Wei, T.; Wang, L.; Shu, Z.; Yang, Y.; Xia, H. Cloud Seeding Evidenced by Coherent Doppler Wind Lidar. Remote Sens. 2021, 13, 3815. [Google Scholar] [CrossRef]
  40. Liu, F.T.; Ting, K.M.; Zhou, Z.-H. Isolation Forest. In Proceedings of the 2008 Eighth IEEE International Conference on Data Mining, Pisa, Italy, 15–19 December 2008; pp. 413–422. [Google Scholar] [CrossRef]
  41. Zhou, X.; Zhang, C.; Li, Y.; Chen, Z.; Zhang, J.; Ding, X. Wind Gust Parameters in the Lower Troposphere Based on Doppler Lidar Data. J. Geophys. Res. Atmos. 2023, 128, e2022JD038156. [Google Scholar] [CrossRef]
  42. O’Connor, E.J.; Illingworth, A.J.; Brooks, I.M.; Westbrook, C.D.; Hogan, R.J.; Davies, F.; Brooks, B.J. A Method for Estimating the Turbulent Kinetic Energy Dissipation Rate from a Vertically Pointing Doppler Lidar, and Independent Evaluation from Balloon-Borne In Situ Measurements. J. Atmos. Ocean. Technol. 2010, 27, 1652–1664. [Google Scholar] [CrossRef] [Green Version]
  43. Suomi, I.; Gryning, S.E.; Floors, R.; Vihma, T.; Fortelius, C. On the vertical structure of wind gusts. Q. J. R. Meteorol. Soc. 2014, 141, 1658–1670. [Google Scholar] [CrossRef]
  44. Harris, A.R.; Kahl, J.D.W. Gust Factors: Meteorologically Stratified Climatology, Data Artifacts, and Utility in Forecasting Peak Gusts. J. Appl. Meteorol. Climatol. 2017, 56, 3151–3166. [Google Scholar] [CrossRef]
  45. Miller, S.T.K.; Keim, B.D.; Talbot, R.W.; Mao, H. Sea breeze: Structure, forecasting, and impacts. Rev. Geophys. 2003, 41. [Google Scholar] [CrossRef] [Green Version]
  46. Zhang, L.; Xin, J.; Yin, Y.; Wang, Z.; Wang, D.; Ma, Y.; Jia, D.; Jiang, Y.; Wu, L.; Pan, X. Adaptability evaluation of boundary layer schemes for simulation of sea and land breeze circulation in the west coast of the Yellow Sea. Atmos. Res. 2022, 278, 106354. [Google Scholar] [CrossRef]
  47. Yus-Díez, J.; Udina, M.; Soler, M.R.; Lothon, M.; Nilsson, E.; Bech, J.; Sun, J. Nocturnal boundary layer turbulence regimes analysis during the BLLAST campaign. Atmos. Chem. Phys. 2019, 19, 9495–9514. [Google Scholar] [CrossRef] [Green Version]
  48. Zeng, Q.; Cheng, X.; Hu, F.; Peng, Z. Gustiness and coherent structure of strong winds and their role in dust emission and entrainment. Adv. Atmos. Sci. 2009, 27, 1–13. [Google Scholar] [CrossRef]
  49. Sun, J.; Mahrt, L.; Banta, R.M.; Pichugina, Y.L. Turbulence Regimes and Turbulence Intermittency in the Stable Boundary Layer during CASES-99. J. Atmos. Sci. 2012, 69, 338–351. [Google Scholar] [CrossRef] [Green Version]
  50. Sun, J.; Lenschow, D.H.; LeMone, M.A.; Mahrt, L. The Role of Large-Coherent-Eddy Transport in the Atmospheric Surface Layer Based on CASES-99 Observations. Bound. Layer Meteorol. 2016, 160, 83–111. [Google Scholar] [CrossRef]
  51. Lv, Y.; Guo, J.; Li, J.; Cao, L.; Chen, T.; Wang, D.; Chen, D.; Han, Y.; Guo, X.; Xu, H.; et al. Spatiotemporal characteristics of atmospheric turbulence over China estimated using operational high-resolution soundings. Environ. Res. Lett. 2021, 16, 054050. [Google Scholar] [CrossRef]
  52. Viana, S.; Terradellas, E.; Yagüe, C. Analysis of Gravity Waves Generated at the Top of a Drainage Flow. J. Atmos. Sci. 2010, 67, 3949–3966. [Google Scholar] [CrossRef] [Green Version]
  53. Udina, M.; Soler, M.R.; Viana, S.; Yagüe, C. Model simulation of gravity waves triggered by a density current. Q. J. R. Meteorol. Soc. 2013, 139, 701–714. [Google Scholar] [CrossRef]
  54. Soler, M.R.; Udina, M.; Ferreres, E. Observational and Numerical Simulation Study of a Sequence of Eight Atmospheric Density Currents in Northern Spain. Bound. Layer Meteorol. 2014, 153, 195–216. [Google Scholar] [CrossRef] [Green Version]
  55. Davis, F.K.; Newstein, H. The Variation of Gust Factors with Mean Wind Speed and with Height. J. Appl. Meteorol. 1968, 7, 372–378. [Google Scholar] [CrossRef]
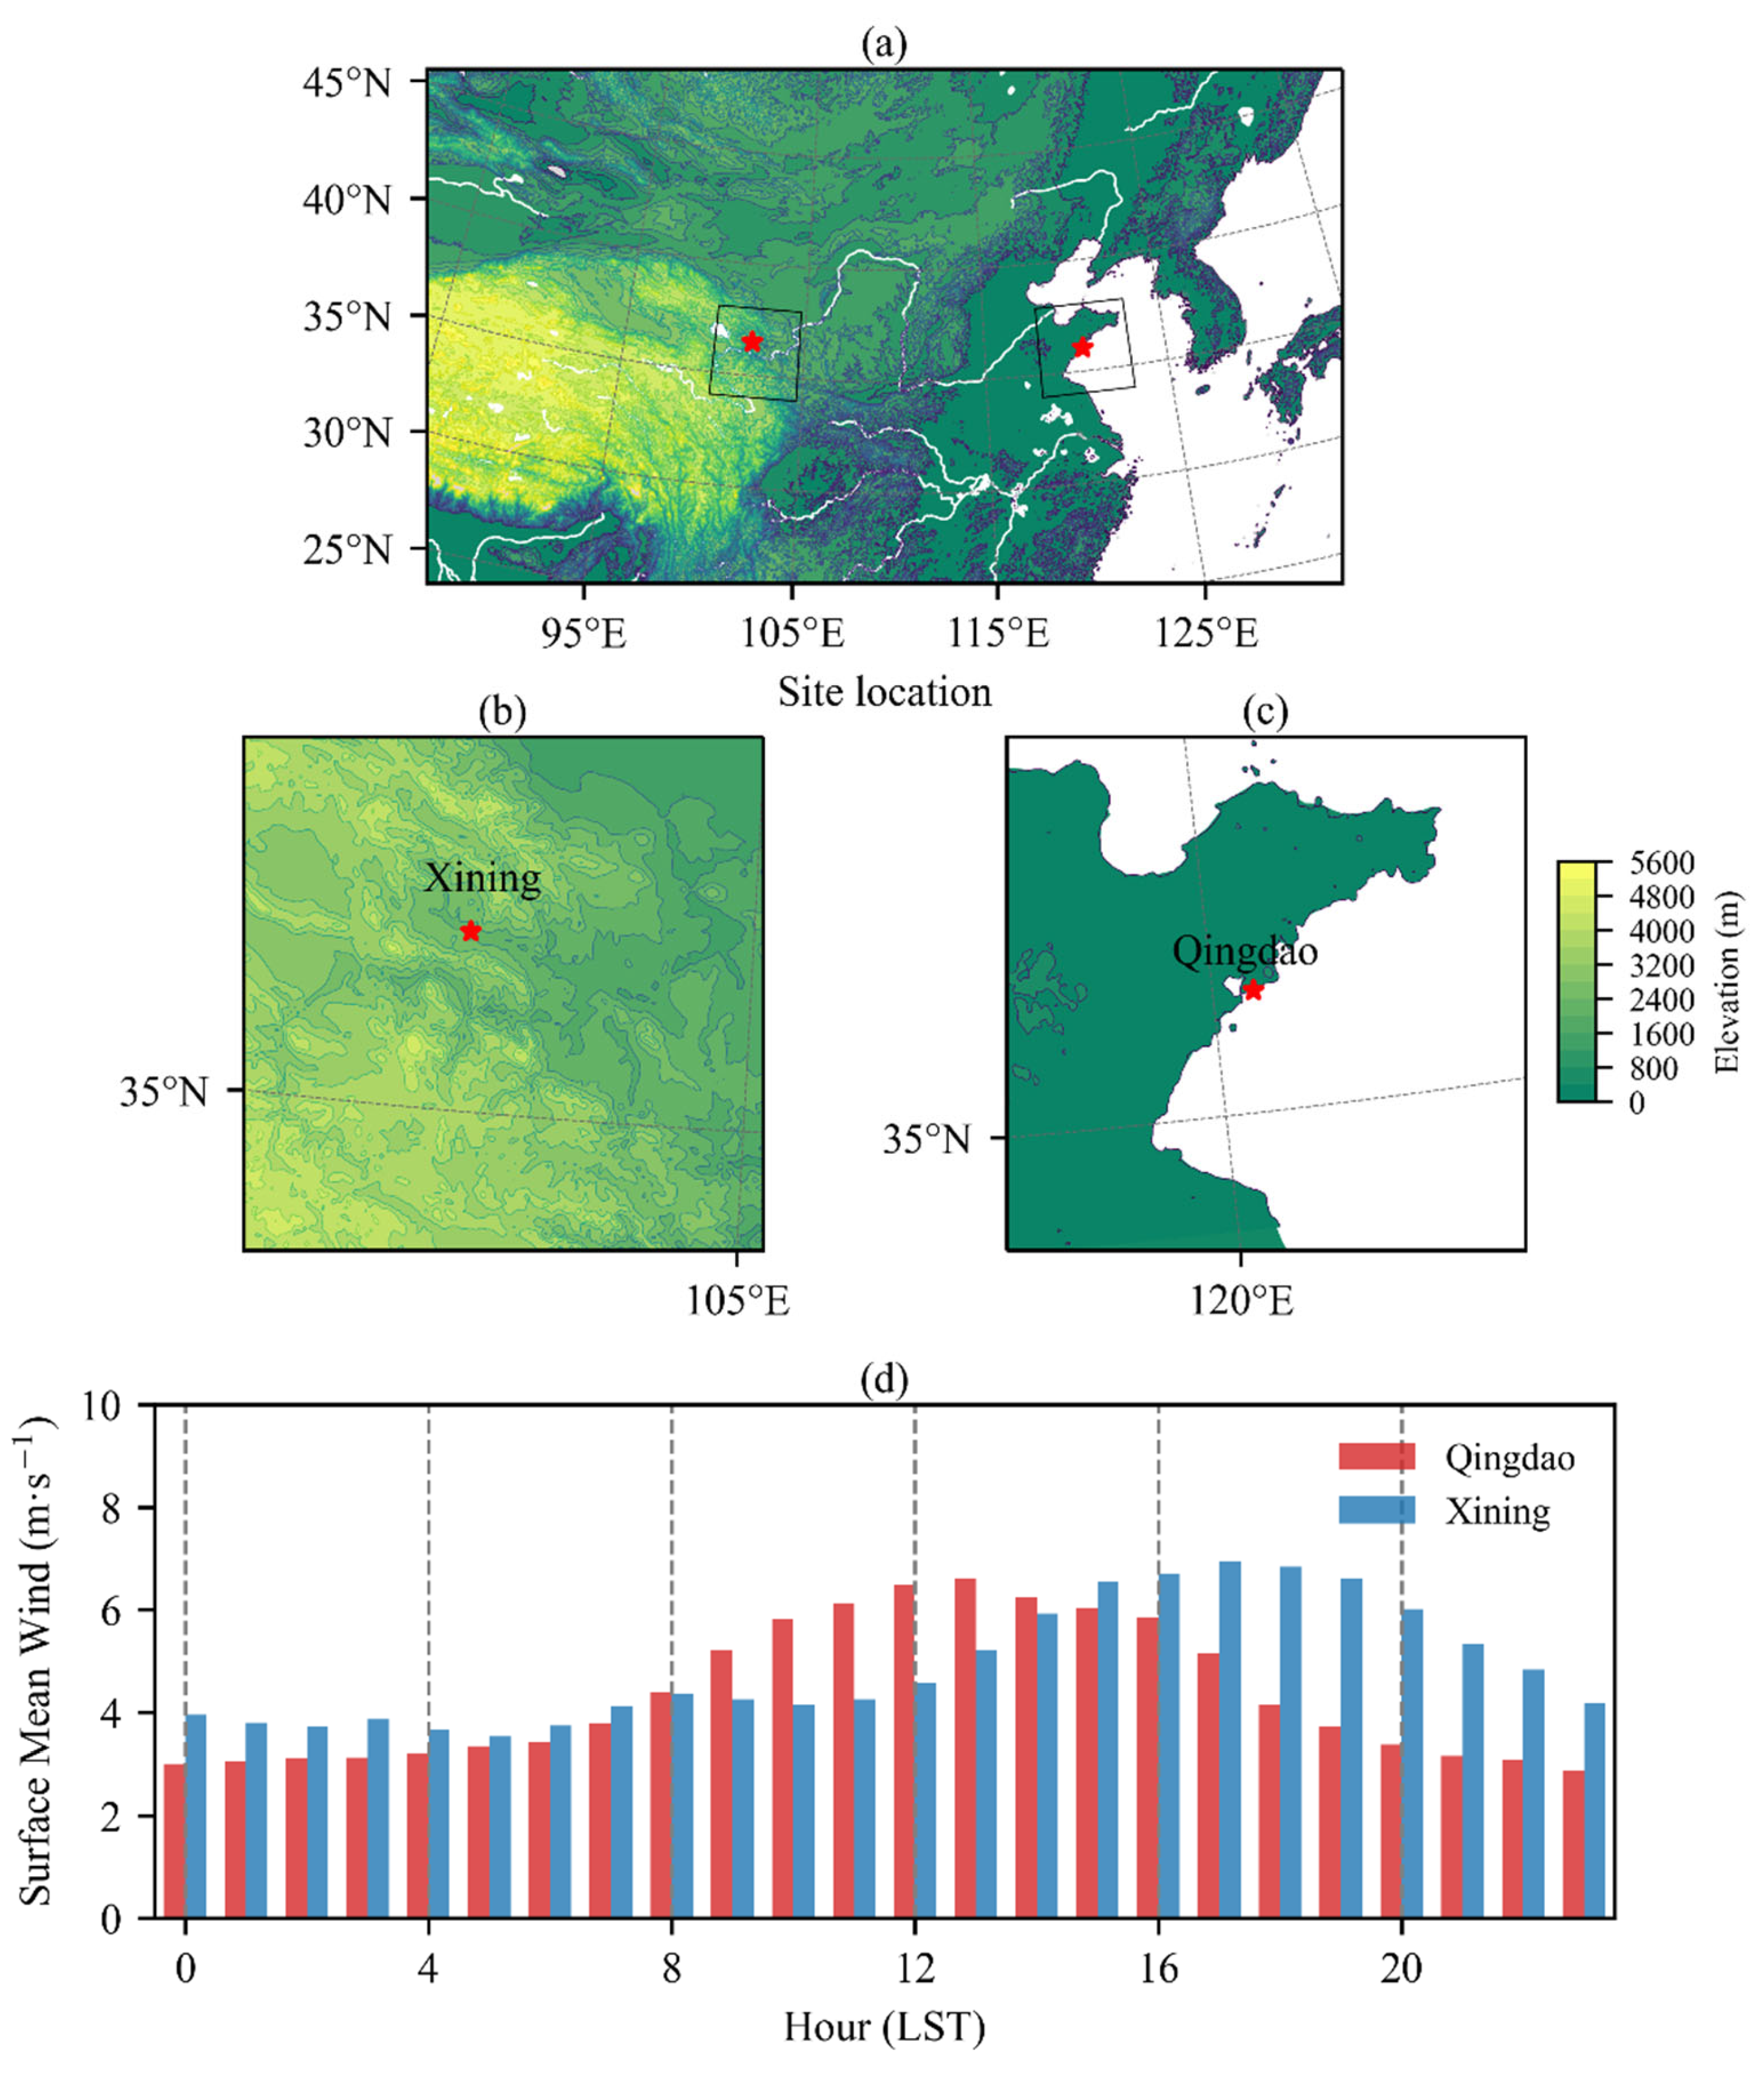
Figure 1. (ac) Locations of the Xining site in the eastern Tibetan Plateau and the coastal site in Qingdao (background color represents elevation), where Doppler lidar was deployed on open ground. (d) Diurnal variation in the mean surface wind speed at the two sites during the study period, with the horizontal axis showing the local standard time (LST).
Remotesensing 15 03655 g001
Figure 2. (a) Data availability at different heights during the study period, with red and blue colors representing the Qingdao and Xining sites, respectively. Partial data quality control results (at 250 m) for (b) Qingdao and (c) Xining based on the isolated forest algorithm, with white dots indicating valid data, black dots indicating rejected data and yellow ranges indicating the distribution of the valid area (horizontal axis shows the u-component of wind and vertical axis shows the v-component of wind).
Remotesensing 15 03655 g002
Figure 3. Comparison of wind and gust parameters at the Qingdao and Xining sites during the study period. The figure shows the variation in (a) mean wind speed V T , (b) peak gust V t , T max , (c) gust amplitude V t , T a and (d) gust factor G T with increasing height. The red line represents Qingdao, and the blue line represents Xining.
Remotesensing 15 03655 g003
Figure 4. Diurnal variation in gust parameters and turbulence intensity at Qingdao and Xining sites at two heights. The figure shows the hourly averages of (a) peak gust V t , T max , (b) gust amplitude V t , T a , (c) gust factor G T and (d) turbulence intensity I T at 100 m and 1000 ms. The red line represents Qingdao, and the blue line represents Xining. The solid line indicates 1000 m and the dashed line indicates 100 m.
Remotesensing 15 03655 g004
Figure 5. Correlations between gust parameters (peak gust V t , T max , gust amplitude V t , T a and gust factor G T ) and (ac) mean wind speed V T or (df) turbulence intensity I T for Qingdao (blue) and Xining (red). R and P are the correlation coefficient and the extreme probability value, respectively.
Remotesensing 15 03655 g005
Figure 6. Relationship between mean wind speed ( V T ) and peak gust ( V t , T max ) under different turbulence intensity ( I T ) conditions. The vertical axis shows the peak gust and the horizontal axis shows the mean wind speed. The red points represent strong turbulence conditions and the blue points represent weak turbulence conditions.
Remotesensing 15 03655 g006
Figure 7. Average wind at different heights in Qingdao. (af) Wind speeds at 100 m, 300 m, 500 m, 1000 m, 2000 m and 3000 m, respectively. The circles show the 5% frequency increment wind speed of lidar, with wind speed divided into seven grades. Topographic elevations along (g) 120.43°E and (h) 36.11°N, respectively.
Remotesensing 15 03655 g007
Figure 8. Average wind at different heights in Xining. (af) Wind speeds at 100 m, 300 m, 500 m, 1000 m, 2000 m and 3000 m, respectively. The circles show the 5% frequency increment wind speed of lidar, with wind speed divided into seven grades. Topographic elevations along (g) 102.01°E and (h) 36.50°N, respectively.
Remotesensing 15 03655 g008
Figure 9. Turbulence intensity I T at different heights and times for (a) Qingdao and (b) Xining. The horizontal axis is the local standard time (LST), and the vertical axis is the height. The background color shows the turbulence intensity.
Remotesensing 15 03655 g009
Figure 10. Bulk shear under different turbulence intensities in (a) Qingdao and (b) Xining for three heights: 100 m (red), 1000 m (blue) and 2000 m (green). (c) Bulk shear as a function of height for Qingdao (red) and Xining (blue).
Remotesensing 15 03655 g010
Disclaimer/Publisher’s Note: The statements, opinions and data contained in all publications are solely those of the individual author(s) and contributor(s) and not of MDPI and/or the editor(s). MDPI and/or the editor(s) disclaim responsibility for any injury to people or property resulting from any ideas, methods, instructions or products referred to in the content.