Abstract
Aiming at the problem of mutual interference between millimeter-wave frequency-modulation continuous-wave (FMCW) radars, an interference mitigation method based on outlier detection and variational mode decomposition (VMD) is proposed in this paper. Firstly, by differential processing of the raw millimeter-wave FMCW radar data, combined with threshold detection, the interfered sample area is located. Adaptive amplitude limiting is applied to the interfered samples to achieve initial suppression of the interference. Then, based on the VMD algorithm, the processed data are adaptively decomposed to obtain multiple intrinsic mode functions (IMFs). The Pearson correlation coefficient between each IMF and the signal before decomposition is calculated, and the IMF with the maximum Pearson correlation coefficient is extracted as the signal component to achieve the separation of the target signal from the interference and noise. The proposed method was validated based on simulation and experimental data. The results show that the proposed method achieves the best performance in terms of signal-to-interference-plus-noise ratio (SINR), mean square error (MSE), and kurtosis in frequency (KF) compared with empirical mode decomposition (EMD), ensemble empirical mode decomposition (EEMD), and complete ensemble empirical mode decomposition (CEEMD). Further comparison was made with two typical methods, and the Range–Doppler (RD) map and SINR results showed that the proposed method exhibited certain performance advantages.
1. Introduction
The development of millimeter-wave semiconductor technology in recent years has led to the increasing importance of millimeter-wave radar as a new type of sensor. Millimeter-wave radar, with a wavelength between centimeter wave and light wave, offers all-weather capabilities, high accuracy, and good stability, making it superior to other types of sensors [1]. As a result, millimeter-wave radar has found wide application in fields such as autonomous driving [2], Simultaneous Localization and Mapping (SLAM) [3], remote sensing [4], physiological feature monitoring [5], and structural health monitoring [6], etc. However, the growing number of millimeter-wave radars has led to a higher probability of mutual interference, which can seriously degrade detection performance and negatively impact the normal operating of millimeter-wave radars [7,8]. Therefore, mutual interference between millimeter-wave radars has become an issue of increasing concern.
Some research results have been achieved in the direction of interference mitigation for millimeter-wave FMCW radar. Frequency diversity among different radars can effectively avoid mutual interference, and the probability of mutual interference can be reduced by suitable frequency band division. However, this will occupy a large amount of spectrum resources [9]. Digital beam-forming technology can realize the formation of a zero point in the incoming direction of interference so as to avoid the entry of interference. But it needs a more complex antenna array structure [10]. Coding the parameters of the transmitted signal can avoid interference between different sources, but it requires additional coding and decoding processes [11]. In the polarization domain, different polarization methods can be used to reduce the impact of interference by mismatching the signal with the interference [12]. However, the above techniques require additional hardware resources with higher algorithm complexity, which often brings higher costs.
Furthermore, by designing nonlinear and orthogonal noise emission waveforms [13,14], the probability of interference can be reduced, but the performance requirements for signal generation modules are high. Methods based on sparse signal recovery are also widely used [15,16,17,18]. By defining the interference suppression problem as a signal separation problem, selecting an appropriate transformation domain for the sparse representation of the signal for interference suppression, and utilizing the sparsity of the target signal in the high-Q-factor wavelet transform and the better representation of the interference signal in the low-Q-factor wavelet transform, signal separation is achieved through an iterative solution [15]. The technology based on low-pass filters to detect the envelope of interference and alleviate the problem of interference is transformed into using L1-norm-regularized least squares to recover the target echo [17]. Furthermore, the two-stage L1 optimization method was adopted to optimize the model through an iterative soft-threshold algorithm, balancing the suppression of interference and the maintenance of target echo to achieve a good interference suppression performance [18].
In the field of signal processing, the separation of signals from interference by means of filtering is an important research direction. Classical filtering methods, including adaptive filtering [19], Kalman filtering [20], wavelet transform filtering [21], etc., are widely used in various fields [22,23,24]. Adaptive filtering achieves optimal filtering results by observing the statistical characteristics of the input signal and adaptively adjusting the filter parameters, but it requires prior knowledge about the statistical characteristics of the input signal [19]. The Kalman filter has time-varying parameters and is suitable for processing non-stationary signals, but it requires prior knowledge of the signal and noise to achieve the desired results [20]. Wavelet transform filtering enables multiresolution analysis of the signal by constructing a wavelet filter bank, but the processing effect largely depends on the suitability of the choice of basis function [21].
However, millimeter-wave FMCW radar signals often have nonlinear and non-stationary characteristics in practice, and it is often difficult to achieve ideal results with the above methods. In the direction of nonlinear and non-stationary signal analysis, a series of new signal processing algorithms based on the idea of mode decomposition have emerged in recent years, such as EMD [25], EEMD [26], CEEMD [27], VMD [28], etc. These algorithms do not require sub-band decomposition according to a fixed frequency band or pre-selection of a suitable basis function like wavelet transform but perform adaptive decomposition of the signal according to the signal’s characteristics. Among them, the EMD algorithm decomposes the signal through multiple iterations by detecting the extreme value points of the signal and interpolating them, but it is prone to the problem of modal aliasing [25]. The EEMD algorithm alleviates the problem of modal aliasing of the EMD algorithm by adding white noise to the original signal multiple times for pre-whitening, but the algorithm has high computational complexity [26]. Compared with the EEMD algorithm, the CEEMD algorithm adds complementary noise signals, which greatly reduces the number of additions of white noise and the computation time [27]. The VMD algorithm performs adaptive decomposition of the signal by constructing a Wiener filter bank for extracting single-component components, which has sufficient theoretical support [28]. At present, the VMD algorithm has been widely used in various applications such as ground-penetrating radar [29], fault detection [30], ECG signal processing [31], and electromagnetic signal denoising [32], showing great potential in processing non-stationary signals.
In this paper, we propose an interference mitigation method based on outlier detection and VMD. Interfered samples of the millimeter-wave FMCW radar signal are first detected, and the amplitude is adaptively limited. Then, an adaptive filter bank is constructed based on the VMD algorithm, which adaptively decomposes the processed signal. Next, the IMF with the maximum Pearson correlation coefficient is extracted as the target echo component to achieve separation of the target echo from the interference and noise. The method was validated by simulations and real millimeter-wave data. The results show that the proposed method achieves the best performance in a number of metrics compared with several major methods, verifying that the proposed method has better interference mitigation performance.
2. Basic Principles
2.1. Working Principle
The basic working process of millimeter-wave FMCW radar can be briefly described as follows: the modulation signal controls the voltage-controlled oscillator (VCO) to generate the RF signal, which is radiated out through the transmitting antenna on one side and fed into the local mixer on the other. The echo signal received by the receiving antenna is passed through a low-noise amplifier (LNA) and then mixed with the local signal in the mixer. After passing through a low-pass filter (LPF), it is sampled by the analog-to-digital converter (ADC), and the required target information is extracted by a signal processing algorithm. The main working process of the millimeter-wave radar is shown in Figure 1.
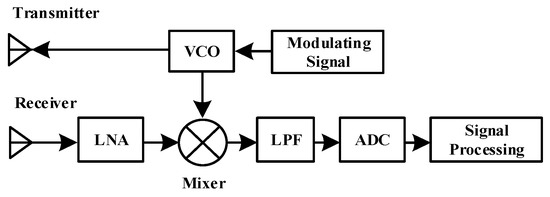
Figure 1.
Working principle of millimeter-wave radar.
The transmitted signal of the millimeter-wave radar can be expressed as
where is the amplitude of the transmitted signal, is the initial frequency, is the modulation period, is the FM slope, and is the number of periods. The target echo signal can be expressed as
where is the path time delay corresponding to the target distance, and is the target echo signal amplitude. After the dechirp processing, the beat frequency signal in a single modulation period can be expressed as
can be regarded as a constant in a single period. After fast Fourier transform (FFT) processing of the beat frequency signal in a single period, the main characteristics of a single target signal appear as a tone signal [33].
2.2. Mutual Interference
A typical interference signal can be expressed as
where is the initial frequency of the interference signal, and is the period of the interference signal. After the dechirp processing, the beat frequency signal can be expressed as
As shown in Figure 2, after low-pass filtering, the beat frequency of the interference signal that can enter the signal processing system should be
where is the cutoff frequency of the LPF. The target echo signal is represented as a straight line in the time–frequency domain, while the interference signal is represented as a broadband frequency modulation signal.
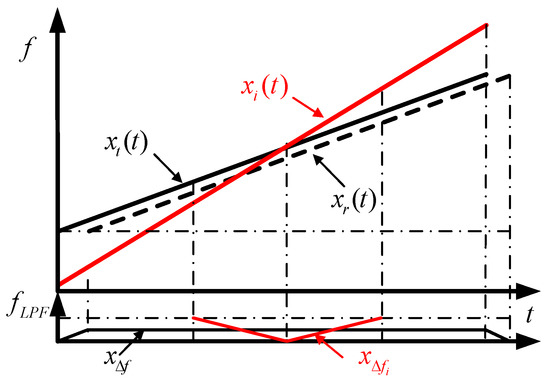
Figure 2.
Mutual interference between millimeter-wave radars.
As shown in Figure 3, when the interferer radar signal enters the signal processing bandwidth of the victim radar, the beat frequency signal can be regarded as a segment of the broadband signal [34,35]. According to the radar equation, the target echo signal power and the interference signal power can be obtained from Equations (7) and (8) as follows:
where is the transmission power of the victim radar, is the antenna gain of the victim radar, is the effective aperture of the victim radar antenna, is the target reflection coefficient, and is the distance from the target. Meanwhile, is the transmission power of the interferer radar, is the antenna gain of the interferer radar, is the effective aperture of the interferer radar antenna, and is the distance from the victim radar.

Figure 3.
Echo signal with interference. (a) Results in time domain; (b) results in frequency domain.
As can be seen from the above equation, this form of interference has one-way propagation in the line-of-sight propagation, whereas the target echo has a two-way travel range [15]. Therefore, the power of the interference is generally much higher than the target signal, and its entry will significantly increase the noise floor and reduce the detection capability of the millimeter-wave radar for weak targets.
2.3. Variational Modal Decomposition
VMD is an adaptive signal decomposition method that can decompose a multicomponent signal into multiple IMFs. VMD turns the signal decomposition problem into a constrained optimization problem, and the optimal solution is the decomposed single-component IMF. VMD can be written as an optimization problem with constraints as follows:
where is the number of IMFs, is an index of an IMF, denotes the impulse function, is the decomposed single-component signal, is the center frequency of each single-component signal, is a squared L2 norm, and is the original signal before decomposition.
Equation (9) can be converted from a constrained optimization problem to an unconstrained optimization problem by introducing a quadratic penalty function and a Lagrange multiplier term as follows:
where is the equilibrium parameter of the decomposition completeness, and is the Lagrange multiplier. The solution of Equation (10) is the saddle point of the augmented Lagrangian and the formula is given as
By using the alternating-direction multiplier algorithm (ADMM), the original problem is equivalently decomposed into the sub-problem of alternately finding and as follows:
where , , and are the Fourier transforms of , , and . The convergence condition of the cyclic iteration takes the ratio of the difference between the IMF before and after the update of each IMF and the IMF before the update as a factor until the stopping condition of the iteration is satisfied.
where is the convergence tolerance level. In order to present the entire calculation process more clearly, the pseudocode of VMD is shown in Algorithm 1.
| Algorithm 1: The Main Process of VMD |
| 1: Initialize 2: Update 3: Update : 4: Update : 5: Dual ascent: 6: Until convergence: . |
A more detailed description of the variational mode decomposition algorithm can be found in the literature [28]. By VMD, the original signal can be decomposed into multiple IMFs, thus achieving the separation of different signals.
3. Interference Mitigation Method
3.1. Outlier Detection and Amplitude Limiting
The division of VMD modes depends on the dominant components in the frequency domain. When interference energy is strong, the spurious frequency components introduced by the interference become dominant components, and a larger number of decomposition modes are needed to obtain the appropriate single-frequency target signal component, which increases computational effort significantly. Therefore, we decrease the number of modes by detecting and limiting the interfered samples in the time domain. The original data are first subjected to first-order differential interference detection, and the new differential sequence can be obtained from
where is the original data, and is the differential data. The detection threshold is the average of the previous segment of data, as given by Equation (17):
where is the original data sample. If the first-order differential data are larger than the detection threshold , the data sample is marked as an interfered sample. The samples marked as interfered segment data will be limited, and the amplitude is determined by Equation (18):
where is the maximum interfered sample, and is the sample after the limiting process. The signal after preliminary suppression of interference can be obtained from
After the outlier detection and limiting process, the signal will be further processed by VMD.
3.2. Pearson Correlation Coefficient
According to the previous analysis, when interference occurs, only the signal samples in the part near the intersection of the time–frequency trajectory of the interference signal and target signal are actually affected, and they exhibit the impulse response of a small number of samples in the time domain. The remaining samples still maintain the main characteristics of the target signal. In statistics, the Pearson correlation coefficient of two signals can be used to measure their correlation, and the larger its value, the higher the correlation of the two signals. The Pearson correlation coefficient is given by Equation (20):
where , and , are the mean and variance of X and Y. In this paper, we use the Pearson correlation coefficient as an indicator to locate the position of the signal in the reconstructed IMF after processing by VMD. The IMF with the largest Pearson correlation coefficient is selected as the signal component.
3.3. The Main Process of the Proposed Method
The main processing steps of the method proposed in this paper are as follows:
- First, calculate the mean value of the input raw data and perform first-order differential processing;
- Perform outlier detection on the differenced data and mark the interfered samples;
- Limit the original data with an outlier marker and obtain the signal after amplitude repair;
- Set initial parameters of VMD and obtain multiple IMFs after VMD processing;
- Calculate the Pearson correlation coefficient of each IMF with the signal after amplitude repair;
- Select the IMF with the maximum Pearson correlation coefficient as the reconstructed signal component.
The main flow of the proposed method is shown in Figure 4.
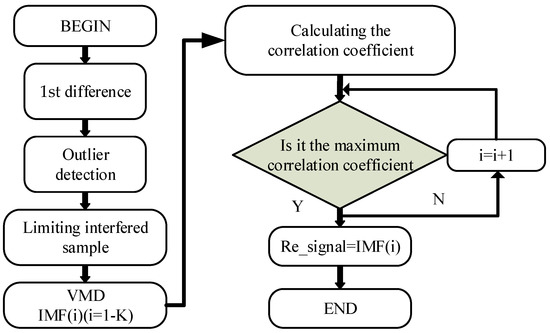
Figure 4.
Main flow of the method proposed in this paper.
4. Simulation and Experimental Results
4.1. Simulation Experiment Results
In this section, we evaluate the performance of the interference mitigation method proposed in this paper through numerical simulation experiments. The simulation environment was an AMD-5800X CPU with 16 Gb DDR4 RAM and MATLAB2022b. The main simulation parameters are shown in Table 1. The carrier frequency of both the victim radar and the interference radar was 77 GHz, and the chirp duration was 50 us. The bandwidth of the victim radar was 400 MHz, and the bandwidth of the interference radar was 500 MHz. The ADC sampling rate was 20 MHz, and the length of data processing was 1000 sample points.

Table 1.
Simulation parameters.
The target distance in the simulation was set to 9 m, and the simulation results are shown in Figure 5. Consistent with the previous analysis, when there is no interference, the target echo signal is relatively regular and there are no obvious abnormal peaks. When interference occurs, the interfered signal exhibits abnormal pulses in the time domain that are significantly higher than the signal energy level, which has adverse effects on the normal target detection process.

Figure 5.
Time-domain waveform of the simulation data. (a) Without interference; (b) with interference.
The target echo signal that was interfered was further detected by time-domain differential interference and processed by outlier limitation. The time-domain waveform of the interfered signal with amplitude repaired is shown in Figure 6.
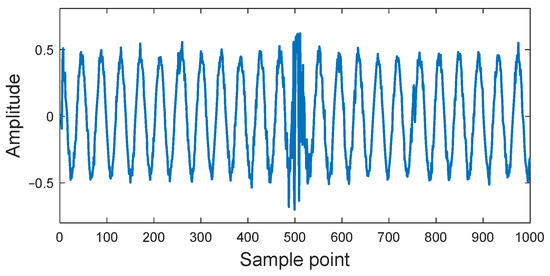
Figure 6.
Results of the processing of outlier limiting.
The initial number of decomposed modes was set to seven, the penalty factor was set to 1000, and VMD was used to perform adaptive decomposition of the modified signal. As shown in Figure 7, after VMD processing, the original signal was adaptively separated into different components, resulting in a series of frequency-band-separated IMFs, which could be extracted for further analysis as required.
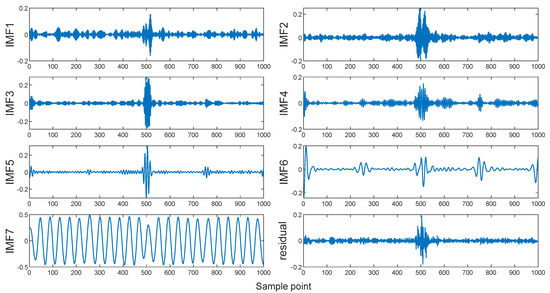
Figure 7.
The IMFs of simulation data decomposed by VMD.
After obtaining the decomposition results, we further calculated the Pearson correlation coefficients of each IMF with the unaffected signal, and the results are shown in Table 2. The Pearson correlation coefficient of IMF7 is 0.9863, which is the maximum among all IMFs. Therefore, we selected IMF7 as the signal component.

Table 2.
Pearson correlation coefficient for IMFs decomposed by VMD.
As shown in Figure 8, the waveform of IMF7 is quite smooth, and the energy is very concentrated, with the main feature of a single-tone signal in the frequency domain. After processing by the method proposed in this paper, not only was the separation of interference and signal achieved but also a good noise reduction effect. However, it should be noted that the limiting of the interfered samples will result in the loss of useful signal in the interfered region, and therefore it may cause a certain degree of performance loss when the number of interfered samples is large.

Figure 8.
The target signal decomposed by VMD. (a) Time-domain waveform; (b) frequency spectrum.
4.2. Comparison with Other Methods
In order to verify the performance of the proposed method, three typical algorithms, EMD [36], EEMD [37], and CEEMD [38], were selected for comparison. The processing results of the three algorithms are shown in Figure 9. From Figure 9a, it can be seen that EMD has the limitation of modal mixing when facing intermittent components, which leads to the incomplete separation of interference and signal; as shown in Figure 9b, EEMD improves this problem by superimposing white noise, and achieves some mitigation effect, but it is still not ideal; and from Figure 9c, we can see that CEEMD can achieve a smoother waveform, but the individual samples still show large distortions in the amplitude.
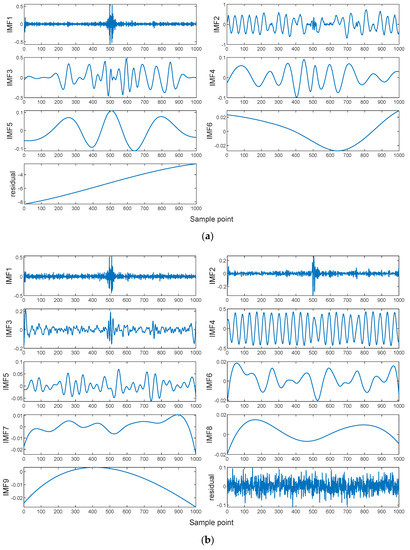
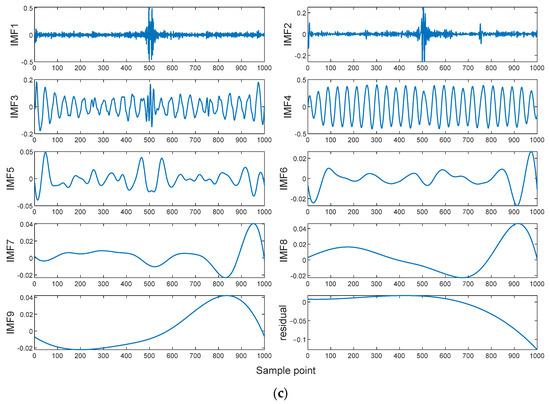
Figure 9.
The IMFs of simulation data decomposed by different methods: (a) EMD; (b) EEMD; (c) CEEMD.
To further compare the computational efficiency of the different decomposition methods, we calculated the runtime for the four methods, and the results are shown in Table 3.

Table 3.
Running time of different methods.
As shown in Table 3, EMD has the best computational efficiency, while EEMD requires the longest computation time. EEMD adds white noise to the signal multiple times to alleviate the problem of mode aliasing, so it has the maximum computational complexity. CEEMD greatly reduces the number of white noise additions by adding complementary noise pairs, so CEEMD requires much less computation time than EEMD, but is still significantly longer than VMD.
The Pearson correlation coefficients between the IMFs and the target signal were further calculated to determine the location of the signal components obtained by different decomposition methods. The calculation results are shown in Table 4.

Table 4.
Pearson correlation coefficient for IMFs decomposed by EMD, EEMD, and CEEMD.
As shown in Table 4, IMF2, IMF4, and IMF4 are the target signal components obtained by EMD, EEMD, and CEEMD, respectively. The corresponding IMFs were extracted separately and compared with the undisturbed signals. The comparison results are shown in Figure 10.
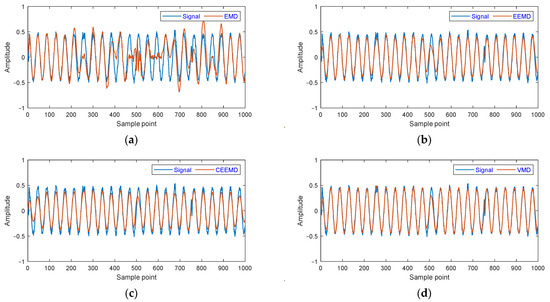
Figure 10.
Waveform of the target signal of the simulation data decomposed by different methods: (a) EMD; (b) EEMD; (c) CEEMD; (d) VMD.
As shown in Figure 10, the decomposition results of EMD show significant modal aliasing, and the signal reconstruction effect is poor. The target signals obtained through EEMD and CEEMD decomposition have basically eliminated modal aliasing and successfully extracted the main features of the target signal. The decomposition result of VMD achieved the best visual effect, which is highly similar to the real target signal.
To further quantify the performance of the four algorithms, three metrics, SINR, MSE, and KF, were selected for performance comparison. SINR refers to the ratio of the signal to the sum of interference and noise in the system and can be calculated from Equation (21):
where is the mixed signal containing interference and noise, and is the reconstructed target signal.
MSE is the deviation between the reconstructed value and the true value and can be obtained from Equation (22):
KF can be used to measure the concentration of frequency components in a signal, and it can be calculated from Equation (23). The larger the value of KF, the more concentrated the frequency components are.
where is the amplitude of each component of the reconstructed target signal in the frequency domain, is the average amplitude, and is the standard deviation.
A further 300 Monte Carlo experiments were carried out to calculate the three metrics for the target signal components obtained from the different decomposition methods, and the results obtained are shown in Table 5.

Table 5.
The interference mitigation performance of different methods for the simulation data.
As shown in Table 5, the target signal obtained after EMD processing had the worst performance in all three metrics. EMD is sensitive to intermittent signals and is prone to modal aliasing during the decomposition process, thus making it difficult to obtain correct signal decomposition results. VMD achieved the highest SINR value of 15.6063 dB, the highest KF value of 258.3158, and the lowest MSE value of 0.0028, indicating that VMD had the best interference mitigation performance. The decomposition results for EEMD and CEEMD were close, and both were significantly better than EMD, significantly improving the modal mixing in EMD. The above experimental results demonstrate the better interference suppression performance of the proposed method in this paper.
We further added two typical methods for comparison, the Brooker [39] and Xu [18] methods, and drew RD maps after processing with the different methods. The experimental results are shown in Figure 11.
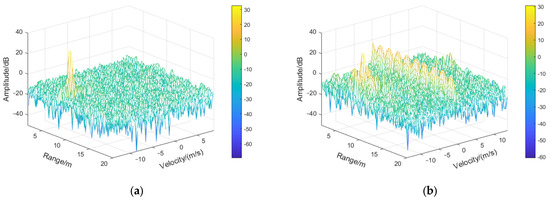
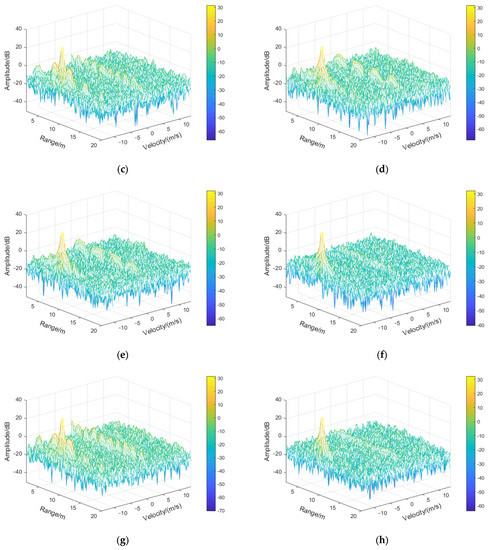
Figure 11.
Comparisons on the simulated data for range and velocity measurements. (a) Clear signal; (b) with interference; (c) EMD; (d) EEMD; (e) CEEMD; (f) VMD; (g) Brooker [39]; (h) Xu [18].
As shown in Figure 11, when interference occurs, if no interference suppression measures are taken, the target will be covered by the false components generated by the interference, which may cause serious accidents. After adopting different interference mitigation methods, the overall noise level significantly reduced. The zeroing-based [39] method results in a lower target peak due to the loss of signal energy. The EMD method has a higher noise level than other methods due to the problem of modal aliasing. The VMD and optimization-based [18] methods provide the best visual interference suppression effect, with clear and visible targets.
4.3. Actual Measurement Experiment and Analysis
To further verify the effectiveness of the interference mitigation method proposed in this paper, an experimental validation was carried out, and the experimental scenario is shown in Figure 12. The IWR1443 mm wave radar from TI was used as the victim radar, and the self-developed radar prototype was used as the interference radar. The target was a metal plate, which was 10 m away from the victim radar. Millimeter-wave radar parameters were set as shown in Table 6.
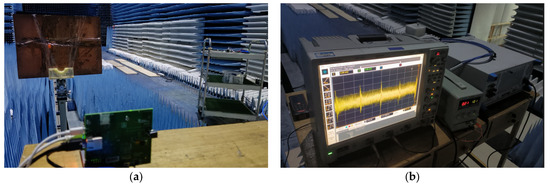
Figure 12.
Experimental scenarios. (a) Millimeter-wave radar and target; (b) monitoring devices.

Table 6.
Parameter setting for millimeter-wave radar.
As shown in Figure 13, the processing results of the measured data are consistent with those of the simulation data. The millimeter-wave radar echo target signals behave as smooth single-frequency signals, while interfered samples behave as anomalously high-amplitude pulses. Using the method proposed in this paper for processing, the target signal components obtained after decomposition by the different methods were extracted. The processing results of the different decomposition methods compared with the signal after outlier limiting processing are shown in Figure 14.

Figure 13.
The millimeter-wave radar signal. (a) With interference; (b) after the processing of outlier limiting.
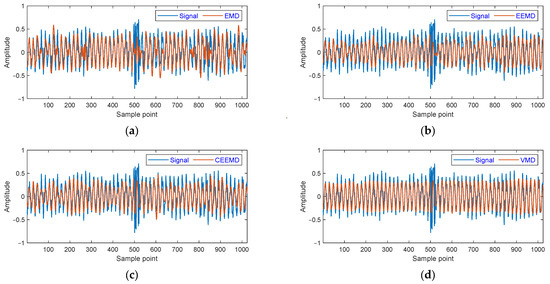
Figure 14.
Waveform of the target signal of the millimeter-wave radar data decomposed by different methods: (a) EMD; (b) EEMD; (c) CEEMD; (d) VMD.
As shown in Figure 14a, EMD still shows modal aliasing in the measured signal, so the decomposition result is not satisfactory. As shown in Figure 14b,c, EEMD and CEEMD effectively suppress modal aliasing, but both show a certain degree of amplitude distortion on several samples. As shown in Figure 14d, the target signal obtained by VMD did not exhibit significant modal aliasing and amplitude distortion, achieving the best decomposition results. We further calculated the mean values of the three indicators for the 200 sets of measured data processed by the different methods. The results of the calculations are shown in Table 7.

Table 7.
The interference mitigation performance of different methods for the millimeter-wave radar data.
As shown in Table 7, VMD still achieved the best performance in all three indicators on the measured millimeter-wave radar echo data, with an SINR of 6.5907 dB, MSE of only 0.0151, and KF of 275.2658, indicating the robustness of VMD to real data. EEMD and CEEMD also achieved good performance but still showed some amplitude distortion on several samples, resulting in worse performance in three indicators compared with VMD. EMD still had the worst performance, further validating its limitations in analyzing mixed signals with intermittent components. The above experimental results show that the proposed method can still achieve good interference suppression performance in the real measured data.
As shown in Figure 15, interference seriously affects the normal target detection results, and weak targets may not be detected under the influence of interference. Therefore, selecting appropriate interference suppression methods is crucial for ensuring the normal functioning of the automotive radar system. The EMD method still resulted in a high noise level. The EEMD and CEEMD methods effectively reduced the noise level, and the target was relatively clear. The zeroing-based [39] method resulted in high sidelobe and low target peaks. The VMD and optimization-based [18] methods still had the best interference suppression performance, further indicating that they have great application potential in real scenarios.
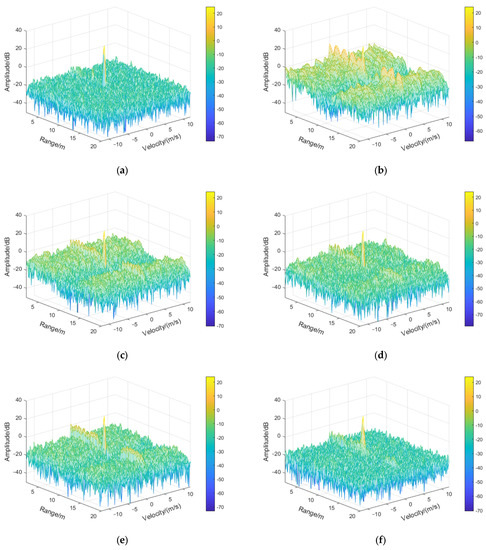
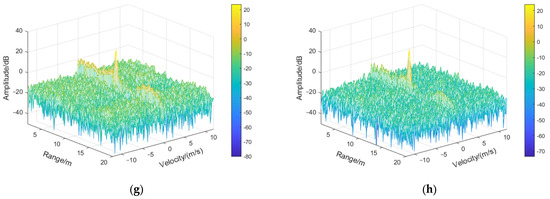
Figure 15.
Comparison of the measured data for range and velocity measurements. (a) Clear signal; (b) with interference; (c) EMD; (d) EEMD; (e) CEEMD; (f) VMD; (g) Brooker [39]; (h) Xu [18].
5. Discussion
5.1. Computational Complexity
The zeroing-based method only replaces the part detected as interference with zero, thus has the lowest computational complexity, but it can bring significantly high sidelobe issues. The computational complexity of the adaptive decomposition process based on EMD is also at a low level, but it is prone to the problem of modal aliasing. The methods based on EEMD and CEEMD assist in the signal decomposition process by adding noise, reducing the problem of modal aliasing but significantly increasing computational complexity. The methods based on VMD and optimization both involve iterative optimization processes, and excessively high penalty coefficients may not only bring better interference suppression performance but also increase computational complexity. Therefore, appropriate parameter selection will achieve the most satisfactory results.
5.2. Performance under Different Noise Levels
To verify the applicability of the proposed method to different environments, we tested the interference mitigation performance of the different methods by artificially increasing different levels of noise. The results obtained are shown in Table 8.

Table 8.
SINR results of different methods under different noise levels.
Under different noise levels, the SINRs of the EMD and zeroing-based methods are low due to their inherent drawbacks. The SINRs of the methods based on EEMD and CEEMD improved to some extent, but they are still lower than the methods based on VMD and optimization. Due to the adaptive narrowband filtering characteristics, VMD-based methods consistently had good performance, especially under strong noise conditions. Satisfactory results were also obtained with the optimization method, with the SINR slightly higher than for the VMD method at low noise levels.
6. Conclusions
In this paper, we propose an interference mitigation method for mutual interference between millimeter-wave FMCW radars based on outlier detection and VMD. Based on the narrowband characteristics of the target signal, we first performed interference detection and limiting, and then performed adaptive decomposition of the signal by VMD. The IMF with the maximum Pearson correlation coefficient was selected as the reconstructed signal, and the separation of the target signal from the interference was successfully achieved. The effectiveness of the proposed method in interference mitigation was verified by simulation and experiment. The proposed method was compared with EMD, EEMD, and CEEMD and achieved the best results in terms of SINR, MSE, and KF, indicating that the proposed method has better interference mitigation performance. A further comparison was made with methods based on zeroing and optimization. From the RD mapping and SINR results, it can be seen that the VMD- and optimization-based methods achieved relatively better performance. Especially under strong noise conditions, the method proposed in this paper has a certain improvement in interference mitigation performance.
It should be noted that the initial decomposition mode number and penalty factor of VMD require artificial settings, and fixed values may be difficult to ensure the best results in different scenarios. Future research will investigate data-based adaptive setting methods. Furthermore, only the signal components with the maximum Pearson correlation coefficients are extracted, and the interference signal components can also be extracted for interference detection and identification, which will provide a reliable basis for reasonable and effective interference avoidance.
Author Contributions
Conceptualization, W.Z. and X.H.; methodology, W.Z. and X.H.; software, W.Z.; validation, J.Y., L.D., J.W. and Q.Y.; formal analysis, W.Z. and J.Y.; investigation, W.Z.; resources, X.H.; data curation, X.H.; writing—original draft preparation, W.Z. and X.H.; writing—review and editing, W.Z. and X.H.; supervision, X.H.; project administration, X.H.; funding acquisition, X.H. All authors have read and agreed to the published version of the manuscript.
Funding
This project was funded by the Basic Strengthening Project of Military Science and Technology Commission, Grant Number 2019-JCJQ-ZD-324.
Data Availability Statement
The data are available from the corresponding author upon reasonable request.
Conflicts of Interest
The authors declare no conflict of interest.
References
- Aydogdu, C.; Keskin, M.F.; Carvajal, G.K.; Eriksson, O.; Hellsten, H.; Herbertsson, H.; Nilsson, E.; Rydstrom, M.; Vanas, K.; Wymeersch, H. Radar Interference Mitigation for Automated Driving: Exploring Proactive Strategies. IEEE Signal Process. Mag. 2020, 37, 72–84. [Google Scholar] [CrossRef]
- Sevimli, R.A.; Üçüncü, M.; Koç, A. Graph signal processing based object classification for automotive RADAR point clouds. Digit. Signal Process. 2023, in press. [CrossRef]
- He, J.; Yin, F.; So, H.C. A Framework for Millimeter-Wave Multi-User SLAM and Its Low-Cost Realization. Signal Process. 2023, 209, 109018. [Google Scholar] [CrossRef]
- Shi, G.; Huang, B.; Leung, A.K.; Ng, C.W.W.; Wu, Z.; Lin, H. Millimeter Slope Ratcheting from Multitemporal SAR Interferometry with a Correction of Coastal Tropospheric Delay: A Case Study in Hong Kong. Remote Sens. Environ. 2022, 280, 113148. [Google Scholar] [CrossRef]
- Wu, J.; Dahnoun, N. A Health Monitoring System with Posture Estimation and Heart Rate Detection Based on Millimeter-Wave Radar. Microprocess. Microsyst. 2022, 94, 104670. [Google Scholar] [CrossRef]
- Ma, Z.; Choi, J.; Yang, L.; Sohn, H. Structural Displacement Estimation Using Accelerometer and FMCW Millimeter Wave Radar. Mech. Syst. Signal Process. 2023, 182, 109582. [Google Scholar] [CrossRef]
- Hakobyan, G.; Yang, B. High-Performance Automotive Radar: A Review of Signal Processing Algorithms and Modulation Schemes. IEEE Signal Process. Mag. 2019, 36, 32–44. [Google Scholar] [CrossRef]
- Alland, S.; Stark, W.; Ali, M.; Hegde, M. Interference in Automotive Radar Systems: Characteristics, Mitigation Techniques, and Current and Future Research. IEEE Signal Process. Mag. 2019, 36, 45–59. [Google Scholar] [CrossRef]
- Bechter, J.; Sippel, C.; Waldschmidt, C. Bats-Inspired Frequency Hopping for Mitigation of Interference between Automotive Radars. In Proceedings of the 2016 IEEE MTT-S International Conference on Microwaves for Intelligent Mobility (ICMIM), San Diego, CA, USA, 19–20 May 2016; pp. 1–4. [Google Scholar]
- Bechter, J.; Eid, K.; Roos, F.; Waldschmidt, C. Digital Beamforming to Mitigate Automotive Radar Interference. In Proceedings of the 2016 IEEE MTT-S International Conference on Microwaves for Intelligent Mobility (ICMIM), San Diego, CA, USA, 19–20 May 2016; pp. 1–4. [Google Scholar]
- Schweizer, B.; Knill, C.; Werbunat, D.; Stephany, S.; Waldschmidt, C. Mutual Interference of Automotive OFDM Radars—Analysis and Countermeasures. IEEE J. Microw. 2021, 1, 950–961. [Google Scholar] [CrossRef]
- Sgammini, M.; Caizzone, S.; Hornbostel, A.; Meurer, M. Interference mitigation using a dual-polarized antenna array in a real environment. Navig. J. Inst. Navig. 2019, 66, 523–535. [Google Scholar] [CrossRef]
- Xu, Z.; Wang, Y.; Luo, J.; Che, M.; Wang, H.; Zhang, D. Potential of Reducing FMCW Radar Mutual-Interference Using Nonlinear FM Signals. In Proceedings of the 2021 CIE International Conference on Radar (Radar), Haikou, China, 15–19 December 2021; pp. 2852–2855. [Google Scholar]
- Xu, Z.; Shi, Q. Interference Mitigation for Automotive Radar Using Orthogonal Noise Waveforms. IEEE Geosci. Remote Sens. Lett. 2018, 15, 137–141. [Google Scholar] [CrossRef]
- Xu, Z.; Yuan, M. An Interference Mitigation Technique for Automotive Millimeter Wave Radars in the Tunable Q-Factor Wavelet Transform Domain. IEEE Trans. Microw. Theory Technol. 2021, 69, 5270–5283. [Google Scholar] [CrossRef]
- Uysal, F. Synchronous and Asynchronous Radar Interference Mitigation. IEEE Access 2019, 7, 5846–5852. [Google Scholar] [CrossRef]
- Xu, Z.; Xue, S.; Wang, Y. Incoherent Interference Detection and Mitigation for Millimeter-Wave FMCW Radars. Remote Sens. 2022, 14, 4817. [Google Scholar] [CrossRef]
- Xu, Z. Bi-Level L1 Optimization-Based Interference Reduction for Millimeter Wave Radars. IEEE trans. Intell. Transp. Syst. 2023, 24, 728–738. [Google Scholar] [CrossRef]
- Talebi, S.P.; Werner, S.; Mandic, D.P. Complex-Valued Nonlinear Adaptive Filters with Applications in α-Stable Environments. IEEE Signal Process. Lett. 2019, 26, 1315–1319. [Google Scholar] [CrossRef]
- Kang, C.H.; Kim, S.Y.; Park, C.G. Global Navigation Satellite System Interference Tracking and Mitigation Based on an Adaptive Fading Kalman Filter. IET Radar Sonar Navig. 2015, 9, 1030–1039. [Google Scholar] [CrossRef]
- Lee, S.; Lee, J.-Y.; Kim, S.-C. Mutual Interference Suppression Using Wavelet Denoising in Automotive FMCW Radar Systems. IEEE Trans. Intell. Transp. Syst. 2021, 22, 887–897. [Google Scholar] [CrossRef]
- Qiao, W.; Yang, Z.; Kang, Z.; Pan, Z. Short-Term Natural Gas Consumption Prediction Based on Volterra Adaptive Filter and Improved Whale Optimization Algorithm. Eng. Appl. Artif. Intell. 2020, 87, 103323. [Google Scholar] [CrossRef]
- Cui, L.; Wang, X.; Xu, Y.; Jiang, H.; Zhou, J. A Novel Switching Unscented Kalman Filter Method for Remaining Useful Life Prediction of Rolling Bearing. Measurement 2019, 135, 678–684. [Google Scholar] [CrossRef]
- Tuncer, T.; Dogan, S.; Pławiak, P.; Acharya, U.R. Automated Arrhythmia Detection Using Novel Hexadecimal Local Pattern and Multilevel Wavelet Transform with ECG Signals. Knowl. Based Syst. 2019, 186, 104923. [Google Scholar] [CrossRef]
- Huang, N.; Shen, Z.; Long, S.; Wu, M.; Shih, H.; Zheng, Q.; Yen, N.; Tung, C.; Liu, H. The empirical mode decomposition and the Hilbert spectrum for nonlinear and non-stationary time series analysis. Proc. Math. Phys. Eng. Sci. 1998, 454, 903–995. [Google Scholar] [CrossRef]
- Wu, Z.; Huang, N.E. Ensemble empirical mode decomposition: A noise-assisted data analysis method. Adv. Adapt. Data Anal. 2009, 1, 1–41. [Google Scholar] [CrossRef]
- Yeh, J.-R.; Shieh, J.-S.; Huang, N.E. Complementary ensemble empirical mode decomposition: A novel noise enhanced data analysis method. Adv. Adapt. Data Anal. 2010, 2, 135–156. [Google Scholar] [CrossRef]
- Dragomiretskiy, K.; Zosso, D. Variational Mode Decomposition. IEEE Trans. Signal Process. 2014, 62, 531–544. [Google Scholar] [CrossRef]
- Liu, S.; Chen, Y.; Luo, C.; Jiang, H.; Li, H.; Li, H.; Lu, Q. Particle Swarm Optimization-Based Variational Mode Decomposition for Ground Penetrating Radar Data Denoising. Remote Sens. 2022, 14, 2973. [Google Scholar] [CrossRef]
- Luo, J.; Wen, G.; Lei, Z.; Su, Y.; Chen, X. Weak Signal Enhancement for Rolling Bearing Fault Diagnosis Based on Adaptive Optimized VMD and SR under Strong Noise Background. Meas. Sci. Technol. 2023, 34, 064001. [Google Scholar] [CrossRef]
- Li, C.; Wu, Y.; Lin, H.; Li, J.; Zhang, F.; Yang, Y. ECG Denoising Method Based on an Improved VMD Algorithm. IEEE Sens. J. 2022, 22, 22725–22733. [Google Scholar] [CrossRef]
- Feng, G.; Wei, H.; Qi, T.; Pei, X.; Wang, H. A Transient Electromagnetic Signal Denoising Method Based on an Improved Variational Mode Decomposition Algorithm. Measurement 2021, 184, 109815. [Google Scholar] [CrossRef]
- Gaur, A.; Tseng, P.-H.; Feng, K.-T.; Srirangarajan, S. VAFER: Signal Decomposition Based Mutual Interference Suppression in FMCW Radars. arXiv 2022, arXiv:2212.13727. Available online: https://arxiv.53yu.com/abs/2212.13727v2 (accessed on 18 April 2023).
- Li, Y.; Feng, B.; Zhang, W. Mutual Interference Mitigation of Millimeter-Wave Radar Based on Variational Mode Decomposition and Signal Reconstruction. Remote Sens. 2023, 15, 557. [Google Scholar] [CrossRef]
- Rameez, M.; Dahl, M.; Pettersson, M.I. Autoregressive Model-Based Signal Reconstruction for Automotive Radar Interference Mitigation. IEEE Sens. J. 2021, 21, 6575–6586. [Google Scholar] [CrossRef]
- Özcan, A.H.; Ünsalan, C. LiDAR Data Filtering and DTM Generation Using Empirical Mode Decomposition. IEEE J.-STARS 2017, 10, 360–371. [Google Scholar]
- Hu, W.; Zhao, Z.; Wang, Y.; Zhang, H.; Lin, F. Noncontact Accurate Measurement of Cardiopulmonary Activity Using a Compact Quadrature Doppler Radar Sensor. IEEE. Trans. Biomed. Eng. 2014, 61, 725–735. [Google Scholar] [CrossRef] [PubMed]
- Li, J.; Liu, C.; Zeng, Z.; Chen, L. GPR Signal Denoising and Target Extraction with the CEEMD Method. IEEE Geosci. Remote Sens. Lett. 2015, 12, 1615–1619. [Google Scholar]
- Brooker, G.M. Mutual Interference of Millimeter-Wave Radar Systems. IEEE Trans. Electromagn. Compat. 2007, 49, 170–181. [Google Scholar] [CrossRef]
Disclaimer/Publisher’s Note: The statements, opinions and data contained in all publications are solely those of the individual author(s) and contributor(s) and not of MDPI and/or the editor(s). MDPI and/or the editor(s) disclaim responsibility for any injury to people or property resulting from any ideas, methods, instructions or products referred to in the content. |
© 2023 by the authors. Licensee MDPI, Basel, Switzerland. This article is an open access article distributed under the terms and conditions of the Creative Commons Attribution (CC BY) license (https://creativecommons.org/licenses/by/4.0/).