Evolution Patterns of Cooling Island Effect in Blue–Green Space under Different Shared Socioeconomic Pathways Scenarios
Abstract
1. Introduction
2. Data and Methodology
2.1. Study Area
2.2. Datasets
2.2.1. Urban Land Use Data
2.2.2. Climate Model Dataset
2.3. Data Processing
2.3.1. Climate Model Data Assessment
2.3.2. WRF Driving Field Reanalysis Data
3. Results
3.1. Spatial Changes in Blue and Green Space under Different SSP Scenarios
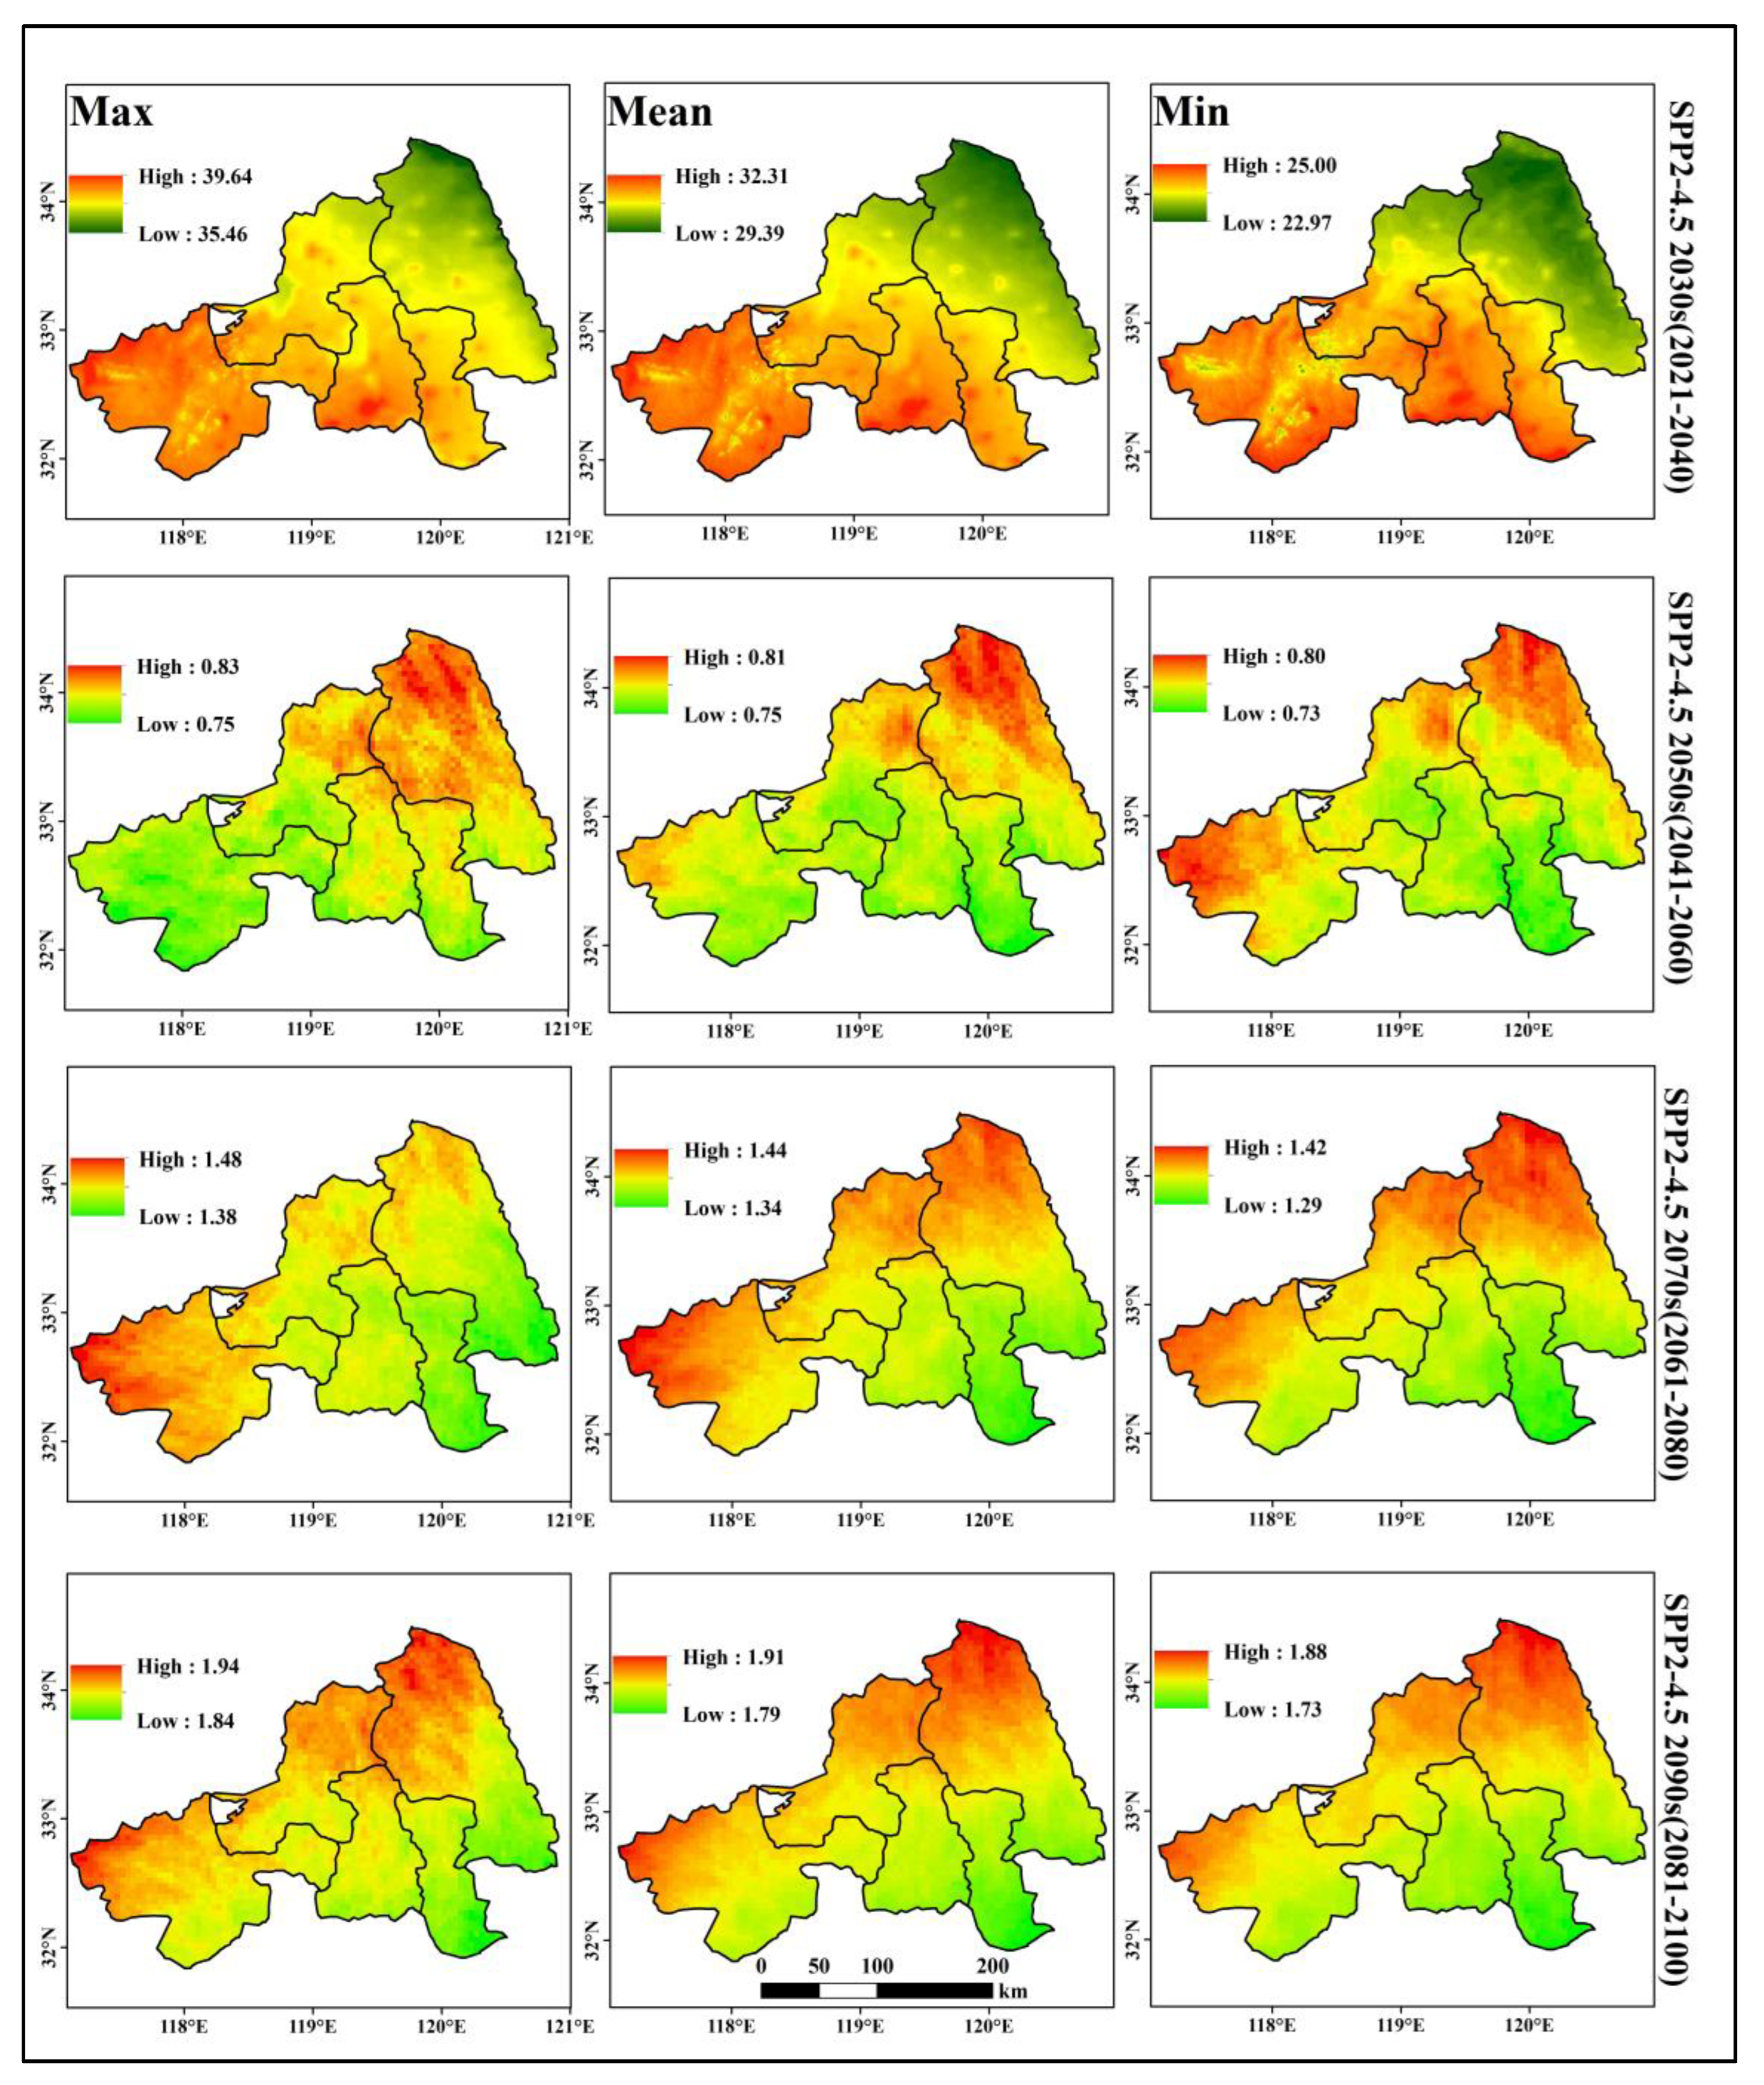
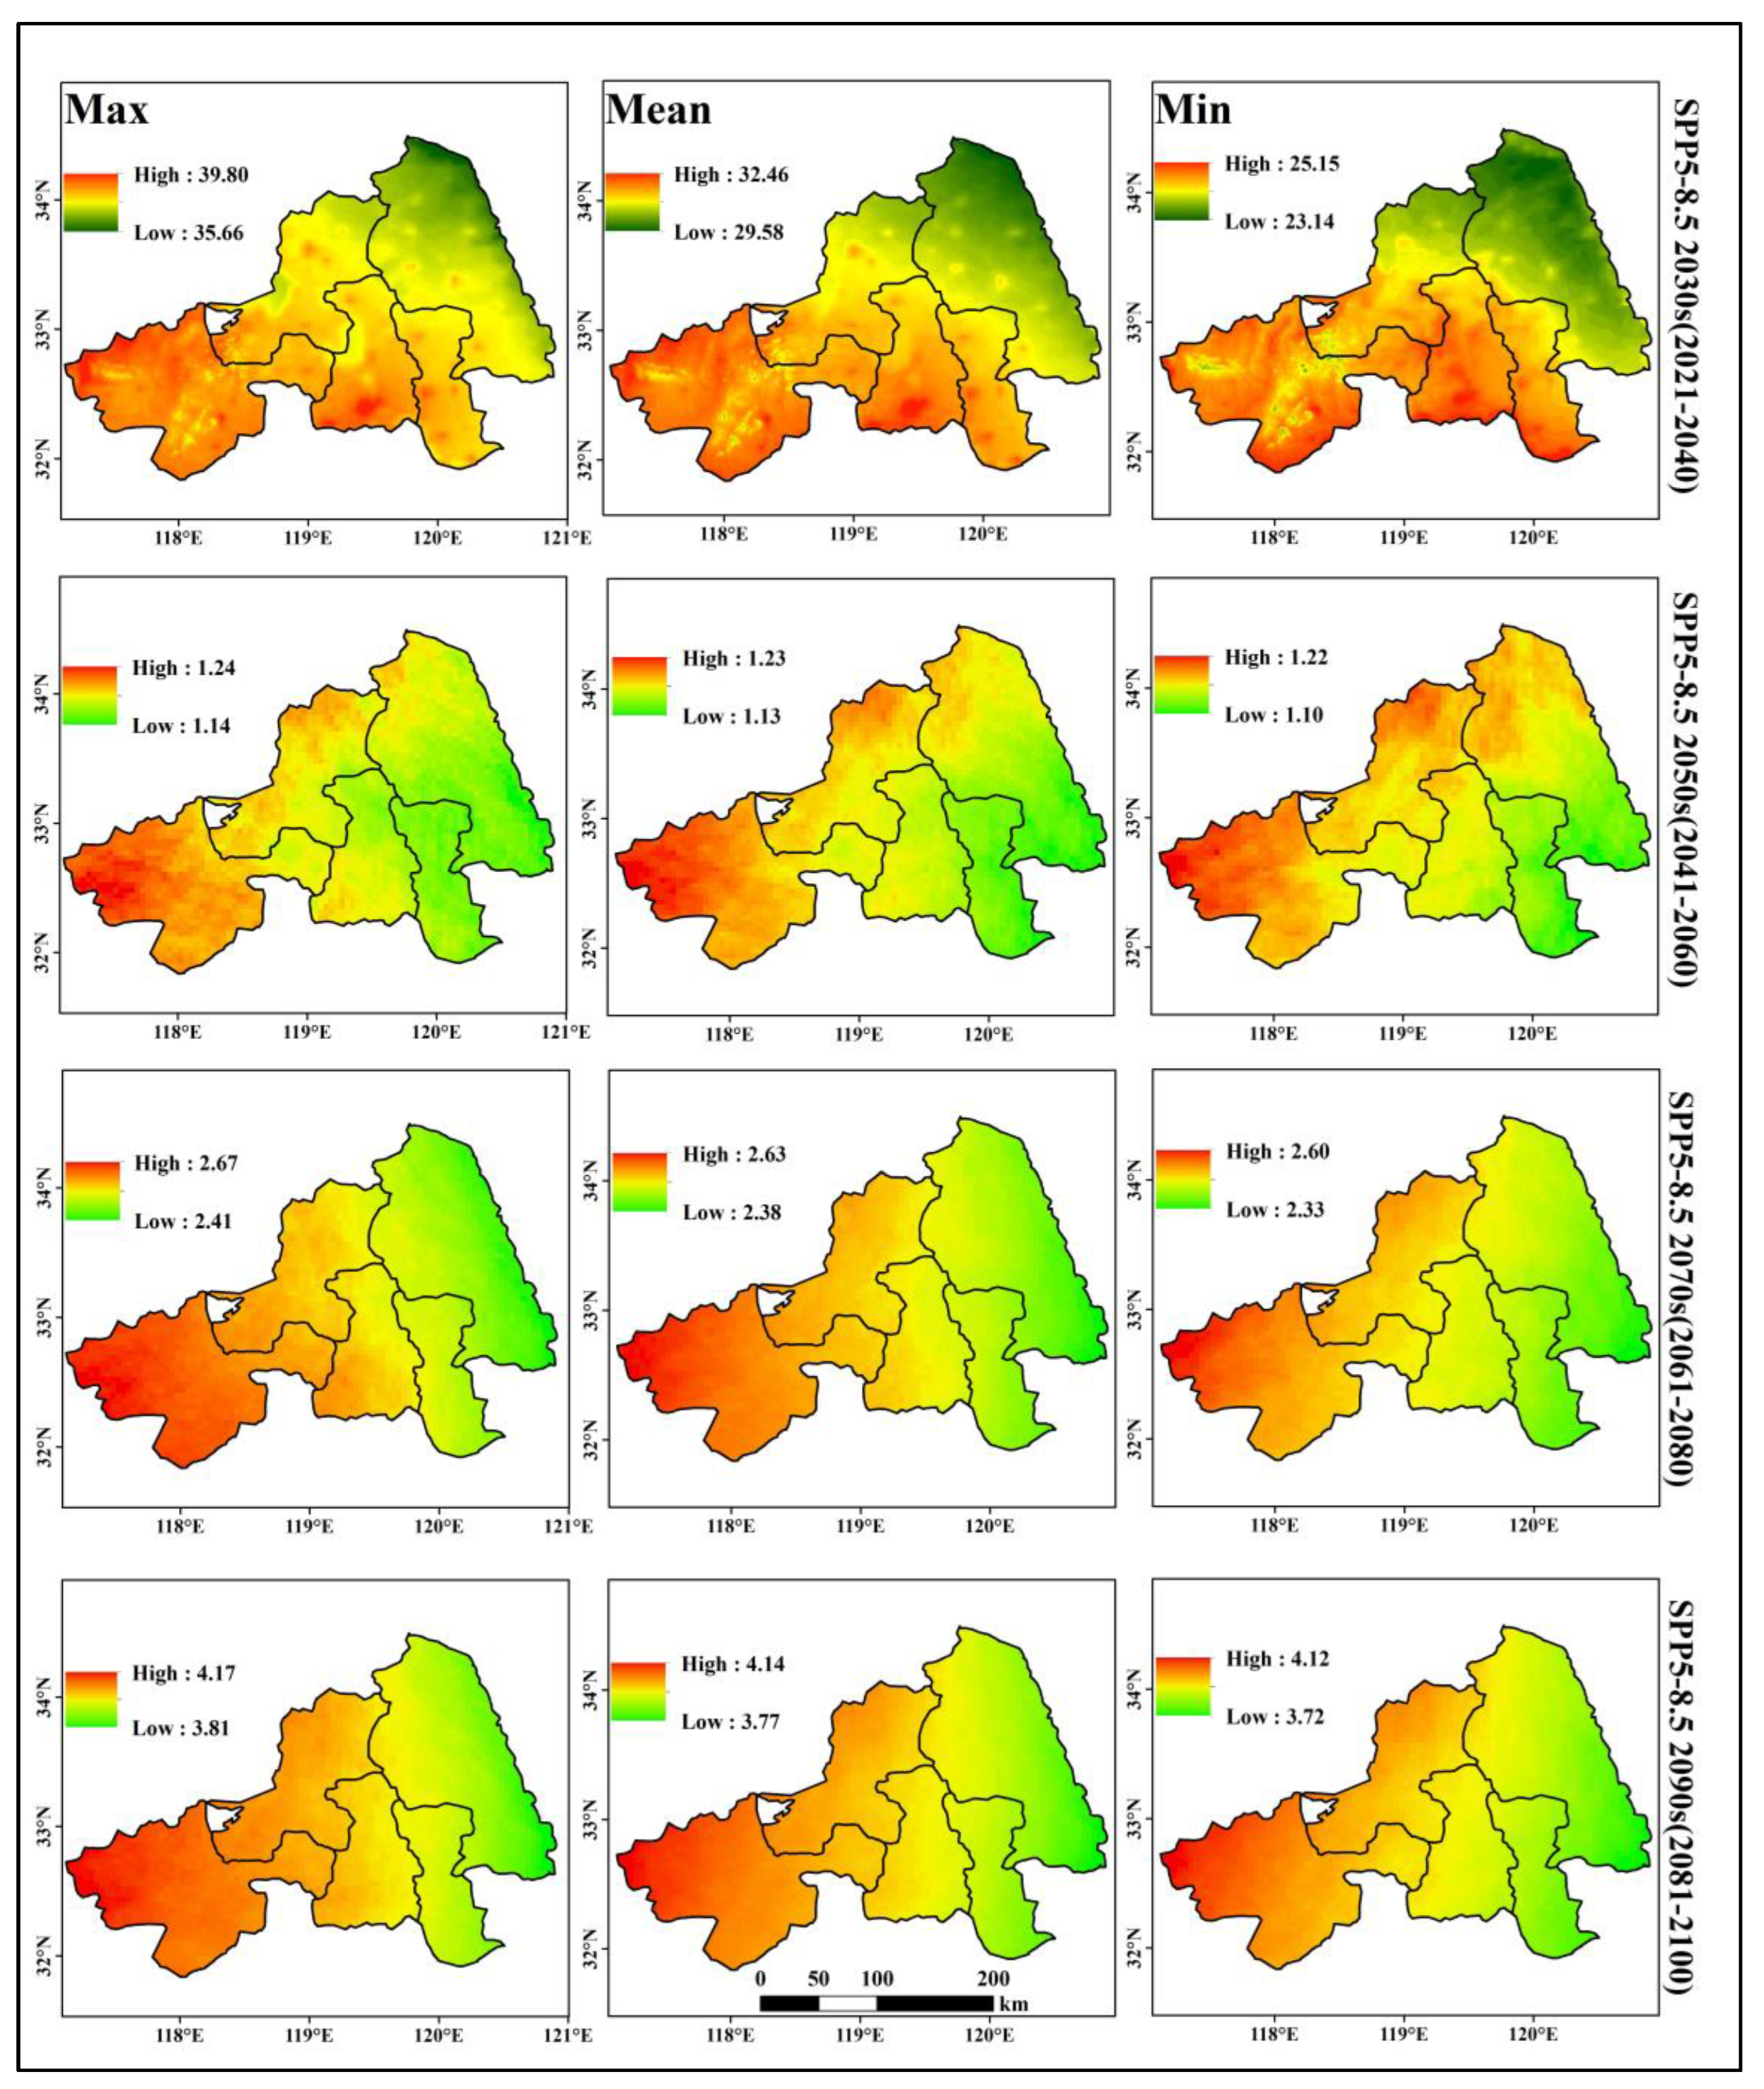
3.2. Rates of Change in Temperature
| SSP2-4.5 | SSP5-8.5 | ||||||||||||||||
|---|---|---|---|---|---|---|---|---|---|---|---|---|---|---|---|---|---|
| ≤30 °C | 30~32 °C | 32~34 °C | ≥34 °C | ≤30 °C | 30~32 °C | 32~34 °C | ≥34 °C | ||||||||||
| km2 | % | km2 | % | km2 | % | km2 | % | km2 | % | km2 | % | km2 | % | km2 | % | ||
| 2021~2040 | FO | 1.96 | 0.84 | 231.55 | 99.16 | - | - | - | - | 0.64 | 0.71 | 89.00 | 99.29 | - | - | - | - |
| GR | 60.29 | 2.80 | 2094.85 | 97.20 | - | - | - | - | 19.85 | 0.97 | 1945.92 | 94.91 | 84.51 | 4.12 | - | - | |
| BA | 19 | 47.41 | 21.08 | 52.59 | - | - | - | - | 20.24 | 61.59 | 11.62 | 35.36 | 1.00 | 3.05 | - | - | |
| AR | 24.15 | 0.06 | 41,397.59 | 99.94 | - | - | - | - | 21.00 | 0.05 | 41,551.75 | 99.94 | 5.61 | 0.01 | - | - | |
| WA | 501.71 | 12.59 | 3479.15 | 87.33 | 3.00 | 0.08 | - | - | 386.05 | 9.69 | 3584.72 | 89.95 | 14.57 | 0.37 | - | - | |
| DE | 17.44 | 0.67 | 2595.78 | 99.33 | - | - | - | - | 10.05 | 0.25 | 2371.68 | 87.46 | 330.06 | 12.17 | - | - | |
| 2041~2060 | FO | - | - | 208.55 | 99.03 | 2.05 | 0.97 | - | - | - | - | 5.01 | 14.87 | 28.68 | 85.13 | - | - |
| GR | - | - | 660.73 | 75.83 | 210.63 | 24.17 | - | - | - | - | 133.43 | 14.10 | 812.58 | 85.90 | - | - | |
| BA | - | - | 44.89 | 97.82 | 1.00 | 2.18 | - | - | - | - | 52.71 | 98.14 | 1.00 | 1.86 | - | - | |
| AR | - | - | 42,426.21 | 99.53 | 201.11 | 0.47 | - | - | - | - | 47.97 | 0.11 | 42,535.28 | 99.89 | - | - | |
| WA | - | - | 2963.49 | 74.60 | 1008.73 | 25.39 | - | - | - | - | 673.42 | 16.96 | 3296.95 | 83.04 | - | - | |
| DE | - | - | 746.62 | 27.38 | 1980.61 | 72.62 | - | - | - | - | 398.31 | 13.90 | 2467.94 | 86.10 | - | - | |
| SSP2-4.5 | SSP5-8.5 | ||||||||||||||||
|---|---|---|---|---|---|---|---|---|---|---|---|---|---|---|---|---|---|
| ≤30 °C | 30~32 °C | 32~34 °C | ≥34 °C | ≤30 °C | 30~32 °C | 32~34 °C | ≥34 °C | ||||||||||
| km2 | % | km2 | % | km2 | % | km2 | % | km2 | % | km2 | % | km2 | % | km2 | % | ||
| 2061~2080 | FO | - | - | 3.83 | 4.13 | 89.11 | 95.87 | - | - | - | - | - | - | 28.15 | 100 | - | - |
| GR | - | - | 98.27 | 25.96 | 285.02 | 74.04 | - | - | - | - | - | - | 712.69 | 86.96 | 155.54 | 14.04 | |
| BA | - | - | 56.91 | 98.33 | 1.00 | 1.67 | - | - | - | - | - | - | 54.03 | 100 | - | - | |
| AR | - | - | 59.61 | 0.14 | 43,153.71 | 99.86 | - | - | - | - | - | - | 42,363.02 | 99.12 | 361.11 | 0.88 | |
| WA | - | - | 582.21 | 15.08 | 3367.00 | 84.92 | - | - | - | - | - | - | 2995.38 | 76.38 | 953.34 | 23.62 | |
| DE | - | - | 278.04 | 10.22 | 2457.53 | 89.78 | - | - | - | - | - | - | 1484.51 | 51.13 | 1442.24 | 48.87 | |
| 2081~2100 | FO | - | - | - | - | 101.69 | 100 | - | - | - | - | - | - | - | - | 28.15 | 100 |
| GR | - | - | 49.06 | 12.71 | 353.52 | 87.24 | - | - | - | - | - | - | 47.56 | 5.71 | 749.67 | 94.29 | |
| BA | - | - | 44.74 | 76.17 | 14.00 | 23.83 | - | - | - | - | - | - | 18.00 | 32.71 | 37.03 | 67.29 | |
| AR | - | - | 49.34 | 0.31 | 43,154.53 | 99.69 | - | - | - | - | - | - | 39.17 | 0.11 | 42,689.96 | 99.89 | |
| WA | - | - | 568.72 | 14.59 | 3399.50 | 85.41 | - | - | - | - | - | - | 491.02 | 12.85 | 3477.70 | 87.15 | |
| DE | - | - | 56.94 | 2.28 | 2658.76 | 97.72 | - | - | - | - | - | - | 42.19 | 1.43 | 2814.56 | 98.57 | |
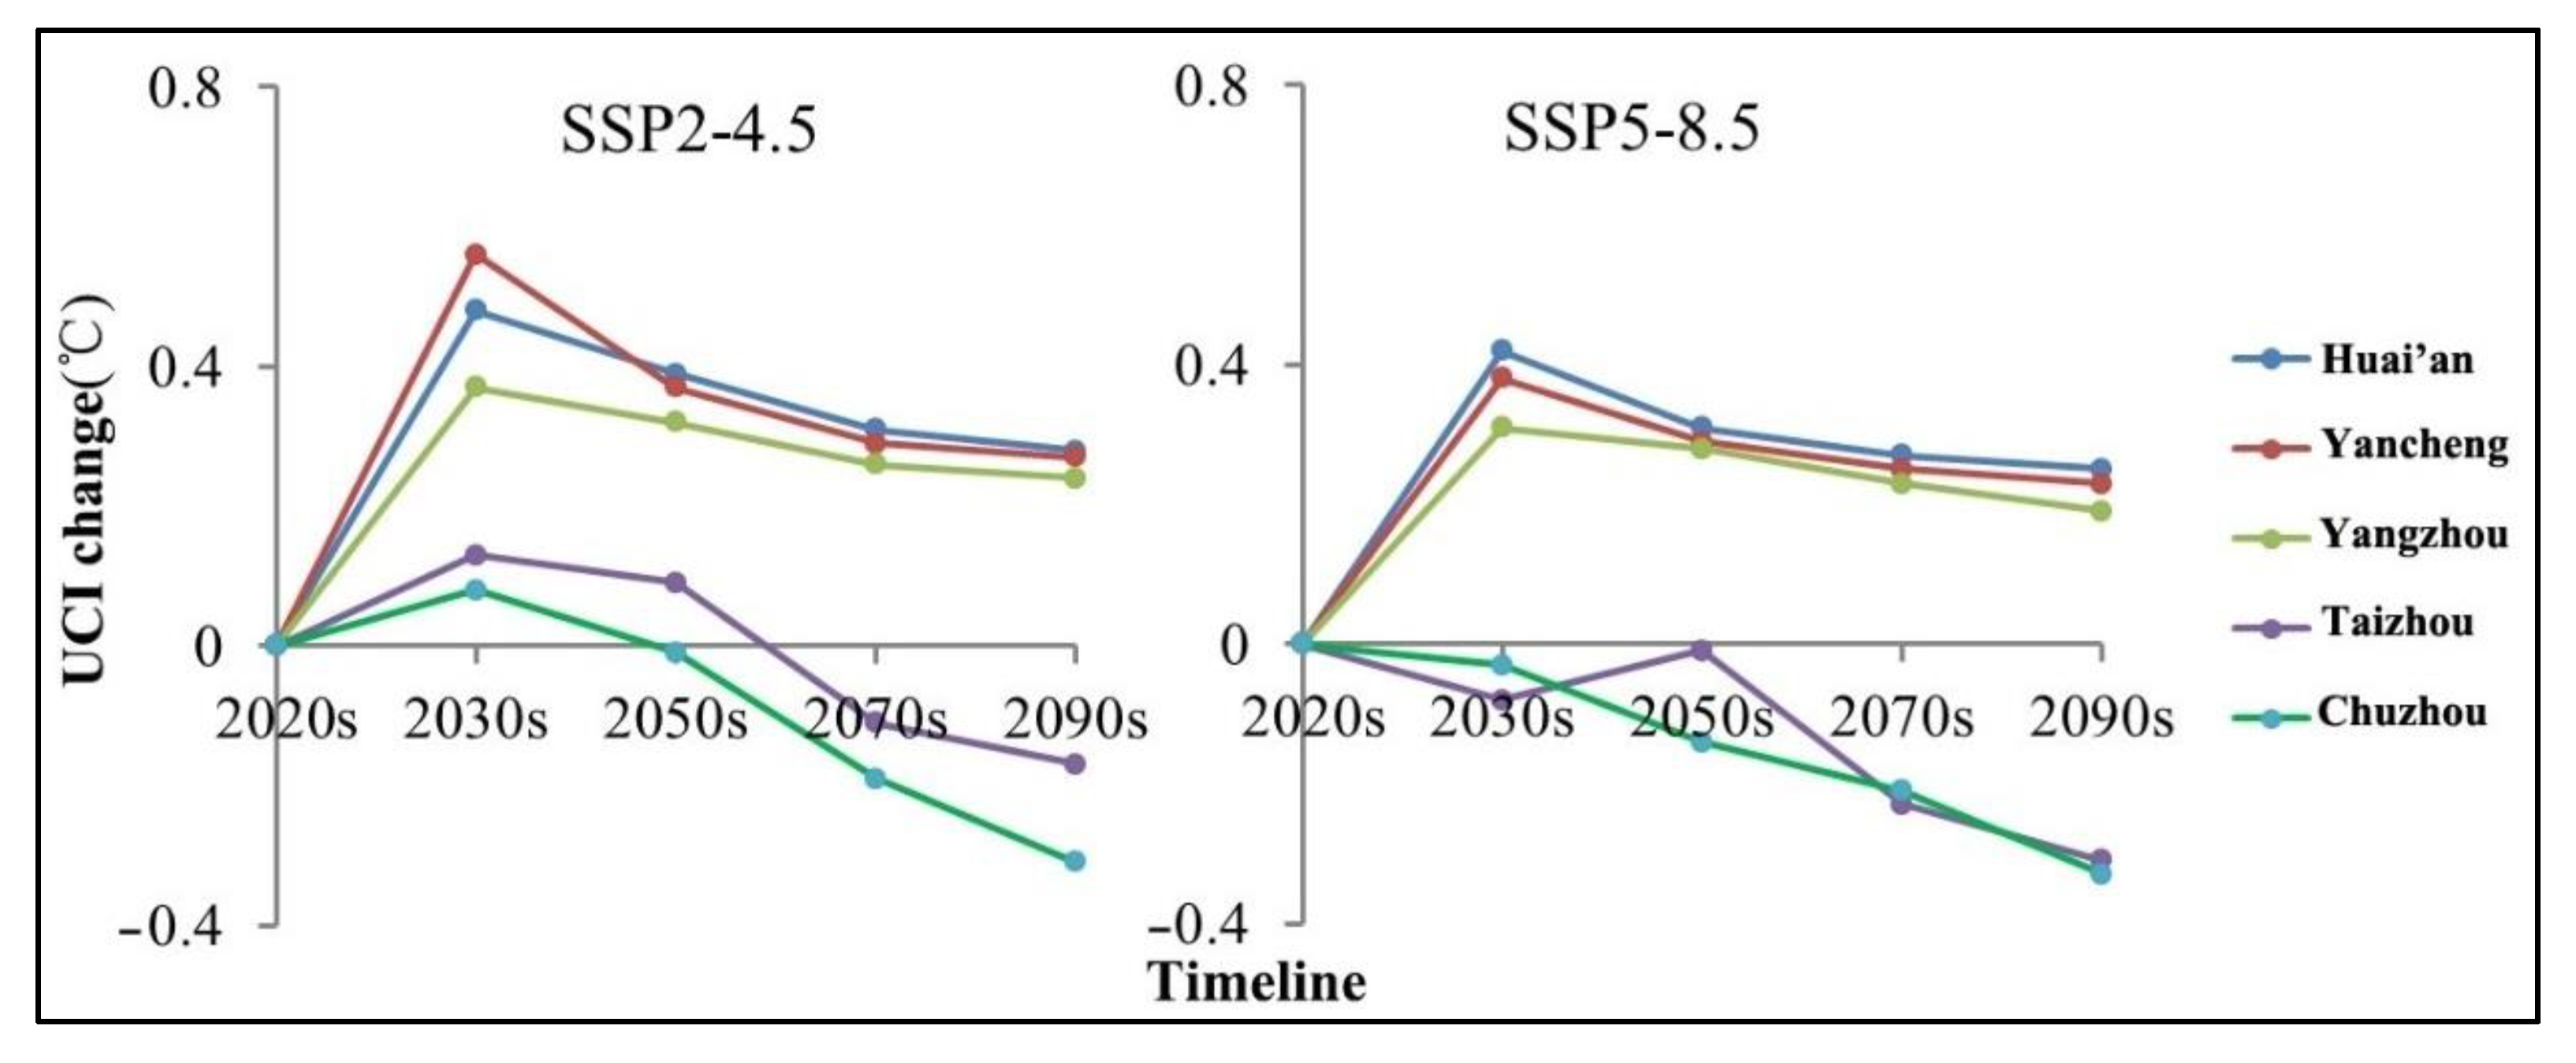
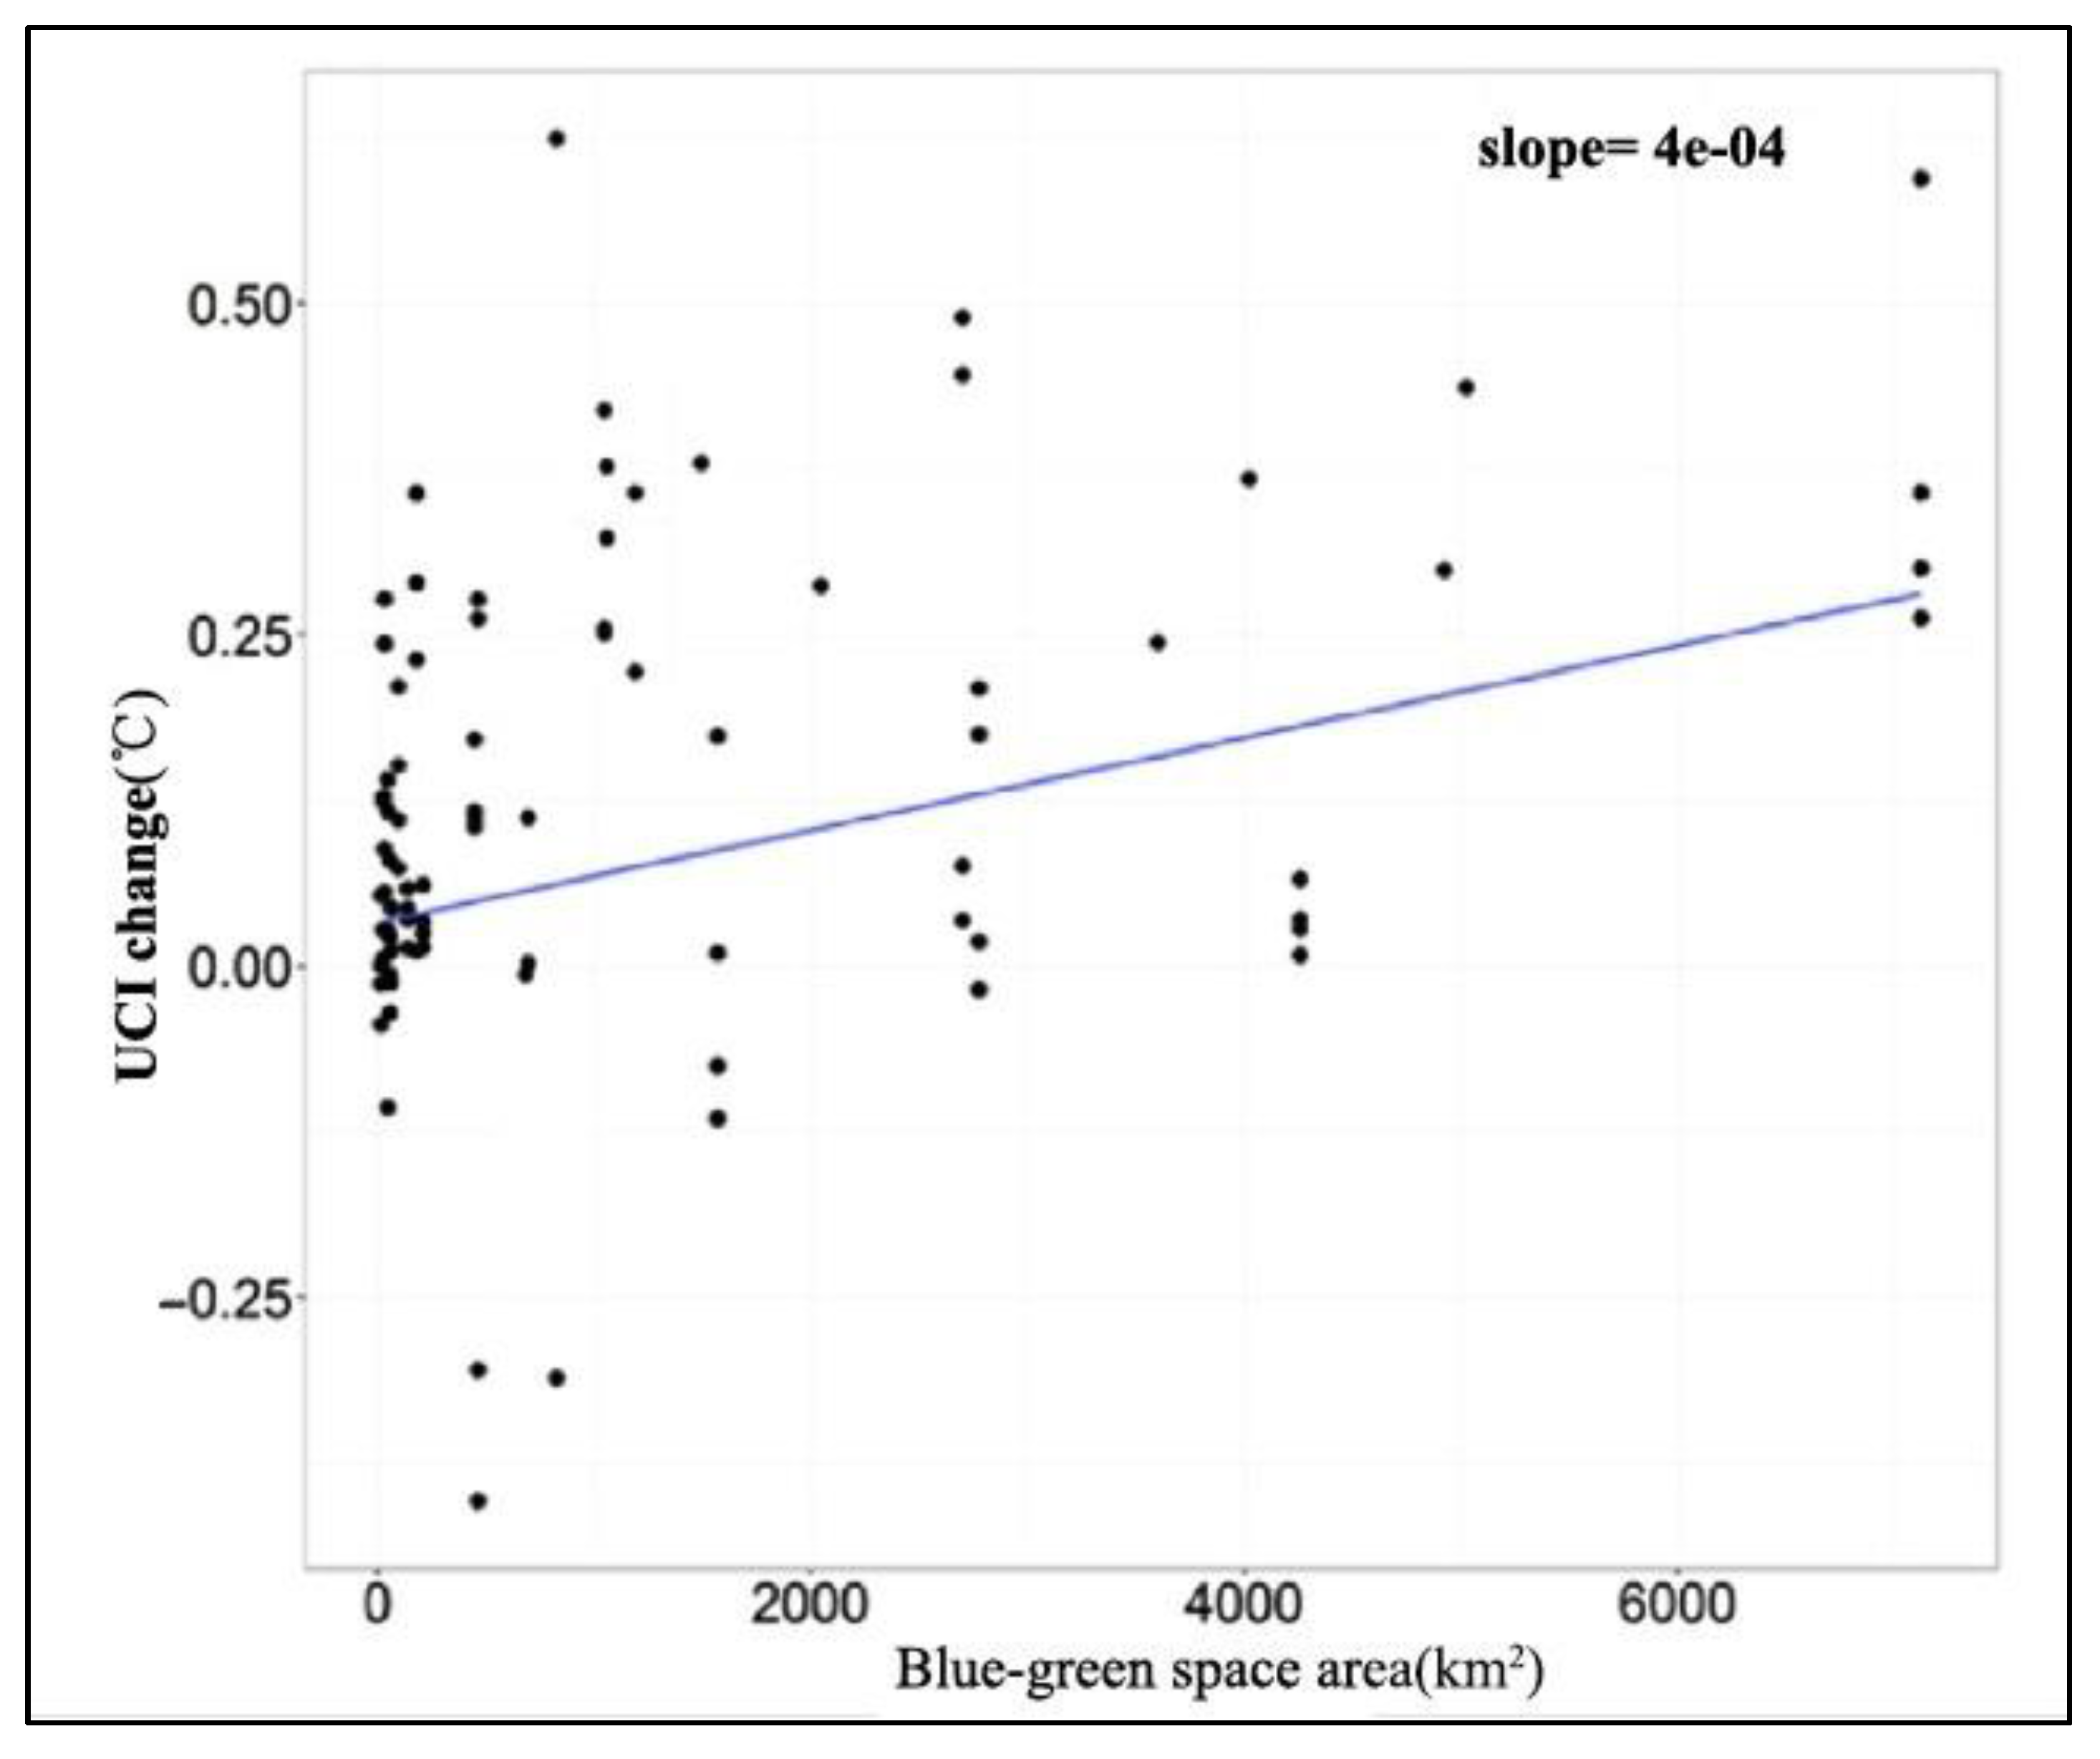
3.3. Spatiotemporal Patterns of the Blue–Green Cooling Island Effect in Future Scenarios
3.4. Planning Reference of the Regional and UCI Effects
- Urban green space optimization reference
- 2.
- Urban water body optimization reference
- 3.
- Urban blue–green space planning optimization reference
- ①
- Huai’an blue–green space optimization reference
- ②
- Yancheng blue–green space optimization reference
- ③
- Yangzhou blue–green space optimization reference
- ④
- Taizhou blue–green space optimization reference
- ⑤
- Chuzhou blue–green space optimization reference
- 4.
- Regional thermal environment simulation based on the reference scheme
4. Discussion
4.1. UCI Effect under the Future Scenario Model
4.2. The Blue–Green Model in Land Spatial Planning
5. Conclusions
Author Contributions
Funding
Data Availability Statement
Acknowledgments
Conflicts of Interest
References
- Zhou, L.; Edickinson, R.; Tian, Y.; Myneni, R.B. Evidence for a significant urbanization effect on climate in China. Proc. Natl. Acad. Sci. USA 2004, 101, 9540–9544. [Google Scholar] [CrossRef] [PubMed]
- Patz, J.A.; Campbelllendrum, D.; Holloway, T.; Foley, J.A. Impact of regional climate change on human health. Nature 2005, 438, 310–317. [Google Scholar] [CrossRef] [PubMed]
- Stewart, I.D. A systematic review and scientific critique of methodology in modern urban heat island literature. Int. J. Climatol. 2011, 31, 200–217. [Google Scholar] [CrossRef]
- Cao, C.; Lee, X.; Liu, S.; Oleson, K.W.; Schultz, N.M.; Xiao, W.; Zhang, M.; Zhao, L. Urban heat islands in China enhanced by haze pollution. Nat. Commun. 2016, 7, 12509. [Google Scholar] [CrossRef] [PubMed]
- Estoque, R.C.; Murayama, Y.; Myint, S.W. Effects of landscape composition and pattern on land surface temperature: An urban heat island study in the megacities of Southeast Asia. Sci. Total Environ. 2017, 577, 349–359. [Google Scholar] [CrossRef]
- Oleson, K.; Anderson, G.; Jones, B.; McGinnis, S.A.; Sanderson, B. Avoided climate impacts of urban and rural heat and cold waves over the US using large climate model ensembles for RCP8.5 and RCP4.5. Clim. Chang. 2018, 146, 377–392. [Google Scholar] [CrossRef]
- Peng, J.; Ma, J.; Liu, Q.; Liu, Y.; Hu, Y.; Li, Y.; Yue, Y. Spatial-temporal change of land surface temperature across 285 cities in China: An urban-rural contract perspective. Sci. Total Environ. 2018, 635, 487–497. [Google Scholar] [CrossRef]
- Besir, A.B.; Cuce, E. Green roofs and facades: A comprehensive review. Renew. Sustain. Energy Rev. 2018, 82, 915–939. [Google Scholar] [CrossRef]
- Santamouris, M. Recent progress on urban overheating and heat island research. Integrated assessment of the energy, environmental, vulnerability and health impact synergies with the global climate change. Energy Build. 2020, 207, 109482. [Google Scholar] [CrossRef]
- Zhao, L.; Lee, X.; Smith, R.B.; Oleson, K. Strong contributions of local back-ground climate to urban heat islands. Nature 2014, 511, 216–219. [Google Scholar] [CrossRef]
- O’Neill, B.C.; Kriegler, E.; Riahi, K.; Ebi, K.L.; Hallegatte, S.; Carter, T.R.; Mathur, R.; van Vuuren, D.P. A new scenario framework for climate change research: The concept of Shared Socioeconomic Pathways. Clim. Chang. 2014, 122, 387–400. [Google Scholar] [CrossRef]
- Zhou, D.; Zhao, S.; Liu, S.; Zhang, L.; Zhu, C. Surface urban heat island in China’s 32 major cities: Spatial patterns and drivers. Remote Sens. Environ. 2014, 152, 51–61. [Google Scholar] [CrossRef]
- Zhao, W.; Wang, W.J.; Hou, G.L.; Gong, C.; Jiang, M.; Lyu, X. Cooling effects of different wetlands in semi-arid rural region of northeast China. Theor. Appl. Climatol. 2020, 141, 31–41. [Google Scholar]
- Guo, G.; Zhou, X.; Wu, Z.; Gong, C.; Lyu, X. Characterizing the impact of urban morphology heterogeneity on land surface temperature in Guangzhou, China. Environ. Model. Softw. 2016, 84, 427–439. [Google Scholar] [CrossRef]
- Allegrini, J.; Carmeliet, J. Coupled CFD and building energy simulations for studying the impacts of building height topology and buoyancy on local urban microclimates. Urban Clim. 2017, 21, 278–305. [Google Scholar] [CrossRef]
- Peng Hu, Y.; Dong, J.; Liu, Q.; Liu, Y. Quantifying spatial morphology and connectivity of urban heat islands in a megacity: A radius approach. Sci. Total Environ. 2020, 714, 136792. [Google Scholar] [CrossRef]
- Yang, G.; Yu, Z.; Jørgensen, G.; Vejre, H. How can urban blue-green space be planned for climate adaption in high-latitude cities? A seasonal perspective. Sustain. Cities Soc. 2020, 53, 101932. [Google Scholar] [CrossRef]
- O’Malley, C.; Piroozfar, P.; Farr, E.R.P.; Pomponi, F. Urban heat island (UHI) mitigating strategies: A case-based comparative analysis. Sustain. Cities Soc. 2015, 19, 222–235. [Google Scholar] [CrossRef]
- Peng, J.; Xie, P.; Liu, Y.; Jing, M. Urban thermal environment dynamics and associated landscape pattern factors: A case study in the Beijing metropolitan region. Remote Sens. Environ. 2016, 173, 145–155. [Google Scholar] [CrossRef]
- Ren, Z.; He, X.; Pu, R.; Zheng, H. The impact of urban forest structure and its spatial location on urban cool island intensity. Urban Ecosyst. 2018, 21, 863–874. [Google Scholar] [CrossRef]
- Yu, Z.; Guo, X.; Jørgensen, G.; Vejre, H. How can urban green spaces be planned for climate adaptation in subtropical cities? Ecol. Indic. 2017, 82, 152–162. [Google Scholar] [CrossRef]
- Fan, H.; Yu, Z.; Yang, G.; Liu, T.Y.; Hung, C.H.; Vejre, H. How to cool hot humid (Asian) cities with urban trees? An optimal landscape size perspective. Agric. For. Meteorol. 2019, 265, 338–348. [Google Scholar] [CrossRef]
- IPCC. Climate change 2021, The physical science basis. In Working Group I Contribution to the Fourth Assessment Report of the Intergovernmental Panel on Climate Change; Cambridge University Press: Cambridge, UK, 2021. [Google Scholar]
- Fricko, O.; Havlik, P.; Rogelj, J.; Klimont, Z.; Gusti, M.; Johnson, N.; Kolp, P.; Strubegger, M.; Valin, H.; Amann, M.; et al. The marker quantification of the Shared Socioeconomic Pathway 2, A middle-of-the-road scenario for the 21st century. Glob. Environ. Chang. 2017, 42, 251–267. [Google Scholar] [CrossRef]
- Fujimori, S.; Hasegawa, T.; Masui, T.; Takahashi, K.; Herran, D.S.; Dai, H.; Hijioka, Y.; Kainuma, M. SSP3, AIM implementation of Shared Socioeconomic Pathways. Glob. Environ. Chang. 2017, 42, 268–283. [Google Scholar] [CrossRef]
- Kriegler, E.; Bauer, N.; Popp, A.; Humpenöder, F.; Leimbach, M.; Strefler, J.; Baumstark, L.; Bodirsky, B.L.; Hilaire, J.; Klein, D.; et al. Fossil-fueled development (SSP5): An energy and resource intensive scenario for the 21st century. Glob. Environ. Chang. 2017, 42, 297–315. [Google Scholar] [CrossRef]
- Kusaka, H.; Hara, M.; Takane, Y. Urban climate projection by the WRF model at 3-km horizontal grid increment: Dynamical downscaling and predicting heat stress in the 2070′s august for Tokyo, Osaka, and Nagoya metropolises. J. Meteorol. Soc. Jpn 2012, 90B, 47–63. [Google Scholar] [CrossRef]
- Adachi, S.A.; Kimura, F.; Kusaka, H.; Inoue, T.; Ueda, H. Comparison of the impact of global limate changes and urbanization on summertime future climate in the Tokyo Metropolitan Area. J. Appl. Meteorol. Climatol. 2012, 51, 1441–1454. [Google Scholar] [CrossRef]
- Argüeso, D.; Evans, J.; Fita, L.; Bormann, K.J. Temperature response to future urbanization and climate change. Clim. Dyn. 2014, 42, 2183–2199. [Google Scholar] [CrossRef]
- Sachindra, D.A.; Ullah, S.; Zaborski, P.; Nowosad, M.; Dobek, M. Temperature and urban heat island effect in lublin city in poland under changing climate. Theor. Appl. Climatol. 2022, 151, 667–690. [Google Scholar] [CrossRef]
- Das, M.; Das, A.; Momin, S. Quantifying the cooling effect of urban green space: A case from urban parks in a tropical mega metropolitan area (India). Sustain. Cities Soc. 2022, 87, 104062. [Google Scholar] [CrossRef]
- Gaur, A.; Simonovic, S.P. Application of physical scaling towards downscaling climate model precipitation data. Theor. Appl. Climatol. 2017, 132, 287–300. [Google Scholar] [CrossRef]
- Gaur, A.; Simonovic, S.P. Accessing vulnerability of land-cover types to climate change using physical scaling downscaling model. Int. J. Climatol. 2017, 37, 2901–2912. [Google Scholar] [CrossRef]
- Gaur, A.; Simonovic, S.P. Extension of physical scaling method and its application towards downscaling climate model based near surface air temperature. Int. J. Climatol. 2017, 37, 3353–3366. [Google Scholar] [CrossRef]
- Gaur, A.; Eichenbaum, M.K.; Simonovic, S.P. Analysis and modelling of surface urban heat island in 20 canadian cities under climate and land-cover change. J. Environ. Manag. 2018, 206, 145–157. [Google Scholar] [CrossRef] [PubMed]
- Sharma, R.; Hooyberghs, H.; Lauwaet, D.; De Ridder, K. Urban heat island and future climate change-implications for delhi’s heat. J. Urban Health 2019, 96, 235–251. [Google Scholar] [CrossRef] [PubMed]
- Keat, W.J.; Kendon, E.J.; Bohnenstengel, S.I. Climate change over uk cities: The urban influence on extreme temperatures in the uk climate projections. Clim. Dyn. 2021, 57, 3583–3597. [Google Scholar] [CrossRef]
- Chen, G.; Li, X.; Liu, X.; Chen, Y.; Liang, X.; Leng, J.; Xu, X.; Liao, W.; Qiu, Y.; Wu, Q.; et al. Global projections of future urban land expansion under shared socioeconomic pathways. Nat. Commun. 2020, 11, 537. [Google Scholar] [CrossRef]
- Pierce, D.W.; Barnett, T.P.; Santer, B.D.; Gleckler, P.J. Gleckler. Selecting global climate models for regional climate change studies. Proc. Natl. Acad. Sci. USA 2009, 106, 8441–8446. [Google Scholar] [CrossRef]
- Huang, P.; Ying, J. A multimodel ensemble pattern regression method to correct the tropical Pacific SST change patterns under global warming. J. Clim. 2015, 28, 4706–4723. [Google Scholar] [CrossRef]
- Kusaka, H.; Kimura, F. Thermal effects of urban canyon structure on the nocturnal heat is- land: Numerical experiment using a mesoscale model coupled with an urban canopy model. J. Appl. Meteorol. 2004, 43, 1899–1910. [Google Scholar] [CrossRef]
- Kusaka, H.; Kimura, F. Coupling a single-layer urban canopy model with a simple atmo- spheric model: Impact on urban heat island simulation for an idealized case. J. Meteorol. Soc. Japan. Ser. II 2004, 82, 67–80. [Google Scholar] [CrossRef]
- Carvalho, D.; Rocha, A.; Gómez-Gesteira, M.; Santos, C.S. WRF wind simulation and wind energy production estimates forced by different reanalyses: Comparison with observed data for Portugal. Appl. Energy 2014, 117, 116–126. [Google Scholar] [CrossRef]
- Kim, E.; Choi, K.; Park, S.; Kim, M.-H.; Kim, S.-W.; Park, M.-S.; Ahn, M.-H.; Park, Y.-S.; Song, C.-K. Turbulent characteristics in complex coastal areas assessed using BSWO observations and WRF-LES simulation results. Atmos. Res. 2023, 289, 106756. [Google Scholar] [CrossRef]
- Papangelis, G.; Tombrou, M.; Dandou, A.; Kontos, T. An urban “green planning” approach utilizing the Weather Research and Forecasting (WRF) modeling system: A case study of Athens, Greece. Landsc. Urban Plan. 2012, 105, 174–183. [Google Scholar] [CrossRef]
- Gholami, S.; Ghader, S.; Khaleghi-Zavareh, H.; Ghafarian, P. Sensitivity of WRF-simulated 10 m wind over the Persian Gulf to different boundary conditions and PBL parameterization schemes. Atmos. Res. 2020, 247, 105147. [Google Scholar] [CrossRef]
- Huang, D.; Gao, S. Impact of different reanalysis data on WRF dynamical downscaling over China. Atmos. Res. 2017, 200, 25–35. [Google Scholar] [CrossRef]
- Chen, C.; Sasa, K.; Ohsawa, T.; Prpić-Oršić, J. Comparative study on WRF model simulations from the viewpoint of optimum ship routing. Ocean. Eng. 2020, 207, 107379. [Google Scholar] [CrossRef]
- Chu, Y.; Li, J.; Li, C.; Tan, W.; Su, T.; Li, J. Seasonal and diurnal variability of planetary boundary layer height in Beijing: Intercomparison between MPL and WRF results. Atmos. Res. 2019, 227, 1–13. [Google Scholar] [CrossRef]
- Pan, Z.; Xie, Z.; Wu, L.; Pan, Y.; Ding, N.; Liang, Q.; Qin, F. Simulation of Cooling Island Effect in Blue-Green Space Based on Multi-Scale Coupling Model. Remote Sens. 2023, 15, 2093. [Google Scholar] [CrossRef]
- Umberto, B.; Zahra, J.; Jonathan, G. Effects of greenery enhancements for the resilience to heat waves: A comparison of analysis performed through mesoscale (WRF) and microscale (Envi-met) modeling. Sci. Total Environ. 2020, 747, 141300. [Google Scholar]
- Khan, A.; Chatterjee, S.; Weng, Y. Urban Heat Island Modeling for Tropical Climates; Elsevier: Amsterdam, The Netherlands, 2020. [Google Scholar]
- Wang, J.; Yan, Z.; Quan, X.-W.; Feng, J. Urban warming in the 2013 summer heat wave in eastern China. Clim. Dyn. 2016, 48, 3015–3033. [Google Scholar] [CrossRef]
- Wu, J.; Yang, S.; Zhang, X. Interaction analysis of urban blue-green space and built-up area based on coupling model—A case study of wuhan central city. Water 2020, 12, 2185. [Google Scholar] [CrossRef]
- Popp, A.; Calvin, K.; Fujimori, S.; Havlik, P.; Humpenöder, F.; Stehfest, E.; Bodirsky, B.L.; Dietrich, J.P.; Doelmann, J.C.; Gusti, M.; et al. Land-use futures in the shared socio-economic pathways. Glob. Environ. Chang. 2017, 42, 331–345. [Google Scholar] [CrossRef]
- Intergovernmental Panel on Climate Change. Climate Change: The Physical Science Basis. In Contribution of Working Group I to the Fifth Assessment Report of the Intergovernmental Panel on Climate Change; Cambridge University Press: Cambridge, UK; New York, NY, USA, 2013; pp. 33–115. [Google Scholar]
- Pielke, R.A.; Pitman, A.; Niyogi, D.; Mahmood, R.; McAlpine, C.; Hossain, F.; Goldewijk, K.K.; Nair, U.; Betts, R.; Fall, S.; et al. Land use/land cover changes and climate: Modeling analysis and observational evidence. Wiley Interdiscip. Rev. Clim. Chang. 2011, 2, 828–850. [Google Scholar] [CrossRef]
- Ogashawara, I.; Bastos, V. A quantitative approach for analyzing the relationship between urban heat islands and land cover. Remote Sens. 2012, 4, 3596–3618. [Google Scholar] [CrossRef]
- Dereczynski, C.; Silva, W.L.; Marengo, J. Detection and projections of climate change in Rio de Janeiro, Brazil. Am. J. Clim. Chang. 2013, 2, 25–33. [Google Scholar] [CrossRef]
- Bowden, J.H.; Otte, T.L.; Nolte, C.G.; Otte, M.J. Examining Interior Grid Nudging Techniques Using Two-Way Nesting in the WRF Model for Regional Climate Modeling. J. Clim. 2012, 25, 2805–2823. [Google Scholar] [CrossRef]
- Raghavan, S.V.; Vu, M.T.; Liong, S.Y. Regional climate simulations over Vietnam using the WRF model. Theor. Appl. Climatol. 2015, 126, 161–182. [Google Scholar] [CrossRef]
- Zhou, T.J.; Yu, R.C. Twentieth-Century Surface Air Temperature over China and the Globe Simulated by Coupled Climate Models. J. Clim. 2006, 19, 5843–5858. [Google Scholar] [CrossRef]
- Cao, X.; Onishi, A.; Chen, J.; Imura, H. Quantifying the cool island intensity of urban parks using ASTER and IKONOS data. Landsc. Urban Plan. 2010, 96, 225–231. [Google Scholar] [CrossRef]
- Estrada, F.; Botzen, W.W.; Tol, R.S. A global economic assessment of city policies to reduce climate change impacts. Nat. Clim. Chang. 2017, 7, 403–406. [Google Scholar] [CrossRef]
- Yu, Z.; Yang, G.; Zuo, S.; Jørgensen, G.; Koga, M.; Vejre, H. Critical review on the cooling effect of urban blue-green space: A threshold-size perspective. Urban For. Urban Green. 2020, 49, 126630. [Google Scholar] [CrossRef]
- Zhou, X.; Chen, H. Impact of urbanization-related land use land cover changes and urban morphology changes on the urban heat island phenomenon. Sci. Total Environ. 2018, 635, 1467–1476. [Google Scholar] [CrossRef] [PubMed]
- Yu, Z.; Chen, S.; Wong, N.H.; Ignatius, M.; Deng, J.; He, Y.; Hii, D.J.C. Dependence between urban morphology and outdoor air temperature: A tropical campus study using random forests algorithm. Sustain. Cities Soc. 2020, 61, 102200. [Google Scholar] [CrossRef]
- Xie, Z.; Stuart, R.; Edward, T.; Pannell, D.; Hobbs, R.; Briggs, P.; McDonald-Madden, E. Using Landsat observations (1988–2017) and Google Earth Engine to detect vegetation cover changes in rangelands–A first step towards identifying degraded lands for conservation. Remote Sens. Environ. 2019, 232, 111317. [Google Scholar] [CrossRef]
- Fu, B.; Lan, F.; Yao, H.; Qin, J.; He, H.; Liu, L.; Huang, L.; Fan, D.; Gao, E. Spatio-temporal monitoring of marsh vegetation phenology and its response to hydro-meteorological factors using CCDC algorithm with optical and SAR images: In case of Honghe National Nature Reserve, China. Sci. Total Environ. 2022, 843, 156990. [Google Scholar] [CrossRef]
- Xie, Z.; Game, E.T.; Hobbs, R.J.; Pannell, D.J.; Phinn, S.R.; McDonald-Madden, E. Conservation opportunities on uncontested lands. Nat. Sustain. 2020, 3, 9–15. [Google Scholar] [CrossRef]
- Zhao, C.; Jia, M.; Wang, Z.; Mao, D.; Wang, Y. Toward a better understanding of coastal salt marsh mapping: A case from China using dual-temporal images. Remote Sens. Environ. 2023, 295, 113664. [Google Scholar] [CrossRef]



| Number | Mode Name | Research Institutions | Resolution |
|---|---|---|---|
| 1 | ACCESS-ESM1-5 | Commonwealth Scientific and Industrial Research Organization of Australia | 1.875° × 1.24° |
| 2 | BCC-CSM2-MR | China National Climate Center | 1.125° × 1.125° |
| 3 | CanESM5-CanOE | Canadian Centre for Climate Modeling and Analysis | 2.8125° × 2.8125° |
| 4 | CMCC-ESM2 | European Mediterranean Climate Change Center, Italy | 1.875° × 1.875° |
| 5 | CNRM-ESM2-1 | French National Centre for Meteorological Research | 1.4° × 1.4° |
| 6 | EC-Earth3-Veg-LR | European Union Earth System Model Alliance | 1.125° × 1.125° |
| 7 | FIO-ESM-2-0 | First Institute of Oceanography, State Oceanic Administration, China | 2.875° × 1.1° |
| 8 | GISS-E2-1-H | NASA’s Gold Institute for Space Studies | 2.5° × 2.0° |
| 9 | HadGEM3-GC31-LL | Met Office Hadley Center | 1.875° × 1.25° |
| 10 | INM-CM5-0 | Institute of Numerical Mathematics, Russian Academy of Sciences | 2.0° × 1.6° |
| 11 | IPSL-CM6A-LR | Institute Pierre Simon Laplace, France | 2.5° × 1.25° |
| 12 | MIROC6 | Japan Environmental Research Institute and Japan Earth Environment Research Center | 1.40625° × 1.40625° |
| 13 | MPI-ESM1-2-LR | Max Planck Institute of Meteorology, Germany; Japan Meteorological Research Institute | 1.875° × 1.875° |
| 14 | MRI-ESM2-0 | Japanese Meteorological graduate student | 1.125° × 1.126° |
| 15 | UKESM1-0-LL | Earth System Centre, UK/New Zealand | 1.875° × 1.25° |
| City | Max | Mean | Min | |||
|---|---|---|---|---|---|---|
| R2 | RMSE (°C) | R2 | RMSE (°C) | R2 | RMSE (°C) | |
| Huai’an | 0.98 | 0.76 | 0.95 | 1.3 | 0.95 | 1.26 |
| Yancheng | 0.96 | 0.94 | 0.92 | 1.49 | 0.96 | 1.02 |
| Yangzhou | 0.96 | 0.97 | 0.92 | 1.66 | 0.96 | 1.13 |
| Taizhou | 0.97 | 0.98 | 0.96 | 1.42 | 0.97 | 1.04 |
| Chuzhou | 0.97 | 1.02 | 0.95 | 1.32 | 0.96 | 1.08 |
| Configuration | d01 | d02 | d03 |
|---|---|---|---|
| Version | ARW-WRF V4.0.3 | ||
| Initial and Boundary conditions | NCEP FNL | ||
| Run time | 4 August 2018 02 h~6 August 2018 02 h | ||
| Time period of analysis | 5 August 2018 | ||
| Grid distance (km) | 9 | 3 | 1 |
| Grid number | 537 × 402 | 693 × 495 | 936 × 792 |
| Number of vertical layers | 51 layers | ||
| Microphysics | WSM 6-class grauple | ||
| Short-wave radiation | Rrtm scheme | ||
| Long-wave radiation | Dudhia scheme | ||
| Surface layer model | Noah-LSM + Single-Layer UCM | ||
| Planetary boundary layer | Mellor-Yamada-Janjic (ETA) TKE scheme | ||
| Cumulus | Kain-Fritsch scheme | None | None |
| LUCC Data | Only Study Area | ||
| City | SSP2-4.5 (°C) | SSP5-8.5 (°C) | ||||||
|---|---|---|---|---|---|---|---|---|
| 2021~2040 | 2041~2060 | 2061~2080 | 2081~2100 | 2021~2040 | 2041~2060 | 2061~2080 | 2081~2100 | |
| Huai’an | 0.48 | 0.39 | 0.31 | 0.28 | 0.42 | 0.31 | 0.27 | 0.25 |
| Yancheng | 0.56 | 0.37 | 0.29 | 0.27 | 0.38 | 0.29 | 0.25 | 0.23 |
| Yangzhou | 0.37 | 0.32 | 0.26 | 0.24 | 0.31 | 0.28 | 0.23 | 0.19 |
| Taihzou | 0.13 | 0.09 | −0.11 | −0.17 | −0.08 | −0.01 | −0.23 | −0.31 |
| Chuzhou | 0.08 | −0.01 | −0.19 | −0.31 | −0.03 | −0.14 | −0.21 | −0.33 |
Disclaimer/Publisher’s Note: The statements, opinions and data contained in all publications are solely those of the individual author(s) and contributor(s) and not of MDPI and/or the editor(s). MDPI and/or the editor(s) disclaim responsibility for any injury to people or property resulting from any ideas, methods, instructions or products referred to in the content. |
© 2023 by the authors. Licensee MDPI, Basel, Switzerland. This article is an open access article distributed under the terms and conditions of the Creative Commons Attribution (CC BY) license (https://creativecommons.org/licenses/by/4.0/).
Share and Cite
Pan, Z.; Xie, Z.; Ding, N.; Liang, Q.; Li, J.; Pan, Y.; Qin, F. Evolution Patterns of Cooling Island Effect in Blue–Green Space under Different Shared Socioeconomic Pathways Scenarios. Remote Sens. 2023, 15, 3642. https://doi.org/10.3390/rs15143642
Pan Z, Xie Z, Ding N, Liang Q, Li J, Pan Y, Qin F. Evolution Patterns of Cooling Island Effect in Blue–Green Space under Different Shared Socioeconomic Pathways Scenarios. Remote Sensing. 2023; 15(14):3642. https://doi.org/10.3390/rs15143642
Chicago/Turabian StylePan, Ziwu, Zunyi Xie, Na Ding, Qiushuang Liang, Jianguo Li, Yu Pan, and Fen Qin. 2023. "Evolution Patterns of Cooling Island Effect in Blue–Green Space under Different Shared Socioeconomic Pathways Scenarios" Remote Sensing 15, no. 14: 3642. https://doi.org/10.3390/rs15143642
APA StylePan, Z., Xie, Z., Ding, N., Liang, Q., Li, J., Pan, Y., & Qin, F. (2023). Evolution Patterns of Cooling Island Effect in Blue–Green Space under Different Shared Socioeconomic Pathways Scenarios. Remote Sensing, 15(14), 3642. https://doi.org/10.3390/rs15143642


