1. Introduction
Thermal infrared remote sensing is a comprehensive detection technology that utilizes spaceborne or airborne sensors to collect and record thermal infrared information for ground objects. This information is used to obtain the relevant parameters of the surface and atmosphere. This technology has the characteristics of wide coverage and long-timespan continuous monitoring. The quantification of thermal infrared remote sensing has a wide range of applications, such as global climate change monitoring, crop yield estimation, environmental quality monitoring, and military target detection. In particular, in the retrieval of surface temperature and atmosphere detection, this quantification has significant advantages over visible-light remote sensing [
1]. Given the advantages and importance of thermal infrared remote sensing, various countries and regions in the world have carried out research on infrared remote sensing technology. A large number of thermal infrared load remote sensors with high spatial resolution, high radiation resolution, and large observation angles have been developed, along with a variety of scientific load calibration technologies. Radiometric calibration methods for satellite thermal infrared load can be divided into the following three categories according to the differences in the calibration time, location, and method: laboratory calibration, on-orbit satellite calibration, and on-orbit vicarious calibration [
2,
3]. Various independent calibration methods, or a combination of several independent calibration methods, are used to determine whether there are systematic errors in these technologies. The goal is to eliminate the impact of these errors on the calibration results as much as possible.
In general, it is essential to perform laboratory calibration in a simulated vacuum and low-temperature space environment prior to deploying a remote sensing instrument. The primary aim of this process is to evaluate and optimize the key parameters of the thermal infrared payload [
4]. This process helps to prevent the radiation performance of the satellite load from rapidly declining due to the rapid changes of the space environment. For instance, the IRMSS (infrared multispectral scan sensor) of the China–Pakistan Resources Satellite uses a single off-axis paraboloid mirror scheme to move the matching mirror out of the main optical path and adjust the low-temperature blackbody so that the blackbody cavity axis coincides with the optical axis of the calibration equipment [
5], and the blackbody cavity outlet light bar is on the focal plane of the main mirror. This method is used to simulate the thermal infrared spectrum radiation source and calibrate the thermal infrared spectrum of the multispectral scanner [
6]. Furthermore, the radiation received by the thermal infrared sensor (TIRS) of Landsat-8 is not linear with its original output electrical signal [
7]. Recently, a calibration technique was developed to convert the original output of the instrument into radiance through detector linearization, background removal steps, and the establishment of a lookup table. Sun et al. provided parameters including dynamic range, linearity, and consistency between sensors obtained by MERSI (medium-resolution spectral imager) through laboratory calibration [
8].
After the launch of a remote sensor, on-orbit calibration is required due to the violent vibrations during the launch process and changes in the space environment after the scheduled orbit is reached. The main methods of on-orbit calibration are onboard calibration and vicarious calibration [
9,
10]. The onboard calibration method ensures the accuracy and precision of a sensor, improves image quality, and enhances sensor stability. This method is not affected by the surface or atmosphere and is characterized by high precision. It is extensively used in satellites to obtain high-frequency calibration coefficients, enabling sensors to measure thermal radiation information from target objects more accurately. Cryogenic space and reference blackbody are commonly used as radiation references in the thermal infrared spectrum segment [
5]. Many sensors around the world use blackbodies for thermal infrared calibration, such as the MODIS (moderate-resolution imaging spectroradiometer) onboard calibration which utilizes high-temperature and low-temperature blackbodies and a heating and cooling multipoint calibration device [
11,
12]. TIRS uses the same method as MODIS to calibrate the entire optical path on the satellite [
13]. CBERS-02 (China–Brazil Earth Resources Satellite-02) satellite uses a high-temperature cavity blackbody and a normal-temperature plane blackbody for calibration [
5]. In addition, there are onboard calibration methods for moon and star observations. Vicarious calibration based on radiation transfer simulation is also an on-orbit calibration method for thermal infrared sensors. It can optimize sensor performance, improve data consistency and comparability, and ensure sensor stability and reliability. Zhang et al. used the Qinghai Lake calibration field to calibrate the CBERS-02 IRMSS thermal infrared channel absolutely, and they obtained results similar to the blackbody calibration in the same period on the satellite [
6]. Han et al. used observation data and Landsat-5-TM data to verify the vicarious calibration coefficient of HJ–1B. The obtained results had an accuracy that was 0.6–3% better than the original calibration coefficient, with an overall accuracy of about 1 K [
14].
ZY1-02E is China’s second independent civil natural resources hyperspectral service satellite. This satellite was successfully launched on 26 December 2021, while carrying a visible near-infrared sensor, a hyperspectral sensor, and an infrared sensor. The Infrared Sensor (IRS) has a swath width of 115 km and a spatial resolution of 16 m. Its spectral band setting span is large and only one band. The spectral band range is 7.7–10.5 μm. The sideways capability is ±32°, containing multiple water vapor absorption bands, and it has the ability of superresolution reconstruction [
15]. The accuracy of radiation calibration for the ZY1-02E thermal infrared band is required to be less than 5% in terms of amplitude deviation. Before launch, laboratory calibration was conducted to assess the influence of the change of focal plane and main body temperature on the calibration, followed by the external and internal calibration of the sensor. However, on-orbit absolute radiometric calibration is still necessary due to the violent vibration, orbital space change, and instrument degradation.
In this paper, we briefly introduce the processes of onboard calibration and vicarious calibration of the ZY1-02E satellite’s thermal infrared sensor. We compare the calibration results of onboard calibration and vicarious calibration, and use the radiance computed from measured data and the satellite data with high calibration accuracy to verify and evaluate the results. The findings indicate that vicarious calibration was significantly better; results had smaller amplitude deviations and met the quantitative requirements of remote sensing data compared to onboard calibration results. Lastly, we analyze the possible reasons for different calibration results, the differences between onboard calibration and vicarious calibration, and their advantages and disadvantages. This analysis provides a methodological basis for the formulation of calibration plans and the improvement of calibration algorithms for the ZY1-02E satellite, resource series satellites, and all-global satellites with thermal infrared channels.
2. Materials and Methods
2.1. ZY1-02E Satellite and Thermal Infrared Sensor
ZY1-02E is the second independent civil natural resource hyperspectral service satellite developed by China. It incorporates multiple cameras that capture imagery across various bands, including visible, near-infrared, short-wave infrared, and thermal infrared. Notably, ZY1-02E also incorporates an additional thermal infrared camera, enabling the observation of ground temperature. The infrared camera of the ZY1-02E satellite comprises several components, such as a hood, main optical device, onboard calibration device, relay optical system, relay refrigeration component, focusing device, detector–refrigerator component, focal surface circuit box, main structure, and thermal control component, as depicted in
Figure 1. This satellite payload exhibits distinct quantitative characteristics and is specifically designed for medium-resolution, large-scale observations, as well as remote sensing applications. Detailed technical parameters for the satellite are provided in
Table 1, while the spectral response function for the thermal infrared camera is illustrated in
Figure 2. Sensor 1 and sensor 2 mentioned are identical, with Sensor 2 serving as a backup for Sensor 1.
2.2. Onboard Calibration
Onboard blackbody calibration is a method used for on-orbit radiometric calibration through the onboard blackbody, which can provide calibration coefficients at a higher frequency. Blackbody radiance source is the reference source of infrared camera onboard calibration. The temperature uncertainty and emissivity error are the main factors influencing the accuracy of vacuum radiation calibration. The onboard blackbody emissivity is 0.98 ± 0.01; the impact of non-uniformity can be calculated as 1.5%. Converting the temperature difference radiance to 300 K and comparing it with the radiance of a 300 K blackbody, the effect of temperature uncertainty is 0.50%. Typically, thermal infrared channel sensors use the internal temperature reference source method for onboard calibration, a method also known as the internal calibration method. A temperature reference source, consisting of two blackbodies, one high-temperature and one low-temperature, is attached to the interior of the thermal infrared remote sensor. The temperature of the high-temperature blackbody is 300 K, and the temperature of the low-temperature blackbody is 275 K. These blackbodies are situated on either side of the rotary scanning mirror. The temperature range of the high-temperature and low-temperature blackbodies should generally include the “coldest” and “hottest” temperatures of the ground monitoring target [
16]. During operation, the scanner sequentially scans the cold reference source, the target, and the hot reference source, recording all signals. The calibration coefficient is determined using the two-point method, which in turn allows the calculation of the DN (digital number) value for the entire remote sensing image. The calculation proceeds as described below.
In the onboard calibration process, the equivalent TOA radiance (top-of-atmosphere radiance) must be calculated first, and its calculation formula is as follows:
In the formula, is the equivalent TOA radiance, is the spectral radiance, is the absolute temperature, is the external calibration emissivity, is the wavelength, and are the initial and cut-off wavelengths of the imager response, and is the relative spectral response of the sensor.
Combining the equivalent TOA radiance with the known average DN value of the high-temperature and low-temperature blackbody, the calibration equation can be obtained using the two-point method, as shown in Formula (2).
where
is the DN number of the high-temperature blackbody, is the DN number of the low-temperature blackbody, is the high-temperature blackbody radiance, and is the low-temperature blackbody radiance.
Analogous to the internal calibration method applied in laboratory calibrations, the absolute calibration coefficient at the entrance of the camera is calculated on the basis of the measured temperature of the blackbody on the satellite and the actual response DN value. Absolute calibration accuracy is ascertained through error analysis. The calculation process of the absolute radiometric calibration coefficient of the blackbody on the satellite is shown in the
Figure 3. First, the high-temperature and low-temperature blackbody calibration data are extracted on the basis of the satellite’s onboard level 0 blackbody data. This is followed by a non-uniformity correction on the high- and low-temperature blackbody calibration data to eliminate blind and flicker elements. The DN mean value of the high-temperature and low-temperature blackbody images is calculated. Next, the high-temperature and low-temperature blackbody radiance values are calculated. On the basis of the calculated high-temperature and low-temperature calibration blackbody image DN mean values and radiance values, the absolute radiometric calibration coefficient of the satellite’s blackbody is calculated. The specific process is shown in
Figure 3.
The formula for calculating the TOA radiance mirrors was provided in Formula (1). According to Planck’s law, the correlation between blackbody temperature and spectral radiance can be obtained as expressed in Formula (2). Finally, the calibration coefficient can be computed according to Formula (3).
2.3. Vicarious Calibration
Vicarious calibration serves as an essential method for obtaining accurate, absolute calibration information for thermal infrared instruments, particularly when the onboard calibration systems fail to produce suitable calibration coefficients. These coefficients play a vital role in producing consistent and dependable remote sensing image products, which are integral to various scientific and analytical applications [
17].
In this study, atmospheric parameters including temperature, humidity, and pressure were obtained during satellite transit through the use of data derived from a sounding balloon. Additionally, the global effective temperature, humidity, and pressure profiles were acquired from the ECMWF (European Center for Medium-Range Weather Forecasts) reanalysis database [
18], which provided data at a temporal resolution of 1 h, a maximum spatial resolution of 0.1°, and 37 layers ranging from 1000 to 1 hPa. The concentrations of atmospheric aerosols and water vapor were measured during transit using a CE318 (CE318 Sunphotometer Measurement) automatic solar photometer. Meanwhile, the total amount of ozone was calculated by measuring direct solar ultraviolet radiation at five discontinuous wavelengths in the UVB (Ultraviolet Radiation B) range, with the MICROTOPS II (a 5-channel handheld ozonometer for accurate measurement of total ozone columns) [
15].
When the satellite is working, the calculation of the TOA radiance is as shown in Formulas (5) and (6).
where
is radiance measured by the satellite sensor,
is the total spectral radiance of the surface (the off-ground radiance),
is the atmospheric transmittance from the surface to the sensor,
and
are, respectively, the onboard brightness and surface brightness temperatures,
is the surface temperature,
is the observed zenith angle,
is the wavelength,
is the emissivity of the ground object,
is the Planck function,
is the downward radiation of the atmosphere, and
is the upward radiation of the atmosphere.
For water body targets, a 102F (102F portable Fourier-transform thermal infrared spectrometer) loaded on the ship was used to measure the water body synchronously when the satellite was passing through, and the out-of-water radiance
of several water body points was directly obtained. The specific location is shown in
Figure 4. In the legend, 7.7, 7.10, and 7.13 represent 7 July, 10 July, and 13 July, respectively.
For the other targets, we employed the SI-111 infrared temperature sensor to obtain the brightness temperature of the ground target at the moment of satellite transit. Subsequently, the 102F was used to measure the ground radiance of this target, and the temperature and emissivity were separated. According to Planck’s law, the ground radiance of the target was calculated indirectly.
To derive the TOA radiance, it is necessary to input the atmospheric profile data of the satellite during transit into the MODTRAN (Moderate Spectral Resolution Atmospheric Transmittance Algorithm and Computer Model) radiative transfer model. This model enables the calculation and derivation of atmospheric parameters, including transmittance and atmospheric upward radiation. Finally, the spectral response function is combined with the retrieved values to obtain the TOA radiance. Combined with the satellite image DN number, the calibration coefficients G and B can be acquired by fitting with Formula (7).
2.4. Accuracy Validation
2.4.1. Validation Based on Surface Synchronous Measurement Data
Large areas of sandy land and vegetation, and the Kubuqi desert near Baotou site were selected as points for accuracy verification. Utilizing calibration coefficients and the corresponding digital number (DN) values in the image, the on-satellite radiance was calculated. A comparison was then made between the on-satellite radiance and the TOA radiance obtained through ground-based measurements, in order to verify the accuracy of the calibration results. The verification area information is shown in
Table 2.
In this study, radiation transmission simulations were conducted using MODTRAN with an intrinsic model error not exceeding 2%. The measurement error of atmospheric parameters did not exceed 1%, meeting the requirements for on-orbit radiometric calibration.
2.4.2. Cross-Validation
Furthermore, to verify the accuracy of the calibration results, we conducted a comparative analysis between the thermal infrared image during satellite synchronous transit from the ZY1-02E satellite and that of the Landsat-8 and MODIS satellites, known for their high calibration accuracy [
10,
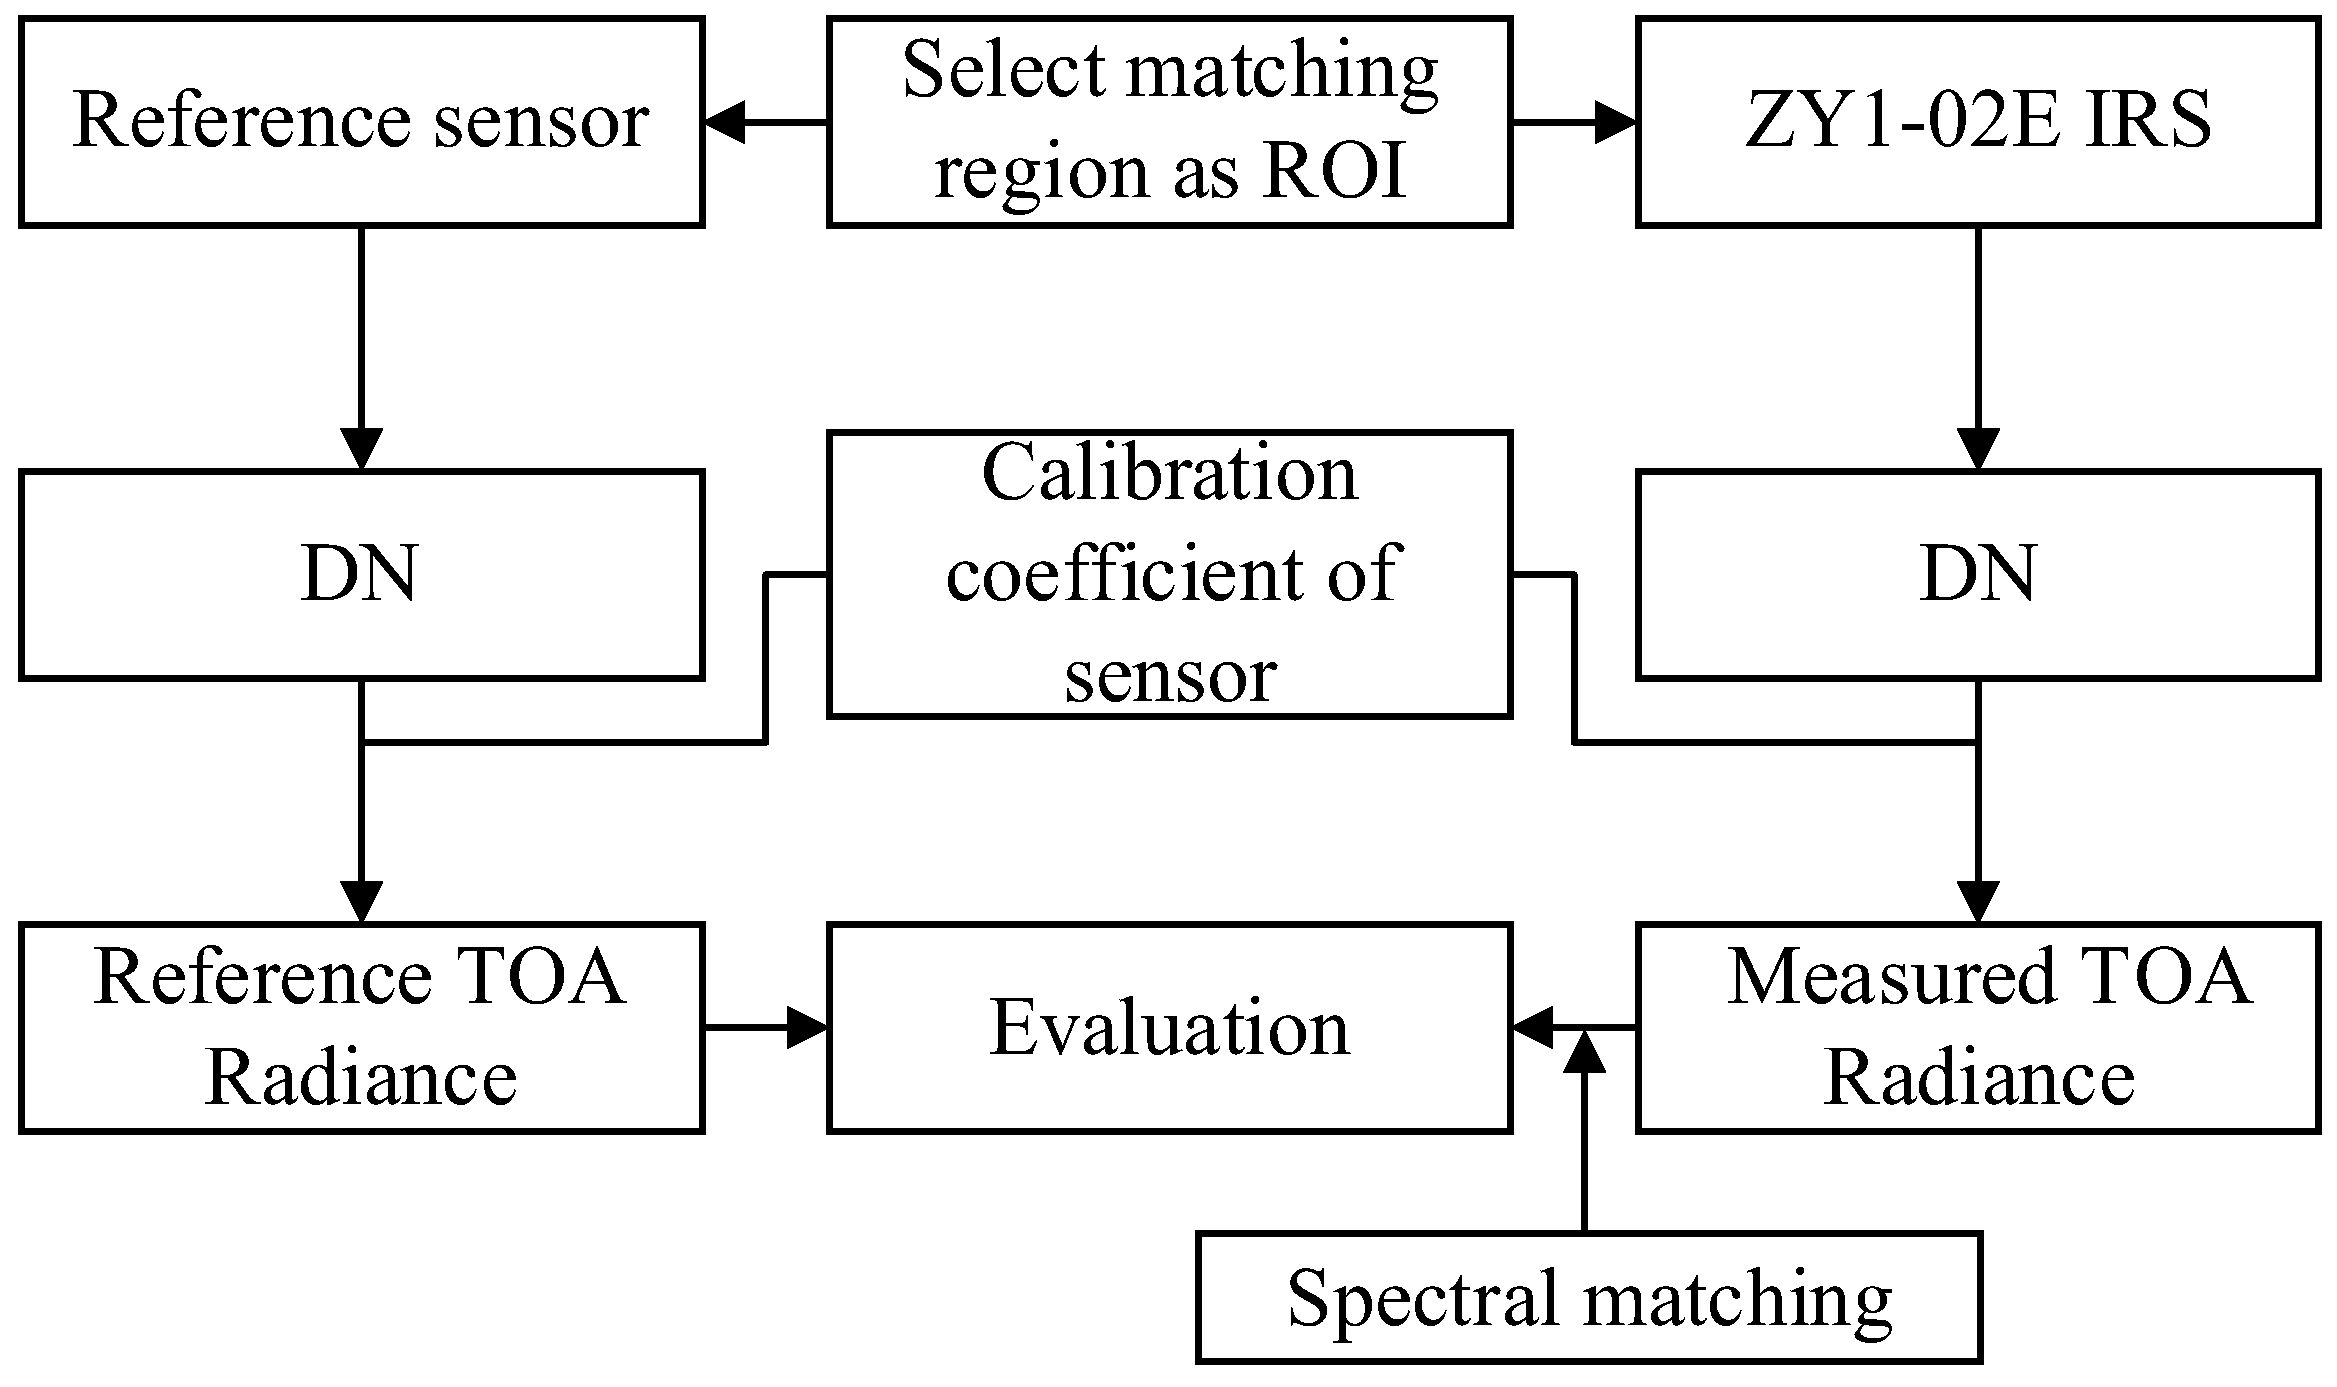
19]. These data were selected to cross-verify the results of onboard calibration and vicarious calibration. The specific methods are shown in
Figure 5. The spectral response of each sensor is depicted in
Figure 6, and the corresponding parameters are shown in
Table 3.
We first selected Landsat-8 TIRS and MODIS B31 as reference sensors to search for remote sensing images with similar transit times to the ZY1-02E satellite for cross-validation. Then, using official calibration coefficients, we calculated the radiance values of the images. Next, we corrected the radiance values of satellite images through spectral matching. Finally, we assessed the uncertainty of the calibration results using representative evaluation indicators.
The spectral response of the ZY1-02E thermal infrared channel is unique, differing from those of the Landsat-8 and MODIS thermal infrared channels. The method employed is outlined below, incorporating several sequential steps. Initially, radiance images from MODIS and Landsat 8 were queried and subsequently downloaded. Secondly, the DN values of ZY1-02E’s images were acquired and retrieved. Thirdly, we proceeded to convert the DN values of ZY1-02E images to radiance utilizing the obtained calibration coefficients. In the final step, a set of points within the synchronized observation area were randomly selected, and the radiance values from MODIS, Landsat 8, and ZY1-02E images were recorded for the purpose of conducting a comparative analysis. The degree of similarity among these values served as a metric to gauge the accuracy of the calibration results.
Therefore, spectral matching had to be performed before cross-validation. We describe the methods used in this study as follows: Firstly, the spectral response functions of the two sensors were loaded, and their inner products with the spectral distribution of the ground objects were calculated to obtain the radiance of the same ground object under the spectral responses of each sensor. We then compared the radiance of each sensor to calculate a conversion factor k. The calculation method for the conversion factor “
k” is as shown in Formula (8). It represents the ratio required to convert the brightness measured by one sensor to the brightness of a standard sensor with high accuracy.
where
represents the distribution of ground object radiance according to wavelength,
represents the spectral response of the reference sensor, and
represents the spectral response of the calibrated sensor.
The error in spectral matching was within 1%.
Sandy land around Baotou site, vegetation around Baotou site, and Kubuqi Desert were selected as verification points. These points had an open, flat terrain and a uniform surface. The onboard calibration coefficient and vicarious calibration coefficient were obtained and used to calculate the onboard TOA radiance. In addition, we used satellite images of Landsat-8, MODIS, and ZY1-02E passing simultaneously for cross-validation to evaluate the calibration results. An overview of the data is presented in
Table 4.
The average relative error (A
accuracy) and root-mean-square relative error (RMSRE) were used to quantify the error between the corrected ZY1-02E thermal infrared channel and the standard satellite sensor. These terms are defined in Formulas (9) and (10).
where
is the number of verification points,
is the radiance of the reference sensor, and
is the thermal infrared channel radiance of ZY1-02E.
3. Data Processing and Result Analysis
3.1. Onboard Calibration
The thermal infrared channel of ZY1-02E provides blackbody image data, illustrated in
Figure 7 with one scene as an example, encompassing a set of high-temperature and low-temperature blackbody calibration data. These data can be utilized for the absolute radiometric calibration of the satellite’s blackbody.
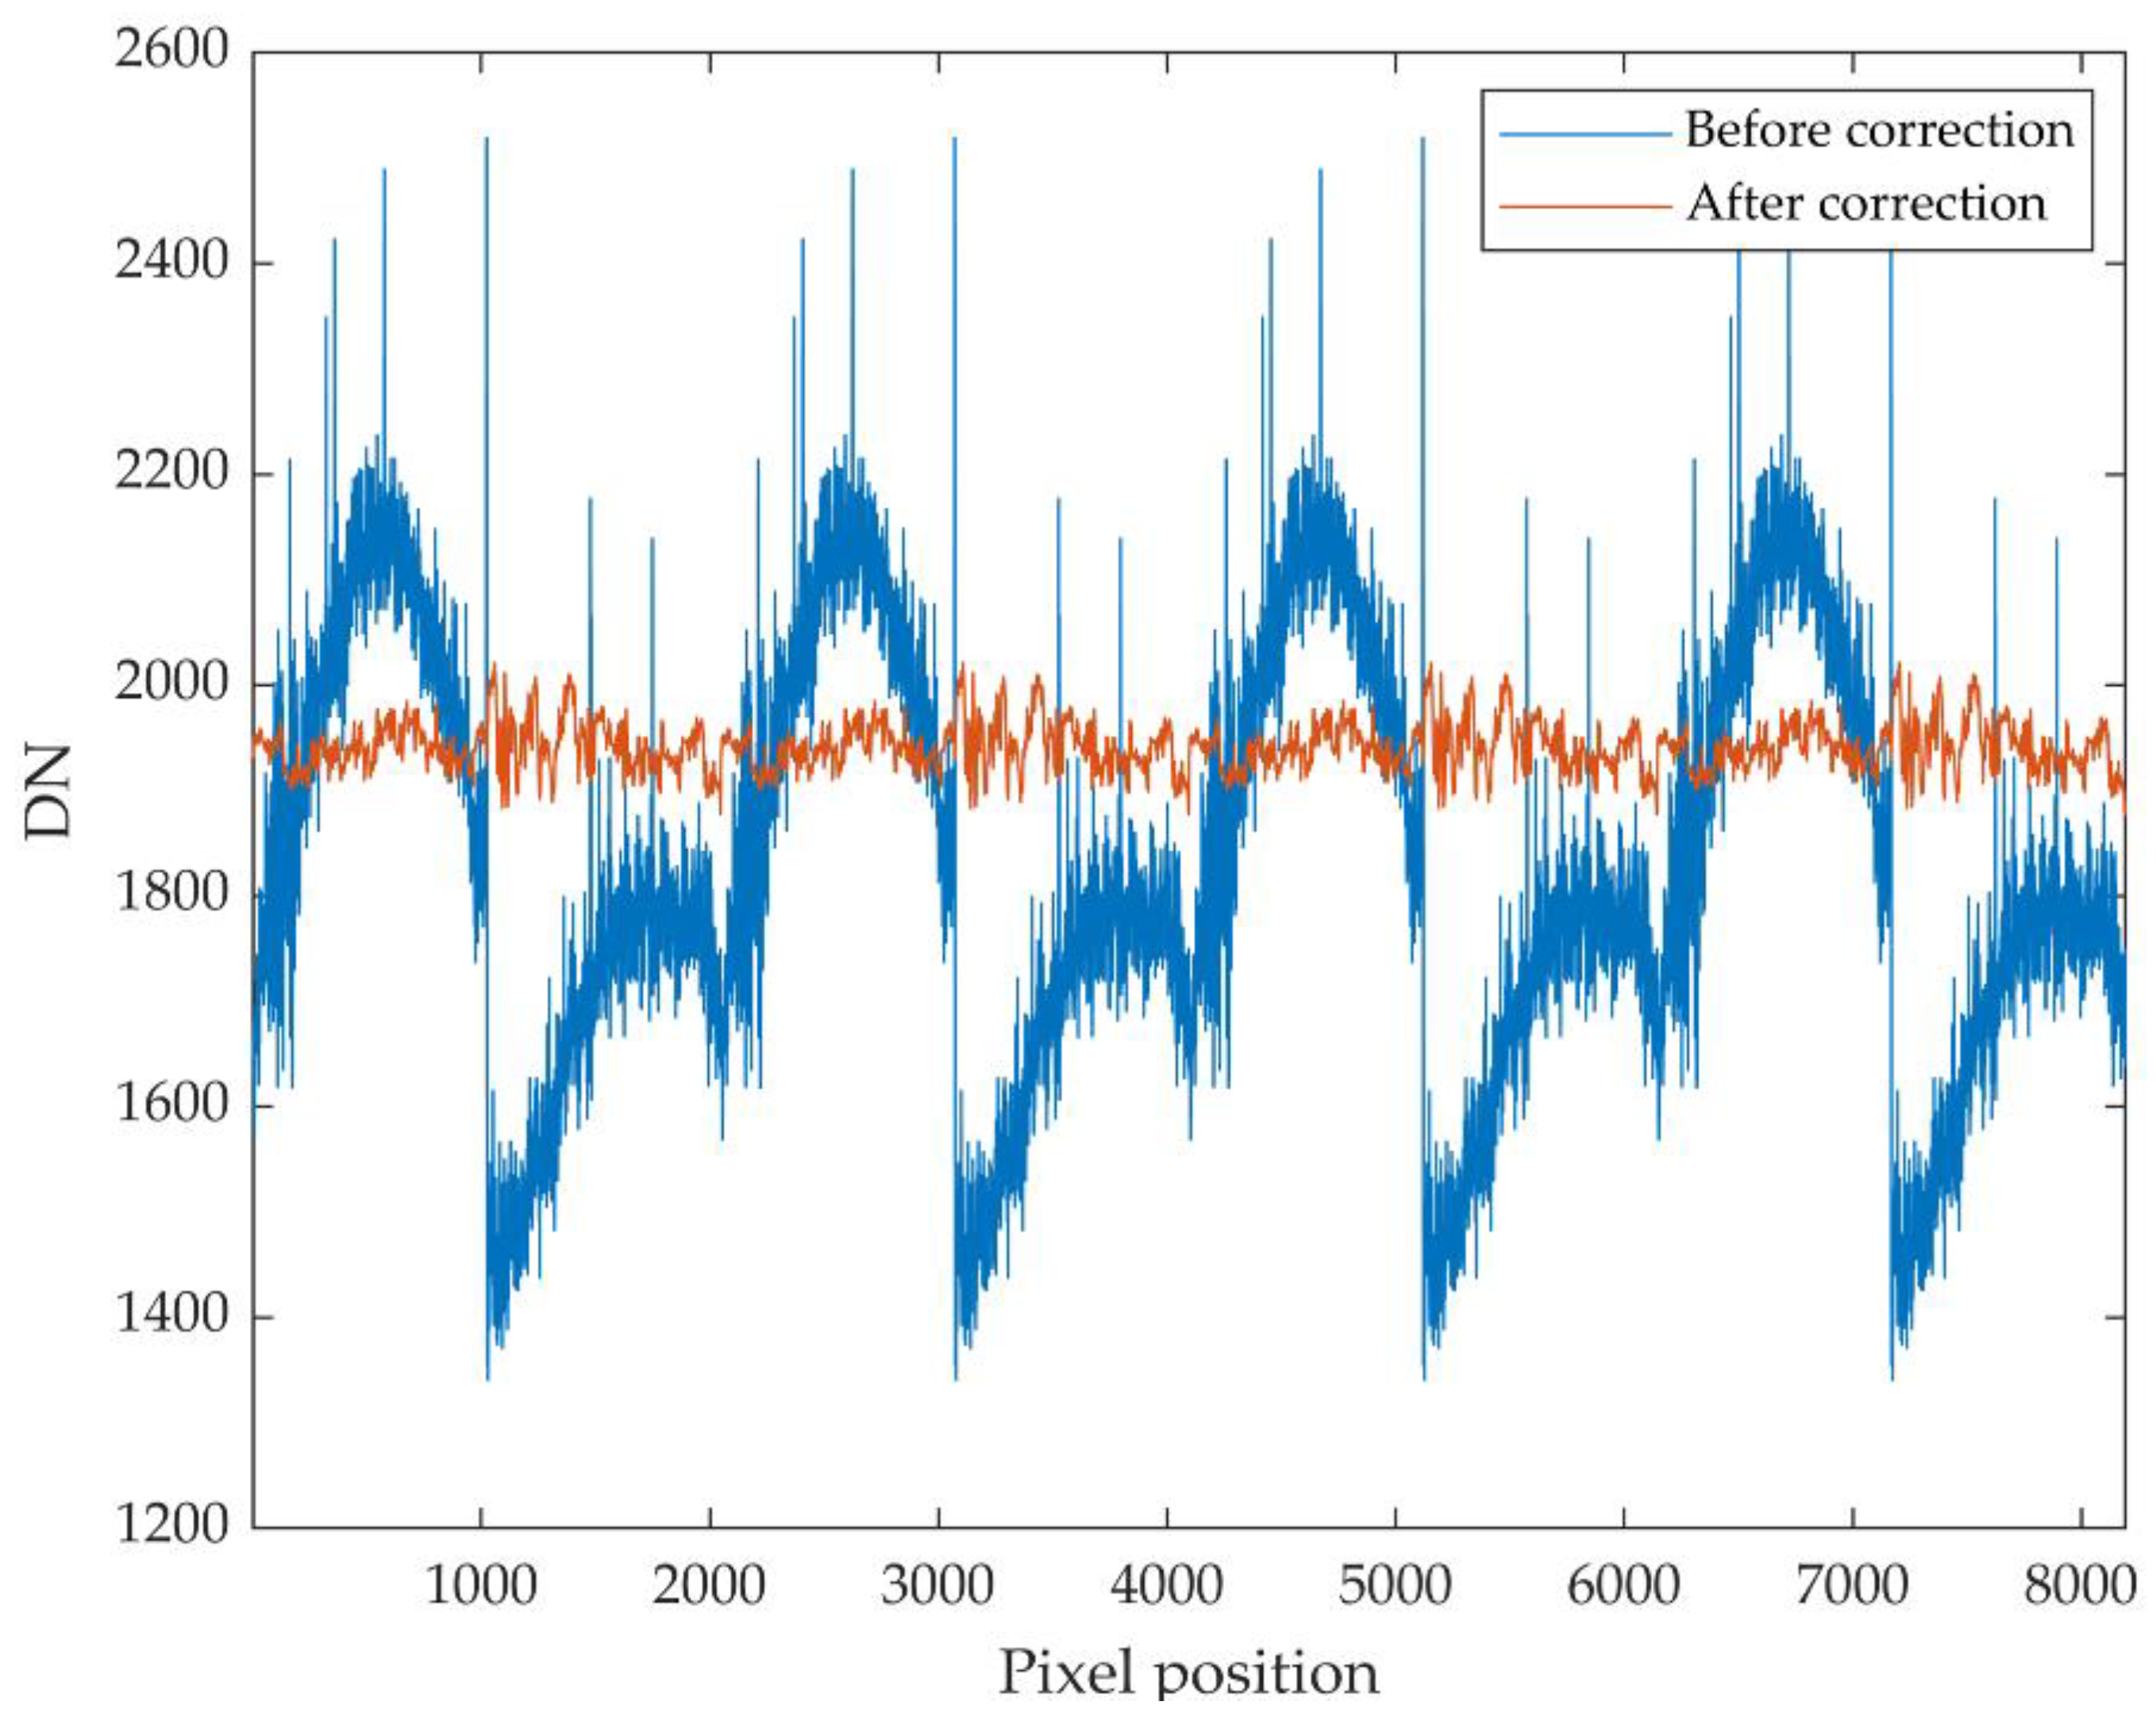
The detector array of a thermal infrared camera, or thermal imager, consists of many pixels, with each pixel responsible for receiving and measuring the infrared radiation in its corresponding area. However, due to manufacturing processes and other factors, the response of each pixel may vary slightly, resulting in non-uniformity. This means that, under the same input conditions, some pixels may exhibit higher responses while others display lower responses. To eliminate this non-uniformity, non-uniform correction is required. The method we employed was as follows: For the same scene image, each column represents a detector element, and each detector element is composed of several pixels. In theory, their response values should be the same. Therefore, we first calculated the average response value for all detector elements, and then computed the response value for each individual detector element.
To achieve this, we obtained a correction factor, k
i, for the i-th detector element by dividing its average response value by the average response value of all detector elements. Next, we multiplied all pixel values on this detector element by its corresponding correction factor, resulting in corrected values for all pixels within this detector element. An analysis of the figure revealed significant variations in the response of the probe elements. The image obtained after correcting the non-uniformity of this scene image is shown in
Figure 8, and the DN value of a single line of the blackbody image is presented in
Figure 9 after correction. Abnormal values were then eliminated through the removal of blind elements and flicker elements, resulting in a very uniform image.
Then, the radiometric calibration coefficient of the thermal infrared band could be obtained by using the high-temperature and low-temperature blackbody image data. The calibration coefficients obtained from onboard calibration are shown in
Table 5.
3.2. Vicarious Calibration
In July 2022, radiation synchronous measurements were conducted in and around Ulansuhai Nur. The ground-off radiance, emissivity, and temperature of ground targets were obtained synchronously using a 102F portable Fourier-transform thermal infrared spectrometer and an SI-111 infrared temperature sensor. In addition, the atmospheric constituents, such as water vapor, aerosol, ozone, and others at the time of satellite transit, were measured using a CE318 automatic solar photometer and an ozone meter. Subsequently, the radiative transfer model, MODTRAN, was incorporated, in combination with the reanalysis data database provided by ECMWF ERA5 (European Center for Medium-Range Weather Forecasts Reanalysis 5) and the atmospheric profile information provided by the sounding balloon. The TOA radiation brightness of the satellite payload was computed, and the on-orbit radiation calibration coefficient was determined using the satellite payload observation DN value. Finally, the calculated calibration coefficient was applied to compute the TOA radiance of the satellite to obtain the vicarious calibration accuracy.
The data collected in this study were primarily collected from Ulansuhai Nur, which is located in the Wulat Front Banner, Bayannur City, Inner Mongolia Autonomous Region. Ulansuhai Nur, a saline lake created by the diversion of the Yellow River, covers a total area of 300 square kilometers and is one of the eight largest freshwater lakes in China. The lake has an average water depth of 1.5 m, reaching approximately 4 m at its deepest point. Ulansuhai Nur was selected as the thermal infrared calibration source for ZY1-02E after scientific analysis because of its large water area, high specific heat capacity, uniform temperature distribution, and stable changes. In addition, the Baotou National High-Resolution Remote Sensing Integrated Calibration site and Kubuqi Desert were selected as the thermal infrared verification sources for the ZY1-02E satellite to test the accuracy of the calibration. The measured data included radiance, temperature, emissivity, aerosol, and atmospheric profile data. The layout of some instruments is shown in
Figure 11.
The 102F portable Fourier-transform thermal infrared spectrometer was used to directly obtain the emissivity of the target ground object, as shown in
Figure 12. In combination with the measured atmospheric data, the corresponding TOA radiance was calculated with radiation transmission, as shown in
Table 6.
Regarding the atmospheric profile data from the ECMWF reanalysis, the maximum spatial resolution provided was 0.1° × 0.1° with a temporal resolution of 1 h. Conversely, the spatial resolution of the infrared spectrum of the satellite to be calibrated was relatively high, and the transit time of the satellite was generally not the same as the time of the data provided by the reanalysis data. Therefore, the ECMWF data needed to be spatiotemporally interpolated.
From the radiances of the typical ground objects (such as bare soil) in Ulansuhai Nur and its surrounding areas, as well as the corresponding remote sensing image count values, the calibration coefficient of the satellite sensor could be calculated using Formula 2. The effective results are shown in
Table 7.
4. Discussion
Before launch, the instrument’s design and production unit completed laboratory calibration of the infrared radiometer, primarily to calibrate several critical indicators of the instrument. Even though environmental simulations were carried out, the instrument’s calibration setting greatly differed from the in-orbit space environment. Therefore, the calibration results were challenging to apply to the post-launch situation, and this paper did not compare them with the on-orbit calibration method. Despite the calibration accuracy of the satellite blackbody being affected to some extent by factors such as violent vibration during launch and changes in the environment, it still held some significance for correction.
Figure 13 shows the corresponding fitting curve of the calibration coefficient obtained from onboard calibration and vicarious calibration.
To verify the accuracy of onboard calibration and vicarious calibration, we used two different verification methods for verification.
4.1. Validation Based on Surface Synchronous Measurement Data
The corresponding TOA radiance obtained with a radiation transmission simulation calculation with the ground measurement data was compared and verified. The results are presented in
Table 8.
In this study, we selected three distinct natural features (sandy land, vegetation, and desert) as validation sources. From the satellite thermal infrared imagery, we extracted the mean DN value for each region. We then used the onboard calibration coefficient and the vicarious calibration coefficient to compute the onboard TOA radiance. This radiance was then compared and validated against the corresponding TOA radiance, which was calculated using ground measurement data through radiative transfer.
The validation results demonstrated that the amplitude deviation of the vicarious calibration outcomes was less than 0.15 W·m⁻2·sr⁻1·μm⁻1 at the specified validation point. In addition, the amplitude value calculated from the calibration coefficient oscillated around the amplitude value inversion according to the ground synchronous measurement data. This performance was notably superior to the onboard calibration results, which exhibited a significant deviation.
4.2. Cross-Validation
To further validate the radiometric calibration results, we selected thermal infrared image data from Landsat-8 and MODIS for cross-validation. We employed resampling and spectral matching operations to achieve uniform pixel sizes and minimize errors arising from spectral differences. Due to the extensive area of Qinghai Lake, we randomly selected 200 points to compare the radiance across different images. By contrast, due to the restricted size of the Hala Lake, 30 points were randomly selected to compare the ancillary brightness values of these points for varying images. The specifics are detailed below.
4.2.1. Cross-Validation with Landsat-8
The ZY1-02E and Landsat-8 satellites concurrently passed over Qinghai Lake at noon on 19 November 2022 and 21 December 2022. We selected the synchronous images from these two dates to cross-validate the radiometric calibration coefficients of the ZY1-02E satellite. The selected research area is displayed in
Figure 14. The results are presented in
Figure 15, and the precision indices are depicted in
Table 9.
The analysis revealed that the verification result of the onboard calibration coefficient Aaccuracy was approximately 8%. The root-mean-square relative error (RMSRE) was also approximately 8.5%. By contrast, the verification results for the vicarious calibration coefficient indicated that the Aaccuracy was less than 1%, and the RMSRE was similarly below 1.5%. This demonstrated that the vicarious calibration coefficient’s accuracy surpassed that of the onboard calibration coefficient.
4.2.2. Cross-Validation with MODIS
We selected synchronous images from the ZY1-02E and MODIS satellites, captured over Qinghai Lake and Hala Lake, to validate the radiometric calibration results of the ZY1-02E satellite. The selected research area is shown in
Figure 16. The results are depicted in
Figure 17, while the precision indicators are presented in
Table 10.
Cross-validation results using MODIS appear to be similar to those using Landsat-8. However, the accuracy at Hala Lake was marginally lower. This discrepancy might be attributable to the lake’s smaller area and the influence of thermal infrared information emanating from the surrounding shoreline. Upon examination of the radiance cross-validation diagrams, it was clear that, following spectral matching, the radiance value of the ZY1-02E thermal infrared channel, calculated using the vicarious calibration coefficients, exhibited minimal deviation from the corresponding point of the reference satellite. By contrast, considerable disparities were present between the radiance values computed with the onboard calibration coefficients and those of the selected standard satellites.
The surface synchronous measurement data verification and cross-verification results demonstrated that, when compared with thermal infrared images corrected by Landsat-8 and MODIS, the radiance obtained from the onboard calibration results showed fluctuations around the corresponding point radiance of the standard satellite image. However, the radiance obtained from the onboard calibration results was consistently lower than the standard satellite value. While both methods had errors, the uncertainty of the onboard calibration was greater. The deviation of the fitting line reflects the approximation between the calibration result and the reference value, and indirectly reflects the accuracy of the calibration result. Verification based on synchronous measured data showed that the radiance deviation of the vicarious calibration was generally less than 0.15W·m−2·sr−1·μm−1, and the percentage of radiance deviation was generally better than 1.5%. Cross-validation showed that the radiance deviation of the vicarious calibration was generally less than 0.2W·m−2·sr−1·μm−1, and the percentage of radiance deviation was generally better than 1.5%. However, the onboard calibration deviations were relatively large.
Potential explanations for this discrepancy included the calibration of satellite components being influenced by various factors, such as intense vibrations during launch, calibration errors propagating and expanding during subsequent calculations, the non-uniformity and instability of blackbody temperature control affecting high-temperature and low-temperature measurements, dark current correction and deep space observations not being conducted during the on-orbit calibration, the degradation of the radiation characteristics (e.g., emissivity) due to ultraviolet radiation and pollutants in outer space, and the self-attenuation of other device components. Moreover, errors originating from factors such as spatial resolution, observation time, and the inconsistent spectral response of sensors could not be disregarded during the radiance cross-validation process, even with large, uniform ground objects and images closely matched to sensor spectra. Further investigation is needed to more understand and address these issues in order to enhance calibration accuracy for satellites.
5. Conclusions
In this study, we compared the onboard calibration and vicarious calibration methods for the thermal infrared channel of the ZY1-02E satellite. The former method employed the high-temperature and low-temperature blackbody technique, while the latter relied on various natural features. Furthermore, we used the measurement data to assess the approximate degree of the radiance calculated by the calibration coefficient to the reference radiance. At the same time, the accuracy of onboard and vicarious calibration methods was evaluated using a cross-validation procedure to facilitate comparison of the advantages and disadvantages of each calibration method. For the accuracy verification method dependent on measured data, we selected different types of surrounding natural features (e.g., sandy land, vegetation) to evaluate the radiometric calibration. The results indicated that the percentage deviation of vicarious calibration results was superior, at less than 1.5%, while the deviation of the onboard calibration results was larger. For cross-calibration, distant natural features such as Qinghai Lake and Hala Lake were selected to verify the calibration results. The findings indicated that the vicarious calibration results closely matched those of the standard sensor, with RMSRE generally within the range of 1.5%, whereas the onboard calibration results significantly differed from the standard sensor.
With the advancement of satellite remote sensing quantification, the need for absolute radiometric calibration is increasing. However, China’s onboard calibration technology for thermal infrared remote sensors is still imperfect, and vicarious calibration remains the primary method [
20]. Onboard calibration provides high-frequency radiometric calibration and correct short-term equipment changes, while it is less reliant on external conditions. Nonetheless, severe vibrations during satellite launch and space environment changes can lead to calibration equipment to attenuate or damage, making replacement challenging and leading to large errors. The absolute radiometric calibration method based on various natural features using on-orbit vicarious calibration has several advantages. Firstly, it is not affected by changes in the space environment before and after launch and achieves the absolute calibration of the remote sensor under the same conditions as ground image acquisition under operational states. Secondly, it is not constrained by spectral matching between the satellite and the ground, resulting in high calibration accuracy. However, synchronous observations are required at radiation correction fields or large areas of uniform ground objects, which can be costly, and calibration frequency is limited. In the future, high-precision, slow-attenuation spaceborne calibration technology, and high-frequency, easy-to-implement vicarious calibration technology will become the development trend of on-orbit radiometric calibration technology. This progression will enhance satellite radiometric calibration’s accuracy and efficiency, accelerating global space development.


 and
and 


