Technical Note

Fracture Electromagnetic Radiation Induced by a Seismic Active Zone (in the Vicinity of Eilat City, Southern Israel)

1
The Department of Civil Engineering, Sami Shamoon College of Engineering, Ashdod Campus, Ashdod 77662, Israel
2
Physics Department, Ben-Gurion University of the Negev, P.O.B. 653, Beer-Sheva 8410501, Israel
3
Department of Earth and Environmental Sciences, Ben-Gurion University of the Negev, P.O.B. 653, Beer-Sheva 8410501, Israel
*
Author to whom correspondence should be addressed.
Remote Sens. 2023, 15(14), 3639; https://doi.org/10.3390/rs15143639
Submission received: 3 June 2023 / Revised: 3 July 2023 / Accepted: 19 July 2023 / Published: 21 July 2023
(This article belongs to the Special Issue Geological Applications of Remote Sensing and Photogrammetry)

Abstract

:
This paper deals with the quantitative analysis of measured fracture-induced electromagnetic radiation (FEMR) near the Dead Sea Transform using the Angel-M1 instrument, which enables the recording of FEMR signals in a 3D manner. The results showed both the possibility of estimating the sizes of micro-fractures that are the sources of radiation and assessing the direction of the fractures’ locations to the measuring device, as well as the range of magnitude (Mw) of the impending “events” (EQs) associated with the FEMR measurements. Moreover, the relation between the measured FEMR activity (the number of FEMR hits per unit of time) and the FEMR event magnitudes showed consistency with the Gutenberg–Richter relationship for the region. Such measurements could therefore constitute a preliminary ‘field reinforcement’ towards a valid EMR method for a real earthquake forecast, which would provide much earlier warnings than seismic methods. The observed FEMR measurements could only be used to assess the stress concentrations and micro-fracturing in the region since they related to the very initial nucleation phase of a “virtual” earthquake. Nonetheless, they provide the necessary feasibility test for a forecasting method since all of the lab-measured FEMR features were confirmed in the field.

1. Introduction

It is well-known that the Eastern Mediterranean and the Near East have experienced many earthquakes (EQs) over hundreds of thousands of years [1]. For example, Jerusalem, Jericho, Ramle, Tiberias, and Nablus were heavily damaged in 1927, when approximately 300 houses collapsed and the Church of the Holy Sepulcher and the al-Aqsa Mosque were damaged. Written records of EQs in China and Japan date as far back as 3000 and 1600 years, respectively [2]. On average, 10,000 people die yearly from earthquakes [3]. During only one year (30 March 2022–30 March 2023), the Mediterranean region and areas in close vicinity were shaken by seven EQs of magnitude 6.0 or above (the biggest EQ of magnitude 7.8 took place in Central Turkey on 6 February 2023).
The view that “understanding how earthquakes occur is one of the most challenging questions in fault and earthquake mechanics” [4] is not an overstatement. Despite intensive research, including studying the acoustic emission process associated with micro-fracturing [5,6,7,8,9], many aspects of these phenomena are still unknown. It has been debated whether EQs begin as small dynamic instabilities that develop into larger fractures (the “cascade” model), as a slow but accelerating aseismic slip that eventually reaches a critical size and then develops into a failure (the “pre-slip” model), or a combination of the two models [10,11].
Thus far, no reliable method for early EQ forecasting has been found [12,13] using the common seismic measurements. It has been established that such an accurate early forecast cannot be achieved based only on seismic measurements due to the high attenuation of the high-frequency seismic waves emitted at this stage [14]. The two “so-called” existing types of seismic forecasts are either statistical ones, which provide only probabilistic predictions, or “alarm systems,” which start to operate only when EQs have already begun. The latter systems are based on the dual seismic waves emitted when an actual EQ process is fully initiated. These two waves have different speeds. The first (longitudinal) P-wave, which causes no harm, moves at a velocity of ~3–6 km/s, while the damage-causing transverse S-wave is slower (its speed is approximately ~2–3 km/s), depending on the rock’s mechanical properties. Thus, an alarm signal is obtained by measuring the P-wave arrival before that of the S-wave. Such an alarm is inherently brief. It depends on the receiver’s distance from the hypocenter and the pre-catastrophic appearance. For example, using the velocity values typical for granite rock (Vp ≈ 5 km/s and Vs ≈ 2.7 km/s), the difference between the first arrival of these waves will be K = (Vp − Vs)/(Vp × Vs) ≈ 0.17 s/km. Hence, people located 5 km from the hypocenter would have an approximately 0.85 s foreknowledge of the disaster, while even at 50 km, only a meager 8.5 s alarm is possible.
Over the past several decades, many precursors of EQs were targeted to build a reliable early EQ forecast, e.g., [15,16]. It has recently been accepted that one of these precursors, i.e., electromagnetic (EM) phenomena, does occur before an EQ, e.g., [17,18]. It does allow for the real-time monitoring of fracture evolution during mechanical loading from incredibly early stages of failure nucleation [19,20]. Moreover, the distribution of fracture electromagnetic radiation (FEMR) signals matched the Gutenberg–Richter and Benioff relationships, such as the acoustic emission relationships [21,22]. Here, we carried out FEMR measurements “in the field” to establish feasibility proof of such measurements on the road to creating an FEMR EQ forecasting scheme.

1.1. FEMR State of the Art

FEMR measurements have been conducted in various laboratory studies using a wide-frequency spectrum (from the kHz band to the MHz band), e.g., [21,22,23,24,25,26,27,28,29,30,31,32,33,34]. The results of studies performed before 2021 are reviewed in [35]. On the geophysical scale, FEMR has been recorded before significant EQs [36,37,38,39,40,41,42]. The timely increase in FEMR intensity was a common characteristic in both the lab medium and on the geophysical scale. For example, the application of the FEMR method was shown to be incredibly useful for assessing the intensity of stress levels [43,44,45,46,47,48,49,50] and stress directions in underground openings [51] and for locating landslide-prone zones [52]. Studies on FEMR for defining stress field orientations are quite rare [52,53,54,55,56,57], though they are highly interesting for understanding features of neotectonics and seismic activity near active faults. References [52,53,54,55,56,57] showed that the FEMR direction accurately reflects the stress distribution near active reverse-type faults. However, no measurements of the combined features of fault fracturing and its locations in the field exist.
The theoretical basis for such measurements was considered in [58], where the process before the macro-slipping along the existing fault was classified into three nucleation stages, namely, (a) when micro-cracking in the weaker in-filling material occurs, (b) when the breaking strength of the asperities is high and the plates’ dilation occurs, and (c) when the asperities break (the last stage before an actual earthquake).
Here, we present FEMR measurements conducted at the southern part of a strike-slip fault of the Syrian-African Transform (the Dead Sea Transform) focused on the possibility of extracting both the fracture and field properties from the sole description of the EMR pulses. This region was selected for study as it is the most seismically active area in Israel and even in relation to the entire Syrian-African Transform [59,60,61,62,63].

1.2. The Eilat Region: Geology, Faults, and the Locations of Measurement Stations

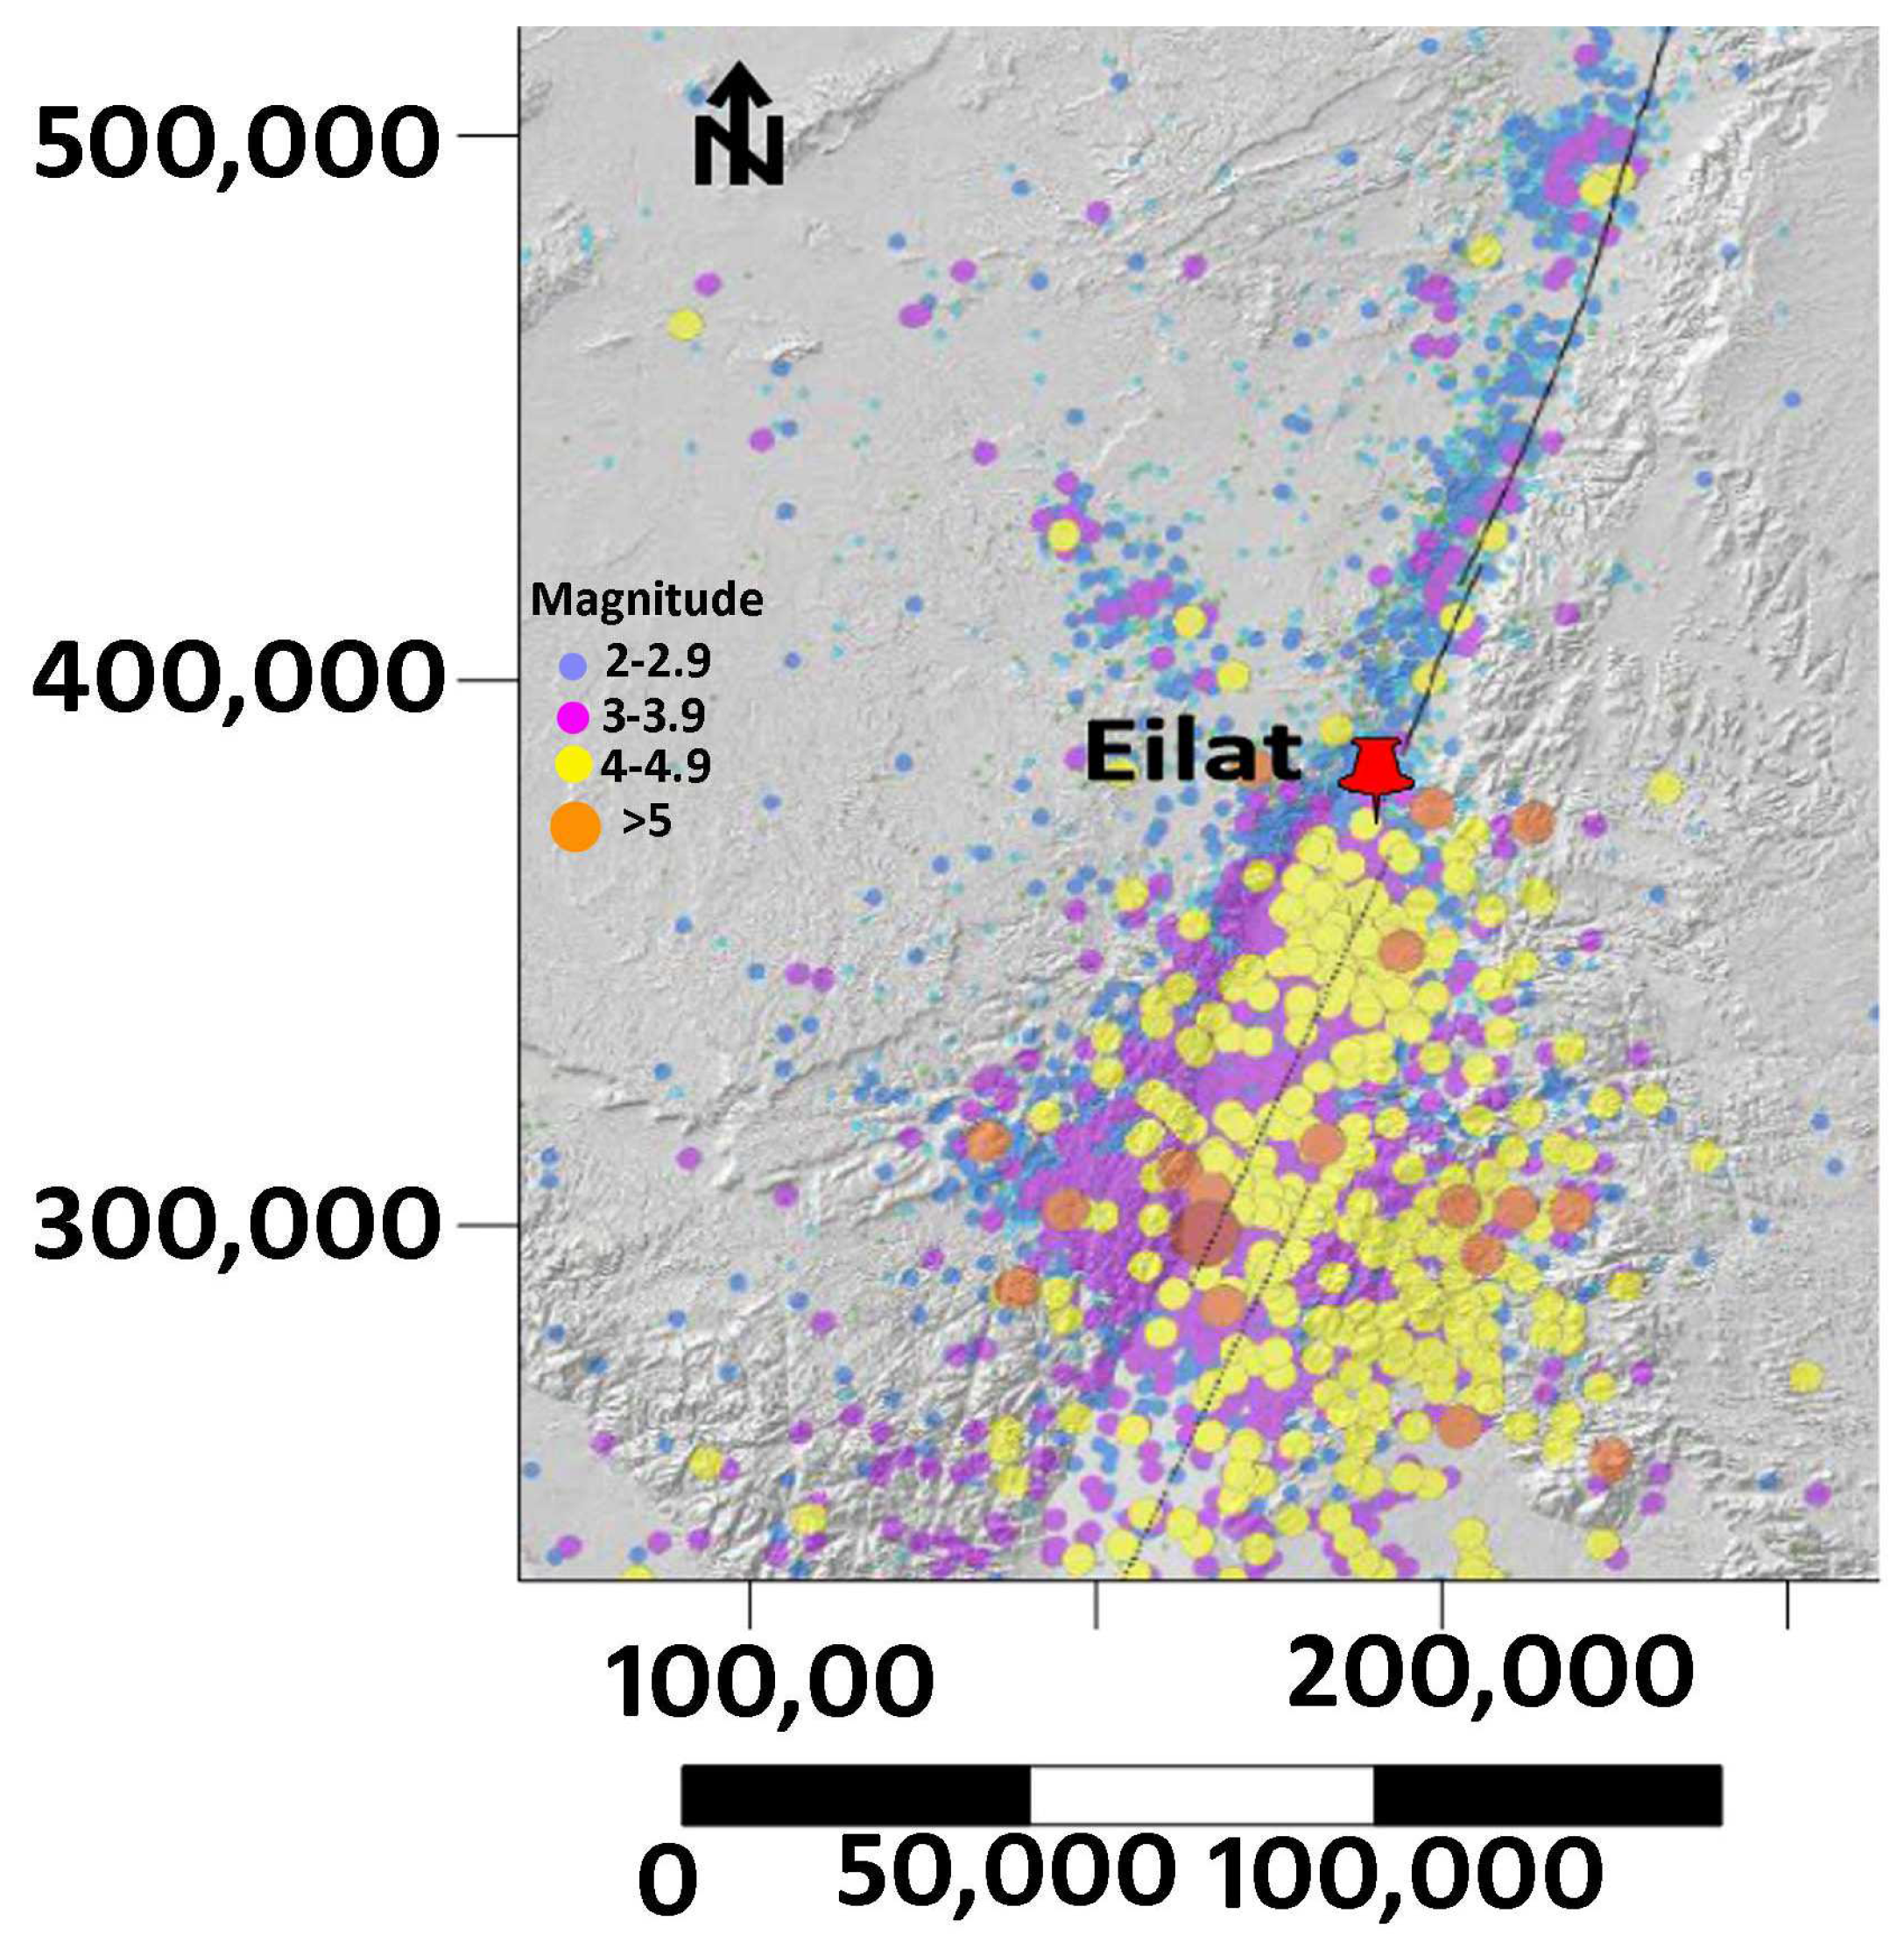
The measurements were conducted at three locations near the most southern Israeli city, Eilat (Figure 1). As noted above, this area is one of the most active seismic regions in Israel (Figure 2) [60]. The major geological structure in the Eilat area developed due to the tectonic activity associated with the rifting of the Red Sea and the Dead Sea Transforms [64]. The main faults, their branches, and the stress field in the region have been thoroughly described in various studies, e.g., [64,65,66,67]. All measurements were conducted at a distance of at least 2 km from the sources of artificial noise, including power lines, generators, and so on.
The EQs in this region are mainly associated with the southern part of the Syrian-African Transform fault and its active branches, which are shown schematically by the dashed lines in Figure 1.

2. FEMR Measurements Methodology in the Eilat Region

The Instrument and Method

The measurements were conducted using an ANGEL-M1 instrument manufactured by OAO VNIMI in Russia, which is an upgraded version of the ANGEL-M apparatus described in detail in [55,56,69]. It is a portable measuring device for FEMR recording in in situ and underground conditions in the frequency range 5–150 kHz. The difference between the upgraded version and that model used in references [55,56,57] is that the upgraded version has the ability to perform 3D measurements using three antennas simultaneously. Despite this apparatus being developed for mines and the frequency range being optimized for the goal of rock-burst warnings, it showed a high level of efficiency in various surface applications related to stress assessment at the geophysical scale [52,55,56,57]. We noted that the higher frequency of measurements correlated to the earlier stage of EQ preparation and vice versa.
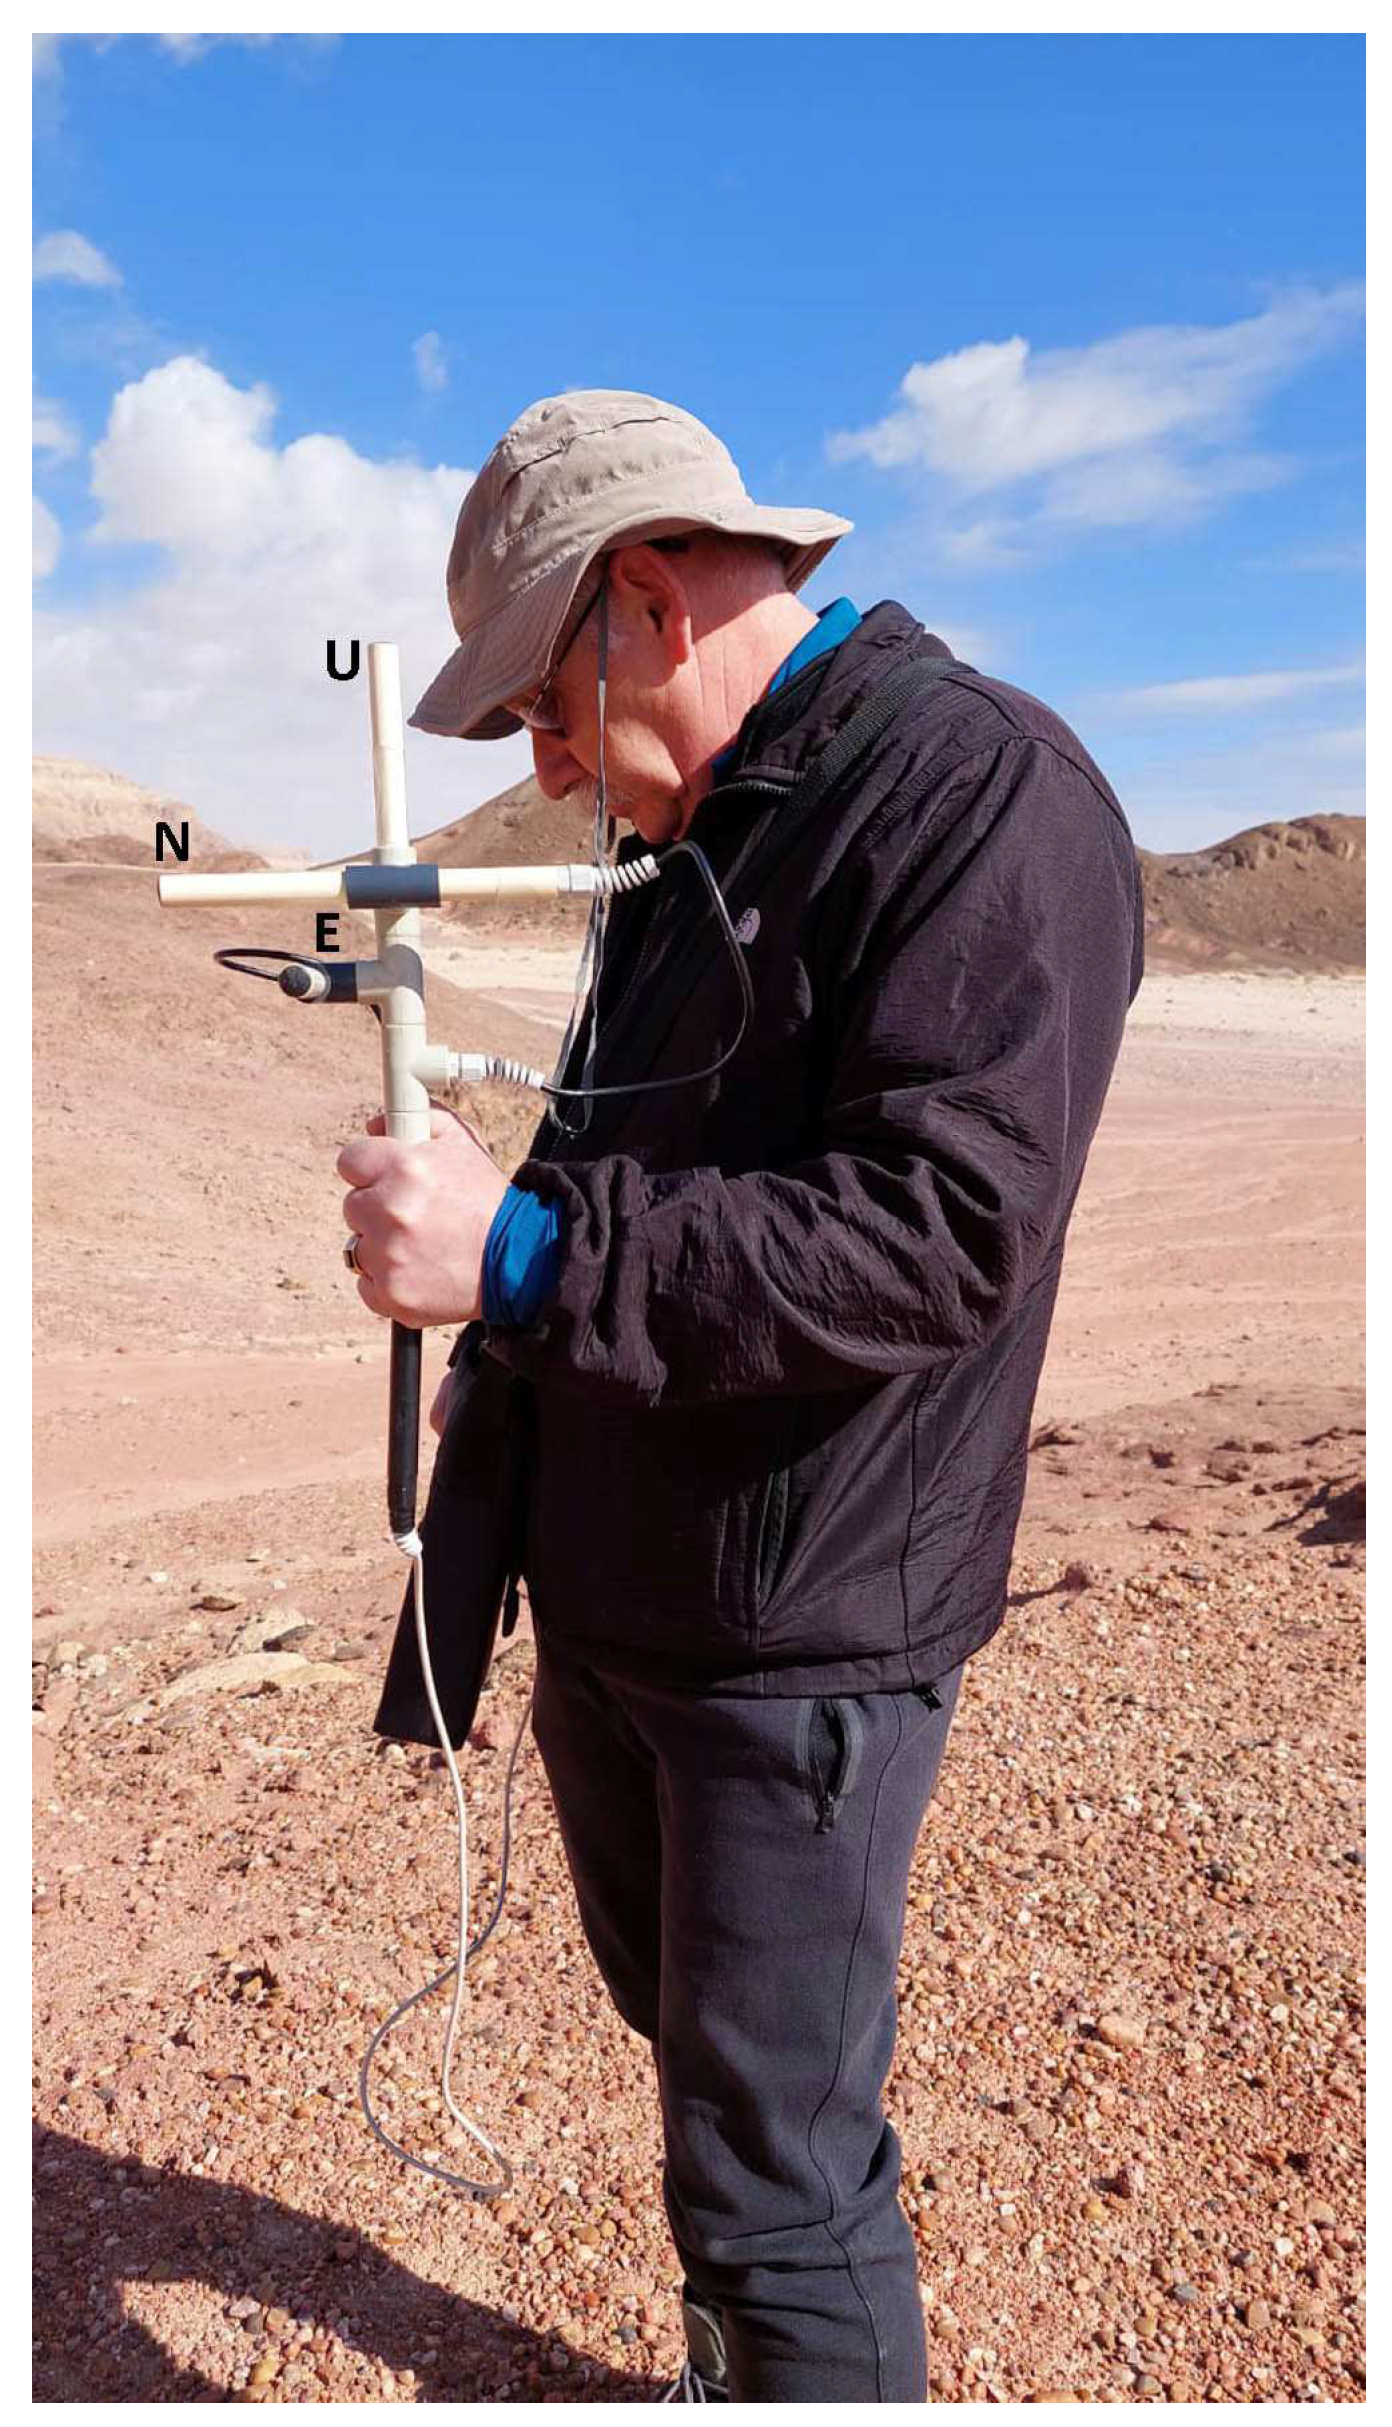
Figure 3 shows an example of a measurement using the upgraded version of the instrument in Timna Park.
Before each measurement, the antennae were oriented to the up (channel 1), north (channel 2), and east (channel 3) directions. The duration of each measurement was 10 s, and 20 measurements were carried out at each location. The measured data were saved on the instruments’ hard disks and then downloaded to a PC for further processing. The original software package, Angel-Works, was used for the data filtering, while the data processing was completed using Origin software. The raw data, saved on the hard disk, were filtered, and individual pulses exceeding the average noise level by a factor of ~2.7 were examined. The methodology of the data analysis is presented in Section 3.

3. Results

We use our acquired analyzing lab methods [14,20,21,58,69,70,71] to obtain several conclusions about the fracturing process and its locations. Section 3.1 presents the obtained measurements, while the inferred results are presented in Section 3.2, Section 3.3, Section 3.4, Section 3.5 and Section 3.6.

3.1. The Results of the FEMR Measurements

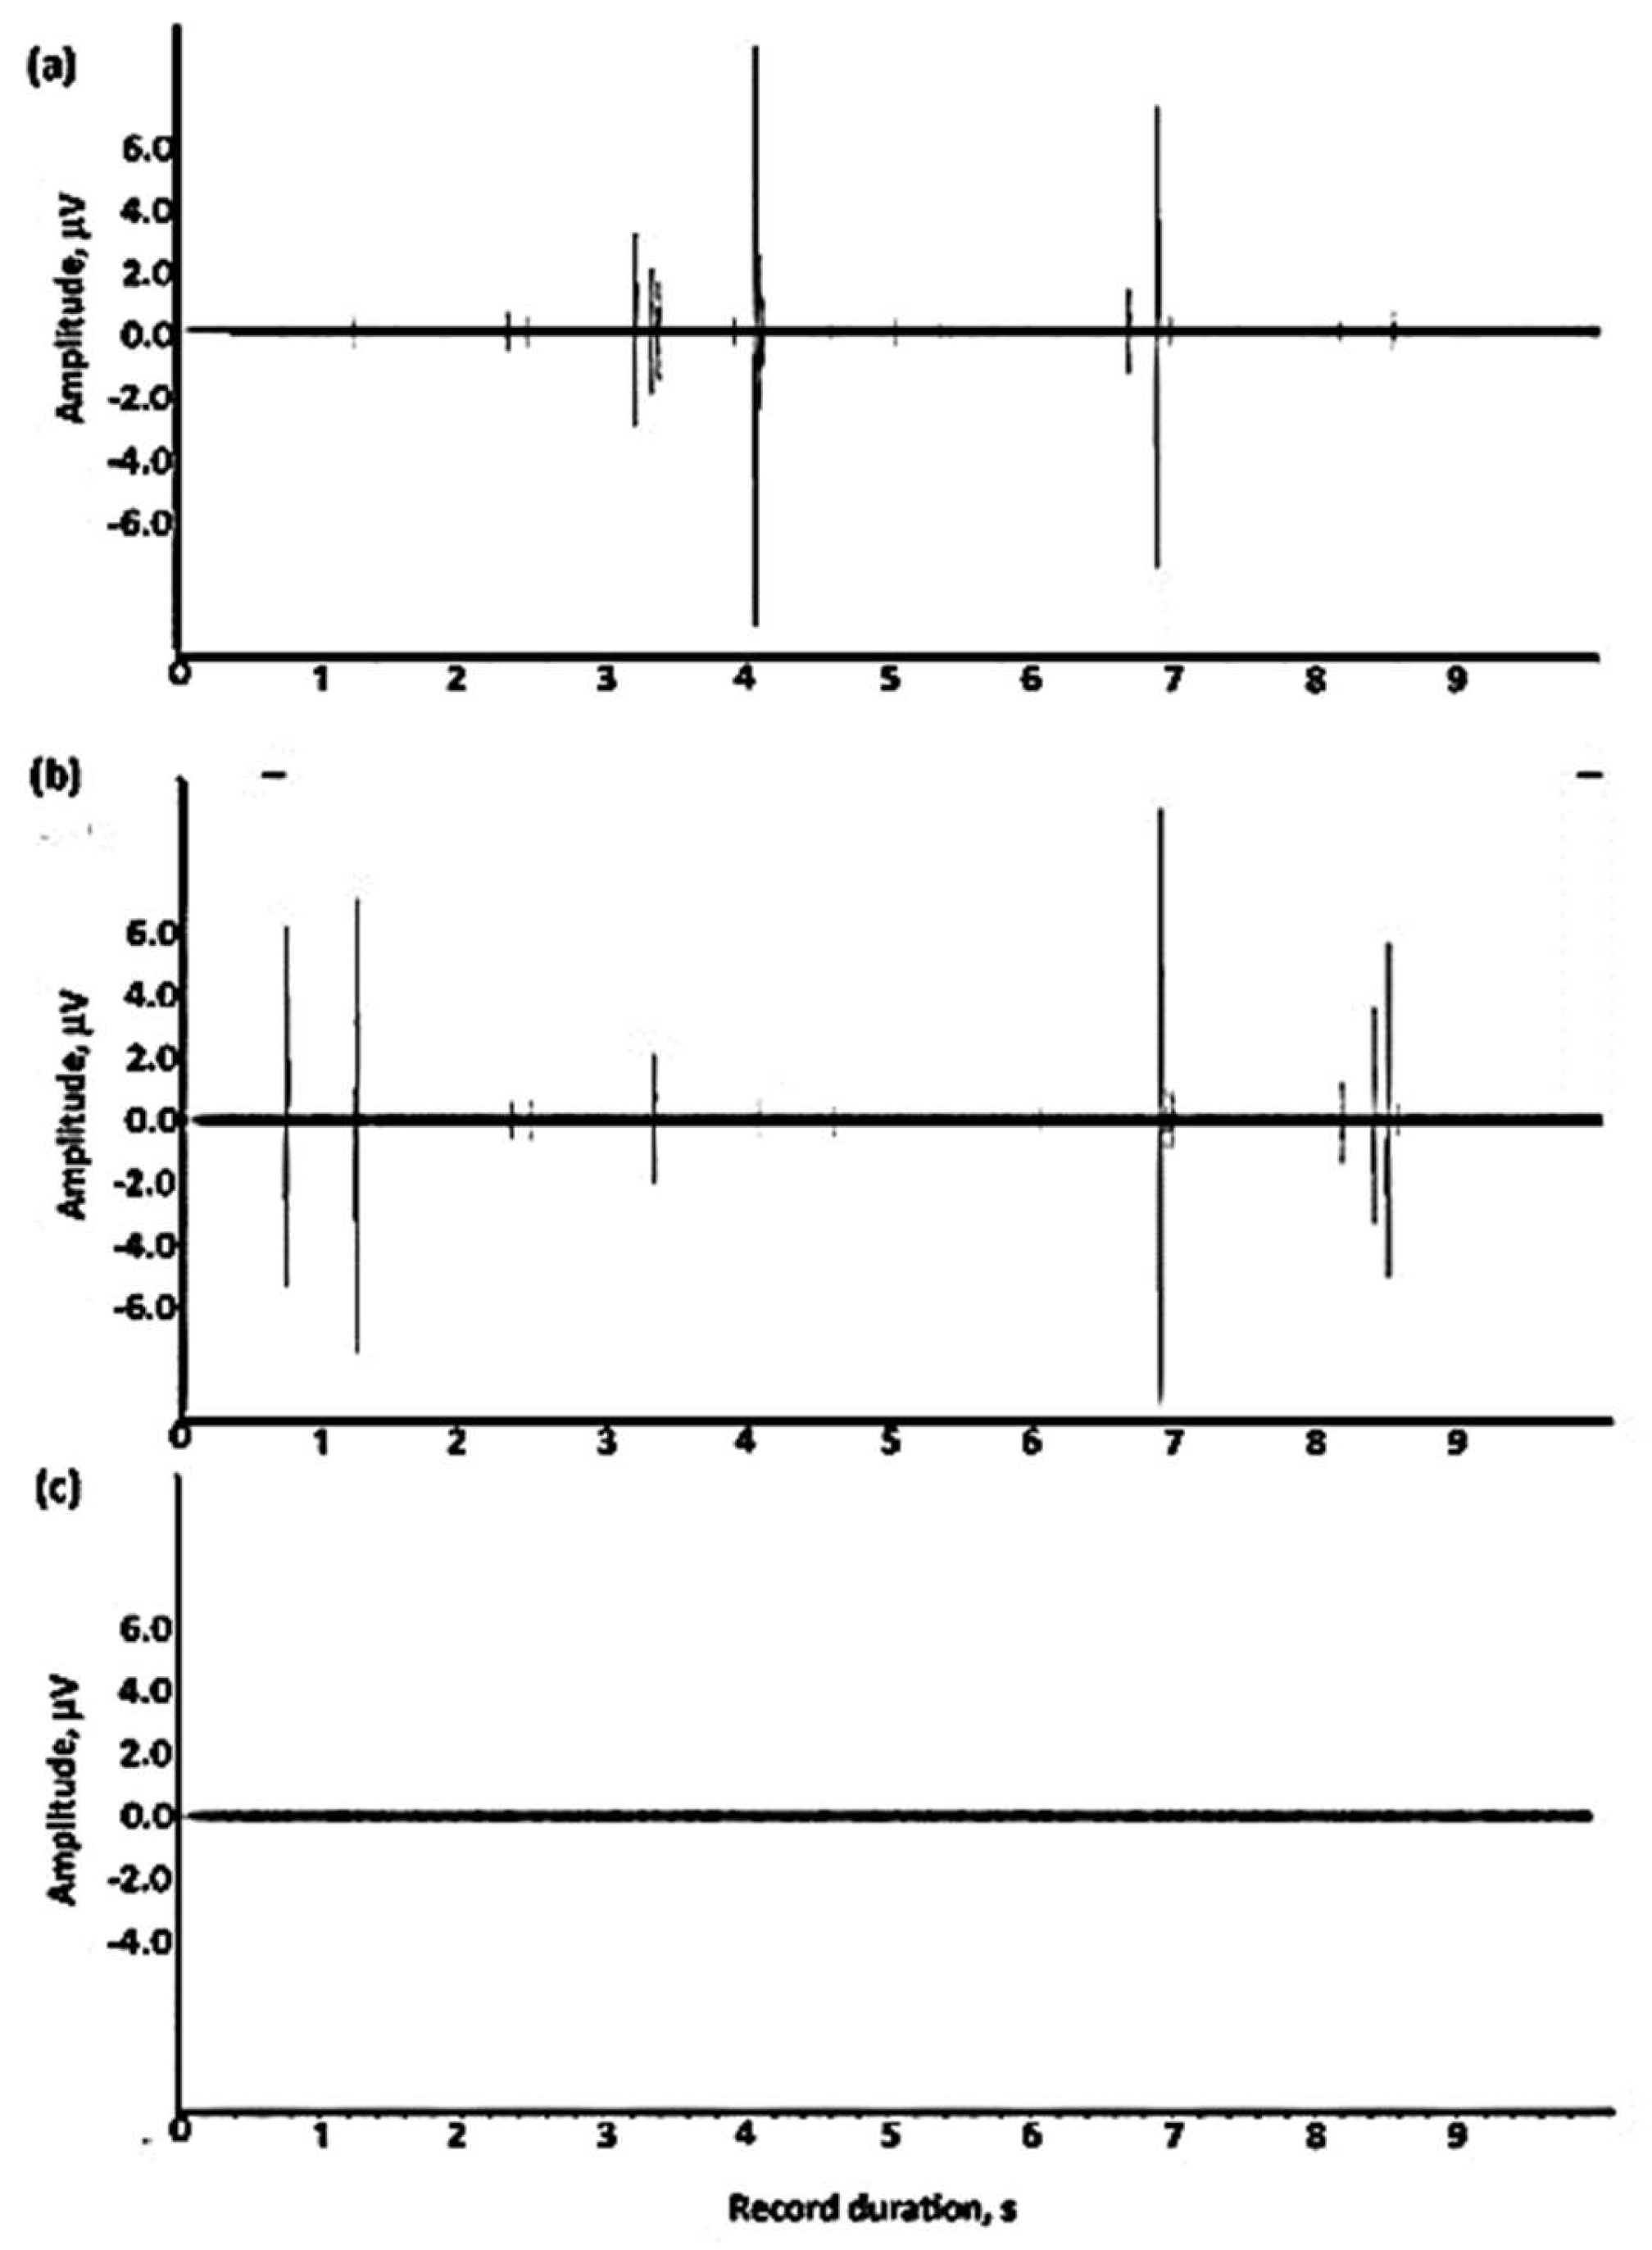
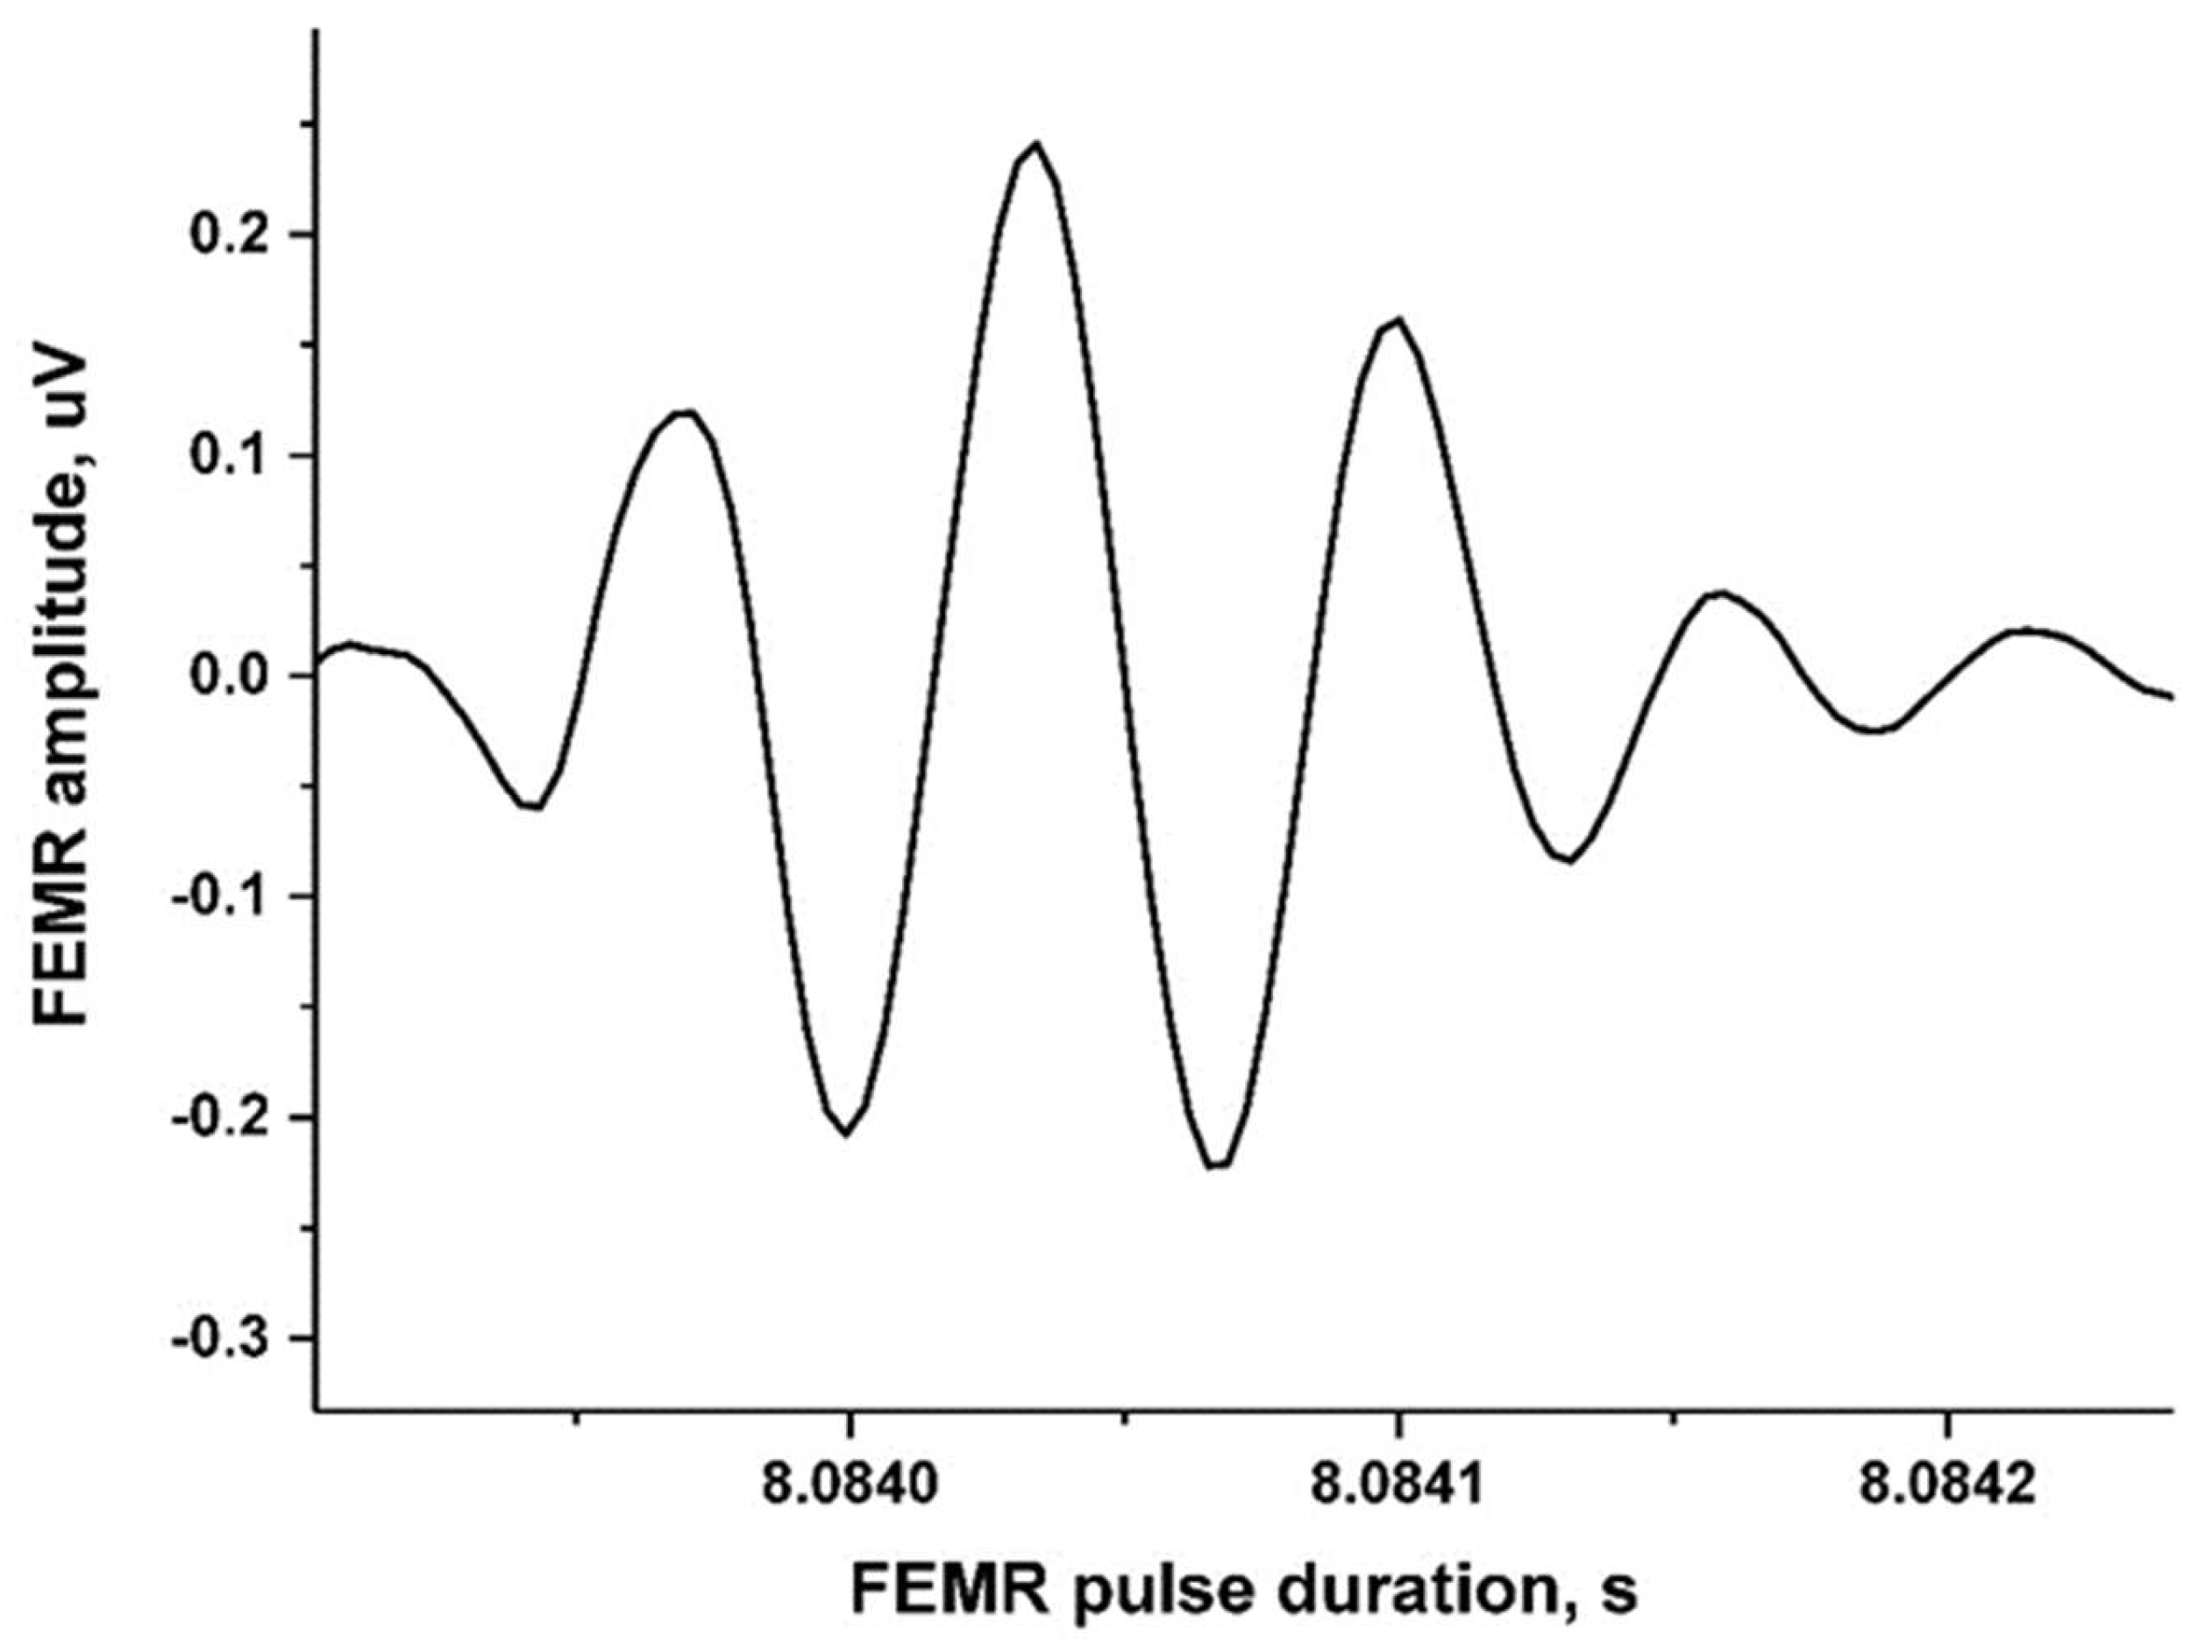
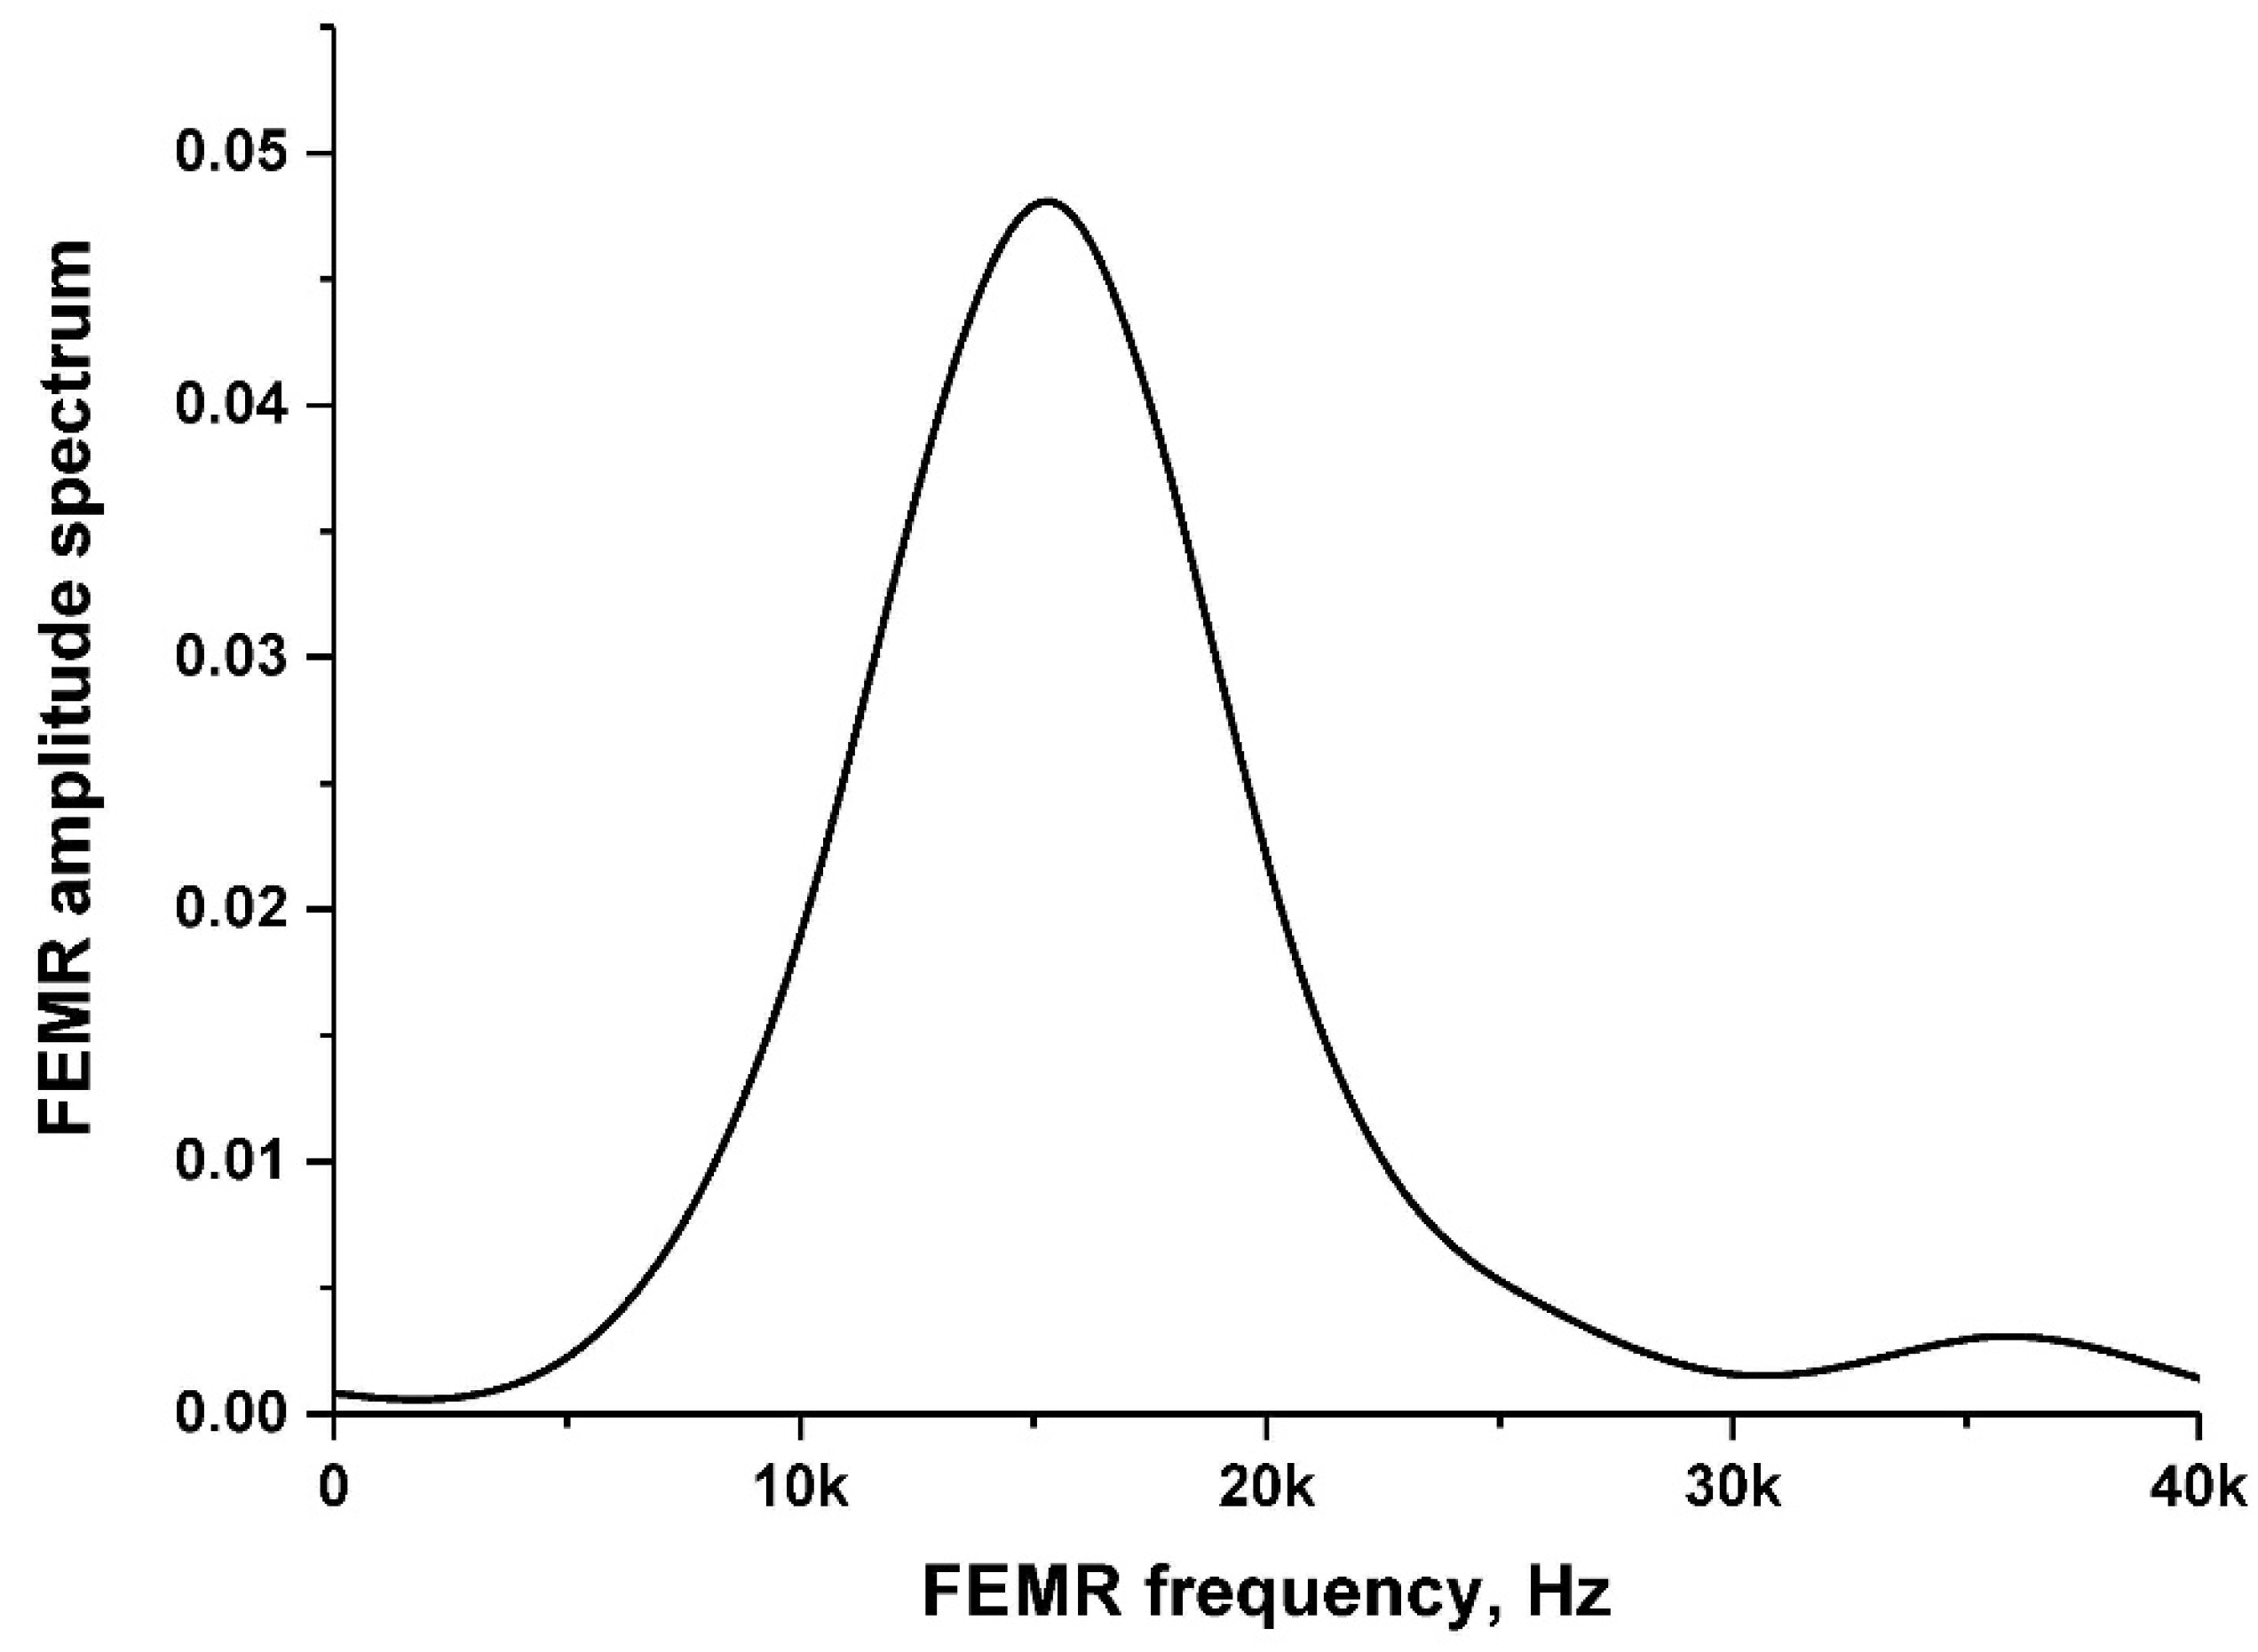
Figure 4 portrays an example of a 10 s sequence of FEMR pulses after bandpass filtering (5–50 kHz) at Timna Park (Figure 1). It was seen that the signal-to-noise ratio for each FEMR signal was high enough for further signal analysis. The amplitudes of the FEMR pulses recorded in situ by the Angel-M1 instrument were 10–20 µVolt, which was consistent with former FEMR results measured in similar regions of tectonic faults [55,56,57]. The FEMR amplitudes were shown to be caused by rock micro-fracturing [55,56,57]. Figure 5 portrays a zoomed-in example of a typical FEMR impulse while Figure 6 shows its frequency spectrum. It is worthwhile to emphasize that the shape of the FEMR signal was identical to those described in our previous laboratory studies (e.g., [70]), proving the consistency of the present study with that of the studies performed in a laboratory.
We note that the number of FEMR pulses shown in Figure 4 was approximately nine (depending on the amplitude’s threshold). Some pulses in the eastern channel coincided in time with pulses in the northern channel (e.g., at 7 s, as shown in Figure 4a,b). This observation meant that while the fracturing events inducing the pulses were in different locations, they occurred mostly in a northeasterly direction (see below). The average rates of the FEMR pulses (calculated based on 20 records from each region) were 6.4 ± 2.8, 8.2 ± 3.3, and 12.3 ± 10.9 pulses/10 s for Timna Park, Shlomo Wadi, and the Park of Birds, respectively. We note that parts of the records had vertical components while all had vertical amplitudes that were significantly lower than the eastern and northern ones.

3.2. The Source Amplitude of the Electromagnetic Field of the FEMR Signals

Following [70], the source electric field amplitude inducing the EMR signals reaching the antenna from the granite samples when the antenna was in close vicinity to the source was calculated by:
E = 3 × 10 9 f 0.99 ± 0.04 ,
where E is the EMR field amplitude in mV/m and f is the EMR frequency in Hz.
The measured EMR frequency of all the obtained EMR pulses (e.g., those shown in Figure 6) in the Eilat region was 15–20 kHz, yielding source electric field amplitudes of between 150 and 200 V/m. The amplitudes of the electric E0 and magnetic H0 fields are related via the following expression:
E 0 = H 0 μ 0 ε 0 ,
where μ0 and ε0 are the values of the magnetic and dielectric permittivity of the free space, and the magnetic field amplitudes at the source are H0 ≈ 0.4–0.5 A/m.

3.3. Sources’ Distances

3.3.1. Attenuation Factor

The EMR field amplitude attenuation is given by [27]:
E = E 0 e α R ,
where the attenuation coefficient, α , is given by:
α = ω μ ε 2 1 + ( 1 + ( σ ω ε ) 2   ,
where:
ω = 2 π f ,
μ = μ 0 ( 1 + κ ) = 4 π × 10 7 ( 1 + κ ) H / m ,   and
ε = ε 0 ε r = 8.84 × 10 12 ε r F / m ,
and where κ is the value of the magnetic susceptibility, σ is the value of the electrical conductivity, and ε r is the value of the dielectric permittivity. The measured values of these parameters in the Eilat region were as follows: κ = 25 , σ = 10 5 S m , and ε r = 5 , respectively, yielding α = 3.2 × 10 3  1/m.

3.3.2. FEMR Amplitudes at the Input of the Measuring Instrument and the Antenna Factor

As noted above, the electric field amplitudes of the FEMR pulses recorded in situ by the Angel-M1 instrument were 10–20 μVolt. The instrument’s gain was 18,000. Hence, the FEMR amplitudes reaching the instrument’s input from the antenna were of the order of (5–10) × 10−4 μV = (5–10) × 10−10 V.
The antenna factor (or correction factor, A F ) is defined as the ratio of the incident electromagnetic field E a n t _ i n p u t to the output voltage V from the antenna and the output connector, and it is given by [72]:
A F = 20 L o g E a n t _ i n p u t V a n t   v o l t   o u t p u t = 19.8 G d B 20 L o g λ = 19.8 G d B 20 L o g c f ε r 80 d B / m ,
where G d B is the antenna gain, λ is the length of the EM wave, c is the speed of light, f is the frequency of the FEMR signal, and ε r is the dielectric permittivity.
Equation (5) yields the following: E a n t _ i n p u t = 10 4 V = ( 5 10 ) × 10 14 V m .
Therefore, according to Equation (3), the distance from the crack source to the antenna location (so-called “hypocenter” distance) can be evaluated as:
R = ( 1 / α ) L n ( E 0 E a n t i n p u t ) 5   km .
We note that this estimation was performed for the FEMR signals propagating through granite rock.

3.4. Crack Dimensions

Crack lengths and crack widths are related to FEMR signal parameters via two relationships [27,70,71], as follows:
{ b = V R 2 f l = V c r × T ,
where l and b are the crack length and width, respectively (m); V c r and V R are the crack and Rayleigh wave speeds, respectively (m/s); and T is the time from the FEMR origin until the maximum of the FEMR signal envelope.
Using the values of the Rayleigh wave and the crack speeds of the order of 2600 m/s and 2340 m/s [58], respectively, yields the following value for the crack width: b = 5 10   cm , and it also yields the following crack length (based on the estimated value of T′ of the order of 50–150 μs) : l = 10 35   cm .
Our previous estimation [58] showed that such crack dimensions correspond to seismic moment values of M0 ≈ 105 Nm, and based on the diagram developed in Ref. [73], the seismic moment magnitude of a (virtual) impending EQ is of the order of Mw ≈ (−3) to (−4).

3.5. The FEMR Source Direction

The 3D electric field emitted by the crack source of the FEMR is given by:
E = E 1 x   ^ + E 2 y ^ + E 3 z ^ .
Its amplitude is calculated as follows:
E = ( E 1 2 + E 2 2 + E 3 2 ) .
The amplitude was measured by the Angel-M1 instrument, while the indexes 1, 2, and 3 refer to the north, east, and up directions, respectively.
We thus defined the following:
c o s   α = E 1 E ,   c o s   β = E 2 E ,   c o s   γ = E 3 E   .
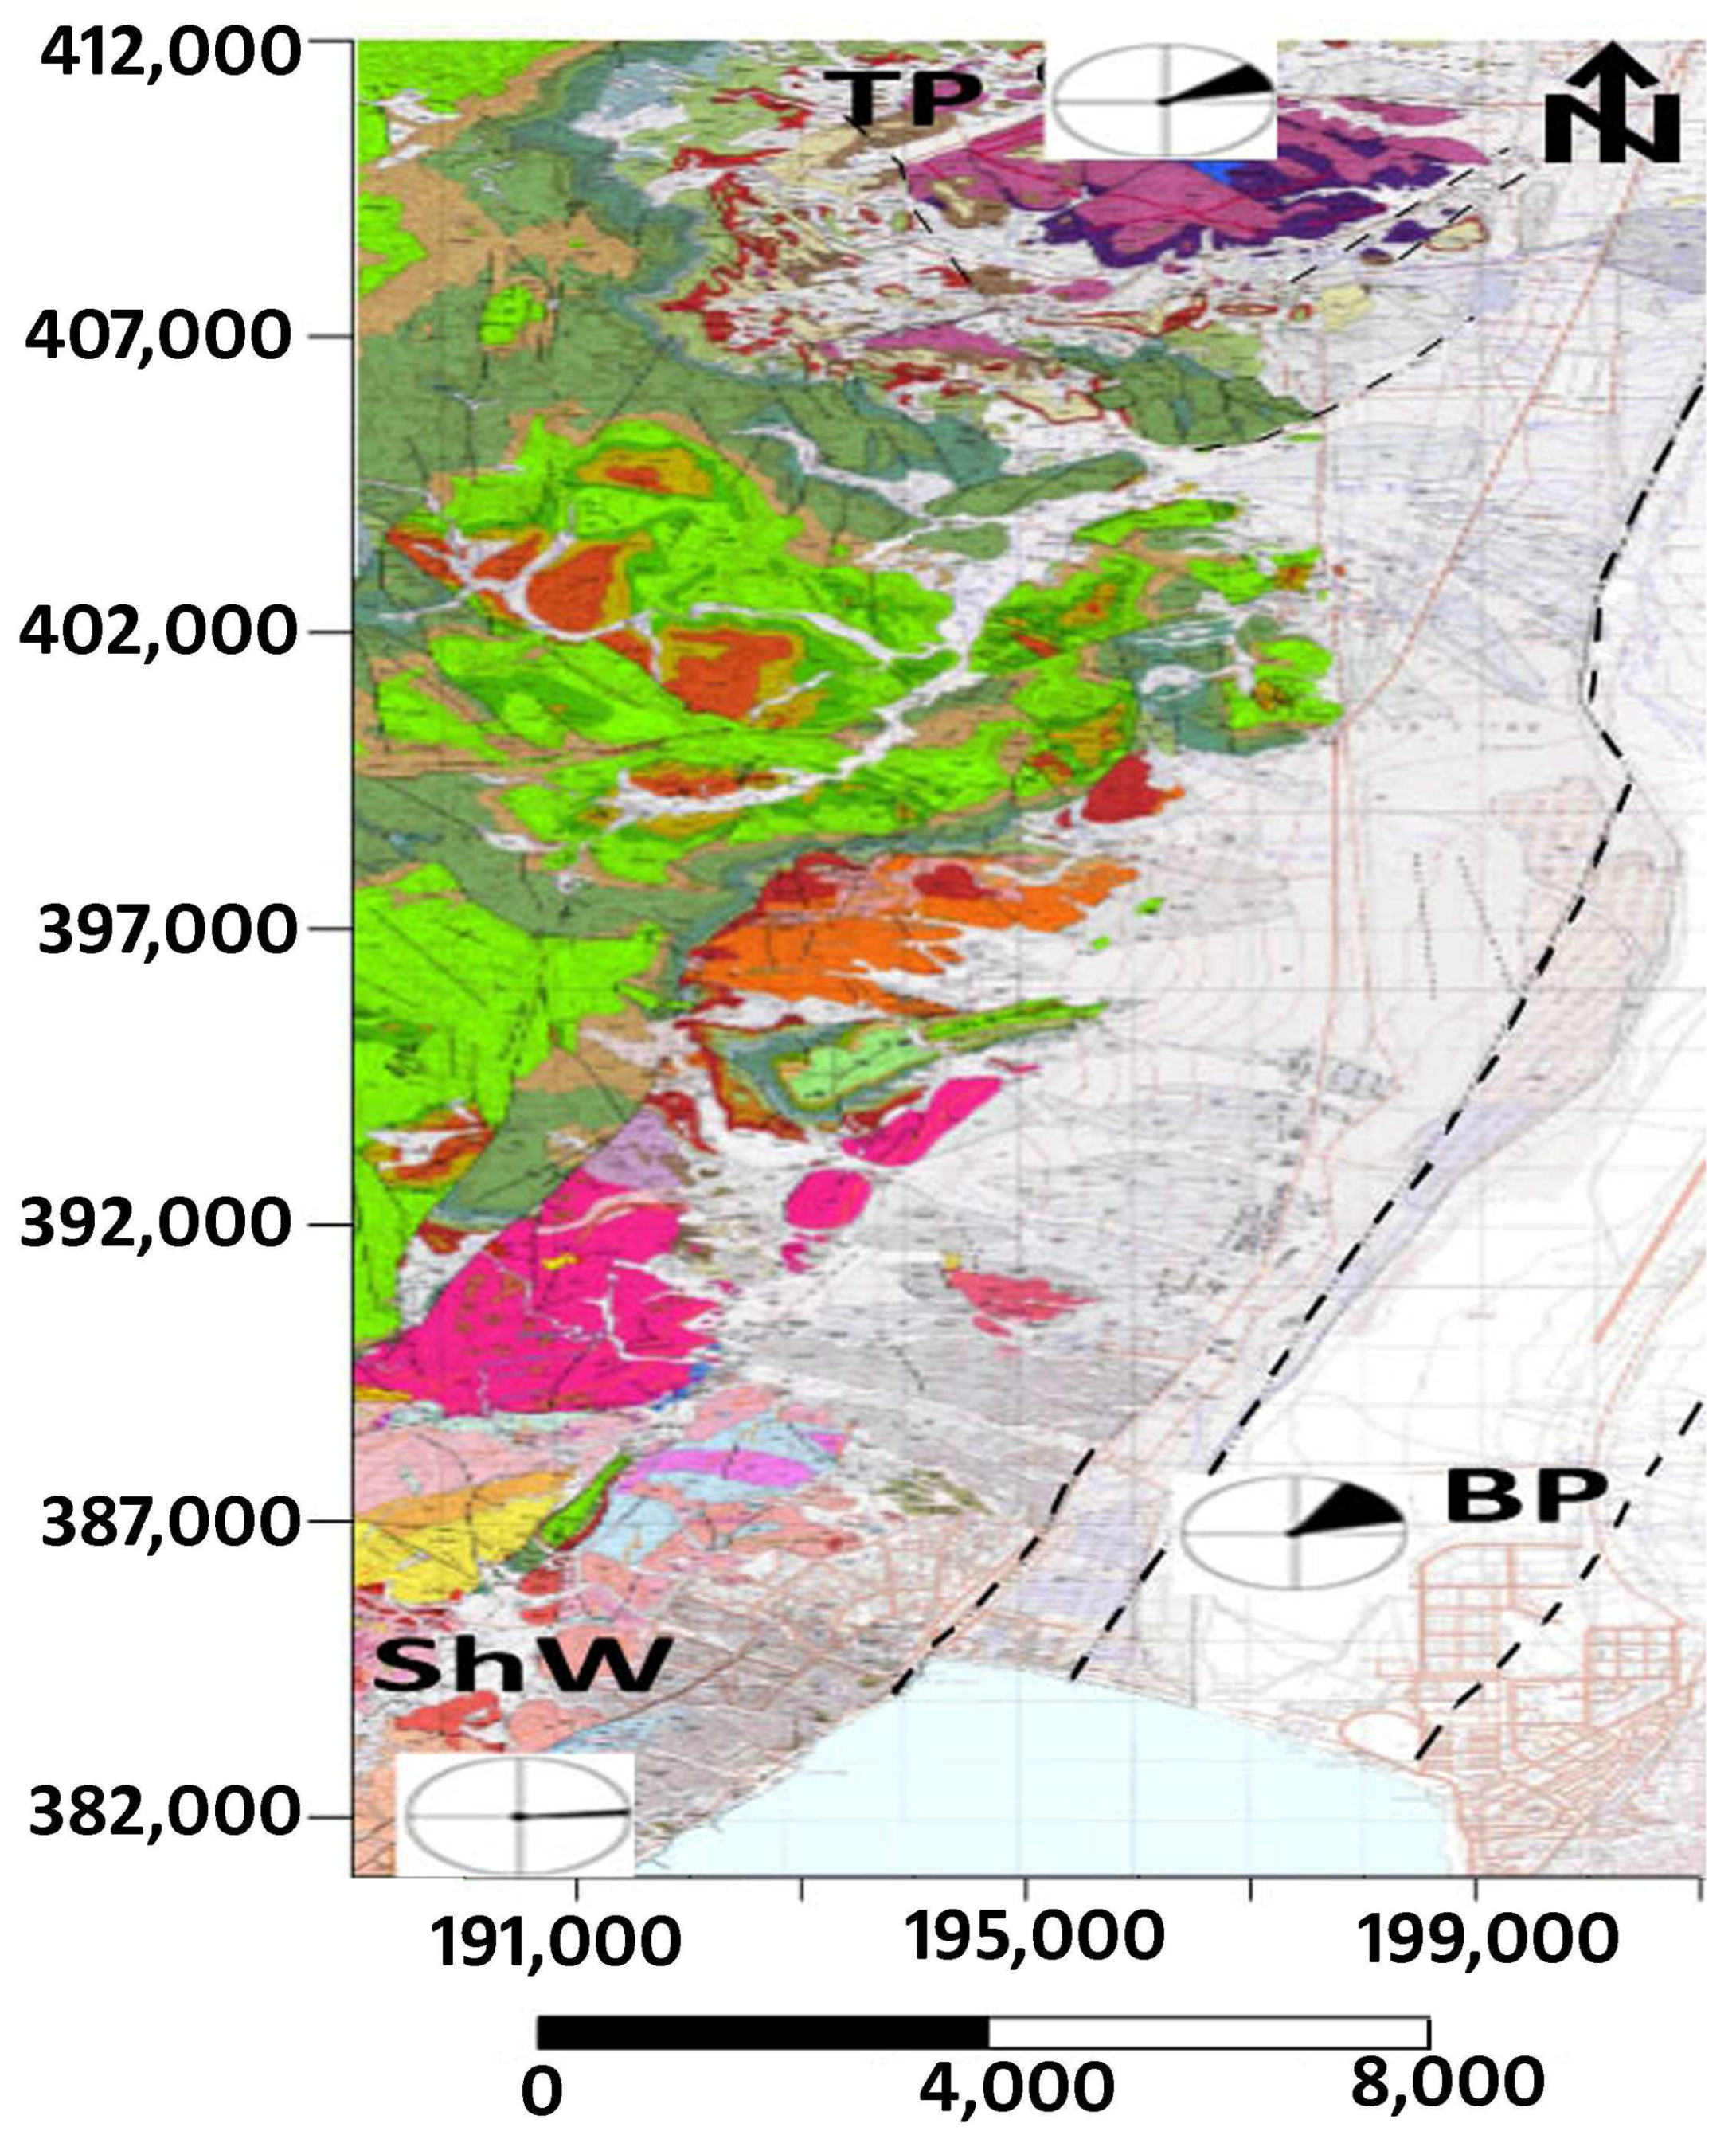
The values of these cosines were calculated from the respective amplitudes obtained by the three antennas in accordance with Equation (12), yielding the following directions from the different source locations to the measuring devices calculated on the basis of the average of 20 records in each measurement position:
  • Wadi Shlomo: 4–7° from the east and 83–86° from the north
  • Birds Park: 14–62° from the east and 28–76° from the north
  • Timna Park: 10–40° from the east and 60–80° from the north
Figure 7 shows the locations of the measurement points with superimposed rose diagrams of the FEMR directions to the signals’ sources.
It is seen that the directions to the FEMR sources clearly corresponded to the locations of the main active faults in the region (Figure 7). The amplitudes of the FEMR signals in the up and down antennas were quite low, indicating that the radiation from all locations was in the horizontal plane.
In summary, it was seen that the FEMR records in all three locations pointed in the direction of the Syrian-African fault.

3.6. The FEMR Activity

FEMR activity is defined as the number of FEMR signals per unit of time [69]. As noted above, the measurements were carried out during 10 s intervals, and the estimated magnitudes of the FEMR signals were of Mw ≈ (−3) to (−4). The methodology of the FEMR processing is presented in detail in [14], including accurate filtering and considering only those FEMRs of the specific characteristic shape. In addition, only those signals that exceeded the average noise level by a factor of Euler’s number (~2.7) were taken for further analysis.
It is known [60] that during a period of 30 years in Israel, 15,856 EQs occurred with the magnitudes Mw ≈ 0.5, implying that there were approximately 500 EQs per year with magnitudes larger than 0.5. Considering that changes in the magnitude of one unit mean a change in the number of events by a factor of 10, it can be estimated that the number of events with a magnitude of the order Mw ≈ (−3)–(−4) can be of the order of 1.5 × (106–107) per year or 0.5–5 events each 10 s. The analysis of the FEMR data showed that the average levels of FEMR activity (calculated based on 20 records from each region) measured by the Angel-M1 instrument for every 10 s of recording were 6.4 ± 2.8, 8.2 ± 3.3, and 12.3 ± 10.9 pulses/10 s for Timna Park, Shlomo Wadi, and the Park of Birds, respectively. The measured values agreed with the above estimates. The minimal FEMR activity was measured in Timna Park, approximately 3 km from the Syrian-African Transform. In contrast, the largest activity was measured in the Park of Birds, located within the boundaries of the Transform itself.

4. Discussion

Seismic global methods, such as the MOWLAS (Monitoring of Waves on Land and Seafloor) in Japan [74], are valuable assets for monitoring and understanding the nature of earthquakes and tsunamis. They can also be used for statistical estimates of EQ forecasting. Such statistical methods are termed “Probabilistic earthquake forecasts” [75]. Other schemes, e.g., machine learning (ML) methods for the experimental monitoring of water-level variations in wells and geomagnetic and tidal time series [76], are also used in such forecasts. However, only probabilities (and no warnings) before an actual catastrophe can be gathered from them.
There have been recent FEMR signals measured before EQs, mainly in the Athens Basin, Greece [77,78,79,80]. Baron et al. [81] conducted a six-month operation to measure FEMR signals in the Obir Cave in the eastern Alps to extract the relevant signals to create EQ predictions from them.
Methods using multidisciplinary precursors [82] or AI approaches to learn the relevant signals (see, e.g., [83]) have been promoted. These procedures, which can be valuable in EQ prediction, may use the present pulse shapes based on the cracks’ features as guiding elements.
We advocate the use of an FEMR method for real warnings, and the present measurements constitute a step forward in validating this technique, showing both the feasibility of these measurements and the ability to extract a myriad of quantitative facts (see enumeration a–f below) regarding the stress and possible pre-quake fault situation. We note that measurements of the FEMR phenomena carried out previously only focused on the magnitude and frequency of the pulses’ appearance, while the present study was the first one to use our lab experience, based on the actual shape of the pulses, to extract all these features.
The FEMR measurements were conducted near Eilat City, one of the most active seismic regions in Israel. Regarding the area’s seismicity, it is mainly associated with the activity of the Dead Sea Transform and its branches. Our investigation was carried out using 3D antennae (5–150 kHz) in three locations. The obtained results, based on lab-developed analyzing methods, showed that:
  • The range of micro-fracture lengths associated with the FEMR parameters was between 5–30 cm.
  • The amplitude of the FEMR field at the source (micro-fracture) was assessed to be of the order of 150–200 V/m (0.4–0.5 A/m).
  • The amplitude of the FEMR field at the input of the recording antennae was estimated to be of the order of ≈10–13–10–14 V/m (H ≈ 10–16 A/m).
  • The distance between the antennae and the FEMR signals’ sources was assessed to be of the order of 5 km, while their azimuth of ≈5–60° to the east indicated that the sources of the FEMR were, indeed, within the zone of the Dead Sea Transform.
  • The range of the Mw magnitudes of the impending “EQs” associated with the micro-fractures was shown to be of the order of −4 to −3, implying that they were created during an early period of micro-earthquake nucleation.
  • Conclusion (e) was also confirmed by comparing the FEMR activities (the number of FEMR hits per unit of time) and the associated FEMR magnitudes with the Gutenberg–Richter relationship in the region.

5. Conclusions

The results of this study were entirely consistent with our previous laboratory studies and show the feasibility of using FEMR measurements for early earthquake forecasting. Rock fracture characteristics are easily obtainable from the detailed features and shapes of the measured signals and, specifically, the magnitudes of the approaching EQs. Therefore, these results establish the feasibility of using FEMR measurements for early earthquake forecasting. More field experiments are necessary for complete validation, especially experiments preceding actual large EQs.

Author Contributions

Methodology, D.B.; Formal analysis, V.F., A.R. and D.B.; Investigation, V.F., A.R. and U.K.; Resources, V.F.; Writing—original draft, V.F.; Writing—review & editing, V.F., D.B. and U.K. All authors have read and agreed to the published version of the manuscript.

Funding

V.F. acknowledges the support from the European Union’s Horizon 2020 research and innovation program under the Marie Sklodowska-Curie RISE project EffectFact, grant agreement no. 101008140. All data generated and analyzed during this study are included in the article. UK and VF thank the Sami Shamoon College of Engineering grants no. YR03/Y18/T2/D3/Yr2 and YR03/Y17/T1/D3/Yr1 for the financial support that allowed a thorough study of the problem.

Data Availability Statement

All data generated and analyzed during this study are included in the article.

Conflicts of Interest

The authors declare no conflict of interest.

References

  1. Nur, A. Apocalypse. In Earthquakes, Archaeology, and the Wrath of God; Princeton University Press: Princeton, NJ, USA; Oxford, UK, 2008. [Google Scholar]
  2. Kramer, S.L. Geotechnical Earth Engineering; Prentice Hall: Englewood Cliffs, NJ, USA, 1996. [Google Scholar]
  3. Bolt, B.A.; Horn, W.L.; Macdonald, G.A.; Scott, R.F. Geological Hazards; Springer: Berlin/Heidelberg, Germany, 1977. [Google Scholar]
  4. Kazama, M.; Noda, T. Damage statistics (Summary of the 2011 off the Pacific coast of Tohoku earthquake damage). Soils Found. 2012, 52, 780–792. [Google Scholar] [CrossRef] [Green Version]
  5. Ishida, T.; Kanagawa, T.; Kanaori, Y. Source distribution of acoustic emissions during an in-situ direct shear test: Implications for an analog model of seismogenic faulting in an inhomogeneous rock mass. Eng. Geol. 2010, 110, 66–76. [Google Scholar] [CrossRef] [Green Version]
  6. Cheon, D.S.; Jung, Y.B.; Park, E.S.; Song, W.K.; Jang, H.I. Evaluation of damage level for rock slopes using acoustic emission technique with waveguides. Eng. Geol. 2011, 121, 75–88. [Google Scholar] [CrossRef]
  7. Deng, L.Z.; Yuan, H.Y.; Chen, J.G.; Sun, Z.H.; Fu, M.; Zhou, Y.L.; Yan, S.; Zhang, Z.W.; Chen, T. Experimental investigation on progressive deformation of soil slope using acoustic emission monitoring. Eng. Geol. 2019, 261, 105295. [Google Scholar] [CrossRef]
  8. Mei, C.; Fang, Z.; Wu, W. Slip transition of rock fractures due to chemical corrosion. Eng. Geol. 2022, 308, 106801. [Google Scholar] [CrossRef]
  9. Meng, F.Z.; Wong, L.N.Y.; Zhou, H.; Wang, Z.Q. Comparative study on dynamic shear behavior and failure mechanism of two types of granite joint. Eng. Geol. 2018, 245, 356–369. [Google Scholar] [CrossRef]
  10. McLaskey, G.C.; Lockner, D.A. Preslip and cascade processes initiating laboratory stick slip. J. Geophys. Res. Solid Earth 2014, 119, 6323–6336. [Google Scholar] [CrossRef]
  11. Noda, H.; Nakatani, M.; Hori, T. Large nucleation before large earthquakes is sometimes skipped due to cascade-up—Implications from a rate and state simulation of faults with hierarchical asperities. J. Geophys. Res. Solid Earth 2013, 118, 2924–2952. [Google Scholar] [CrossRef]
  12. Rikitake, T. Predictions and Precursors of Major Earthquakes: The Science of Macro-Anomaly Precursory to an Earthquake; Terra Scientific Publishing Company: Tokyo, Japan, 2001. [Google Scholar]
  13. Bormann, P. From earthquake prediction research to time-variable seismic hazard assessment application. Pure Appl. Geophys. 2011, 168, 329–366. [Google Scholar] [CrossRef]
  14. Rabinovitch, A.; Frid, V.; Bahat, D. Use of electromagnetic radiation to predict earthquakes. Geol. Mag. 2018, 155, 992–996. [Google Scholar] [CrossRef]
  15. Shimamoto, T.; Togo, T. Earthquakes in the lab. Science 2012, 338, 54–55. [Google Scholar] [CrossRef] [PubMed]
  16. Hayakawa, M. Earthquake Prediction with Radio Techniques; Wiley: Singapore, 2015. [Google Scholar]
  17. Hayakawa, M. Earthquake Prediction Studies: Seismo Electromagnetics; Terrapub: Tokyo, Japan, 2013. [Google Scholar]
  18. Uyeda, S.; Nagao, T.; Kamogawa, M. Short-term earthquake prediction: Current status of seismo-electromagnetics. Tectonophys 2009, 470, 205–213. [Google Scholar] [CrossRef]
  19. Liu, Y.J.; Li, X.L.; Li, Z.H.; Chen, P.; Yang, T. Experimental study of the surface potential characteristics of coal containing gas under different loading modes (uniaxial, cyclic and graded). Eng. Geol. 2019, 249, 102–111. [Google Scholar] [CrossRef]
  20. Frid, V.; Rabinovitch, A.; Bahat, D. Seismic moment estimation based on fracture induced electromagnetic radiation. Eng. Geol. 2020, 279, 105882. [Google Scholar] [CrossRef]
  21. Rabinovitch, A.; Frid, V.; Bahat, D. Gutenberg-Richter type relation for laboratory fracture induced electromagnetic radiation. Phys. Rev. E 2002, 65, 011401–011404. [Google Scholar] [CrossRef] [Green Version]
  22. Frid, V.; Goldbaum, J.; Rabinovitch, A.; Bahat, D. Time dependent Benioff strain release diagrams. Phil. Mag. 2011, 90, 1693–1704. [Google Scholar] [CrossRef]
  23. Baddari, K.; Frolov, A.; Tourtchine, V.; Rahmoune, F. An integrated study of the dynamics of electromagnetic and acoustic regimes during failure of complex macrosystems using rock blocks. Rock Mech. Rock Eng. 2011, 44, 269–280. [Google Scholar] [CrossRef]
  24. Lacidogna, G.; Carpinteri, A.; Manuello, A.; Durin, G.; Schiavi, A.; Niccolini, G.; Agosto, A. Acoustic and electromagnetic emissions as precursors phenomena in failure processes. Strain 2011, 47, 144–152. [Google Scholar] [CrossRef]
  25. Hadjicontis, V.; Mavromatou, C.; Mastrogiannis, D.; Antsygina, T.N.; Chishko, K.A. Relationship between electromagnetic and acoustic emissions during plastic deformation of gamma irradiated LiF monocrystals. J. Appl. Phys. 2011, 110, 024907. [Google Scholar] [CrossRef]
  26. Carpinteri, A.; Lacidogna, G.; Manuello, A.; Niccolini, G.; Schiavi, A.; Agosto, A. Mechanical and electromagnetic emissions related to stress induced cracks. Exp. Technol. 2012, 36, 53–64. [Google Scholar] [CrossRef]
  27. Rabinovitch, A.; Frid, V.; Bahat, D. Directionality of electromagnetic radiation from fractures. Intern. J. Fract. 2017, 204, 239–244. [Google Scholar] [CrossRef]
  28. Song, D.Z.; Wang, E.Y.; Li, Z.H.; Qiu, L.M.; Xu, Z.Y. EMR: An effective method for monitoring and warning of rockburst hazard. Geomech. Eng. 2017, 12, 53–69. [Google Scholar]
  29. Song, D.; Wang, E.; Song, X. Changes in frequency of electromagnetic radiation from loaded coal rock. Rock Mech. Rock Eng. 2016, 49, 291–302. [Google Scholar] [CrossRef]
  30. Lou, Q.; Song, D.; He, X. Correlations between acoustic and electromagnetic emissions and stress drop induced by burst-prone coal and rock fracture. Saf. Sci. 2019, 115, 310–319. [Google Scholar] [CrossRef]
  31. Wang, W.; Song, D.; He, X.; Liu, Q.; Li, Z.; Qiu, L.; Mei, G. Dynamic Propagation and Electro-Mechanical Characteristics of New Microcracks in Notched Coal Samples Studied by the Three-Point Bending Test System and AFM. Minerals 2022, 12, 582. [Google Scholar] [CrossRef]
  32. Qiu, L.; Zhu, Y.; Song, D.; He, X.; Wang, W.; Liu, Y.; Xiao, Y.; Wei, M.; Yin, S.; Liu, Q. Study on the Nonlinear Characteristics of EMR and AE during Coal Splitting Tests. Minerals 2022, 12, 108. [Google Scholar] [CrossRef]
  33. Zang, Z.; Li, Z.; Niu, Y.; Tian, H.; Zhang, X.; Li, X.; Ali, M. Energy Dissipation and Electromagnetic Radiation Response of Sandstone Samples with a Pre-Existing Crack of Various Inclinations under an Impact Load. Minerals 2021, 11, 1363. [Google Scholar] [CrossRef]
  34. Potirakis, S.M.; Mastrogiannis, D. Critical features revealed in acoustic and electromagnetic emissions during fracture experiments on LiF. Phys. A 2017, 485, 11–22. [Google Scholar] [CrossRef]
  35. Sharma, S.K.; Chauhan, V.S.; Sinapius, M. A review on deformation-induced electromagnetic radiation detection: History and current status of the technique. J. Mater. Sci. 2021, 56, 4500–4551. [Google Scholar] [CrossRef]
  36. Hayakawa, M.; Fujinawa, Y. Electromagnetic Phenomena Related to Earthquake Prediction; Terrapub: Tokyo, Japan, 1994. [Google Scholar]
  37. Qian, S.; Yian, J.; Cao, H.; Shi, S.; Lu, Z.; Li, J.; Ren, K. Results of the observations on seismo-electromagnetic waves at two earthquake areas in China. In Electromagnetic Phenomena Related to Earthquake Prediction; Hayakawa, M., Fujinawa, Y., Eds.; Terrapub: Tokyo, Japan, 1994; pp. 205–211. [Google Scholar]
  38. Kapiris, P.; Eftaxias, K.; Chelidze, T. Electromagnetic signature of prefracture criticality in heterogeneous media. Phys. Rev. Lett. 2004, 92, 065702. [Google Scholar] [CrossRef]
  39. Contoyiannis, Y.; Eftaxias, K. Tsallis and Levy statistics in the preparation of an earthquake. Nonlin. Proc. Geophys. 2008, 15, 379–388. [Google Scholar] [CrossRef]
  40. Contoyiannis, Y.; Kapiris, P.G.; Eftaxias, K. A Monitoring of a pre-seismic phase from its electromagnetic precursors. Phys. Rev. E 2005, 71, 066123. [Google Scholar] [CrossRef]
  41. Contoyiannis, Y.; Potirakis, S.M. Signatures of the symmetry breaking phenomenon in pre-seismic electromagnetic emissions. J. Stat. Mech. 2018, 2018, 083208. [Google Scholar] [CrossRef]
  42. Potirakis, S.M.; Minadakis, G.; Nomicos, C.; Eftaxias, K. A multidisciplinary analysis for traces of the last state of earthquake generation in preseismic electromagnetic emissions. Nat. Hazards Earth Syst. Sci. 2011, 11, 2859–2879. [Google Scholar] [CrossRef] [Green Version]
  43. Frid, V. Electromagnetic radiation method water—Infusion control in rockburst-prone strata. J. Appl. Geoph. 2000, 43, 5–13. [Google Scholar] [CrossRef]
  44. Frid, V.; Vozoff, K. Electromagnetic radiation induced by mining rock failure. Int. J. Coal Geol. 2005, 64, 57–65. [Google Scholar] [CrossRef]
  45. Liu, X.; Zhang, Z.; Wang, E. Characteristics of electromagnetic radiation signal of coal and rock under uniaxial compression and its field application. J. Earth Syst. Sci. 2019, 129, 34. [Google Scholar] [CrossRef]
  46. Qiu, L.; Li, Z.; Wang, E. Characteristics and precursor information of electromagnetic signals of mining-induced coal and gas outburst. J. Loss Prev. Process Ind. 2018, 54, 206–215. [Google Scholar] [CrossRef]
  47. Liu, X.; Wang, E. Study on characteristics of EMR signals induced from fracture of rock samples and their application in rockburst prediction in copper mine. J. Geophys. Eng. 2018, 15, 909–920. [Google Scholar] [CrossRef] [Green Version]
  48. Qiu, L.; Wang, E.; Song, D. Measurement of the stress field of a tunnel through its rock EMR. J. Geophys. Eng. 2017, 14, 949–959. [Google Scholar] [CrossRef] [Green Version]
  49. Li, B.; Li, Z.; Wang, E.; Li, N.; Huang, J.; Ji, Y.; Niu, Y. Discrimination of Different AE and EMR Signals during Excavation of Coal Roadway Based on Wavelet Transform. Minerals 2022, 12, 63. [Google Scholar] [CrossRef]
  50. He, S.; Qin, M.; Qiu, L.; Song, D.; Zhang, X. Early warning of coal dynamic disaster by precursor of AE and EMR “quiet period”. Int. J. Coal Sci. Technol. 2022, 9, 46. [Google Scholar] [CrossRef]
  51. Lichtenberger, M. Underground measurements of electromagnetic radiation Related to stress-induced fractures in the Odenwald Mountains (Germany). Pure App. Geoph. 2006, 163, 1661–1677. [Google Scholar] [CrossRef]
  52. Das, S.; Mallik, J.; Dhankhar, S.; Suthar, N.; Singh, A.K.; Dutta, V.; Gupta, U. Application of Fracture Induced Electromagnetic Radiation (FEMR) technique to detect landslide-prone slip planes. Nat. Hazards 2020, 101, 505–535. [Google Scholar] [CrossRef]
  53. Mallik, J.; Mathew, G.; Angerer, T.; Greiling, R.O. Determination of directions of horizontal principal stress and identification of active faults in Kachchh (India) by electromagnetic radiation (EMR). J. Geodyn. 2008, 45, 234–245. [Google Scholar] [CrossRef]
  54. Greiling, R.O.; Obermeyer, H. Natural electromagnetic radiation (EMR) and its application in structural geology and neotectonics. J. Geolog. Soc. India 2010, 75, 278–288. [Google Scholar] [CrossRef]
  55. Das, S.; Mallik, J.; Bandyopadhyay, K.; Das, A. Evaluation of maximum horizontal near-surface stress (SHmax) azimuth and its distribution along Narmada-Son Lineament, India by geogenic Electromagnetic Radiation (EMR) technique. J. Geodyn. 2020, 133, 101672. [Google Scholar] [CrossRef]
  56. Das, S.; Mallik, J.; Deb, T.; Das, D. Quantification of principal horizontal stresses inside a tunnel: An application of Fracture induced Electromagnetic Radiation (FEMR) technique in the Darjeeling-Sikkim Himalayas. Eng. Geol. 2020, 279, 105882. [Google Scholar] [CrossRef]
  57. Das, D.; Mallik, J.; Das, S.; Deb, T.; Das, A.; Bandyopadhyay, K. Active thrust induced realignment of recent near-surface stresses in the Darjeeling-Sikkim Himalayas: Reasons and implications. J. Struct. Geol. 2021, 145, 104311. [Google Scholar] [CrossRef]
  58. Frid, V.; Rabinovitch, A.; Bahat, D. Earthquake forecast based on its nucleation stages and the ensuing electromagnetic radiations. Phys. Lett. A 2020, 384, 126102. [Google Scholar] [CrossRef]
  59. Available online: https://eq.gsi.gov.il/en/earthquake/eqsOnMapLF.php (accessed on 1 July 2023).
  60. Sharon, M.; Sagy, A.; Kurzon, I.; Marco, S.; Rosensaft, M. Assessment of seismic sources and capable faults through hierarchic tectonic criteria: Implications for seismic hazard in the Levant. Nat. Hazards Earth Syst. Sci. 2020, 20, 125–148. [Google Scholar] [CrossRef] [Green Version]
  61. Wetzler, N.; Kurzon, I. The Earthquake Activity of Israel: Revisiting 30 Years of Local and Regional Seismic Records along the Dead Sea Transform. Seismol. Res. Lett. 2016, 87, 47–58. [Google Scholar] [CrossRef]
  62. Hofstetter, A.; Thio, H.K.; Shamir, M. Source mechanism of the 22/11/1995 Gulf of Aqaba earthquake and its aftershock sequence. J. Seismol. 2003, 7, 99–114. [Google Scholar] [CrossRef]
  63. Hofstetter, A. Seismic observations of the 22/11/1995 Gulf of Aqaba earthquake sequence. Tectonophysics 2003, 369, 21–36. [Google Scholar] [CrossRef]
  64. Beth, M.; Eyal, Y.; Garfunkel, Z. The geology of the Eilat Sheet, explanatory notes. GSI Rep. 2013, 22, GSI/22/2011. [Google Scholar]
  65. Hartman, G.; Niemi, T.M.; Tibor, G.; Ben-Avraham, Z.; Al-Zoubi, A.; Makovsky, Y.; Akawwi, E.; Abueladas, A.-R.; Al-Ruzouq, R. Quaternary tectonic evolution of the Northern Gulf of Eilat/Aqaba along the Dead Sea Transform. J. Geophys. Res. Solid Earth 2014, 119, 9183–9205. [Google Scholar] [CrossRef]
  66. Zilberman, E.; Amit, R.; Porat, N.; Enzel, Y.; Avner, U. Surface ruptures induced by the devastating 1068 AD earthquake in the southern Arava valley, Dead Sea Rift, Israel. Tectonophysics 2005, 408, 79–99. [Google Scholar] [CrossRef]
  67. Shamir, G. The active structure of the Dead Sea Depression. In New Frontiers in Dead Sea Paleoenvironmental Research; Enzel, Y., Agnon, A., Stein, M., Eds.; Geological Society of America: Boulder, CO, USA, 2006; Volume 401, pp. 15–32. [Google Scholar]
  68. Geological Map of Israel 1:50,000, Be’er Ora Sheet 25-IV (1999), and Eilat Sheet 26-I, II; GSI: Atlanta, GA, USA, 2012.
  69. Frid, V.; Wang, E.Y.; Mulev, S.N.; Li, D.X. The Fracture Induced Electromagnetic Radiation—Approach and Protocol for the Stress State Assessment for Mining. Geotech. Geol. Eng. 2021, 39, 3285–3291. [Google Scholar] [CrossRef]
  70. Rabinovitch, A.; Frid, V.; Bahat, D. Surface oscillations—A possible source of fracture induced electromagnetic radiation. Tectonophysics 2007, 431, 15–21. [Google Scholar] [CrossRef]
  71. Rabinovitch, A.; Frid, V.; Bahat, D. A note on the amplitude—Frequency relation of electromagnetic radiation pulses induced by material failure. Phil. Mag. Lett. 1999, 79, 195–200. [Google Scholar] [CrossRef]
  72. Available online: https://www.ahsystems.com/articles/Antenna-Factor-Calculations.php (accessed on 1 July 2023).
  73. Goodfellow, S.D.; Young, R.P. A laboratory acoustic emission experiment under in situ conditions. Geophys. Res. Lett. 2014, 41, 3422–3430. [Google Scholar] [CrossRef]
  74. Aoi, S.; Asano, Y.; Kunugi, T.; Kimura, T.; Uehira, K.; Takahashi, N.; Ueda, H.; Shiomi, K.; Matsumoto, T.; Fujiwara, H. MOWLAS: NIED observation network for earthquake, tsunami and volcano. Earth Planets Space 2020, 72, 126. [Google Scholar] [CrossRef]
  75. Serafini, F.; Naylor, M.; Lindgren, F.; Werner, M.J.; Main, I. Ranking earthquake forecasts using proper scoring rules: Binary events in a low probability environment. Geophys. J. Int. 2022, 230, 1419–1440. [Google Scholar] [CrossRef]
  76. Chelidze, T.; Kiria, T.; Melikadze, G.; Jimsheladze, T.; Kobzev, G. Earthquake Forecast as a Machine Learning Problem for Imbalanced Datasets: Example of Georgia, Caucasus. Front. Earth Sci. 2022, 10, 847808. [Google Scholar] [CrossRef]
  77. Kapiris, P.; Nomicos, K.; Antonopoulos, G.; Polygiannakis, J.; Karamanos, K.; Kopanas, J.; Zissos, A.; Peratzakis, A.; Eftaxias, K. Distinguished seismological and electromagnetic features of the impending global failure: Did the 7/9/1999 M5.9 Athens earthquake come with a warning? Earth Planets Space 2005, 57, 215–230. [Google Scholar] [CrossRef] [Green Version]
  78. Eftaxias, K.; Panin, V.; Deryugin, Y. Evolution-EM signals before earthquakes in terms of mesomechanics and complexity. Tectonophysics 2007, 431, 273–300. [Google Scholar] [CrossRef]
  79. Potirakis, S.; Minadakis, G.; Eftaxias, K. Relation between seismicity and pre-earthquake electromagnetic emissions in terms of energy, information and entropy content. Nat. Hazards Earth Syst. Sci. 2012, 12, 1179–1183. [Google Scholar] [CrossRef] [Green Version]
  80. Donner, R.; Potirakis, S.; Balasis, G.; Eftaxias, K.; Kurths, J. Temporal correlation patterns in pre-seismic electromagnetic emissions reveal distinct complexity profiles prior to major earthquakes. Phys. Chem. Earth 2015, 85–86, 44–55. [Google Scholar] [CrossRef]
  81. Baron, I.; Koktavý, P.; Trčka, T.; Rowberry, M.; Stemberk, J.; Balek, J.; Plan, L.; Melichar, R.; Diendorfer, G.; Macků, R.; et al. Differentiating between artificial and natural sources of electromagnetic radiation at a seismogenic fault. Eng. Geol. 2022, 311, 106912. [Google Scholar] [CrossRef]
  82. Zhuang, J.; Matsu’ura, M.; Han, P. Critical zone of the branching crack model for earthquakes: Inherent randomness, earthquake predictability, and precursor modelling. Eur. Phys. J. Spec. Top 2021, 230, 409–424. [Google Scholar] [CrossRef]
  83. Petrescu, L.; Moldovan, I.-A. Prospective Neural Network Model for Seismic Precursory Signal Detection in Geomagnetic Field Records. Mach. Learn. Knowl. Extr. 2022, 4, 912–923. [Google Scholar] [CrossRef]
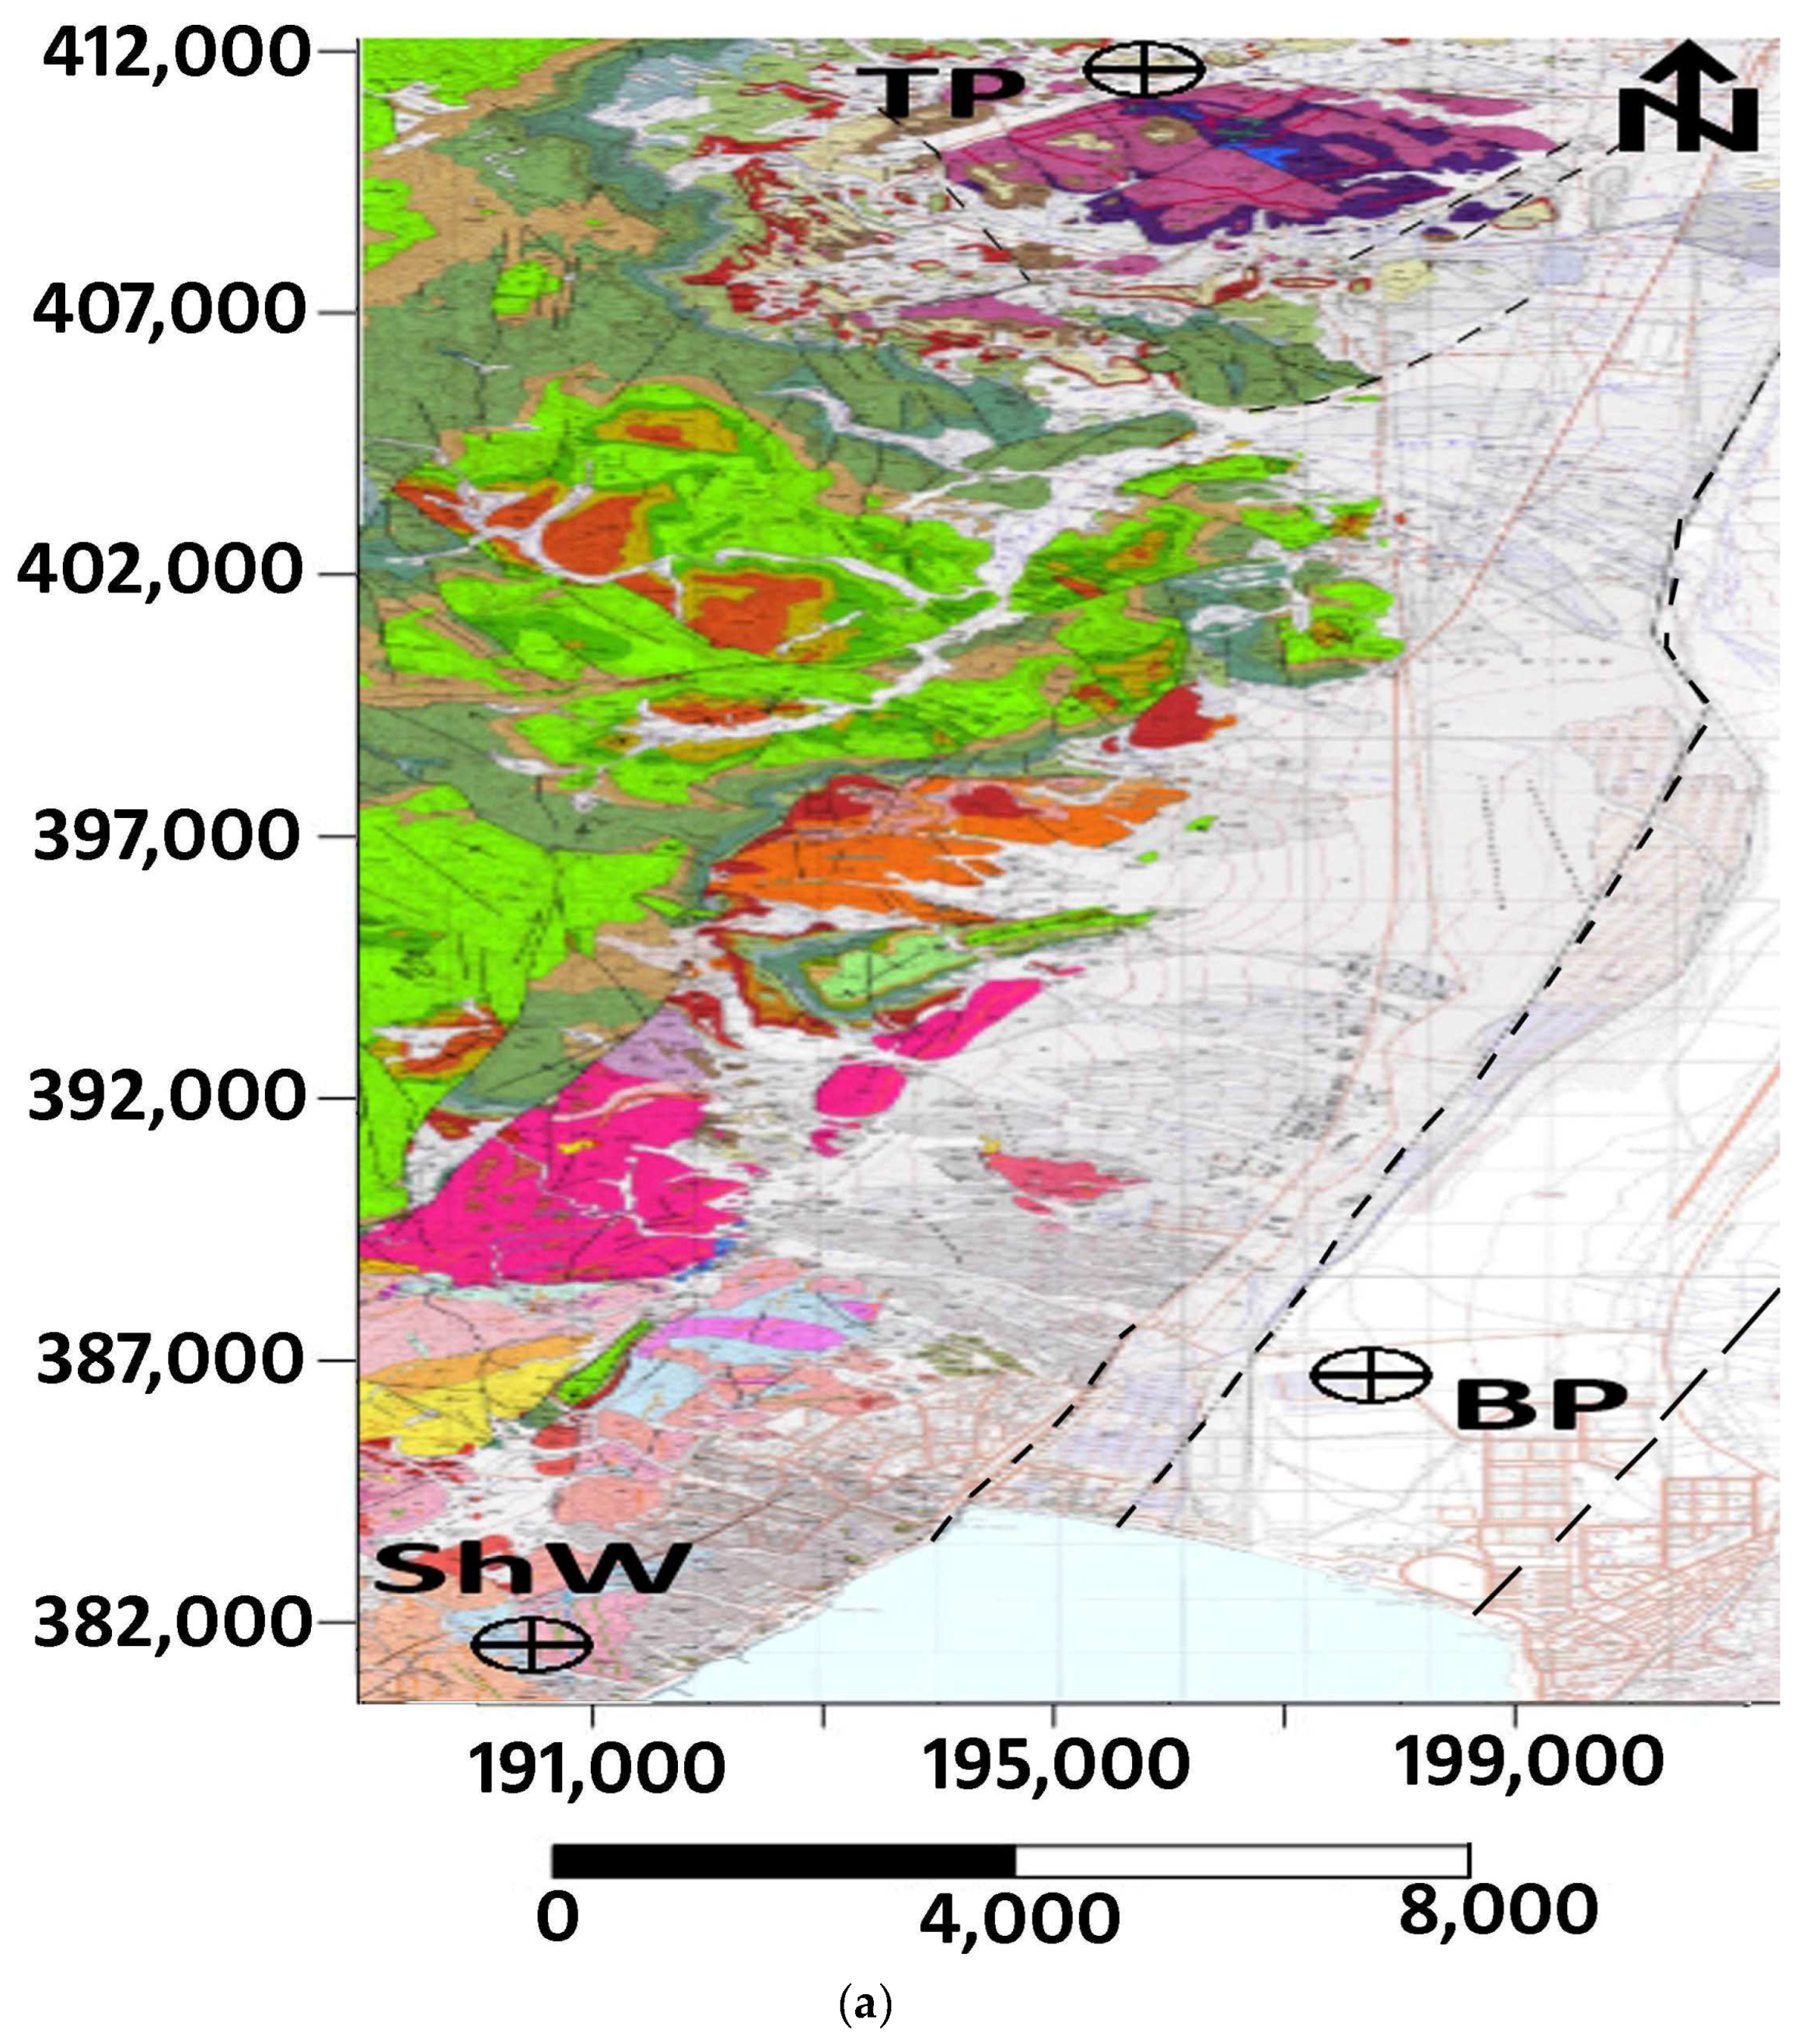
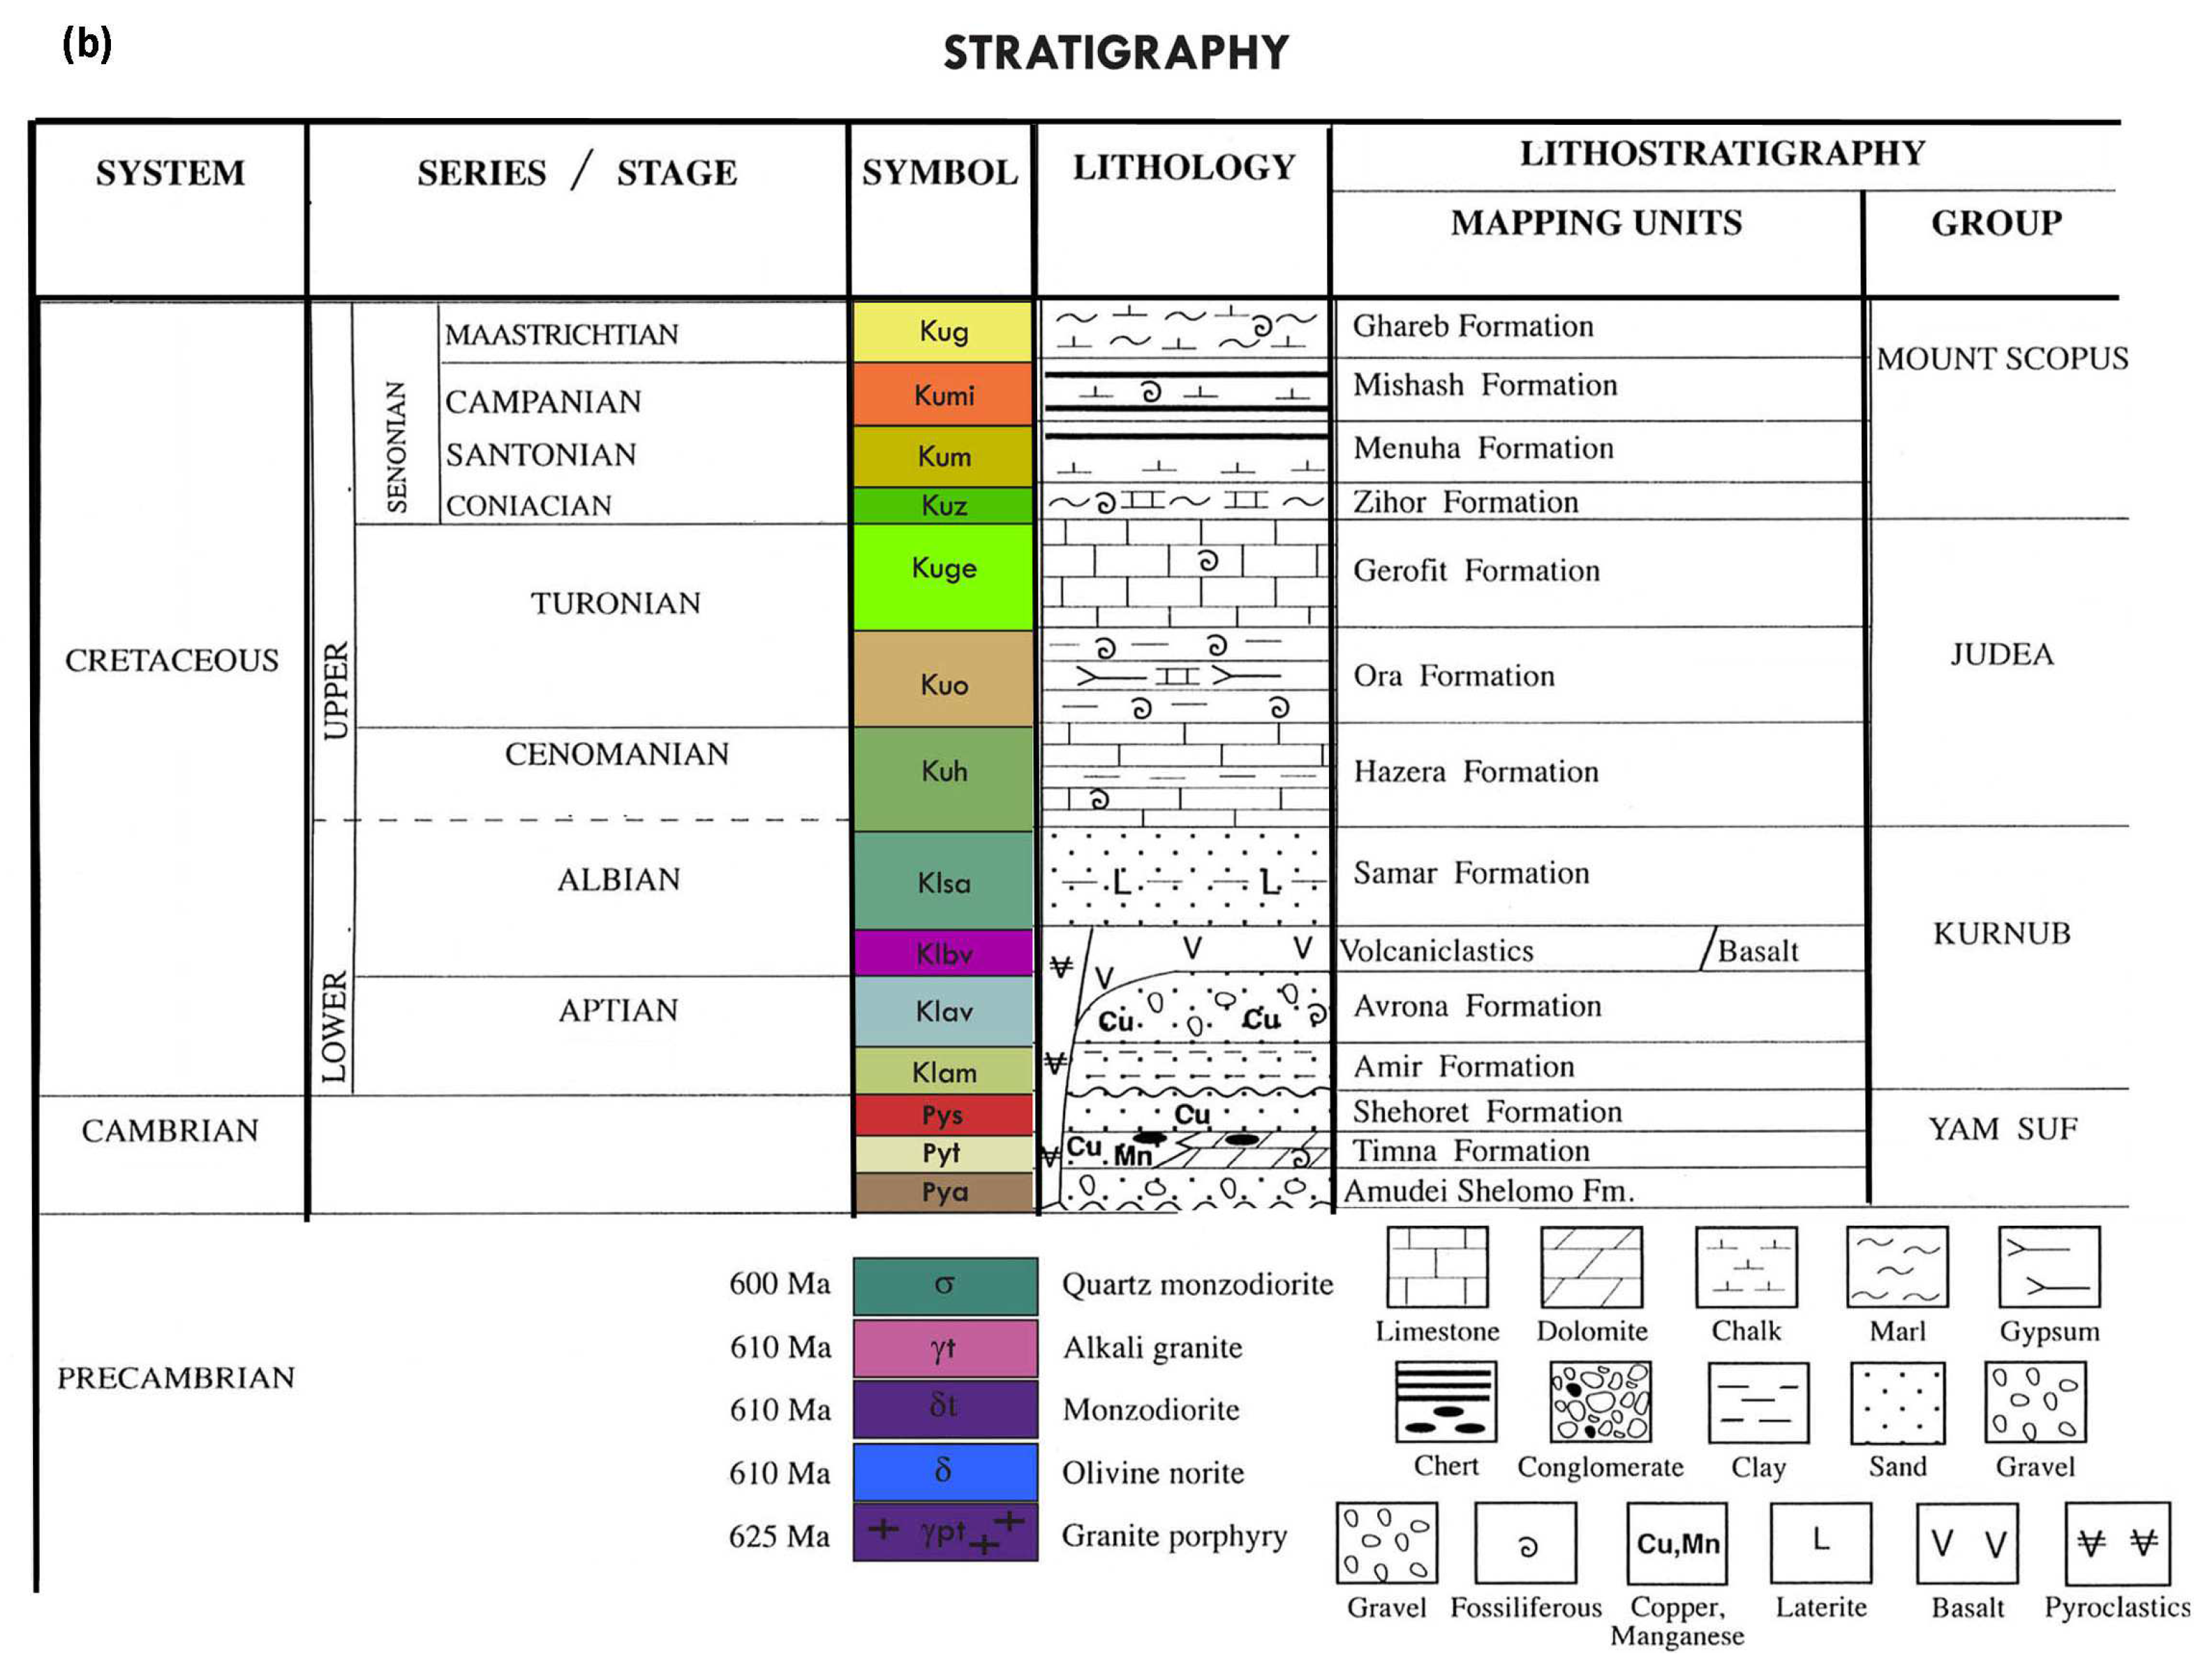
Figure 1. (a) The three locations of the FEMR measurements taken in the vicinity of Eilat superimposed on the combined fragments of the geological maps of the Timna (sheet 25-IV) and Eilat (sheet 26-I, II) regions [68]. The dashed lines show the locations of the main strike-slip faults [63]. TP, ShW, and BP mark the locations of the three measurement stations in Timna Park, Shlomo Wadi, and the Park of Birds, respectively. (b) The legend for (a).
Remotesensing 15 03639 g001aRemotesensing 15 03639 g001b
Figure 2. EQ epicenters near Eilat city, modified from [60], where the X and Y axes are in the New Israeli Coordinate System. The scale is in meters.
Remotesensing 15 03639 g002
Figure 3. FEMR acquisition in Timna Park.
Remotesensing 15 03639 g003
Figure 4. The FEMR pulse sequences recorded in Timna Park (a), the east direction, (b) the north direction, and (c) the up direction. For the statistics of the FEMR impulses, see Section 3.1.
Remotesensing 15 03639 g004
Figure 5. An example of a single FEMR pulse measured near Eilat city (the northern component, channel 2).
Remotesensing 15 03639 g005
Figure 6. The spectrum amplitude of the FEMR pulse shown in Figure 5.
Remotesensing 15 03639 g006
Figure 7. The directions to the FEMR sources, the X and Y axes, are in the New Israeli Coordinate System. The scale is in meters.
Remotesensing 15 03639 g007
Disclaimer/Publisher’s Note: The statements, opinions and data contained in all publications are solely those of the individual author(s) and contributor(s) and not of MDPI and/or the editor(s). MDPI and/or the editor(s) disclaim responsibility for any injury to people or property resulting from any ideas, methods, instructions or products referred to in the content.