Technical Note

Technological Advances to Rescue Temporary and Ephemeral Wetlands: Reducing Their Vulnerability, Making Them Visible

by
Raquel Jiménez-Melero
1,2,
Patricio Bohorquez
2,3,*,
Inmaculada González-Planet
3,
Francisco José Pérez-Latorre
2,4 and
Gema Parra
1,2
1
Department of Animal Biology, Plant Biology and Ecology, University of Jaén, 23071 Jaén, Spain
2
Centre for Advanced Studies in Earth Sciences, Energy and Environment (CEACTEMA), University of Jaén, 23071 Jaén, Spain
3
Department of Mechanical and Mining Engineering, University of Jaén, 23071 Jaén, Spain
4
Department of Mechanical and Mining Engineering, University of Jaén, 23700 Linares, Spain
*
Author to whom correspondence should be addressed.
Remote Sens. 2023, 15(14), 3553; https://doi.org/10.3390/rs15143553
Submission received: 19 May 2023 / Revised: 8 July 2023 / Accepted: 13 July 2023 / Published: 15 July 2023
(This article belongs to the Special Issue Advances in Remote Sensing of the Inland and Coastal Water Zones II)

Abstract

:
Mediterranean temporary ponds are a priority habitat according to the Natura 2000 network of the European Union, and complete inventories of these ecosystems are therefore needed. Their small size, short hydroperiod, or severe disturbance make these ponds undetectable by most remote sensing systems. Here we show, for the first time, that the distributed hydrologic model IBER+ detects ephemeral and even extinct wetlands by fully exploiting the available digital elevation model and resolving many microtopographic features at drainage basin scales of about 1000 km2. This paper aims to implement a methodology for siting flood-prone areas that can potentially host a temporary wetland, validating the results with historical orthophotos and existing wetlands inventories. Our model succeeds in dryland endorheic catchments of the Upper Guadalquivir Basin: it has detected 89% of the previously catalogued wetlands and found four new unknown wetlands. In addition, we have found that 24% of the detected wetlands have disappeared because of global change. Subsequently, environmental managers could use the proposed methodology to locate wetlands quickly and cheaply. Finding wetlands would help monitor their conservation and restore them if needed.

1. Introduction

Semi-arid and dry-subhumid areas are among the most biodiverse regions in the world, thanks to the species richness and the high rate of endemism [1], and are considered particularly vulnerable to climate change [2]. Despite the significant extension of dryland zones worldwide, more knowledge of their aquatic ecosystems must be gained.
Often these lands are imagined as poor in wetlands, but they are not or were not until recently. Wetlands are not always large flood-prone areas or well-defined lagoons with relatively long hydroperiods. Sometimes they are isolated small pools, which are flooded only occasionally, or cryptic wetlands where it is challenging to detect the presence of water. As González Bernáldez and Montes (1989) said, “Wetlands are any functional unit of the landscape that, not being a river or a lake, constitutes a positive hydric anomaly in relation to an adjacent drier territory; the excess humidity must be important enough to affect biological processes” [3]. And that is why it is also considered a wetland “a place where you get your feet wet but you can’t swim” [4]. Indeed, the wetlands in these regions are so shallow that the place name Laguna Honda (Deep Lagoon) is used to refer to small lakes that usually have a depth of just over one meter and do not exceed three meters in the rainiest years [5,6]. Most of the wetlands in this region are less than one meter deep, and the deepest is barely three meters deep [5,6]. Therefore, two meters are already considered deep in these places.
Their small size or depth gives these ecosystems an appearance of little value or grandeur and makes them mainly invisible and vulnerable to many anthropogenic impacts, especially agriculture [7,8]. Subsequently, these unique ecosystems are rapidly disappearing under ploughing and drainage, turning into farmland challenging to identify as wetlands via satellite imagery (Figure 1). The strong impact of changes in land use must be added to the effect of climate change and contamination; the result is that about 21% of global wetlands have been lost over the past three centuries [9]. For other authors, the loss is even more significant and amounts to 35% since the 1970s [10].
The Mediterranean region hoards many typologies of small lakes, ponds, and wetlands for their genesis, functioning, morphology, hydrochemistry, and the biota they host [11,12]. Even so, some ecological typologies are so unique and little known in Europe that they were not even included in the European Water Framework Directive [13,14]. The leading expert scientists in shallow Mediterranean wetlands stress the urgent need for data on the ecology of shallow wetlands in the Mediterranean region since most of the studies on the ecology of shallow aquatic ecosystems have mainly been performed in the north temperate area [14]. One of their most representative types corresponds to the Mediterranean temporary ponds (MTPs). Although it is a priority habitat according to the Natura 2000 network of the European Union [15], we lack complete inventories.
The forecasts reported by the Intergovernmental Panel on Climate Change (IPCC) show that the Mediterranean climate zone will be markedly affected by global warming, significantly affecting the wetlands’ water level and salinisation processes since their functioning depends strongly on the water balance. Additionally, the projected scenarios add further threats because of the potential increased demand for irrigation water [16].
Europe aims to develop new research lines that scaffold the design and monitoring for conservation and restoration actions, specifically in threatened ecosystems. In the recently published Europe Horizon programme [17], the European Commission asks for research projects that assess the status and dynamics of these ecosystems, estimate their vulnerability to multiple stressors, including anthropogenic and natural pressures like climate change, and evaluate the impact of these stressors on the integrity and resilience of ecosystems. The challenges of these projects will be more easily achievable thanks to the new European Directive 2019/1024 that obliges Member States to give open and free access to geospatial and Earth observation data, as well as other high-value data related to the environment and the Meteorology. In the case of Spain, this information is already freely accessible: the Spanish Meteorological Agency (AEMET) provides open rainfall data, and the National Plan for Aerial Orthophotography (PNOA) provides laser imaging detection (LiDAR), digital elevation model (DEM), orthophotographs and other spatial information, etc.
A spatially explicit inventory is essential to manage temporary wetlands on a landscape scale effectively [8,18]. Atmospheric conditions, the spatial resolution of the sensor being used [19], the cryptic nature of wetlands, and their short hydroperiods can limit the remote detection of small wetlands, as explained above. For example, the most accurate band of the Moderate-Resolution Imaging Spectroradiometer (MODIS) has a resolution of 250 m, although many wetlands are much smaller than that. In the case of LANDSAT, this resolution is higher, 30 m, but more is needed when studying ponds and pools barely 10 m in diameter and a few centimetres deep.
Although there are readily available methods for siting a wetland [20,21,22], most of them do not work when the wetlands are minimal—just a few meters wide—or very temporary, or when crops have replaced them (Figure 1); these characteristics become them undetectable by most of the remote sensing systems. Traditionally, these wetlands can be sited after numerous field visits or manually using geographical information systems and high-resolution aerial photographs, a highly time-consuming procedure.
Therefore, it is necessary to develop new tools and methodologies to detect areas susceptible to being considered wetlands, despite the absence of water during a particular period or the lack of those most representative wetlands features, such as riparian vegetation. These tools or methodologies could be particularly relevant when the wetlands have been suffering the direct effects (drainage channels, infrastructures building, land use change) or indirect effects (climate change) of anthropogenic impacts, becoming invisible, less apparent or definitively extinct.
For the first time, we show that distributed hydrological–hydraulic model driven by maximum precipitation is a novel tool to detect potential wetland locations based on the simulated water depth and flow velocity fields. Only presently can we exploit the advantages of the proposed approach because of: (i) the cheap cost of workstations with powerful graphics processing units (GPU), (ii) the release of free or open-source software for distributed hydrological modelling based on the two-dimensional Saint-Venant equations and GPU (e.g., IBER+ [23,24,25], TRITON [26], SERGHEI-SWE [27], LISFLOOD-FP [28]), (iii) the availability of open topographic [29], meteorological [30] and hydrological data in some countries as Spain (see references in [31] and [32]). After identifying a possible wetland, we can verify its existence by cross-referencing historical orthophotos, cartography, and maps with place names, conducting inventories, and making on-site visits. The eventual catalogue of the detected waterbodies as wetlands requires checking the presence of aquatic plants and peat, as explained in our previous works [5,6].
This paper aims to implement a methodology to locate flood-prone areas that can potentially host a temporary wetland. Our approach accounts for depressions on the landscape and the numerical simulation of the wetland infilling processes using a physically based distributed rainfall-runoff model. The free software [23,24,25] has specific features that could allow us to work at the basin scale and take full advantage of the available digital elevation model (DEM). We aimed to test whether this new tool could detect small isolated ephemeral wetlands in drylands. This tool could be handy for environmental managers who can easily, quickly, and cheaply locate wetlands needing restoration while allowing them to monitor their state of conservation.

2. Materials and Methods

2.1. Study Site

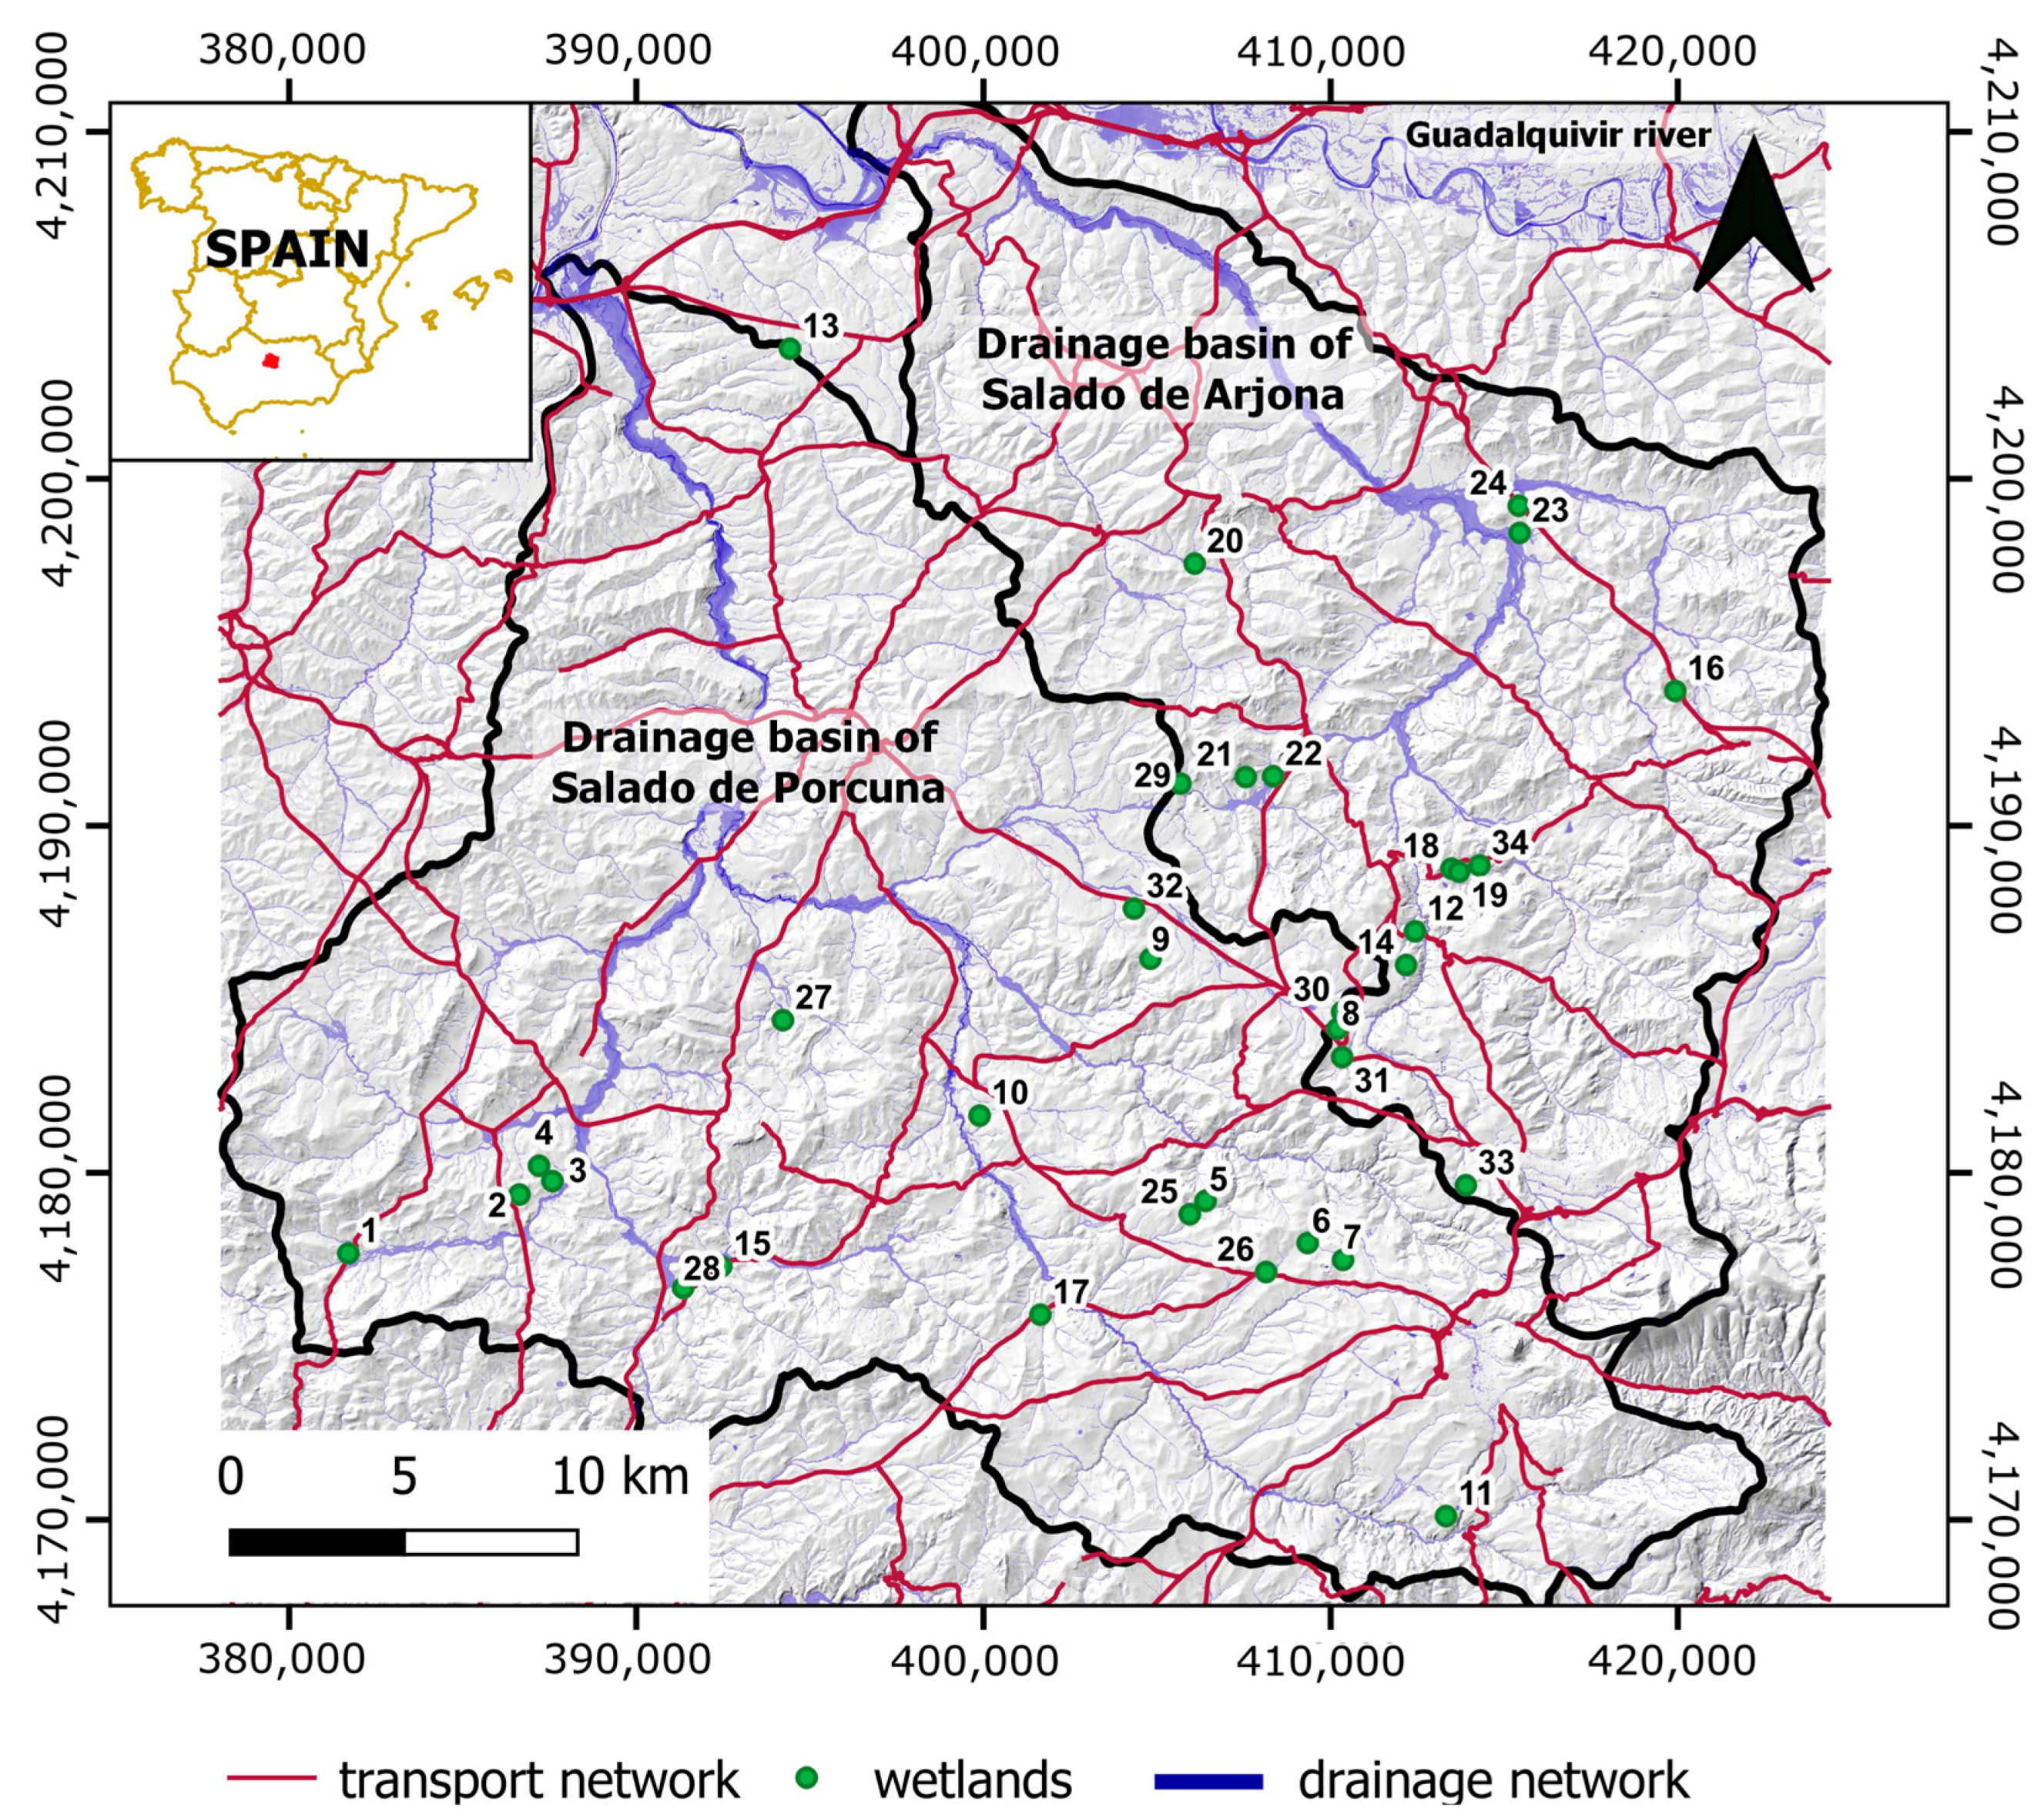
The study area locates at the upper Guadalquivir River basin in Andalusia (SW, Spain). There are two drainage sub-basins, Salado de Porcuna and Salado de Arjona streams, with areas of 809 km2 and 490 km2, respectively (Figure 2). The average slope of both basins is around 12%. The most prevalent soil horizons are Vertisols, Cambisols, and Regosols types, characterised by significant clay concentrations [33]. Traditional olive groves are the main crop in both basins (84.5% of the surface in Salado of Porcuna and 91.1% in Salado of Arjona) with 10 × 10 m plantation frames. Generally, the land is maintained with a low density of vegetation cover; this predominant management causes soil compaction, which prevents water infiltration. This results in an increase in surface runoff in the area, giving rise to the dragging of sediments.
Several reasons make this site an ideal natural laboratory to implement our simulation model. On the one hand, it is a homogeneous area regarding soil type and weather. Furthermore, both sub-basins are typically endorheic, included in the so-called Betic endorheism [34]. On the other hand, the ephemeral wetlands of this region have been extensively studied in the past [35,36], so we had ample information to validate our model.
For the sake of conciseness, we provide a summary of the main characteristics and refer the reader to [32] for extra details.

2.2. Description of Modelling Software

The software used to perform the simulation described in the following sections was IBER [23,24,25]. It is free software with a friendly interface, which makes it a relatively easy-to-use model, allowing rapid learning [37]. These characteristics make it an optimal tool to be used by managers and stakeholders in the field of environmental management.
IBER was developed by several Spanish universities and research centres, with funding from the General Water Directorate of the Spanish Ministry of the Environment. It is a two-dimensional open-channel flow modelling tool that combines a hydrodynamic module, a turbulence module and a sediment transport module. The theoretical foundation of the model is based on the resolution of the two-dimensional Saint-Venant equations, also known as shallow water equations [23]:
h t + · h   u = P I ,
h   u t + · h   u   u +   g   h 2 2 = g   h   y b g n 2 h 1 / 3   u   u   ,    
where t is time, h is the depth of the water (measured in its vertical coordinate), u is the depth-averaged velocity vector, y b is the height (altitude) of the bed, and g is the acceleration due to gravity. The source terms in the continuity equation Equation (1) represent the precipitation intensity, P, and the infiltration rate, I. At the momentum balance Equation (2), the bed slope ∇ y b can be found, and the shear stress at the bottom can be evaluated with the Manning roughness coefficient, n.
We solved the hyperbolic system of Equations (1) and (2) in IBER with a Roe-type finite volume method [24]. In addition, we activated the hydrology module to include the rainfall source term P in the continuity Equation (1). This module makes it possible to calculate the rainfall-runoff transformation in an entire basin, which accumulates the surface waters in the depressions on the landscape. We neglected other physical processes, such as water infiltration into the soil, underground flow, evapotranspiration, and percolation [23], because of the short duration of the simulated storms and the hydrophobic soil conditions developing under the current soil uses and management [32]. Furthermore, we activated the IBER+ plugin to take advantage of the parallelisation functionalities in the GPU, ensuring a much higher calculation acceleration than the standard version.

2.3. The Use of IBER+ to Map Temporary and Ephemeral Isolated Wetlands

Figure 3 shows an overview of the methodology and the distributed hydrological–hydraulic modelling stages. Before running the simulation, the model parameters must be characterised; that is, the boundary of the drainage basin, the precipitation conditions, the terrain’s roughness coefficient, and the infiltration rate must be chosen (Table 1). A high-resolution DEM suitable for distributed hydrological simulations is also needed to set the elevations in the computational mesh. Hence, hydraulic infrastructures such as underpasses and artificial channels, among others, need to be modelled geometrically to avoid water accumulation in spurious areas. After setting the physical model parameters (see details in Section 2.3.1), the numerical simulation should be executed in the GPU to achieve reasonable computational times. We ran the computations using single precision in an Nvidia RTX 3090, which speeded up the simulation by a factor of 30 regarding a single core of Intel Ice-Lake Gold 6330 processor. The NVidia RTX 3090 yields 36 Tflops for single precision simulations for less than USD 3000, corroborating the cheap cost of high-performance computations in the present day. The combination of the three rasters resulting from the simulation (i.e., the flow depth raster, the shear stress raster, and the flow velocity raster) must be analysed to make a final decision (see details in Section 2.3.2). Finally, the results of the rasters are validated with historical orthography and previous inventories.

2.3.1. Configuration of the Physical Parameters in the Hydrological Model

As mentioned, we reproduced the hydrological behaviour of the two streams’ drainage basins by simulating extreme rainfall events with the IBER+ software [23]. To determine the precipitation conditions in the simulation, we used the existing rainfall series around the study area provided by the Spanish Meteorological Agency (AEMET) (https://sede.aemet.gob.es, accessed on 30 January 2022). We obtained the typical rainfall regime with these data, mainly oriented to the maximum daily values in stations near the study area. We obtained the maximum daily values for different return periods from the analysis of frequencies. The most relevant precipitation data in the simulation are:
  • The maximum rainfall intensity in the previous studied years;
  • The duration of a usual rain event in the study area.
The distributed hydrological module in the IBER+ program allows calculating the rain-runoff transformation in an entire basin since it is possible to use it in small and medium-sized watersheds. Then a precipitation scenario is simulated. In the present study, the primary input data correspond to an event of 5.4 mm·h−1 for 24 h, assigned as for the P-parameter in the IBER+ model to maximise the effects of the generated runoff. The infiltration (I in Equation (1)) can be incorporated into the hydrological model through the SCS method [38]. This method allows evaluation of the capacity and velocity of mean infiltration depending on the land use and the existing slope [39]. In the most unfavourable cases, infiltration is considered null, as in the current study.
The value of the roughness of the terrain depends on the land uses. We employed the SIOSE v2018 database of the National Geographic Institute of Spain to determine them. For the olive grove surface lacking vegetation around the crops (>80% of the drainage area), we set the value of Manning roughness to n = 0.025 s·m−1/3 since it adapts to soils with mostly silt and clay contents [32].
To simulate the dynamics of surface waters in the whole catchment, we specify as many boundary conditions (flow entry and exit) as required to imitate its fluvial dynamics. We chose the rectangular computational domain shown in Figure 2, which includes the two watersheds of Arjona and Porcuna, and set an open boundary there. For the computational calculation, a uniform structured mesh was constructed (square geometry) with a cell size of 10 m, which has generated more than 20 × 106 elements. We built the digital elevation model from the Light Detection and Ranging (LiDAR) dataset acquired on May 2021 by the National Geographic Institute (IGN) (https://www.ign.es, accessed on 30 January 2022), with a point density of 1.5 points per square meter and a mean square error of altimetric precision of 0.15 m. We kept only the ground points from the LiDAR, removing the other point categories (i.e., water, vegetation, and building, among others). Given the long-lasting drought period, which started in 2014, and the dry state of the basin’s drainage network (which is unregulated), most wetlands were nearly empty at the time of data collection. This prolonged dry situation allows for more accurate ground elevation data to be obtained because, since the laser is absorbed by water, data cannot be obtained in flooded areas during wet periods.

2.3.2. Creating a Raster for Wetland Mapping

We used the IBER+ program to carry out the distributed hydrological–hydraulic modelling of the catchments. The calculation of the model provides the water flow distribution as a function of space and time. In this model, two variables are of our interest:
  • The water depth h ;
  • The magnitude of the water velocity v = | u | .
The depth of the water in an ephemeral wetland is usually shallow and variable. Choosing an appropriate threshold value   z that distinguishes the water stored in the wetland ( h z ) from runoff ( h < z ) is necessary. An iterative process is needed to determine it. The selected value must be decreased when the model does not detect previously catalogued wetlands. In this study, we used data from the competent administration in our area [35], and after the iteration process, we found the optimal value z = 0.1 m. However, the flow depth in gullies, streams, and rivers is also deeper than 0.1 m, and one needs to remove them from the output map for wetlands. The water flow velocity in the wetland areas is usually low ( v x ) since the high speeds correspond to the surrounding water flowing through the channels and rills ( v > x ). We found that the velocity frequency histogram serves to identify the limiting value x . The histogram in Figure 3 clearly distinguishes two velocity ranges. Water flow velocities lower than 0.025 m·s−1 are too small for gullies and streams. Therefore, we constructed a raster file representing the areas that meet at the same time both criteria: h z and v x with z = 0.1 m and x = 0.025 m·s−1.
All the procedure described above was performed with Matlab software. We coded an in-house algorithm that imports the output data from Iber and creates the histograms to detect the threshold values z and x . Subsequently, constructing the raster that takes the unit value when the criterion h z and v x is satisfied, or zero otherwise, was straightforward. The new map locations with unit values fulfil both conditions and show us the situation of the wetlands. The generated map can then be exported and visualised through a GIS program. This methodology provides the precise location of ephemeral wetlands and other water accumulation systems such as artificial ponds, quarries, and the already catalogued wetlands.
We required two additional criteria to detect endorheic ephemeral wetlands: the possible candidate areas should be disconnected from outflow water and cannot be urban areas. Whilst the IBER software does not see permanent bodies of water by itself, the user can further use the model outputs to locate the ephemeral wetlands following the proposed methodology.

2.4. Model Verification

To verify the suitability of the proposed methodology, we used different sources of information. The first one was aerial photographs, both current and historical, to identify the potential wetlands detected by our model. In order to facilitate this search, orthophotos from rainy years were used. In this phase, signs of temporary water accumulation were verified, such as the presence of water; border-type vegetation; and absence, or less growth, of the olive grove, since this is not very resistant to flooding. Urban areas were excluded, even though some might have been wetlands in the past. The second source of information was previously published wetlands inventories, which allowed us to confirm that the generated map locates a known wetland. Namely, we used the wetland catalogue of the Junta de Andalucía, the Regional Public Administration, and the inventory of researchers from the University of Jaén [36]. Finally, we conducted an in situ verification after a recent rain event. After confirmation, we classified the detected wetlands according to four typologies. Type 1 wetlands correspond to those where surface water appears in some of the historical orthophotos. Type 2 wetlands are those where the historical orthophotos lack a water body, but the presence of marsh vegetation suggests the presence of water in other periods. Type 3 wetlands are disappeared wetlands without water or marsh vegetation since the 1950s. Finally, type 4 includes wetlands that arise due to the drainage deficiencies of anthropic civil infrastructures such as roads or lanes.

3. Results

Table 2 lists all the wetlands in the study area, both previously inventoried and detected by our methodology. As you can see, these are minimal wetlands. Most are smaller than 5 ha (mean ± SD = 3.8 ± 5.9 ha), and the smallest is just 0.5 ha. Only two wetlands (#22 and 23) are larger than the rest and are considered outliers, higher than 10.05 ha according to Tukey’s test. Remember that this area refers to its maximum capacity, only flooded in very humid periods. Its surface is usually much smaller, and the wetland may be completely dry.
The proposed simulation model detected thirty-one wetlands (Table 2; Figure 2). Only three of the wetlands previously inventoried in the study area by the Regional Public Administration [35] and Ortega et al. [36] have not been detected by the raster (i.e., #1, 25 and 29). Laguna de la Roa (#1) and Laguna de Hituelo 2 (#25) might be considered false negatives (FN). However, it must be pointed out that the raster did not detect them because they are systems connected to water flow, with high velocities that reach 0.2 m·s−1, when the limit we defined for detecting wetlands is only 0.025 m·s−1. Laguna de Torrealcazar (#29) is a true negative (TN) since its existence is not recorded on any historical map or orthophotography.
The raster has detected the rest of the inventoried wetlands; they are true positives (TP). Consequently, our model has successfully seen 89% of the catalogued wetlands. Figure 4 illustrates the raster locating some of these wetlands and the corresponding orthophotos in a rainy year (i.e., 2013).
Six unknown wetlands, which had yet to be inventoried in any previous study, have been located with our novel approach (i.e., #10 to #15); to name these new records, we have chosen names from current or historical toponymy. However, after visiting these places, we verified that two are unnatural and arise from anthropogenic activities or infrastructures, that is, by a quarry (#12) and by a road without adequate drainage (#15); consequently, they can be considered false positives (FP). The rest of these new wetlands (i.e., #10, 11, 13, and #14) are true positives (TP). Therefore, 13% of the detected wetlands are new records. As shown in Figure 5, only one of these unknown wetlands (i.e., #10) was recently flooded. The rest have disappeared (i.e., 14) or exhibit only marsh vegetation without water in the orthophotos (i.e., wetlands type 2: #11 and 13). Considering the total number of previously inventoried wetlands and new ones (#12 and 15 excluded), 24% have disappeared (type 3). These wetlands have been drained, ploughed, or converted into irrigation ponds, or they have been without water or marsh vegetation since 1956 (the oldest orthophotos).
In 67% of the wetlands, water (type 1) or marsh vegetation (type 2) has been observed intermittently in recent decades. The orthophotos suggest that in addition to #15, wetlands #24 and #32 arise due to poor road drainage (type 4); therefore, they can be considered false positives (FP).
In summary, 79% of the wetlands detected by our methodology are true positives, 3% are true negatives, 12% are false positives, and 6% are false negatives.

4. Discussion

There is a broad consensus that wetlands are among the most threatened ecosystems in the world [40], but they cannot be protected or recovered if they are invisible. The proposed methodology is very effective in making them visible since it is capable of locating small isolated ephemeral wetlands quickly and cheaply. At present, the availability of free software for distributed hydrological simulations based on the two-dimensional Saint-Venant equations, with specific plugins for speeding up the calculations in modern GPUs, allows the analysis of catchment areas of 1000 km2 with spatial resolutions of 10 m. In the present study, we detected thirty-one wetlands, where 13% of them were new records. Furthermore, the model found 89% of the wetlands previously catalogued by the Public Administration or research teams.
Three wetlands have yet to be found. The Hituelo 2 and La Roa wetlands have not been sited because they are not isolated wetlands; they are systems connected to water flow, as explained in the results section. In addition, both are silted-up ponds, which might explain why the raster does not map them. In the case of the Torrealcazar wetland, the lack of definition in the original georeferencing of Ortega et al. [36] has not allowed us to determine if the wetland has not been detected due to our threshold parameters or other reasons. Note that the UTM reference system used in their inventory has a cell size of 1 × 1 km, much larger than the characteristic wetland area.
For regions where permanent water wetlands are predominant, our method could also be applied using a digital terrain model that adequately captures the topographic depressions as input data for the elevations. Most remote sensing methodologies already developed in recent years are helpful in these territories. By contrast, very few tools allow rapid detection of ephemeral or extinct wetlands, which are common and widespread habitats occurring, often in abundance, in all biogeographical regions [41]. It may be significant for studies in arid and semi-arid areas since drylands may increase to 56% of the land surface by the end of the 21st century [42]. Consequently, the potential and usefulness of this methodology are very high.
In addition to all the benefits of the IBER+ tool already described by its creators [24], we must add the one shown in this work. Besides its potential to respond to current requirements of European legislation, in terms of numerical modelling of fluvial processes [24], this tool can be useful for environmental managers since it allows them to locate all kinds of wetlands quickly, both inventoried and unknown, as well as making a more accurate estimation of their disappearance rate. Once found, the later analysis of historical orthophotography and on-site visits will allow for detailing the actions that have led to their disappearance. That is especially relevant for arid and semi-arid endorheic regions, where wetlands are often minimal and indistinguishable from uplands in their dry phases, making them highly vulnerable to loss or degradation [43,44].
As mentioned above, this methodology can help detect how the changes in land use can affect wetlands and lead to their disappearance. In this sense, expert scientists in the matter at hand emphasise that in a restoration context, understanding land-use histories helps choose intervention sites [9]. Likewise, they insist on the urgency of expanding knowledge about the loss of these ecosystems through continuous monitoring of their coverage via remote sensing, national reporting, and networks of sites [9]. Along the same lines, Finlayson and colleagues [2] point out that where a wetland is both highly valued and highly vulnerable to climate change, such as the wetlands in our study, ‘avoid’ type targets may be appropriate, at least in the short term. This target type indicated key knowledge needs for monitoring and evaluation against a pre-determined baseline. Our methodology is very valuable in this context.
Furthermore, it also identifies wetlands that arise due to specific anthropic infrastructures. On this matter, it can help managers decide whether to avoid the formation of these wetlands or, on the contrary, favour them as artificial aquatic ecosystems, that is, as nature-based solutions (NbS) that can provide ecosystem services similar to those of natural ones [45]. In this context, we recently showed that highly resolved computational fluid dynamics simulations of hydrological and hydraulic processes, using the 2D Saint-Venant equations, yield the optimal location of NbS (e.g., natural and artificial wetlands, vegetal cover, riparian restoration, gravels seeding in streambeds, etc.) to provide the most benefits for minimising the water discharges and the erosion-prone area, maximising the soil infiltration capacity [46]. Consequently, the location and restoration of extinct wetlands, or even the artificial creation of new ones, are of great importance for adaptation to climate change since they reduce the risk of flooding and minimise the effects of drought. The economic benefits are evident since, at present, in the EU and the United Kingdom, river flooding causes annual damage of EUR 7.6 (5.6–11.2) billion per year and exposes around 166,000 (124,000–276,000) people per year to inundation [47].
Another advantage of this methodology is that it allows managers to act quickly. Note that wetlands are also threatened by the lag time between identifying an emergency and the time needed for the decision taken and the subsequent actions [48]. Considering the high risk of disappearance of these valuable ecosystems, the urgent need for updated data on wetlands’ inventory makes this methodology more than appropriate since we are saving time in favour of wetlands to recognise their status.
Hence, this tool reduces the cost of updating inventories. Searching for hidden aquatic ecosystems is a costly research activity. A research team must travel many kilometres looking for a specific area, using many working days to months to measure the ecosystem’s size (without considering the time of samplings). While using this methodology, one person can cover the initial assessment phase in several hours (days).
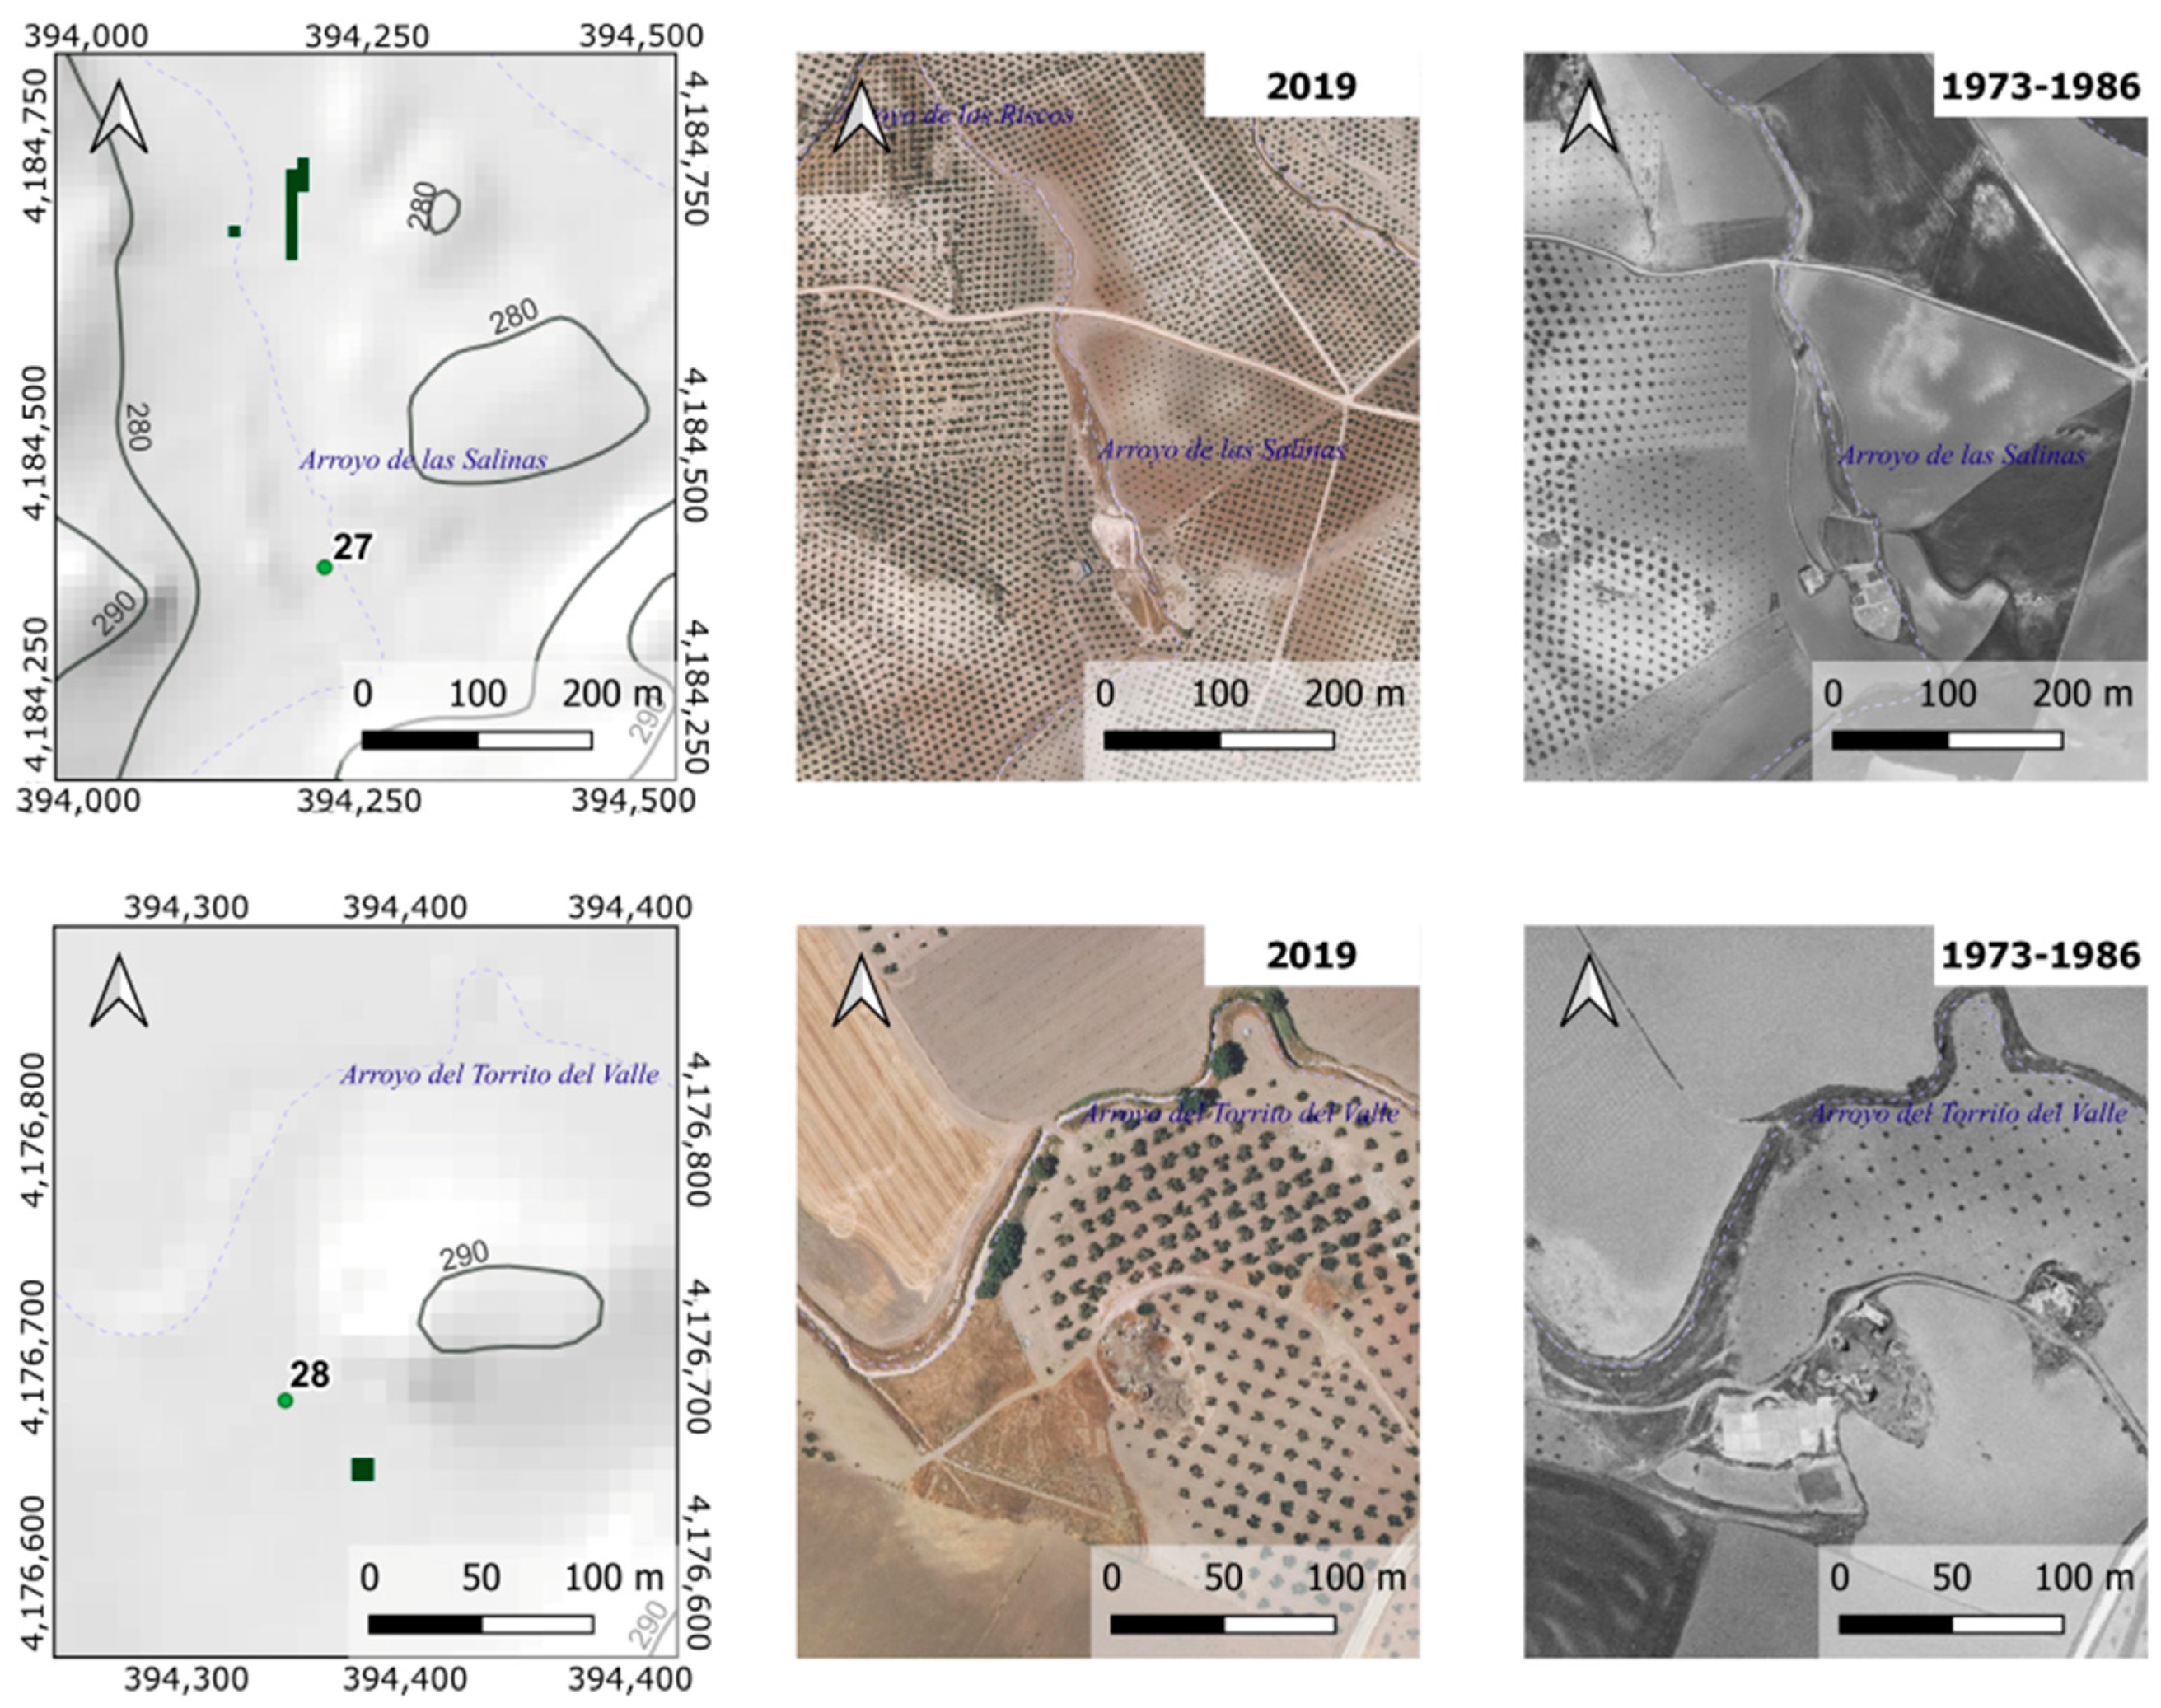
Apart from identifying tiny, short-lived wetlands, this tool might help locate missing or disappearing cultural heritage, such as inland salt flats (Figure 6).
These ancient salines were built from natural saline wetlands and fed with salt water from nearby springs or streams. Our model has detected two abandoned salt flats: the Salinas de la Orden (#27) and the Salinas de Valdeutiel (#28), next to the Las Salinas stream and the Torrito del Valle stream, respectively. They are very ancient salt pans that belonged to the military Order of Calatrava and were already mentioned in documents from the 15th century [49,50]. In the case of the Valdeutiel salt flats, the existence of al-Andalus deposits associated with the exact location of these salt flats suggests that they were exploited at least since the 10th–11th century [49,50]. But both salt pans may be even older, dating back to Roman times, since numerous deposits identified as uillae have been documented, of which only the Cortijo de Valdeutiel (Santiago de Calatrava) and the Cerro de la Orden (Porcuna) seem to be associated with salt pans [50]. Undoubtedly, the inland traditional salt flats are a cultural heritage that must be preserved. In fact, due to their rarity and vulnerability, half of the current salt pans in Spain are included in the Natura 2000 network [51]. The tool shown here might be helpful in this challenge.
In summary, our results show that technological advances can rescue temporary and ephemeral wetlands by reducing their vulnerability by making them visible. Wetlands’ value goes beyond just the specific diversity it treasures, the diversification of habitats and beauty they give to the landscape, and the singularity of their communities adapted to their high dynamism and spatial-temporal heterogeneity, enhancing their valuation. They are essential in the current context of adaptation to climate change since wetlands prevent the risk of flooding and runoff; they are aquifer recharge zones—thus mitigating the effects of drought—they are carbon sinks and green corridors that allow the dispersal and migration of many species [52,53,54,55,56]. Wetlands also improve water quality and are natural treatment plants. Consequently, directly or indirectly, wetlands are related to most of Horizon Europe’s global challenges: health (i.e., environmental health, water quality), civil security (i.e., disaster resilience), climate solutions, protection of biodiversity and ecosystems, etc. Last but not least, their preservation and restoration align with the Kunming-Montreal Global Biodiversity Framework (GBF) targets. Specifically, the second target ensures that by 2030 at least 30 per cent of degraded inland water areas are under effective restoration to enhance biodiversity and ecosystem functions and services, ecological integrity, and connectivity.
This study has presented a methodology that can help to find out temporary and ephemeral wetlands in areas classified as arid and semi-arid, such as the study area. The appropriateness of the information obtained was validated and verified using previous studies, inventories, and our sampling. In the current context of adaptation to climate change, this technique can be a handy, inexpensive, and agile resource for managers to conserve this type of ecosystem and their biodiversity. Furthermore, the recovery and restoration of wetlands could mitigate other types of threats related to extreme climate events by reducing the risk of flooding, especially in towns surrounded by agricultural areas with null soil protection, and favours the recharge of aquifers [46].
In conclusion, wetland inventories still need to be improved in many regions worldwide (e.g., China, South America, and Russia); additionally, small and ephemeral wetlands are often ignored or not identified in those areas where inventories have already been conducted [17,18]. Their small size, short hydroperiod, or severe disturbance—most of them has been transformed into farmland—make these ponds undetectable by most remote sensing systems. Therefore, the methodology presented in this study can fill this knowledge gap and help improve the existing inventories. It has successfully detected 89% of the previously catalogued wetlands and found four new unknown wetlands. In addition, it has helped determine that the 24% of the wetlands of this area have disappeared due to global change. It has also detected new flood zones due to human activities that could be considered when implementing Nature-Based Solutions that help adapt to climate change. The results support the suitability of this methodology as an assessment valuable tool for environmental management and decision-making. It is shown as an easy, fast and cheap way to locate wetlands that can be restored or preserved while allowing managers and stakeholders to monitor their state of conservation. In this sense, it can be beneficial to achieve some of the targets of the Kunming-Montreal Global Biodiversity Framework.

Author Contributions

Conceptualization, P.B., F.J.P.-L., R.J.-M., and G.P.; methodology, P.B.; software, P.B. and I.G.-P.; validation, all authors.; formal analysis, P.B.; writing—original draft preparation, R.J.-M.; writing—review and editing, All authors; project administration, P.B. and G.P.; funding acquisition, P.B., F.J.P.-L., R.J.-M., and G.P. All authors have read and agreed to the published version of the manuscript.

Funding

This work was funded by: “Programa Operativo FEDER 2014–2020” and “Consejería de Economía y Conocimiento de la Junta de Andalucía” grant number 138096; the European Union NextGenerationEU/PRTR and MCIN/AEI/10.13039/501100011033 grant number TED2021-129910BI00.

Data Availability Statement

Not applicable.

Conflicts of Interest

The authors declare no conflict of interest.

References

  1. Gudka, M.; Davies, J.; Poulsen, L.; Schulte-Herbrüggen, B.; MacKinnon, K.; Crawhall, N.; Henwood, W.D.; Dudley, N.; Smith, J. Conserving Dryland Biodiversity: A Future Vision of Sustainable Dryland Development. Biodiversity 2014, 15, 143–147. [Google Scholar] [CrossRef]
  2. Finlayson, C.M.; Capon, S.J.; Rissik, D.; Pittock, J.; Fisk, G.; Davidson, N.C.; Bodmin, K.A.; Papas, P.; Robertson, H.A.; Schallenberg, M.; et al. Policy Considerations for Managing Wetlands Under a Changing Climate. Mar. Freshw. Res. 2017, 68, 1803–1815. [Google Scholar] [CrossRef] [Green Version]
  3. González Bernáldez, F.; Montes del Olmo, C. Los Humedales del Acuífero de Madrid. Inventario y Tipología Basada en su Origen y Funcionamiento; Departamento de Ecología, Universidad Autónoma de Madrid: Madrid, Spain, 1989. [Google Scholar]
  4. Casado de Otaola, S.; Montes del Olmo, C. Guía de los Lagos y Humedales de España; Ecosistemas: Madrid, Spain, 1995. [Google Scholar]
  5. Gilbert, J.D.; de Vicente, I.; Ortega, F.; García-Muñoz, E.; Jiménez-Melero, R.; Parra, G.; Guerrero, F. Linking Watershed Land Uses and Crustacean Assemblages in Mediterranean Wetlands. Hydrobiologia 2017, 799, 181–191. [Google Scholar] [CrossRef]
  6. Jiménez-Melero, R.; Jarma, D.; Gilbert, J.D.; Ramírez-Pardo, J.M.; Guerrero, F. Cryptic Diversity in a Saline Mediterranean Pond: The Role of Salinity and Temperature in the Emergence of Zooplankton Egg Banks. Hydrobiologia 2023, 850, 3013–3029. [Google Scholar] [CrossRef]
  7. Let, M.; Pal, S. Socio-Ecological Well-being Perspectives of Wetland Loss Scenario: A Review. J. Environ. Manag. 2023, 326, 116692. [Google Scholar] [CrossRef]
  8. Barbosa, L.G.; Amorim, C.A.; Parra, G.; Laco Portinho, J.; Morais, M.; Morales, E.A.; Menezes, R.F. Advances in Limnological Research in Earth’s Drylands. Inland Waters 2020, 10, 429–437. [Google Scholar] [CrossRef]
  9. Fluet-Chouinard, E.; Stocker, B.D.; Zhang, Z.; Malhotra, A.; Melton, J.R.; Poulter, B.; Kaplan, J.O.; Goldewijk, K.K.; Siebert, S.; Minayeva, T.; et al. Extensive Global Wetland Loss Over the Past Three Centuries. Nature 2023, 614, 281–286. [Google Scholar] [CrossRef]
  10. Darrah, S.E.; Shennan-Farpón, Y.; Loh, J.; Davidson, N.C.; Finlayson, C.M.; Gardner, R.C.; Walpole, M.J. Improvements to the Wetland Extent Trends (WET) Index as a Tool for Monitoring Natural and Human-made Wetlands. Ecol. Ind. 2019, 99, 294–298. [Google Scholar] [CrossRef]
  11. Borja Barrera, C.; Camacho González, A.; Florín Beltrán, M. Lagos y Humedales en la Evaluación de los Ecosistemas del Milenio en España. Ambient. Rev. Minist. Medio Ambiente 2012, 98, 82–90. [Google Scholar]
  12. Finlayson, C.; Everard, M.; Irvine, K.; McInnes, R.J.; Middleton, B.A.; van Dam, A.; Davidson, N. The Wetland Book I: Structure and Function, Management and Methods; Springer: Berlin, Germany, 2018. [Google Scholar]
  13. WFD. WFD Directive 2000/60/EC of the European Parliament and of the Council of 23 October 2000 Establishing a Framework for Community Action in the Field of Water Policy; European Parliament: Strasbourg, France, 2000.
  14. Beklioglu, M.; Romo, S.; Kagalou, I.; Quintana, X.; Bécares, E. State of the Art in the Functioning of Shallow Mediterranean Lakes: Workshop Conclusions. Hydrobiologia 2007, 584, 317–326. [Google Scholar] [CrossRef]
  15. Zacharias, I.; Zamparas, M. Mediterranean Temporary Ponds. A Disappearing Ecosystem. Biodivers. Conserv. 2010, 19, 3827–3834. [Google Scholar] [CrossRef]
  16. Jeppesen, E.; Brucet, S.; Naselli-Flores, L.; Papastergiadou, E.; Stefanidis, K.; Nõges, T.; Nõges, P.; Attayde, J.L.; Zohary, T.; Coppens, J.; et al. Ecological Impacts of Global Warming and Water Abstraction on Lakes and Reservoirs Due to Changes in Water Level and Related Changes in Salinity. Hydrobiologia 2015, 750, 201–227. [Google Scholar] [CrossRef]
  17. EC. Horizon Europe—Work Programme 2023–2024 Food, Bioeconomy, Natural Resources, Agriculture and Environment; European Commission: Brussels, Belgium, 2022.
  18. Calhoun, A.J.; Mushet, D.M.; Bell, K.P.; Boix, D.; Fitzsimons, J.A.; Isselin-Nondedeu, F. Temporary Wetlands: Challenges and Solutions to Conserving a ‘disappearing’ ecosystem. Biol. Conserv. 2017, 211, 3–11. [Google Scholar] [CrossRef]
  19. Rover, J.R.; Mushet, D.M. Mapping Wetlands and Surface Water in the Prairie Pothole Region of North America: Chapter 16. In Remote Sensing of Wetlands: Applications and Advances; CRC Press: Boca Raton, FL, USA, 2015. [Google Scholar]
  20. Palmeri, L.; Trepel, M. A GIS-Based Score System for Siting and Sizing of Created or Restored Wetlands: Two Case Studies. Water Resour. Manag. 2002, 16, 307–328. [Google Scholar] [CrossRef]
  21. Bartsch, A.; Wagner, W.; Scipal, K.; Pathe, C.; Sabel, D.; Wolski, P. Global Monitoring of Wetlands—The Value of ENVISAT ASAR Global Mode. J. Environ. Manag. 2009, 90, 2226–2233. [Google Scholar] [CrossRef]
  22. Liu, Y.; Zhang, H.; Zhang, M.; Cui, Z.; Lei, K.; Zhang, J.; Yang, T.; Ji, P. Vietnam Wetland Cover Map: Using Hydro-Periods Sentinel-2 Images and Google Earth Engine to Explore the Mapping Method of Tropical Wetland. Int. J. Appl. Earth Obs. 2022, 115, 103122. [Google Scholar] [CrossRef]
  23. Sanz Ramos, M.; Cea Gómez, L.; Bladé i Castellet, E.; Lopez Gomez, D.; Sañudo Costoya, E.; Corestein Poupeau, G.; García Alén, G.; Aragón Hernández, J.L. Iber V3: Manual de Referencia E Interfaz de Usuario de las Nuevas Implementaciones; International Centre for Numerical Methods in Engineering: Barcelona, Spain, 2022. [Google Scholar]
  24. Bladé, E.; Cea, L.; Corestein, G.; Escolano, E.; Puertas, J.; Vázquez-Cendón, E.; Dolz, J.; Coll, A. Iber: Herramienta De Simulación Numérica Del Flujo En Ríos. Rev. Int. Métodos Numéricos Cálculo Diseño Ing. 2014, 30, 1–10. [Google Scholar] [CrossRef] [Green Version]
  25. García-Feal, O.; González-Cao, J.; Gómez-Gesteira, M.; Cea, L.; Domínguez, J.M.; Formella, A. An Accelerated Tool for Flood Modelling Based on Iber. Water 2018, 10, 1459. [Google Scholar] [CrossRef] [Green Version]
  26. Morales-Hernández, M.; Sharif, M.B.; Kalyanapu, A.; Ghafoor, S.K.; Dullo, T.; Gangrade, S.; Kao, S.; Norman, M.R.; Evans, K.J. TRITON: A Multi-GPU Open Source 2D Hydrodynamic Flood Model. Environ. Model. Softw. 2021, 141, 105034. [Google Scholar] [CrossRef]
  27. Caviedes-Voullième, D.; Morales-Hernández, M.; Norman, M.R.; Özgen-Xian, I. SERGHEI (SERGHEI-SWE) V1.0: A Performance-Portable High-Performance Parallel-Computing Shallow-Water Solver for Hydrology and Environmental Hydraulics. Geosci. Model Dev. 2023, 16, 977–1008. [Google Scholar] [CrossRef]
  28. Sharifian, M.K.; Kesserwani, G.; Chowdhury, A.A.; Neal, J.; Bates, P. LISFLOOD-FP 8.1: New GPU-Accelerated Solvers for Faster Fluvial/Pluvial Flood Simulations. Geosci. Model Dev. 2023, 16, 2391–2413. [Google Scholar] [CrossRef]
  29. IGN. Spanish National Geographic Institute. Plan Nacional de Ortofotografía Aérea. Available online: http://pnoa.ign.es/ (accessed on 30 January 2022).
  30. Peral-García, P.; Fernández-Victorio, B.; Ramos-Calzado, P. Serie de Precipitación Diaria en Rejilla con Fines Climáticos.; Agencia Estatal de Meteorología, Ministerio para la Transición Ecológica y el Reto Demográfico: Madrid, Spain, 2017.
  31. Bohorquez, P.; Del Moral-Erencia, J.D. 100 Years of Competition between Reduction in Channel Capacity and Streamflow during Floods in the Guadalquivir River (Southern Spain). Remote Sens. 2017, 9, 727. [Google Scholar] [CrossRef] [Green Version]
  32. del Moral-Erencia, J.D.; Bohorquez, P.; Jimenez-Ruiz, P.J.; Pérez-Latorre, F.J. Flood Hazard Mapping with Distributed Hydrological Simulations and Remote-Sensed Slackwater Sediments in Ungauged Basins. Water 2021, 13, 3434. [Google Scholar] [CrossRef]
  33. REDIAM. WMS Mapa de Suelos de Andalucía; REDIAM: Seville, Spain, 2023. [Google Scholar]
  34. Durán, J.J.; López-Martınez, J. Torcal De Antequera, Karst Yesıfero De Gobantes, Sierras De Abdalajıs Y Desfiladeros De El Chorro. Elementos de los Paisajes de la Provincia de Málaga; Servicio de Publicaciones de la Universidad de Málaga: Málaga, Spain, 1999; pp. 111–130. [Google Scholar]
  35. Junta de Andalucía. Plan Andaluz De Humedales; Junta de Andalucía: Andalucía, Spain, 2002.
  36. Ortega, F.; Parra, G.; Guerrero, F. Los humedales del Alto Guadalquivir: Inventario, tipologías y estado de conservación. In Ecología, Manejo y Conservación de los Humedales; Paracuellos, M., Ed.; Instituto de Estudios Almerienses: Almería, Spain, 2003; pp. 113–123. [Google Scholar]
  37. Pérez-Montiel, J.I.; Cardenas-Mercado, L.; Nardini, A.G.C. Flood Modeling in a Coastal Town in Northern Colombia: Comparing MODCEL Vs. IBER. Water 2022, 14, 3866. [Google Scholar] [CrossRef]
  38. Boughton, W.C. A Review of the USDA SCS Curve Number Method. Soil Res. 1989, 27, 511–523. [Google Scholar] [CrossRef]
  39. Mishra, S.K.; Jain, M.K.; Bhunya, P.K.; Singh, V.P. Field Applicability of the SCS-CN-Based Mishra–Singh General Model and its Variants. Water Resour. Manag. 2005, 19, 37–62. [Google Scholar] [CrossRef]
  40. van Asselen, S.; Verburg, P.H.; Vermaat, J.E.; Janse, J.H. Drivers of Wetland Conversion: A Global Meta-Analysis. PLoS ONE 2013, 8, e81292. [Google Scholar] [CrossRef] [Green Version]
  41. Williams, P.; Biggs, J.; Fox, G.; Nicolet, P.; Whitfield, M. History, Origins and Importance of Temporary Ponds. Freshw. Forum 2001, 17, 7–15. [Google Scholar]
  42. Huang, J.; Yu, H.; Guan, X.; Wang, G.; Guo, R. Accelerated Dryland Expansion Under Climate Change. Nat. Clim. Chang. 2016, 6, 166–171. [Google Scholar] [CrossRef]
  43. Boix, D.; Biggs, J.; Céréghino, R.; Hull, A.P.; Kalettka, T.; Oertli, B. Pond Research and Management in Europe: “Small is Beautiful”. Hydrobiologia 2012, 689, 1–9. [Google Scholar] [CrossRef] [Green Version]
  44. Boix, D.; Kneitel, J.; Robson, B.J.; Duchet, C.; Zúñiga, L.; Day, J.; Gascón, S.; Sala, J.; Quintana, X.D.; Blaustein, L. Invertebrates of freshwater temporary ponds in Mediterranean climates. In Invertebrates in Freshwater Wetlands; Springer: Berlin/Heidelberg, Germany, 2016; pp. 141–189. [Google Scholar]
  45. Gooden, J.; Pritzlaff, R. Dryland Watershed Restoration with Rock Detention Structures: A Nature-Based Solution to Mitigate Drought, Erosion, Flooding, and Atmospheric Carbon. Front. Environ. Sci. 2021, 9, 679189. [Google Scholar] [CrossRef]
  46. Bohorquez, P.; Pérez-Latorre, F.J.; González-Planet, I.; Jiménez-Melero, R.; Parra, G. Nature-Based Solutions for Flood Mitigation and Soil Conservation in a Steep-Slope Olive-Orchard Catchment (Arquillos, SE Spain). Appl. Sci. 2023, 13, 2882. [Google Scholar] [CrossRef]
  47. Dottori, F.; Mentaschi, L.; Bianchi, A.; Alfieri, L.; Feyen, L. Cost-Effective Adaptation Strategies to Rising River Flood Risk in Europe. Nat. Clim. Chang. 2023, 13, 196–202. [Google Scholar] [CrossRef]
  48. Parra, G.; Guerrero, F.; Armengol, J.; Brendonck, L.; Brucet, S.; Finlayson, C.M.; Gomes-Barbosa, L.; Grillas, P.; Jeppesen, E.; Ortega, F. The Future of Temporary Wetlands in Drylands Under Global Change. Inland Waters 2021, 11, 445–456. [Google Scholar] [CrossRef]
  49. Rodríguez Aguilera, A. Las salinas del señorío de la Orden Militar de Calatrava en Andalucía: Estudio histórico y arqueológico. In Las Órdenes Militares en la Península Ibérica; Izquierdo Benito, R., Ruiz Gómez, F., Eds.; Ediciones de la Universidad de Castilla-La Mancha: Ciudad Real, Spain, 2000; pp. 173–192. [Google Scholar]
  50. Fornell Muñoz, A.; Martínez, J.M.C. Aproximación al estudio de las salinas de Jaén en época romano. In Economía de los Humedales: Prácticas Sostenibles y Aprovechamientos Históricos.; Lagóstena, L.G., Ed.; Edicions de la Universitat de Barcelona: Barcelona, Spain, 2019; pp. 89–108. [Google Scholar]
  51. Iranzo-García, E.; Kortekaas, K.H.; López, E.R. Inland Salinas in Spain: Classification, Characterisation, and Reflections on Unique Cultural Landscapes and Geoheritage. Geoheritage 2021, 13, 24. [Google Scholar] [CrossRef]
  52. Blumenfeld, S.; Lu, C.; Christophersen, T.; Coates, D. Water, Wetlands and Forests. A Review of Ecological, Economic and Policy Linkages; Secretariat of the Convention on Biological Diversity: Montreal, Canada; Secretariat of the Ramsar Convention on Wetlands: Gland, Switzerland, 2009; pp. 1–38. [Google Scholar]
  53. Convention on Wetlands. Global Wetland Outlook: Special Edition Gland; Secretariat of the Convention on Wetlands: Gland, Switzerland, 2021. [Google Scholar]
  54. Díaz, S.M.; Settele, J.; Brondízio, E.; Ngo, H.; Guèze, M.; Agard, J.; Arneth, A.; Balvanera, P.; Brauman, K.; Butchart, S. The Global Assessment Report on Biodiversity and Ecosystem Services: Summary for Policy Makers; IPBES Secretariat: Bonn, Germany, 2019. [Google Scholar]
  55. Millennium Ecosystem Assessment. Ecosystems and Human Well-Being: Wetlands and Water; World Resources Institute: Washington, DC, USA, 2005. [Google Scholar]
  56. UNESCO World Water Assessment Programme. The United Nations World Water Development Report 2020: Water and Climate Change; UNESCO: Paris, France, 2020; p. 219. [Google Scholar]
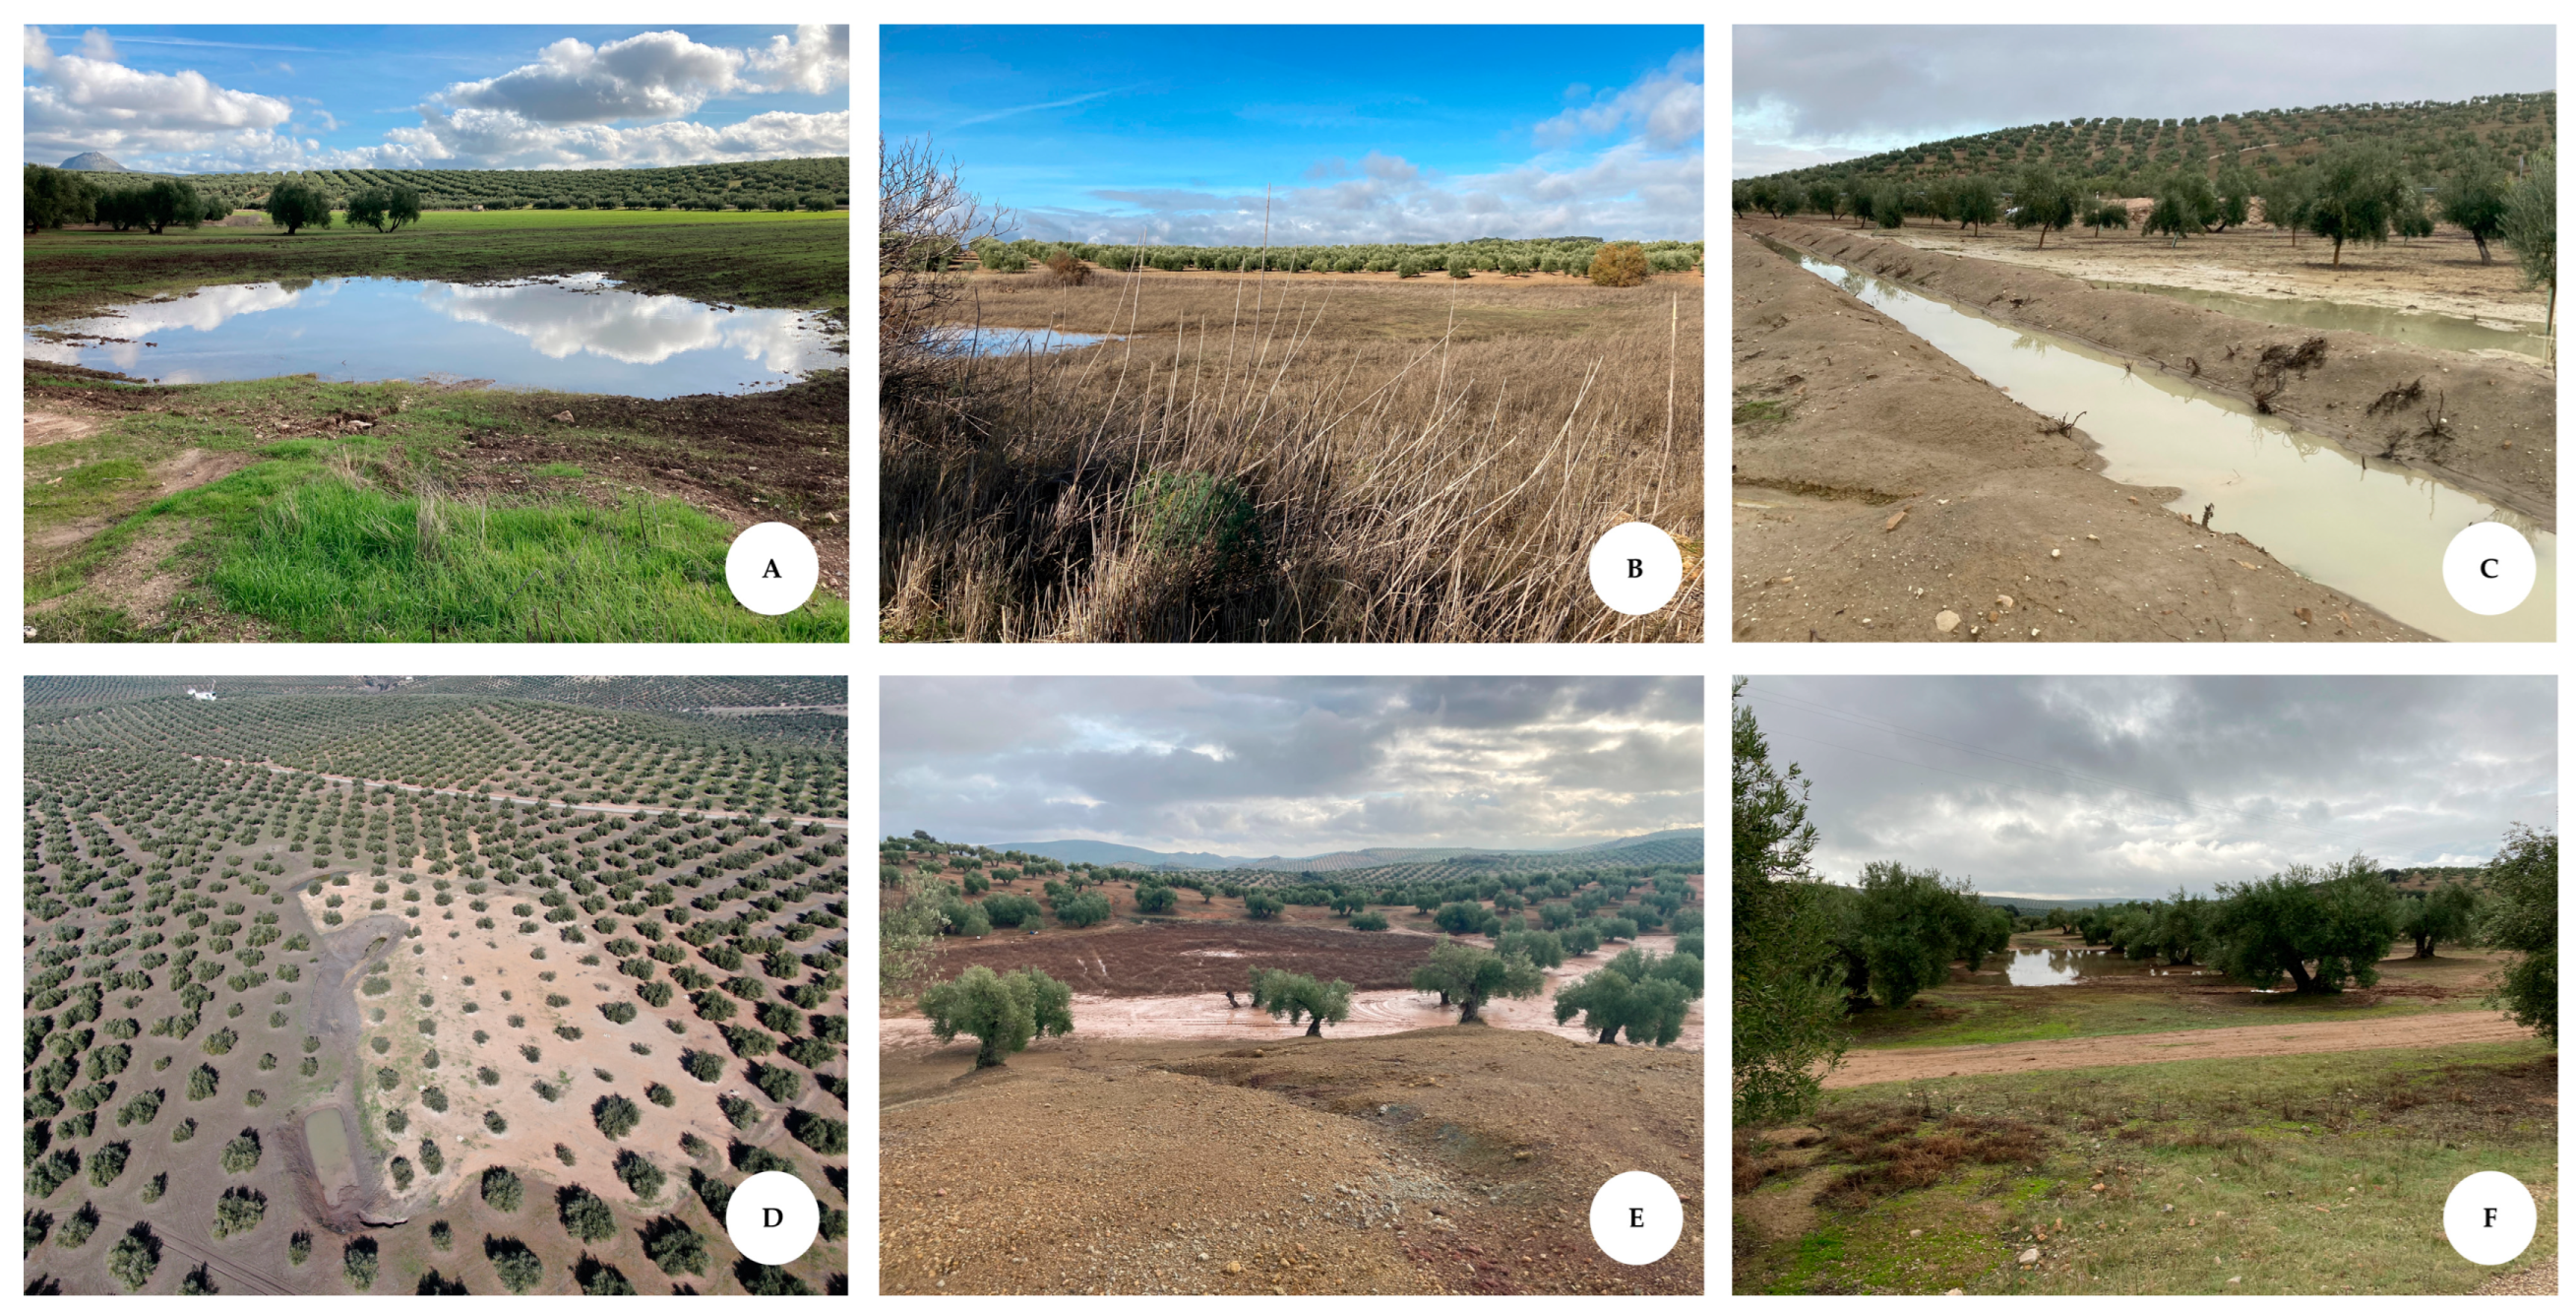
Figure 1. Characteristics that make some wetlands undetectable through satellite imagery: (A,B) small size and/or very short hydroperiods; (C,D) anthropically drained; (D,F) transformed into farmland. Photos from A to F correspond to wetlands #26, 8, 16, 26, 7, 19, and 18 in Figure 2.
Remotesensing 15 03553 g001
Figure 2. General view of the study areas in the Guadalquivir Basin (Salado de Arjona and Salado de Porcuna). Essential gullies and streams are indicated in blue, and the transport network is coloured in red. The analysed wetlands (see Section 3) are marked with green circles.
Remotesensing 15 03553 g002
Figure 3. Flowchart summarising the proposed methodology.
Remotesensing 15 03553 g003
Figure 4. Example of the raster locating some wetlands (left) and the corresponding orthophotos in the rainy year of 2013 (right). See Figure 2 for the specific locations of the wetlands in the catchment.
Remotesensing 15 03553 g004
Figure 5. New records: unknown wetlands detected by the proposed methodology. The left column shows the output raster that locates the wetlands, and the historical orthophotos in the middle and right columns corroborate the findings.
Remotesensing 15 03553 g005
Figure 6. Abandoned salt flats detected by the proposed methodology.
Remotesensing 15 03553 g006
Table 1. Summary of simulation parameters.
Parameter
Rainfall intensity (P)5.4 mm·h−1
Rainfall duration24 h
Manning roughness (n)0.025 s·m−1/3
Infiltration   rate   ( I )0
Computational mesh20 × 106 square cells with a uniform size of 10 m
Water   depth   threshold   ( z )0.1 m
Velocity   magnitude   threshold   ( x )0.025 m·s−1
Table 2. Wetlands detected and undetected by our model simulation. New records are in italics. Type 1: with the intermittent presence of water since the 1960s; Type 2: occurrence of marsh vegetation without shallow water; Type 3: disappeared; Type 4: caused by anthropogenic infrastructure. Source for area estimation and inventory: [a] corresponds to [35]; [b] corresponds to [36]; [c] estimated by the authors. Raster detection: (FP) is a false positive; (FN) is a false negative; (TP) is a true positive; (TN) is a true negative (more details in the text).
WetlandNameTypeLongitudeLatitudeArea (ha) [Source]InventoryRaster Detection
1de La Roa24°20′33.480″O37°44′19.039″N1.76 [a][35]FN
2La Quinta14°17′13.287″O37°45′16.221″N7.70 [a][35,36]TP
3Rincón del Muerto14°16′34.275″O37°45′29.243″N4.64 [a][35,36]TP
4Casasola14°16′50.321″O37°45′43.475″N1.94 [a][35,36]TP
5Hituelo 114°3′46.699″O37°45′18.285″N5.43 [a][35,36]TP
6Naranjeros14°01’44.814″O37°44′40.279″N5.04 [c][35,36]TP
7Rumpisaco14°1′03.908″O37°44′24.342″N1.37 [c][35,36]TP
8Casillas I14°1′13.290″O37°48′0.703″N2.55 [a][35,36]TP
9Las Navas 114°4′53.954″O37°49′5.583″N3.45 [a][35,36]TP
10Los Amores14°08′11.773″O37°46′35.051″N4.72 [c]-TP
11Mollica23°58′58.570″O37°40′26.508″N0.33 [c]-TP
12el Yeso43°59′41.471″O37°49′33.769″N0.49 [c]-FP
13de las Viñas24°12′07.600″O37°58′30.750″N0.40 [c]-TP
14de la Rata33°59′52.477″O37°49′01.290″N0.77 [c]-TP
15del Cordel de Jaén44°13′14.124″O37°44′11.900″N2.61 [c]-FP
16Colmenero13°54′38.592″O37°53′20.267″N 15.57 [c][36]TP
17Las Ceras14°06′58.200″O37°43′30.778″N 11.17 [c][36]TP
18Villardonpardo 233°59′00.900″O37°50′31.909″N 11.63 [c][36]TP
19Villardonpardo 323°58′51.269″O37°50′29.274″N 10.26 [c][36]TP
20El Ranal34°12′05.479″O37°55′14.236″N 19.80 [c][36]TP
21del Obispo34°03′04.495″O37°51′56.758″N 10.50 [b][36]TP
22Los Prados34°02′29.216″O37°51′55.397″N 133.60 [c][36]TP
23San José33°57′27.705″O37°55′58.530″N 111.90 [b][36]TP
24Corbún43°57′45.166″O37°56′12.084″N 12.75 [c][36]FP
25Hituelo 234°04′06.184″O37°45′06.527″N 13.30 [b][36]FN
26Mojones14°02′32.896″O37°44′13.265″N 14.63 [c][36]TP
27Salinas de La Orden24°12′05.479″O37°48′02.678″N 10.59 [c][36]TP
28Salinas de Valdeutiel14°13′59.453″O37°43′51.514″N 11.30 [b][36]TP
29Torrealcazar34°04′27.723″O37°51′57.856″N 21.44 [c][36]TN
30Casillas 213°54′38.592″O37°53′20.267″N 12.11 [c][36]TP
31Casillas 324°01′06.412″O37°47′35.290″N 12.03 [c][36]TP
32Las Navas 244°04′43.270″O37°49′49.850″N 10,50 [b][36]FP
33El Hornillo23°58′38.114″O37°45′36.842″N 11,20 [c][36]TP
34Villardonpardo 113°58′27.526″O37°50′35.203″N 12,18 [c][36]TP
1 The reference system (old UTM) is a mesh with a cell size of 1 × 1 km2. 2 The coordinates are referred to the centre of the old mesh.
Disclaimer/Publisher’s Note: The statements, opinions and data contained in all publications are solely those of the individual author(s) and contributor(s) and not of MDPI and/or the editor(s). MDPI and/or the editor(s) disclaim responsibility for any injury to people or property resulting from any ideas, methods, instructions or products referred to in the content.