Article

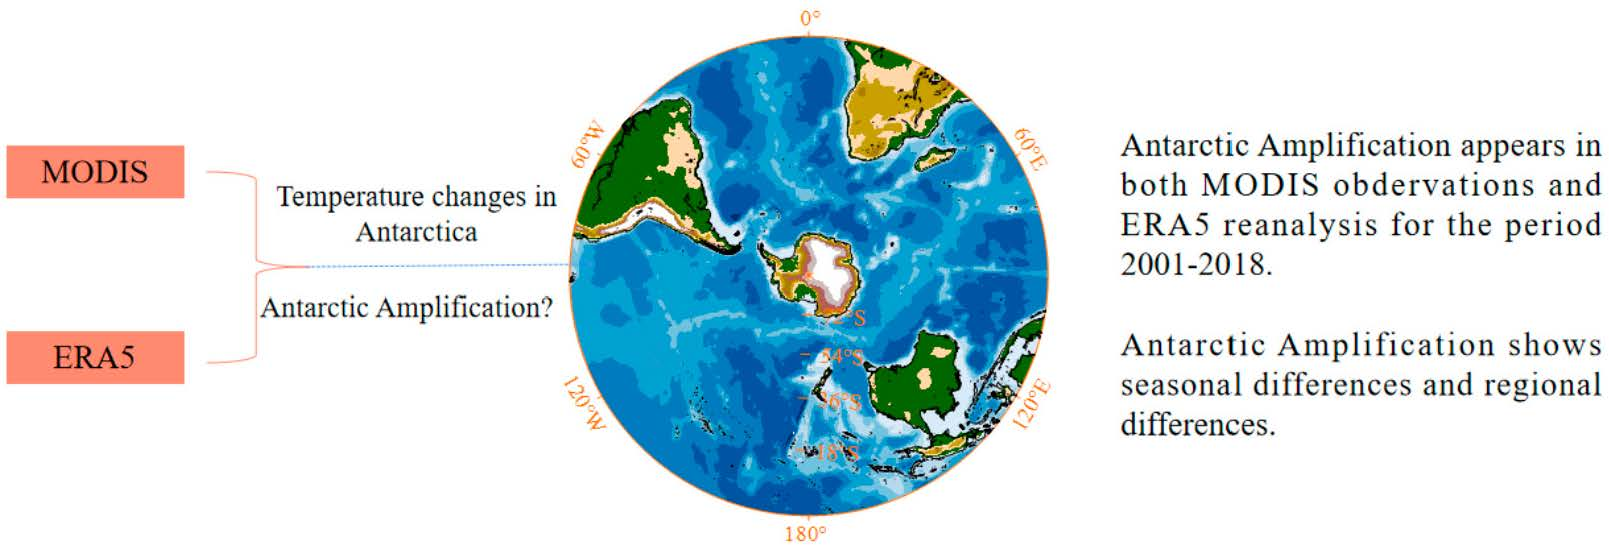
The Antarctic Amplification Based on MODIS Land Surface Temperature and ERA5

State Key Laboratory of Cryospheric Sciences, Northwest Institute of Eco-Environment and Resources, Chinese Academy of Sciences, Lanzhou 730000, China
*
Author to whom correspondence should be addressed.
Remote Sens. 2023, 15(14), 3540; https://doi.org/10.3390/rs15143540
Submission received: 25 May 2023 / Revised: 10 July 2023 / Accepted: 11 July 2023 / Published: 14 July 2023
(This article belongs to the Section Atmospheric Remote Sensing)

Abstract

:
With global warming accelerating, polar amplification is one of the hot issues in climate research. However, most studies focus on Arctic amplification, and little attention has been paid to Antarctic amplification (AnA), and there is no relevant research based on MODIS (Moderate Resolution Imaging Spectroradiometer) land surface temperature observations. Compared with 128 stations’ observations, MODIS can capture the variations in temperature over Antarctica. In addition, the temperature changes in Antarctica, East Antarctica, West Antarctica and the Antarctic Peninsula during the period 2001–2018 reflected by the MODIS and ERA5 are basically consistent, and the temperature changes in Antarctica are negatively correlated with the Southern Annular Mode. AnA occurs under all annual and seasonal scales, with an AnA index greater than 1.27 (1.31) from the MODIS (ERA5), and is strongest in the austral winter and weakest in summer. AnA displays regional differences, and the signal from the MODIS is similar to that from ERA5. The strongest amplification occurs in East Antarctica, with an AnA index greater than 1.45 (1.48) from the MODIS (ERA5), followed by West Antarctica, whereas the amplified signal is absent at the Antarctic Peninsula. In addition, seasonal differences can be observed in the sub regions of Antarctica. For West Antarctica, the greatest amplification appears in austral winter, and in austral spring for East Antarctica. The AnA signal also can be captured in daytime and nighttime observations, and the AnA in nighttime observations is stronger than that in daytime. Generally, the MODIS illustrates the appearance of AnA for the period 2001–2018, and the Antarctic climate undergoes drastic changes, and the potential impact should arouse attention.

Graphical Abstract

1. Introduction

As the most remote region on earth, the Antarctic Ice Sheet is the largest ice sheet on Earth, and has a profound influence on sea levels and is closely coupled to other parts of the climate system [1,2,3,4,5]. Over the past decades, the changes in Antarctic near-surface air temperatures are inhomogeneous, and show different characteristics for the three sub regions of East Antarctica, West Antarctica and the Antarctic Peninsula (Figure 1). The Antarctic Peninsula, a noticeable region, experienced dramatic warming in the second half of the 20th century [6], which is related to the variations in the stratospheric ozone [7], Southern Annular Mode and Amundsen Sea Low [8,9,10,11]. However, the warming signal became weak and even reversed in the last two decades, which was mainly attributable to the natural internal variability [12,13]. West Antarctica has warmed since the 1950s, and the strongest increase occurs in austral winter (June–August) and spring (September–November) [14,15], which may associated with the increase of tropical sea surface temperatures [16,17]. Conversely, East Antarctica showed a cooling tendency in austral autumn (March–May) over the past 60 years, and the widespread cooling is associated with the positive trend in the Southern Annular Mode, the increase in La Niña events and the changes in the strength and position of the mid-latitude jet [8,18,19,20].
The polar regions are sensitive to climate changes, and the fast warming in polar regions is known as polar amplification, which is a robust feature of climate change [21,22,23]. The mechanism of polar amplification is complex, and the influencing factors include but are not limited to the poleward ocean heat transport, surface albedo feedback, downward clear-sky longwave feedback and ice-albedo feedback [24,25,26]. Polar amplification exhibits obvious asymmetry, and the Arctic regions have warmed more than twice, even three times, or nearly four times faster than the global average since 1979, and this phenomenon is known as Arctic amplification [27,28,29,30]. However, the warming is slower and inhomogeneous in Antarctica, and the Antarctic amplification (AnA) signal is not clear, which is related to the ocean heat uptake in the Southern Ocean and deep-ocean mixing [31,32,33,34]. Compared with Arctic amplification, fewer studies focus on AnA [35], which may be related to the scarcity of measured data in Antarctica, where most weather stations are located in coastal areas, which leads to the non-homogeneity of observation data [36]. For the period 1979–2019, obvious AnA occurs in austral spring, although it disappears on an annual scale [37]. However, AnA can be observed on all annual and seasonal scales during the period 2002–2018 [38]. In addition, AnA is likely to be delayed relative to the Arctic amplification, and AnA is highly likely to occur in the future [39].
Satellite remote sensing data provide an unprecedented high spatial resolution and wide coverage data, such as surface temperature, which can be regarded as reliable data when observation data are scarce or the measured data are insufficient to meet the research needs [40,41,42]. The MODIS (Moderate Resolution Imaging Spectroradiometer) in the Aqua and Terra satellites has a large spectral range, which enables the sensor to simultaneously collect information about atmosphere, land, ice and water properties, and is widely used in a variety of studies [43]. The MODIS is of high practical value for the comprehensive study of earth science and the classification of land, atmosphere and oceans. Research has found that the MODIS data can reflect the surface temperature in Antarctica, with the mean bias range from −1.8 °C to 0.1 °C, and the root-mean-square errors lower than 4.88 °C in the Antarctic plateau [44].
However, no research has been conducted on AnA based on MODIS observations, which are related to the short time series of satellite data. Therefore, this study aims to investigate changes in surface temperatures and explore whether AnA occurs and, if this is the case, to quantify the intensity of AnA.

2. Materials and Methods

2.1. Data

The MODIS onboard Terra provides an accurate land surface temperature dataset on a global scale. The monthly MODIS temperature data between 2001 and 2018 is from the datasets MODIS Level 3 data product MOD11C3v061, which can be downloaded at the website https://lpdaac.usgs.gov/products/mod11c3v061/ (accessed on 21 September 2022). The monthly MODIS dataset is based on the Terra global daily LST, and is synthesized by the NASA MODIS Data Working Group after a series of preprocessing. The spatial resolution of the MODIS dataset is 0.05° × 0.05°, and includes the daytime and nighttime observations.
The temperature data during the period 2001–2018 from ERA5 reanalysis are used, which is the latest atmospheric reanalysis produced by ECMWF (European Centre for Medium-Range Weather Forecasts), and is considered to have high accuracy in representing the Antarctic temperature [36]. ERA5 uses the Cycle 41r2 Integrated Forecasting System and four-dimensional variational assimilation system, and the excellent performance of ERA5 is related to the improvements in observation operators, model physics, core dynamics and data assimilation. The ERA5 reanalysis data are available at https://cds.climate.copernicus.eu/#!/search?text=ERA5&type=dataset (accessed on 18 August 2022).
In addition, the 109 automatic weather stations and 19 manual stations are used to explore whether the MODIS data can reflect the temperature change over Antarctica, and the data we used in this study cover at least 5 years. The automatic weather stations’ data are from the AntAWS dataset, which is a compilation of Antarctic automatic weather station observations that have undergone quality control [45], and the data can be downloaded at https://amrdcdata.ssec.wisc.edu/dataset/antaws-dataset (accessed on 10 May 2023). The manual data are from the project called the Reference Antarctic Data for Environmental Research that is undertaken by the Scientific Committee on Antarctic Research, which can be downloaded at https://legacy.bas.ac.uk/met/READER/surface (accessed on 10 May 2023). Locations of the 128 stations are shown in Figure 2, and the detailed information can be found in Table S1.

2.2. Methods

The F test is used to estimate the significance of the temperature trends in the MODIS observations and reconstruction, with the significance at the 95% confidence level. Similar to Arctic amplification, AnA is commonly defined as the ratio of change in Antarctic temperature to the corresponding value in the Southern Hemisphere. However, the amplification index from this definition sometimes shows the extreme value when the trend of the Southern Hemisphere is close to zero, and the phenomenon can also be found in the assessment of Arctic amplification [46,47]. The definition of the AnA index is motivated by unrealistic extreme values of the original definition, and we imitate the new definition of the Arctic amplification index [48] in this study, and employ a new index of AnA TAntarctica = a0 + a1 × TSouthern Hemisphere + Ɛ, where TAntarctica and TSouthern Hemisphere represent the temperature anomalies over the Antarctic Ice Sheet and Southern Hemisphere, respectively, during the same period. The ordinary linear least squares solution determines parameters a0, a1 and Ɛ, and the slope of the regression a1 is the AnA index. Note the AnA index is calculated only for the land region.

3. Results

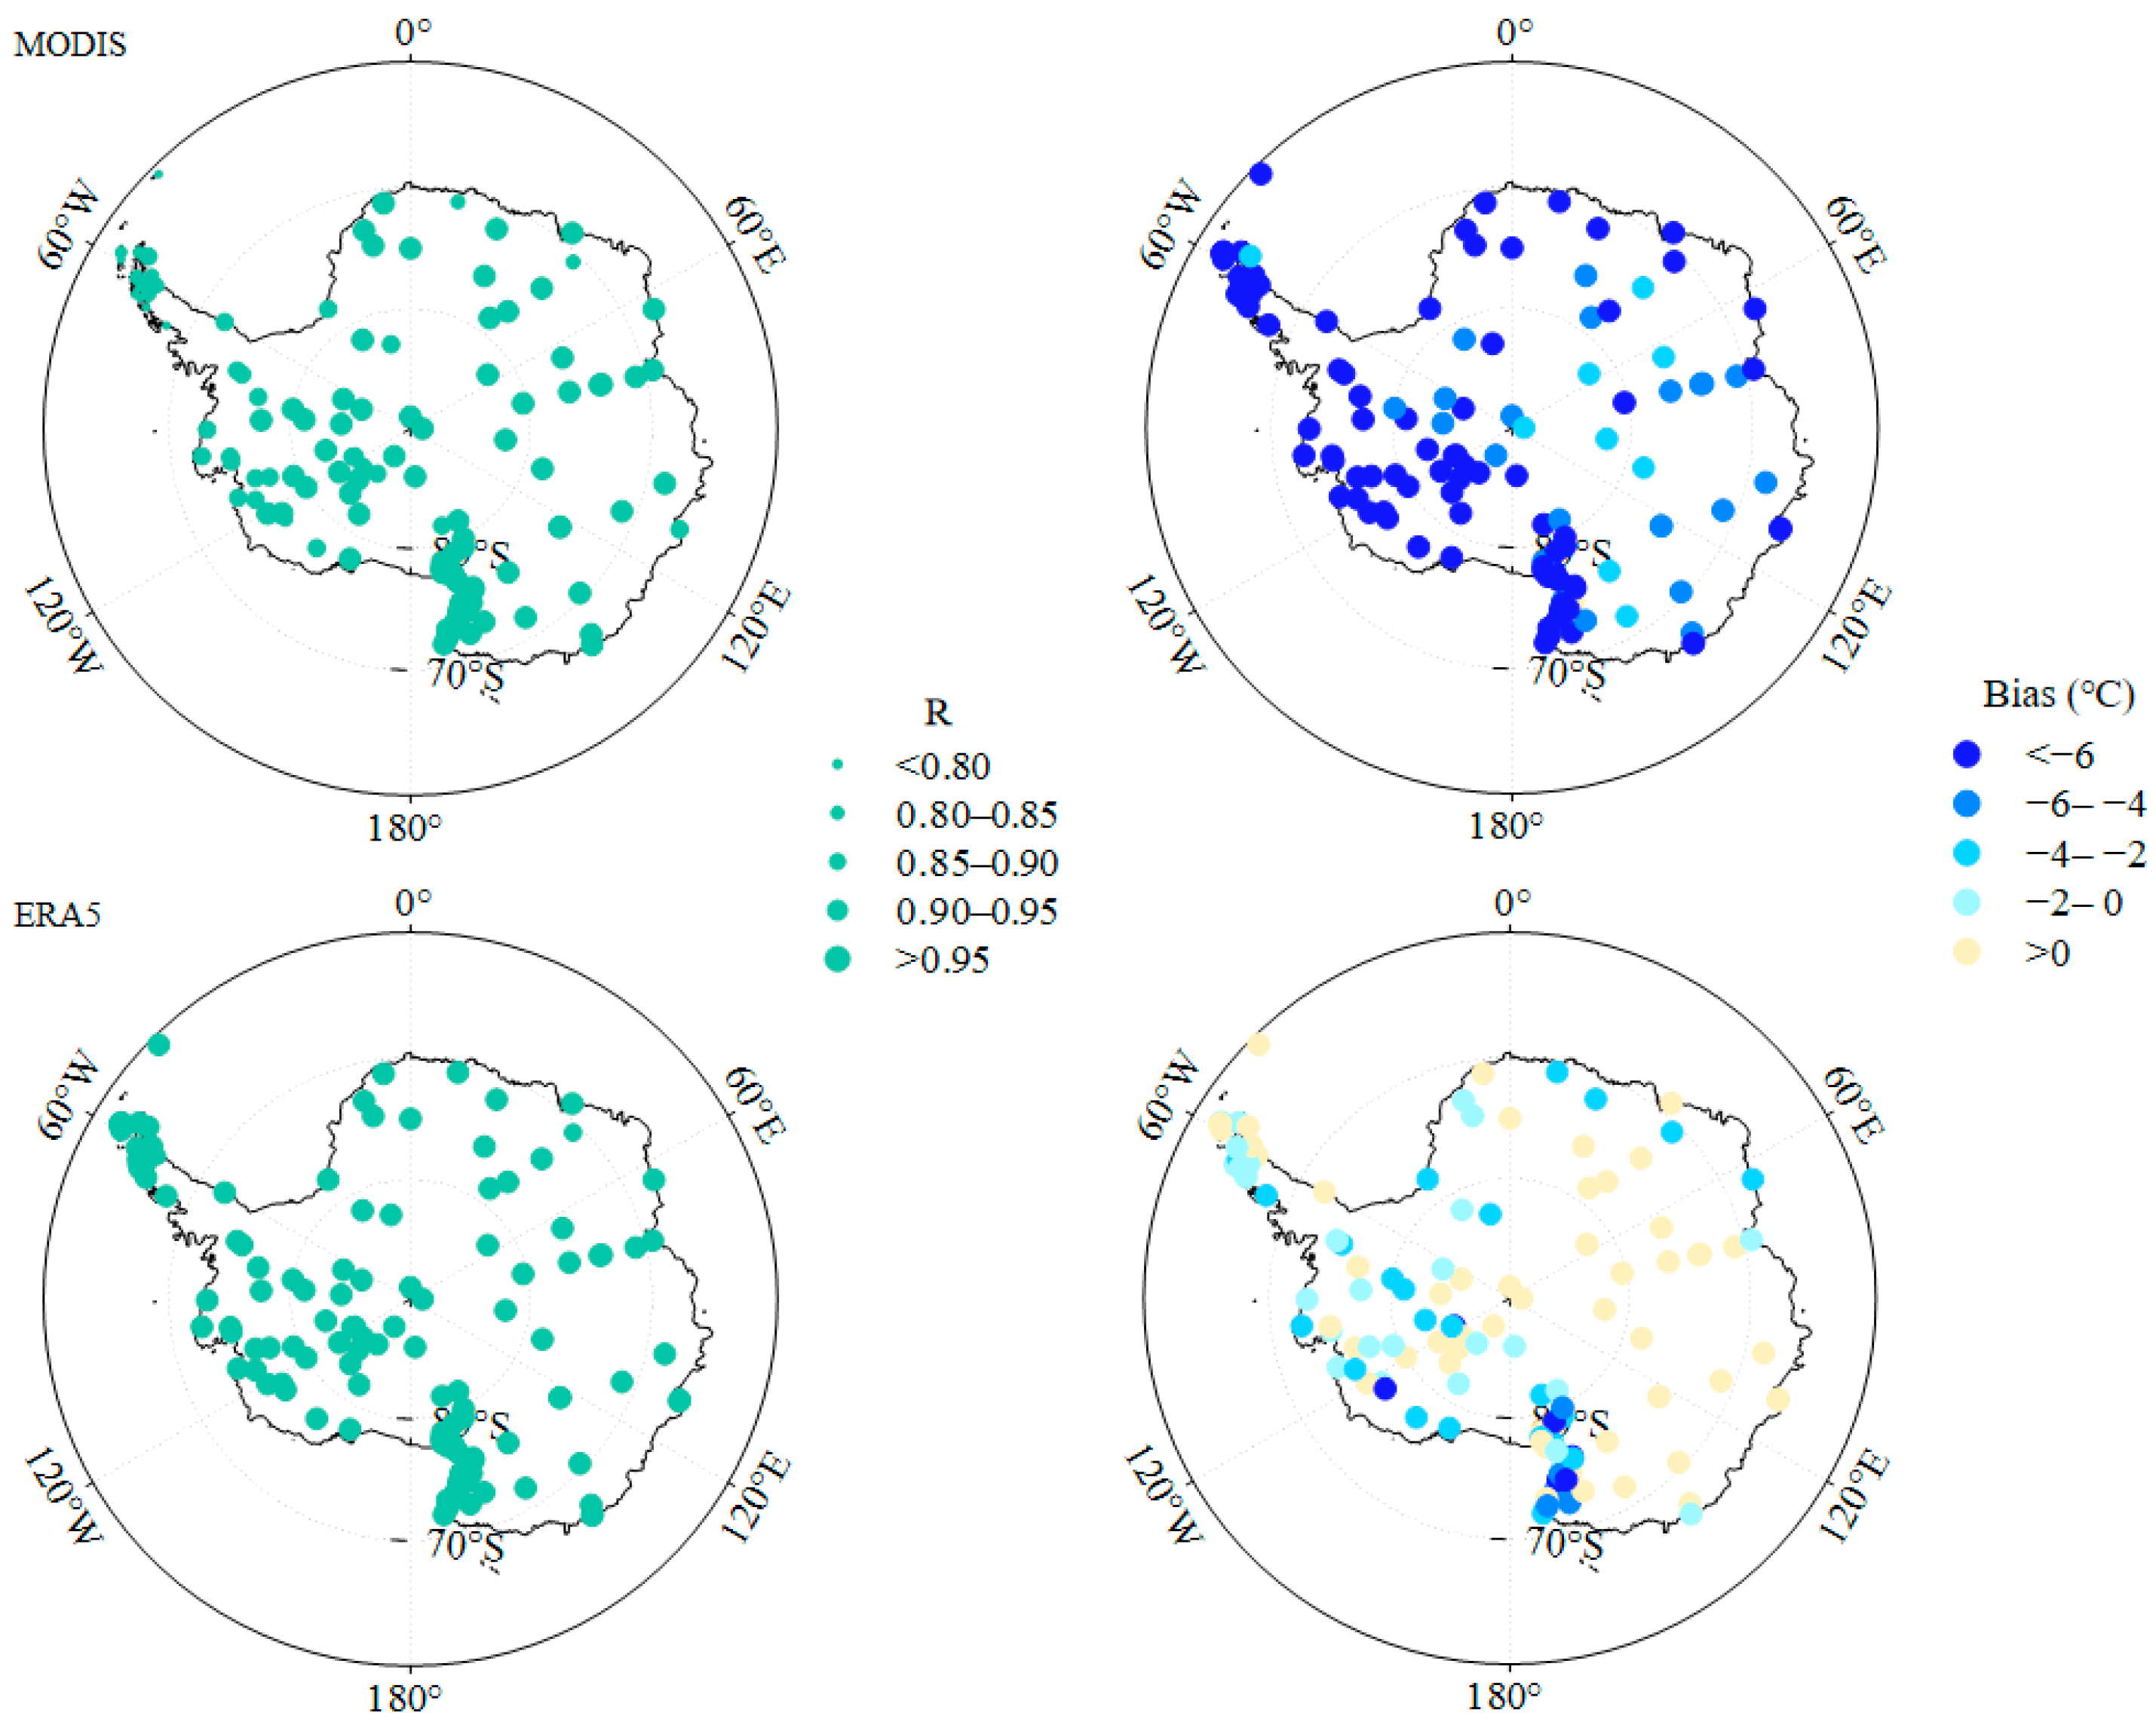
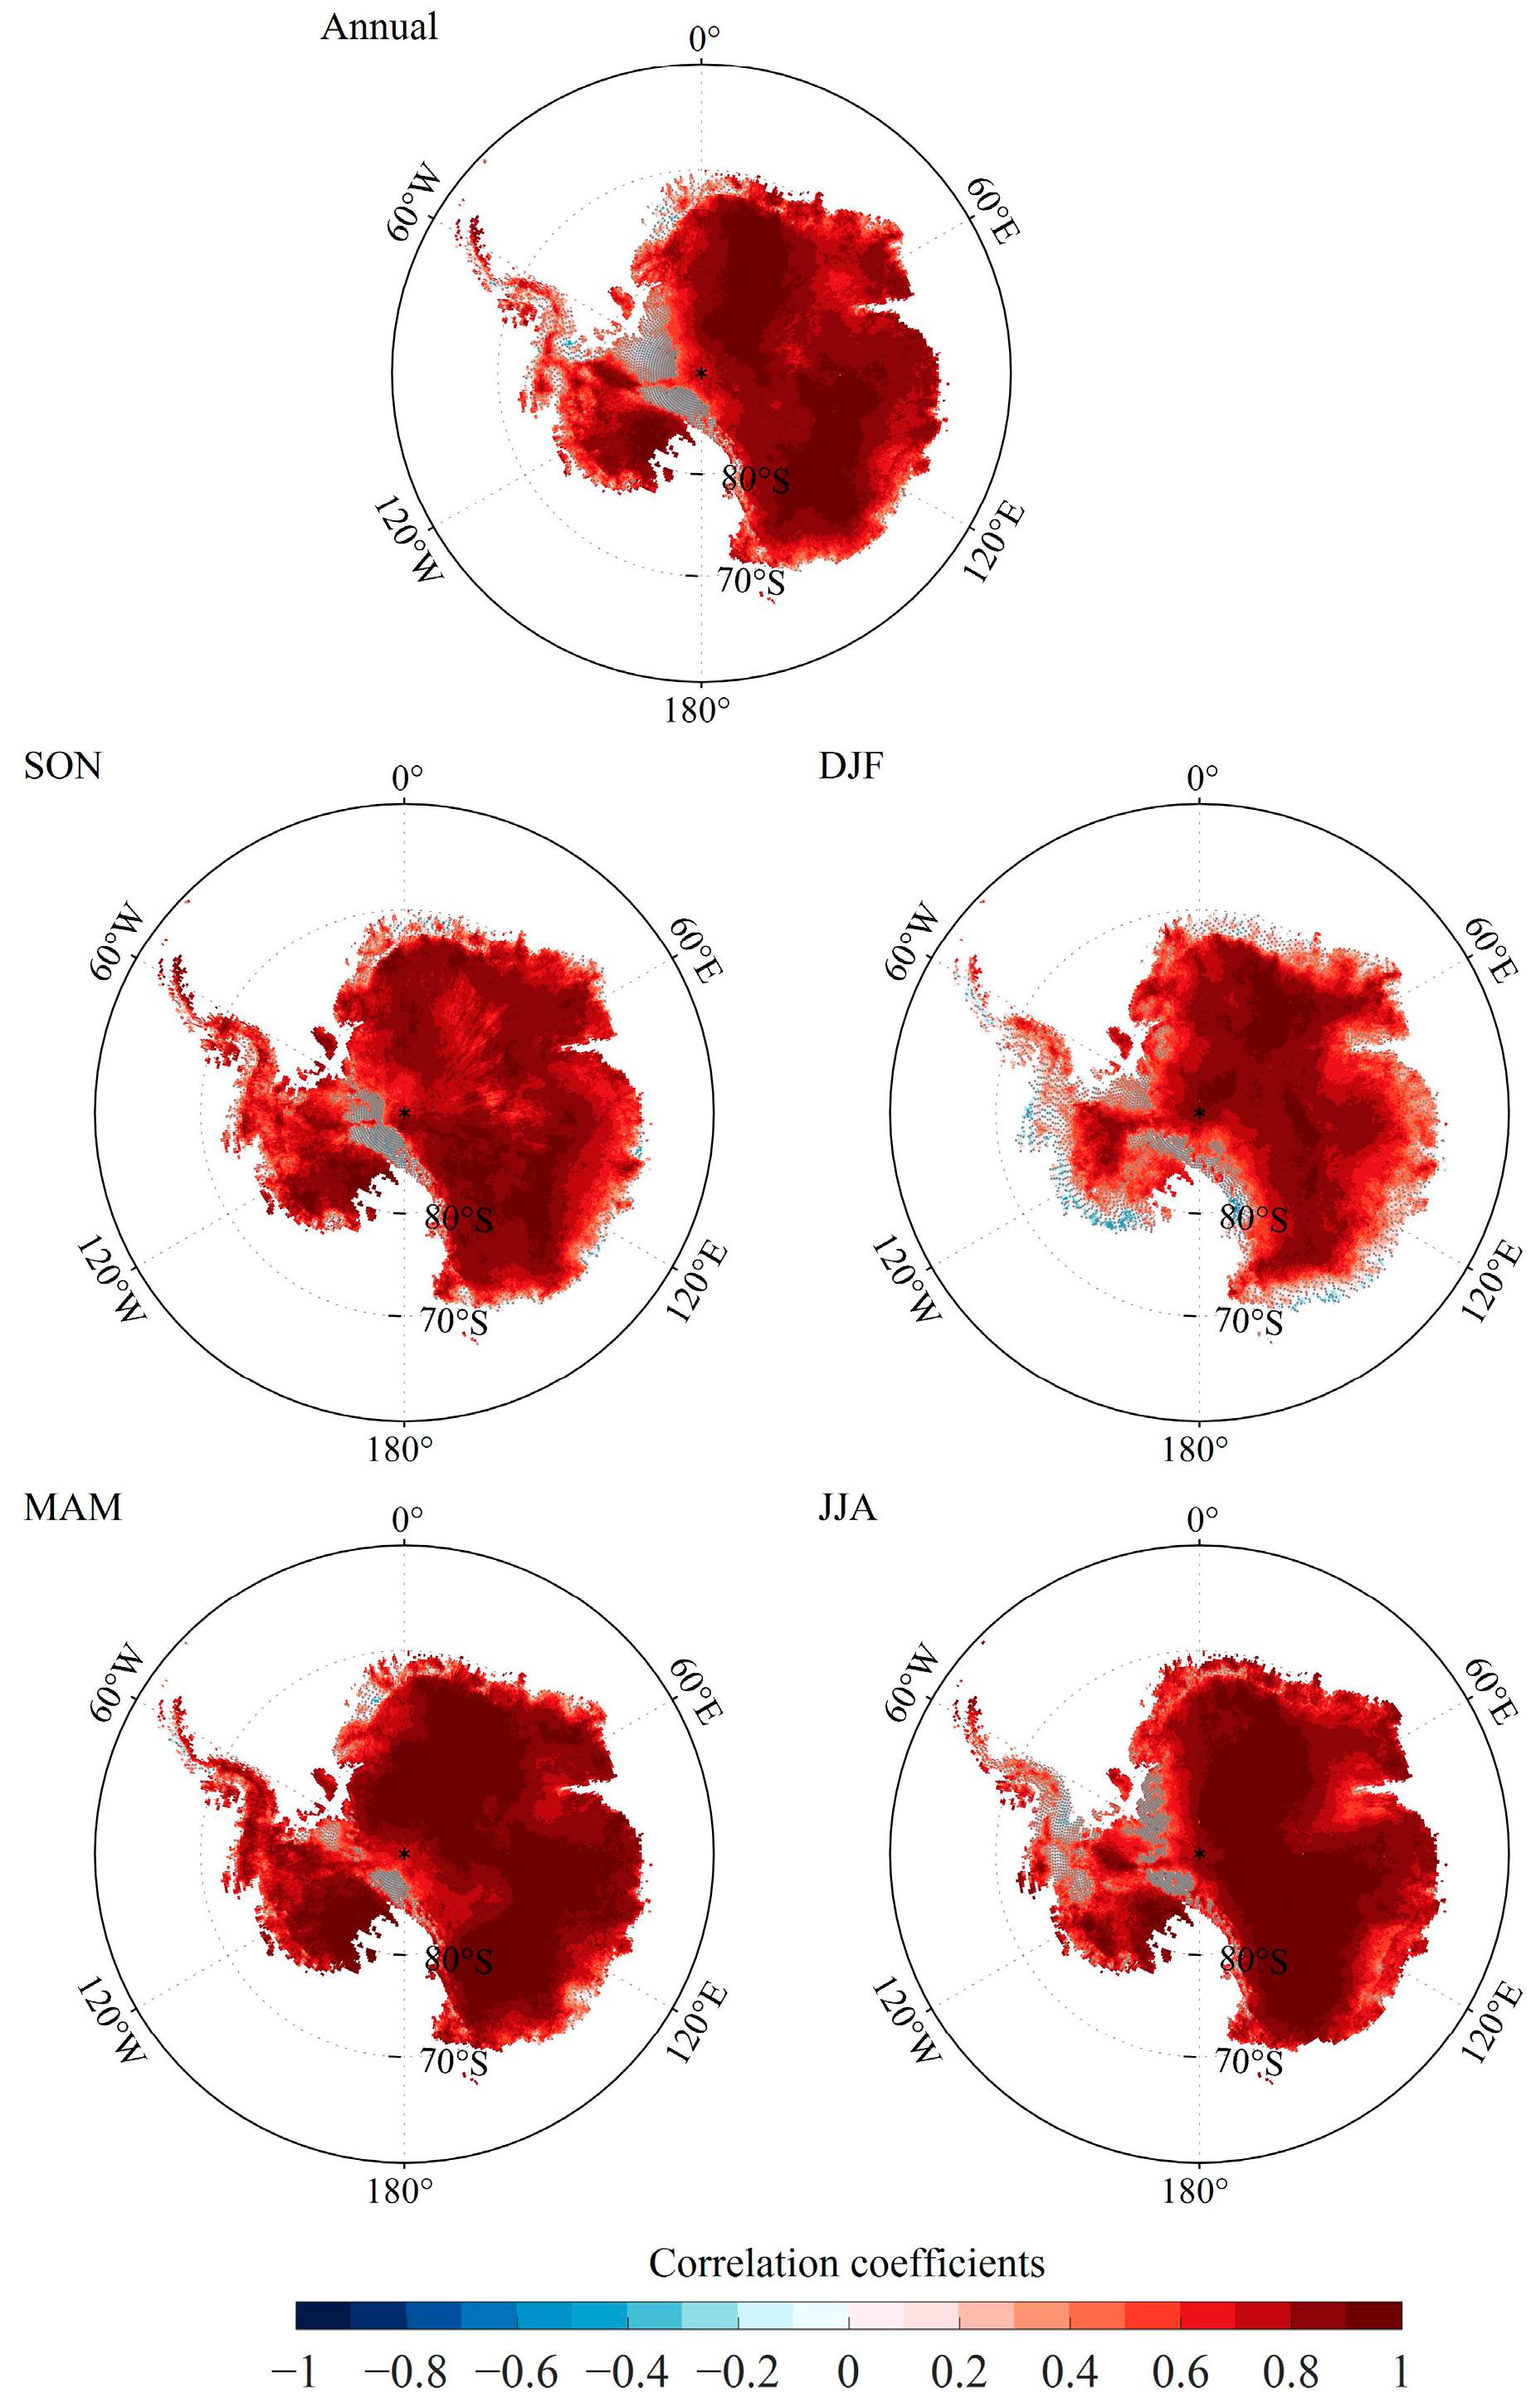
3.1. The Performance of MODIS Land Surface Temperature and ERA5 in Antarctica

The monthly correlation coefficients and bias between the MODIS, ERA5 and observations are shown in Figure 3. On monthly scales, the correlation coefficients are higher than 0.74 (Vernadsky station), and correlations between the MODIS and observations are higher than 0.90 at 104 stations and higher than 0.95 at 80 stations. MODIS observations always illustrate the cold bias of monthly temperatures, and this phenomenon also occurs on all annual and seasonal scales. ERA5 is highly correlated with observations data, with correlation coefficients higher than 0.95 at 121 stations. Compared with observations, the bias of ERA5 is lower than 4.0 °C in general, and illustrates warm bias at most stations that are located in East Antarctica, which is different from the MODIS. In addition, four stations are selected (Dumont Durville, Vostok, Byrd, Marambio) to analyze the accuracy of the MODIS further, and are located in East Antarctica coast, the interior of East Antarctica, West Antarctica and the Antarctic Peninsula, respectively (Figure 4). Clearly, the MODIS underestimates the observations, whereas it can capture the feature of changes in temperature, with the annual correlation coefficients of 0.86, 0.99, 0.97 and 0.88 at Dumont Durville, Vostok, Byrd and Marambio, respectively. The MODIS refers to surface temperature, whereas the station observations are near-surface temperature (2 m), and the existence of an inversion layer further affects the difference between them. In the Antarctic Plateau, the imbalance between surface and atmosphere longwave emission induces a stable inversion layer in austral winter, and the inversion layer is related to the strong katabatic winds on the East Antarctic coast [49]. In addition, the studies on infrared imagery from the Reeves Glacier, Nansen Ice Sheet and Ross Ice Shelf demonstrate the point that the widespread warming of the near-surface temperature is related to mixing due to katabatic winds [50,51,52], and the increases in near-surface temperature that are influenced by katabatic winds enlarge the difference with MODIS observations.
MODIS data are generally available only from 2001 to 2018, while ERA5 data are available from 1940 to now, and can provide the best performance in representing the temperature over Antarctica [43]. Therefore, we further compare the temperature changes between MODIS observations and ERA5 in Antarctica. The results show that there are significant (p < 0.05) correlations between ERA5 and MODIS observations for all annual and seasonal temperatures, with an annual correlation coefficient of 0.86, and the values in austral spring, summer, autumn and winter are 0.88, 0.93, 0.90 and 0.95, respectively.
Generally, MODIS observations can be considered as a baseline dataset to understand the climate change over Antarctica, although bias is inevitable.

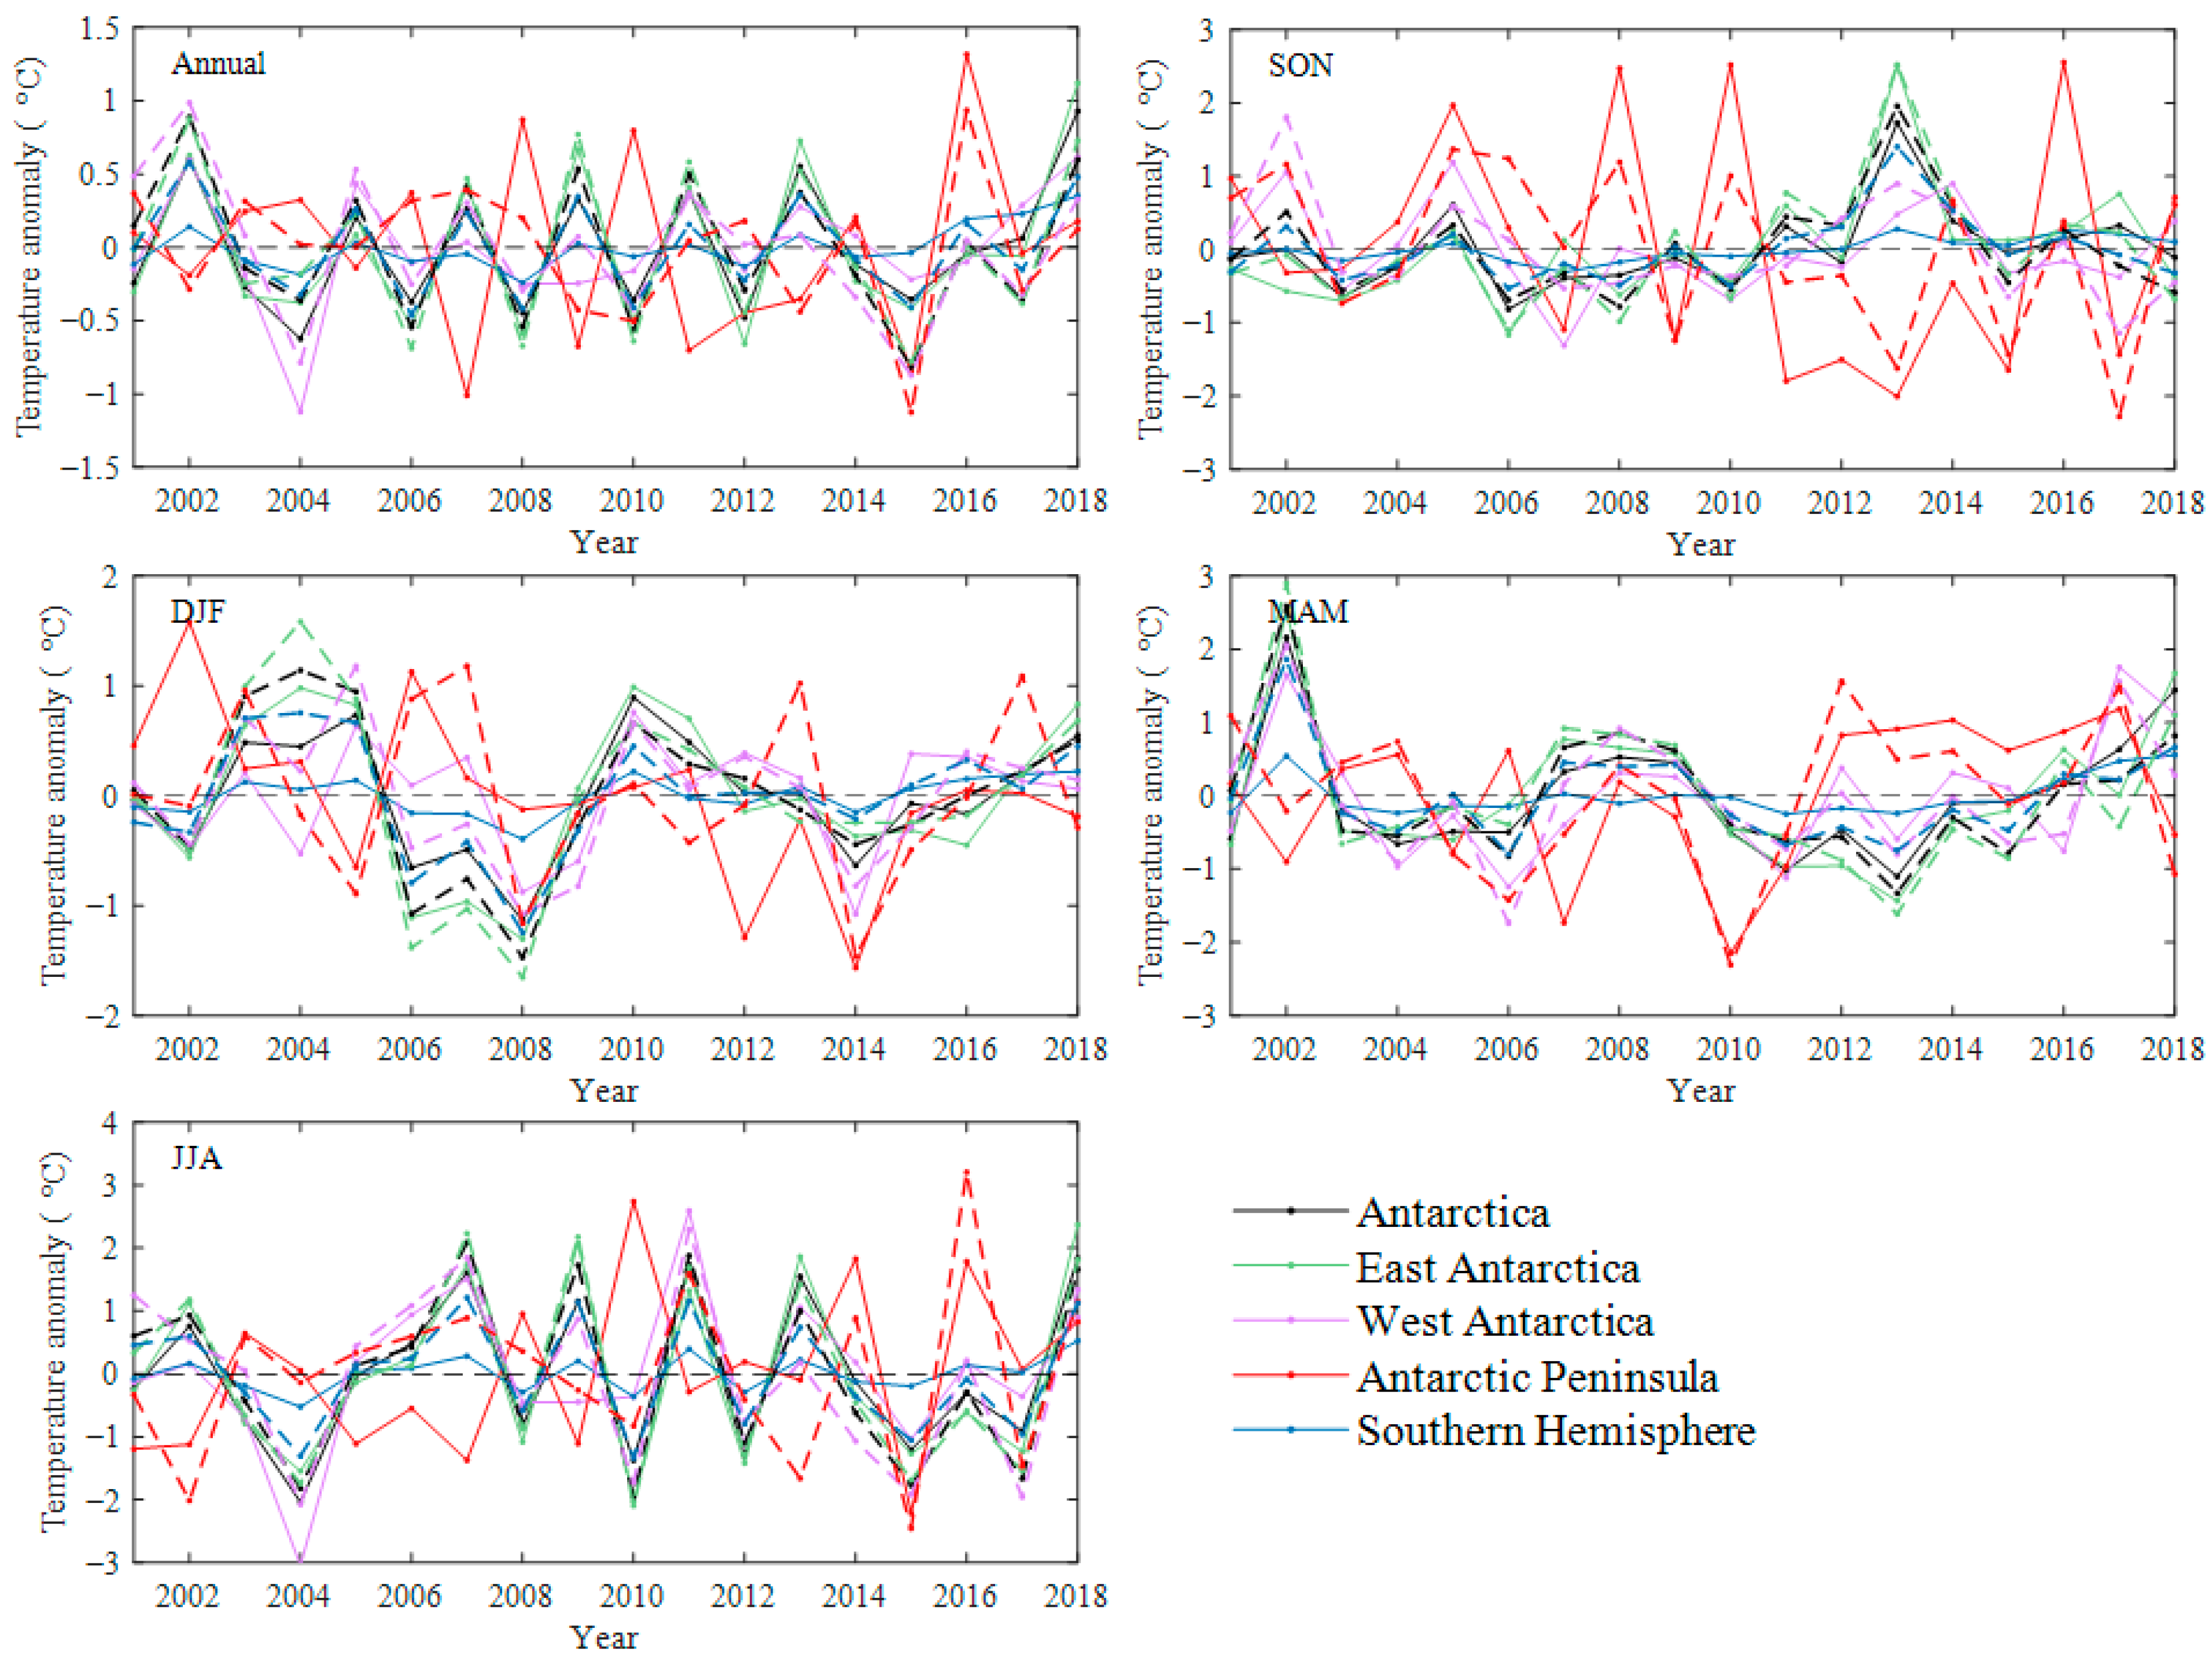
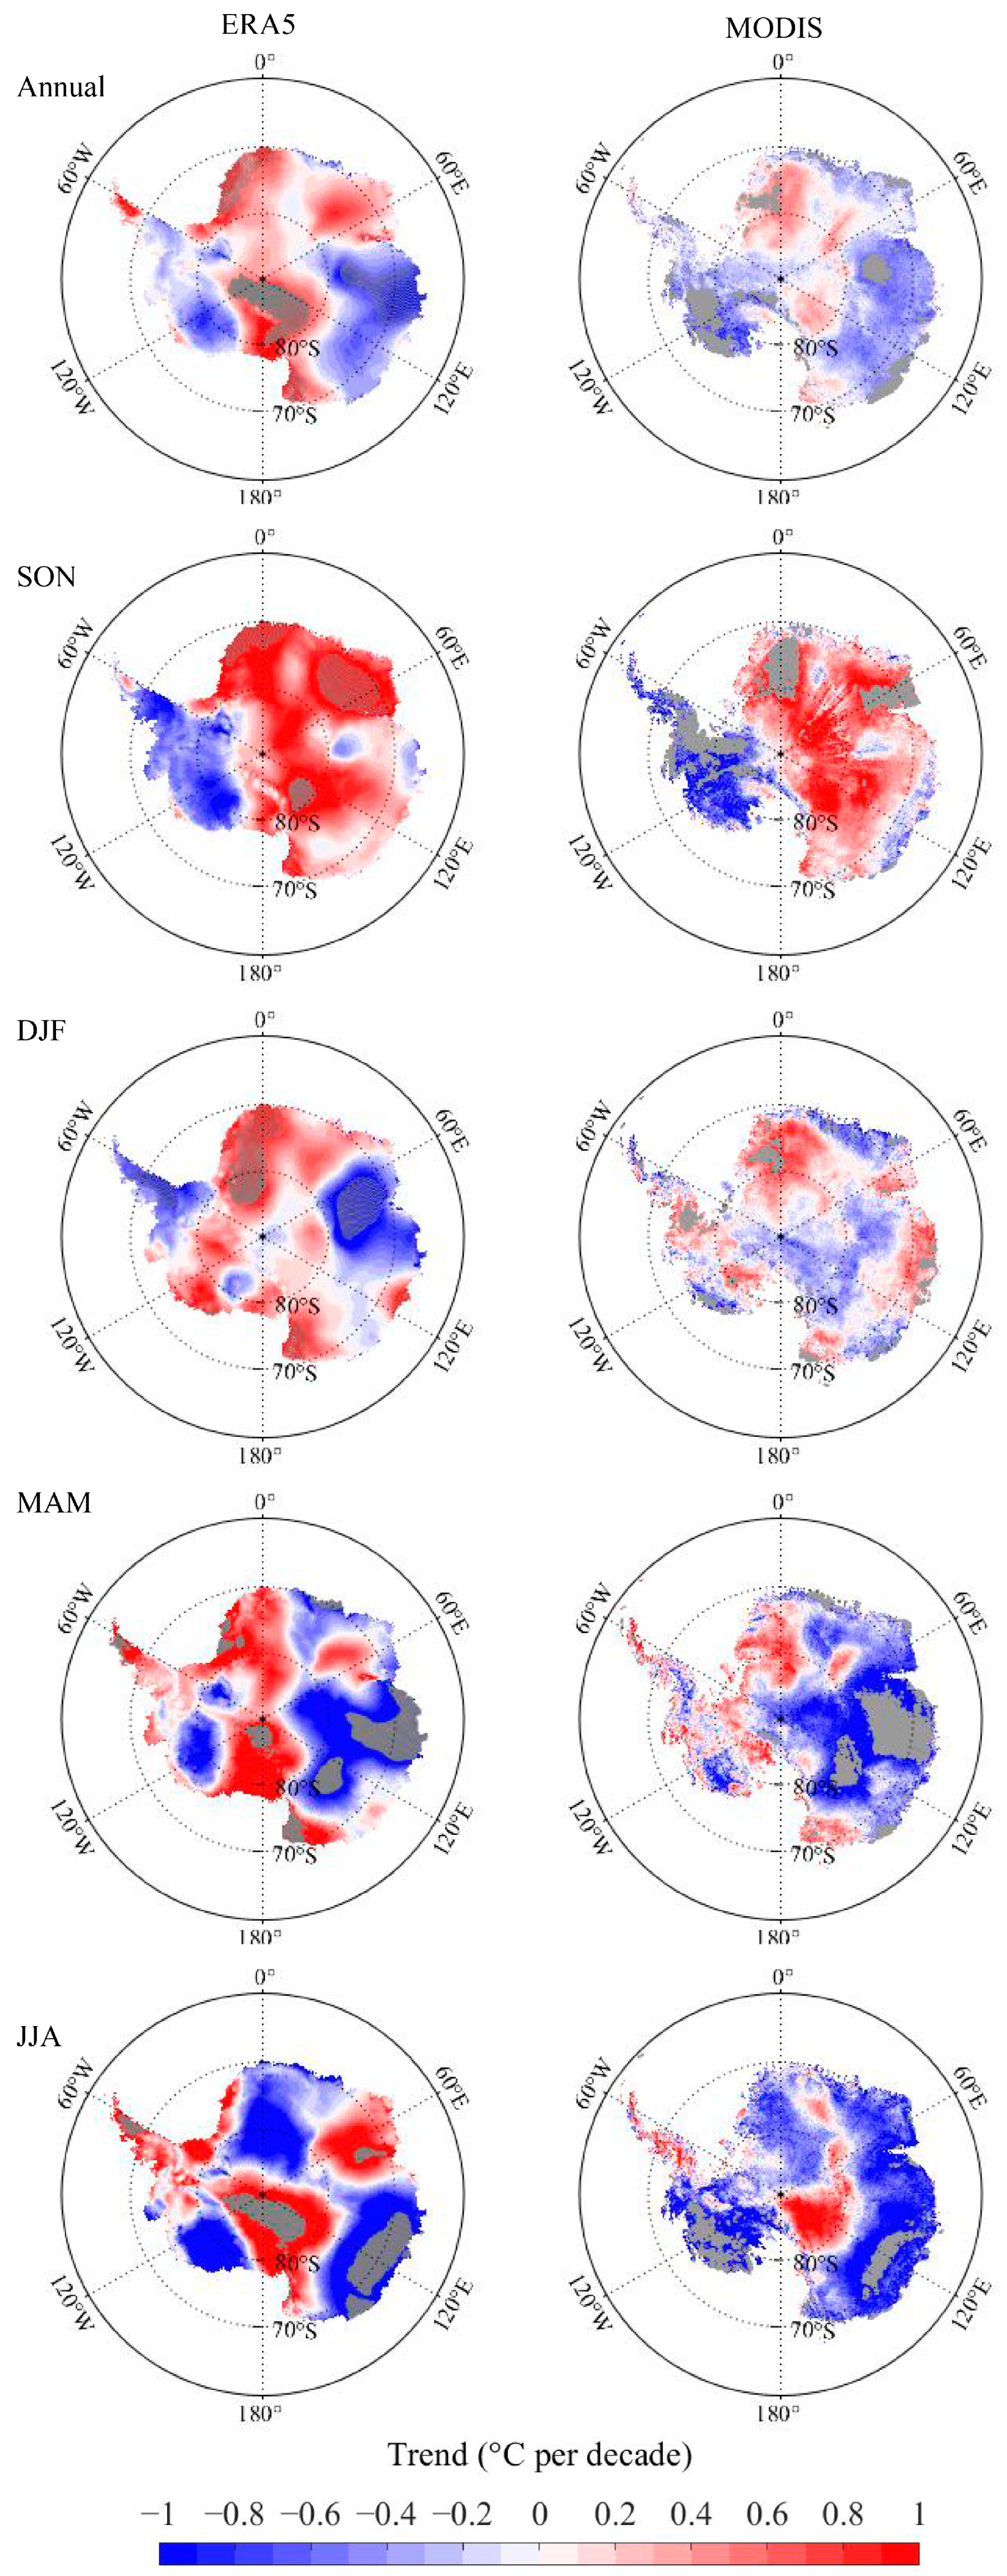
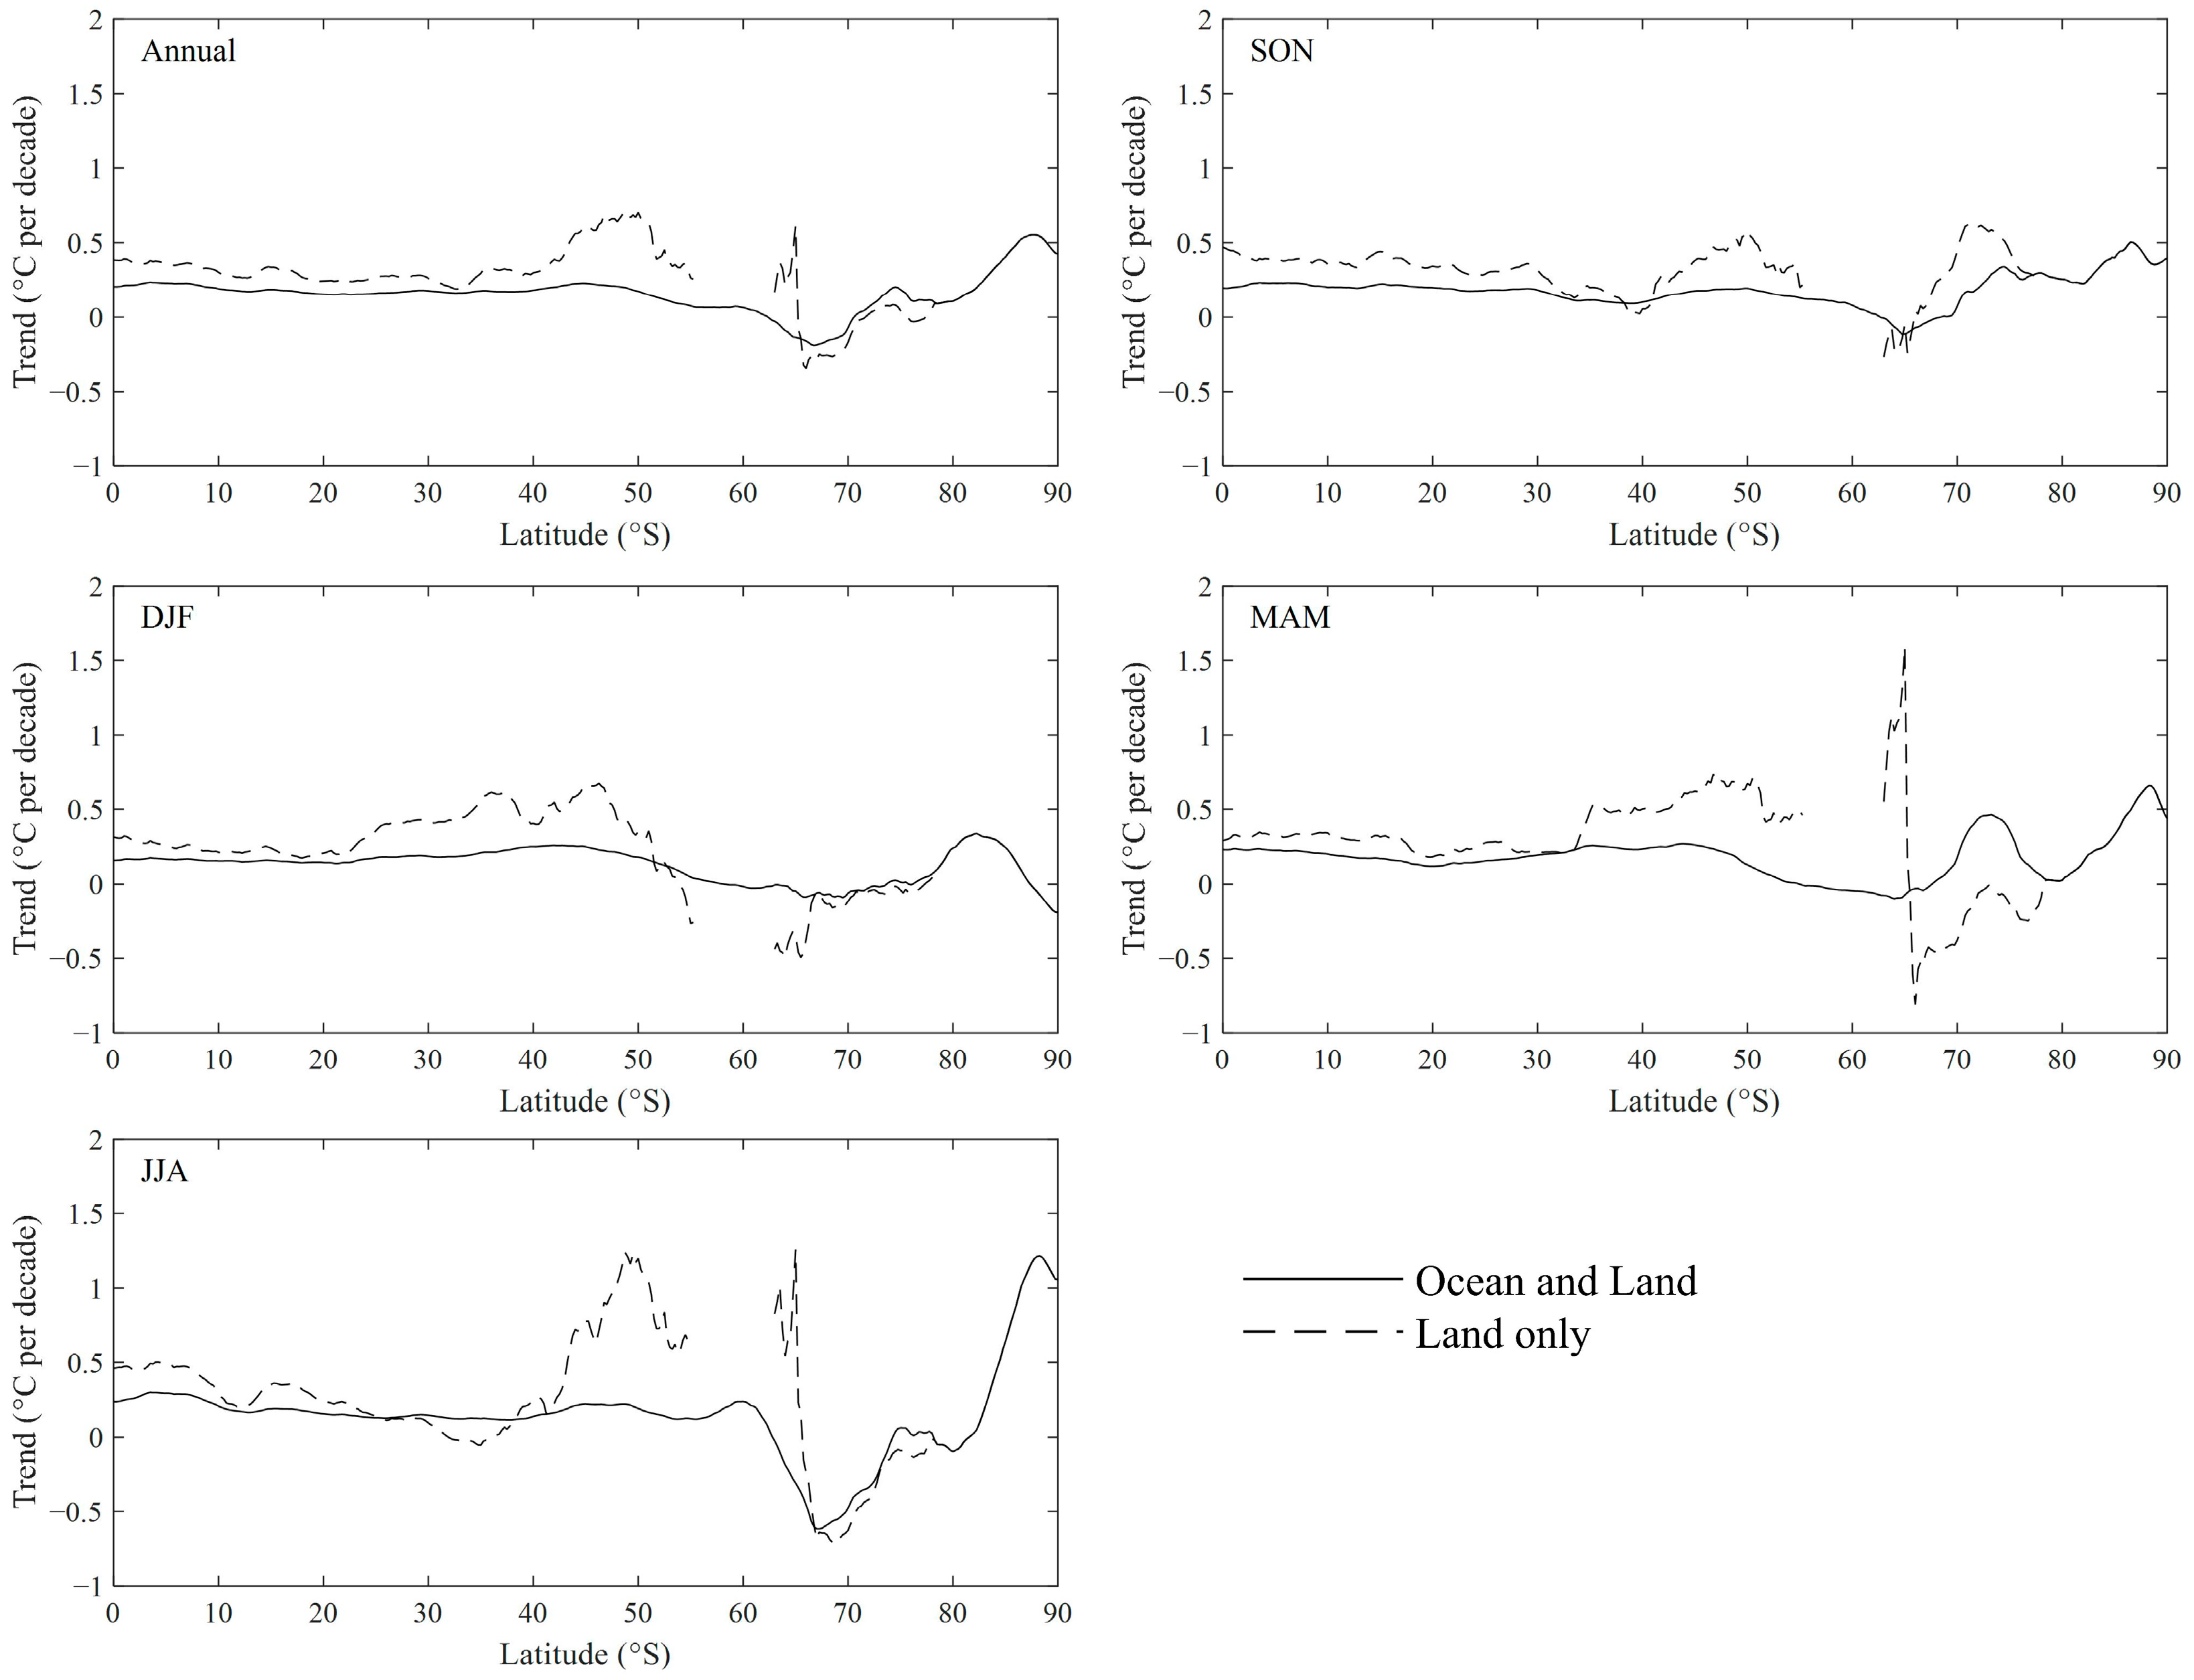
3.2. Temperature Trends over Antarctica and Its Sub Regions from MODIS Observations and ERA5

To examine the inter annual variations, we calculate the annual and seasonal temperature anomalies based on MODIS observations and ERA5 (relative to their 2001–2018 mean) in the Southern Hemisphere and Antarctica, and the three sub regions of East Antarctica, West Antarctica and the Antarctic Peninsula, and the results are shown in Figure 5. Clearly, the changes in regional temperature reflected by the MODIS and ERA5 are similar, and the temperature mean in the Antarctic Peninsula exhibits a more severe fluctuation relative to the other regions on all annual and seasonal scales. In addition, the temperature changes in Antarctica show a similar variation to that of the land region in the Southern Hemisphere. The significant correlation coefficient between annual temperature anomalies in Antarctica and the Southern Hemisphere is 0.96 (0.98) from the MODIS (ERA5), the correlation coefficient between East Antarctica and the Southern Hemisphere is 0.96 (0.94), and the corresponding value between West Antarctica and the Southern Hemisphere is 0.80 (0.79). However, the temperature anomaly of the Antarctic Peninsula from ERA5 shows a negative correlation with that of the Southern Hemisphere, with a correlation coefficient of −0.31, whereas the anomaly from the MODIS shows a near zero R (0.08).
In order to show the temperature changes in more detail, Figure 6 shows the spatial patterns of annual and seasonal temperature trends over Antarctica from ERA5 and the MODIS. Generally, the change in temperature over Antarctica is inhomogeneous, and the distribution from the two kinds of data is basically similar, and the magnitude of the warming trend from ERA5 is basically higher than that from the MODIS. On the annual scale, the warming trend can be observed in Dronning Maud Land in the 30°W to 5°E sector and the cooling trend occurs in West Antarctica and the Wilkes Land in East Antarctica. In ERA5, the strong warming signal can be captured in the northern side of the Antarctic Peninsula, whereas the signal is absent in MODIS observations, which may be influenced by the in situ observations used in ERA5. In austral spring, the warming sign domains East Antarctica, with the rate of 0.65 °C per decade and 0.48 °C per decade from ERA5 and the MODIS, respectively. In contrast, the spring temperature over West Antarctica and the Antarctic Peninsula shows a negative trend, and the cooling rate of the Antarctic Peninsula from the MODIS is up to −0.48 °C per decade. In austral summer, the cooling trend of ERA5 dominates the Antarctic Peninsula (−0.68 °C per decade), whereas the warming can be observed in the western side of the Antarctic Peninsula from the MODIS. In austral autumn, the warming signal appears in West Antarctica and the Antarctic Peninsula, and the cooling trend can be observed in most area in East Antarctica. During the winter time, the MODIS and ERA5 both reflect the cooling trend in the 30°E to 170°E sector in the East Antarctica coast, and obvious warming appears in the 70°E to 150°E sector in the Antarctic inland. The above phenomenon indicates that the MODIS can capture the changes in temperature over the Antarctica and its sub regions.
In Antarctica, there are discrepancies in the trend from ERA5 and the MODIS, especially in austral summer and winter. To measure the similarity of temperature trends between ERA5 and the MODIS quantitatively, the distribution of correlation coefficients between ERA5 and the MODIS temperatures over Antarctica are shown in Figure 7. On annual and seasonal scale, ERA5 and the MODIS are highly correlated in most regions, and the correlation coefficient is generally greater than 0.6. Most regions of the Transantarctic Mountains fail to pass the significance test (p > 0.05), and the signal also can be observed in the Antarctic coast for austral summer. It is worth noting that the correlation between the two kinds of data is generally low in coastal areas and high in the Antarctic inland, which may be related to the fact that most weather stations are distributed in coastal areas and ERA5 assimilates these observational data.
The Southern Annular Mode is critical to temperature change over Antarctica, which reflects the opposite phases change of pressure and geopotential height between mid-latitudes and high latitudes in the Southern Hemisphere [8]. Here, we use the observed annual and seasonal Southern Annular Mode indices (available at https://legacy.bas.ac.uk/met/gjma/sam.html (accessed on 12 November 2022)) to calculate the correlation coefficients between the regional average temperature and Southern Annular Mode during the period 2001–2018. Generally, the correlation between temperature and the Southern Annular Mode is greater in the MODIS compared with ERA5 except for the Antarctic Peninsula (Figure 8). For Antarctica, the annual and seasonal temperatures show the negative correlations, with the annual R of −0.48 and −0.73 from ERA5 and MODIS observations, respectively. The negative correlation is greatest in austral winter, and the correlation coefficients are −0.88 and −0.92 from ERA5 and the MODIS, respectively. The winter temperature in East Antarctica is greatly affected by the Southern Annular Mode, with the correlation coefficients of −0.90 and −0.93 from ERA5 and the MODIS, respectively. Different from the consistent signals of ERA5 and the MODIS in Antarctica, East Antarctica and West Antarctica, the opposite signal in the Antarctic Peninsula can be observed in annual, autumn and winter, and the correlation is positive in ERA5 while negative in MODIS observations. The positive correlations between the Southern Annular Mode and surface temperature in the Antarctic Peninsula also can be observed in a reconstruction that is based on observations and MODIS observations [53]. From the beginning of the 21st century, the annual mean temperature in the Antarctic Peninsula shows a downward trend, with the most conspicuous cooling in austral summer. In this period, the mid-latitude jet strengthens, and induces the increase of cyclonic conditions in the northern Weddell Sea, which can increase the frequency of cold east-to-southeasterly winds to blow toward the Antarctic Peninsula and lead to sea ice towards the east coast of the Antarctic Peninsula [12]. These changes impede the warm northwesterly air related to the Southern Annular Mode entering the interior of the Antarctic Peninsula.
During the period 2001–2018, surface downward longwave radiation is one of the main factors affecting the temperature change over Antarctica, and its correlation coefficient with annual mean temperature is higher than 0.6 in most regions, and this high positive correlation is particularly evident in West Antarctica and the Antarctic inland (Figure 9). The spatial distribution of the correlation coefficients between specific humidity and temperature in Antarctica is similar to that of surface downward longwave radiation, and the influence of specific humidity in the Antarctic Peninsula is related to the topography. In contrast, the correlation between ozone and annual temperature is relatively weak, which is generally positive in the Antarctic coast and negative in the East Antarctic inland. Clouds also affect the temperature changes in Antarctica. In most areas, total cloud cover is positively correlated with the temperature change. Moreover, the correlation between cloud base height, cloud cover and temperature in the Antarctic Peninsula are affected by the terrain. For cloud base height, the positive correlation with temperature can be observed in the western side of the Antarctic Peninsula, while the negative correlation occurs in the eastern side.

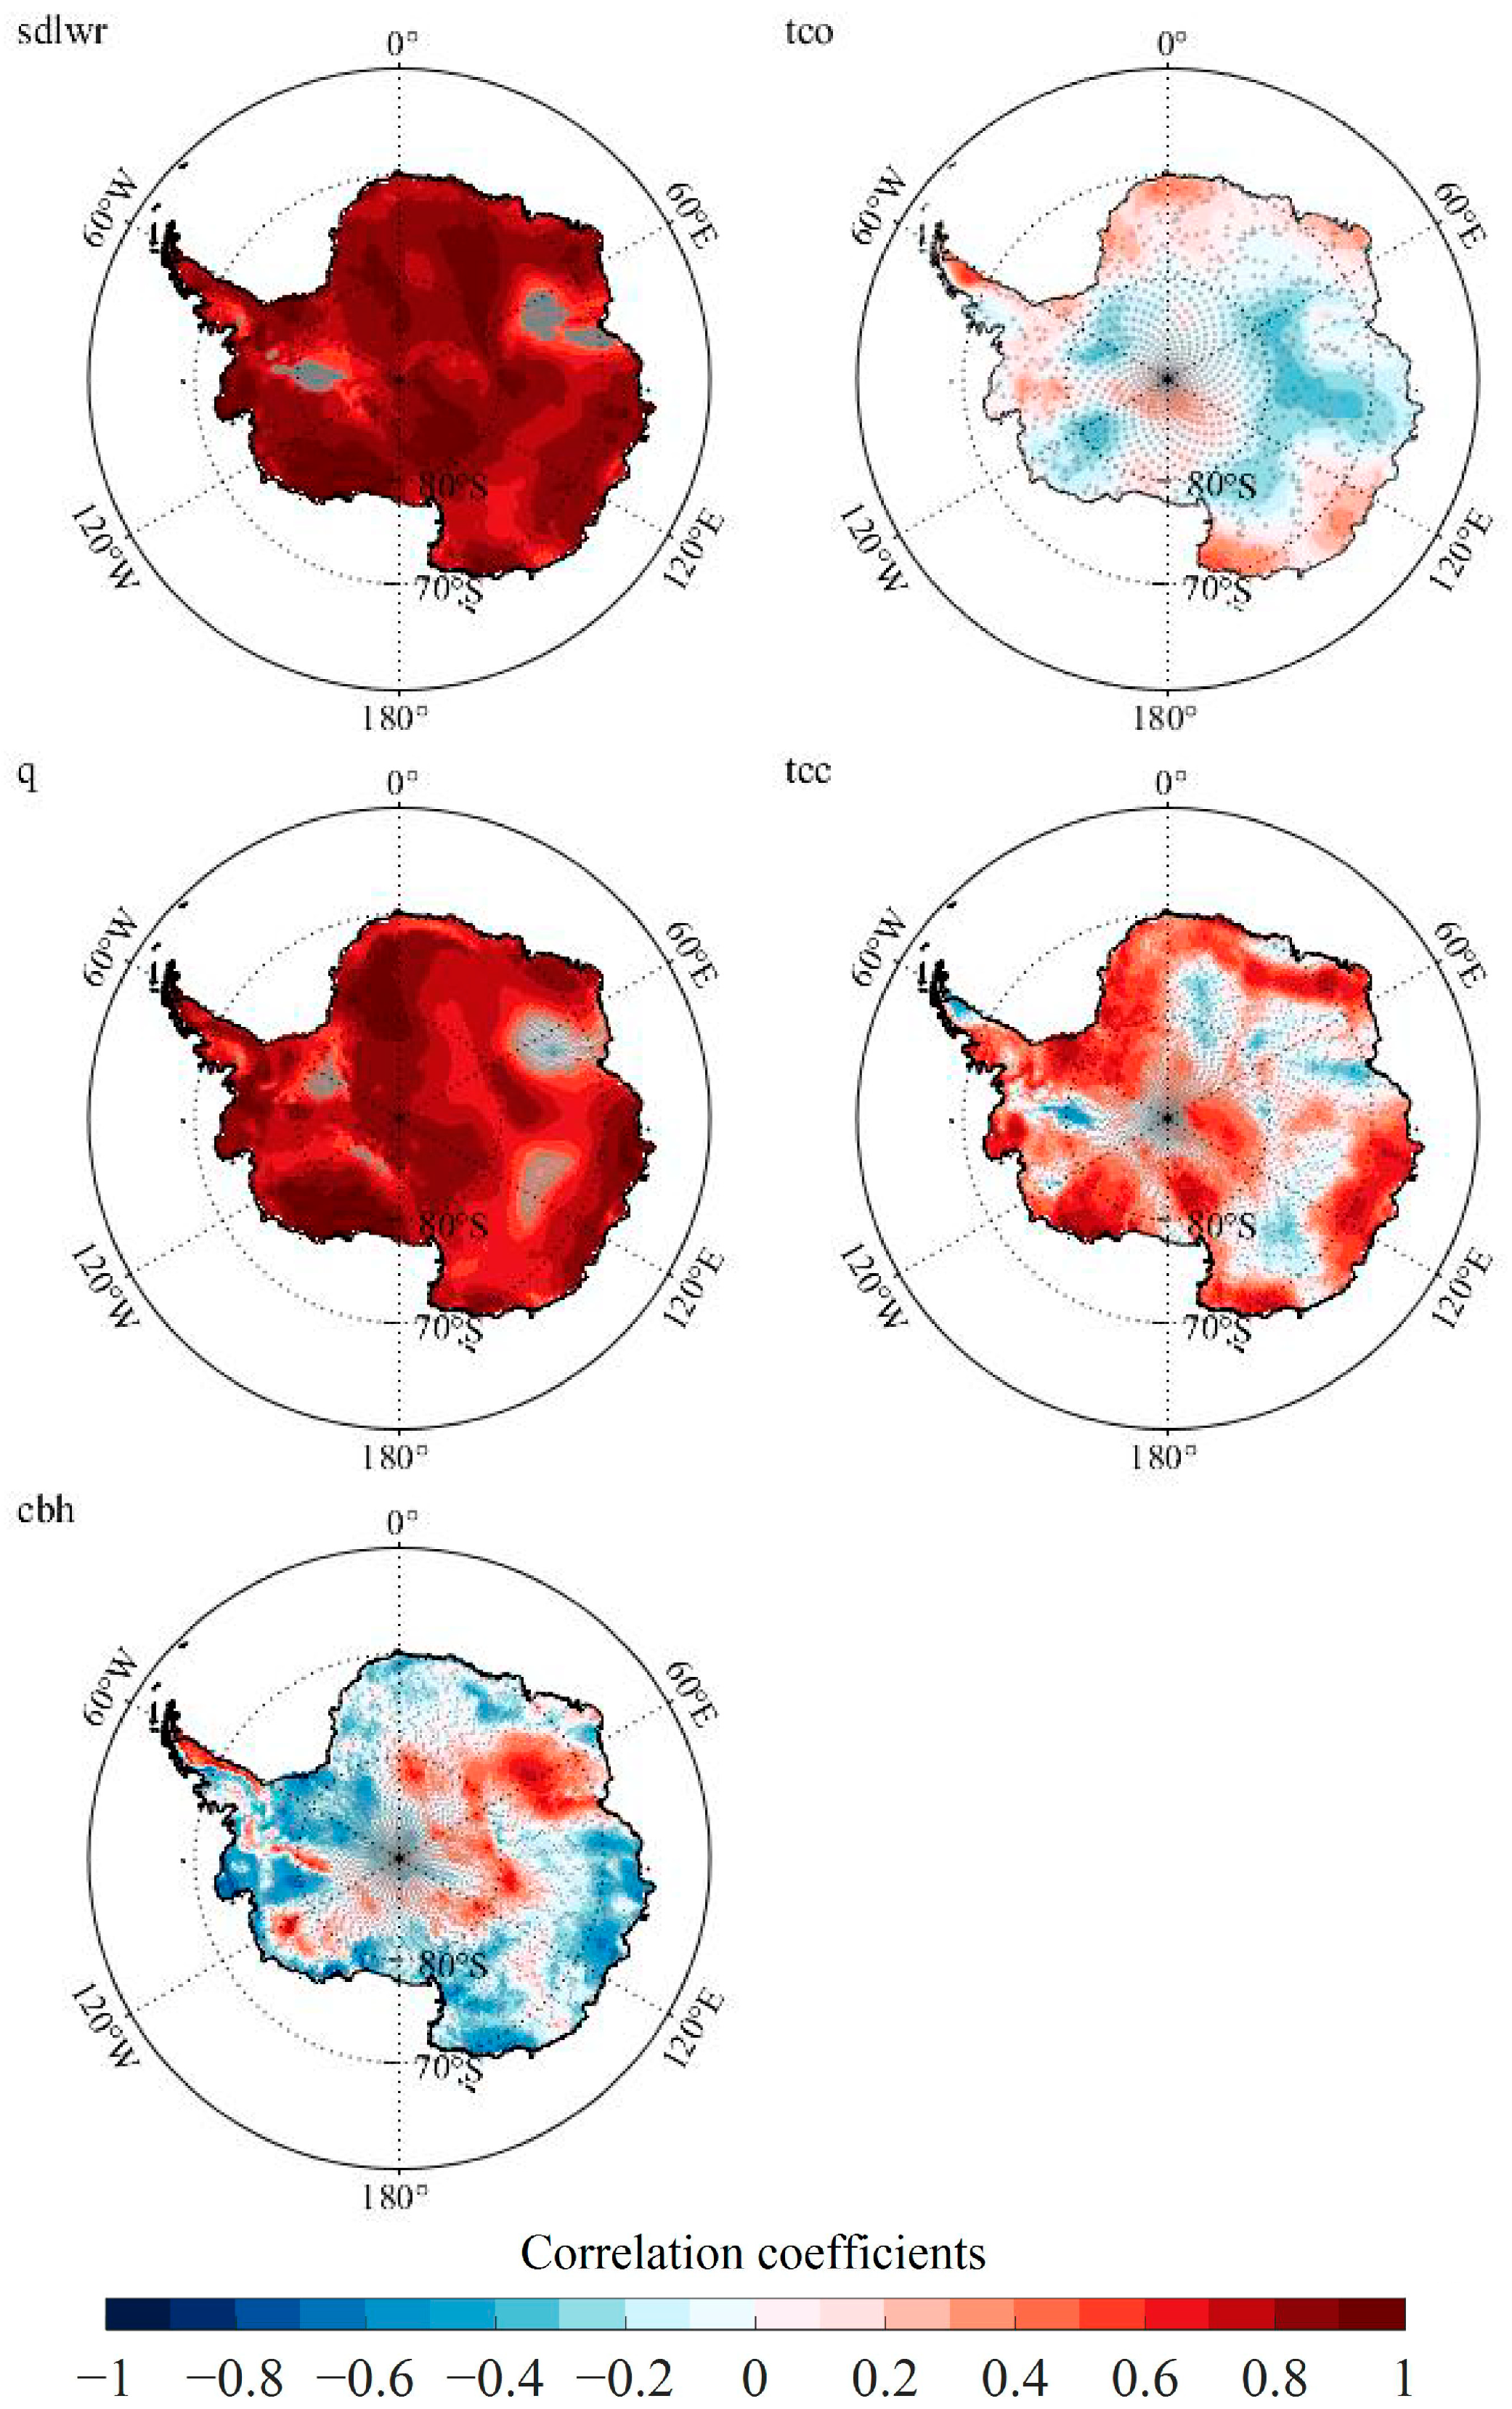
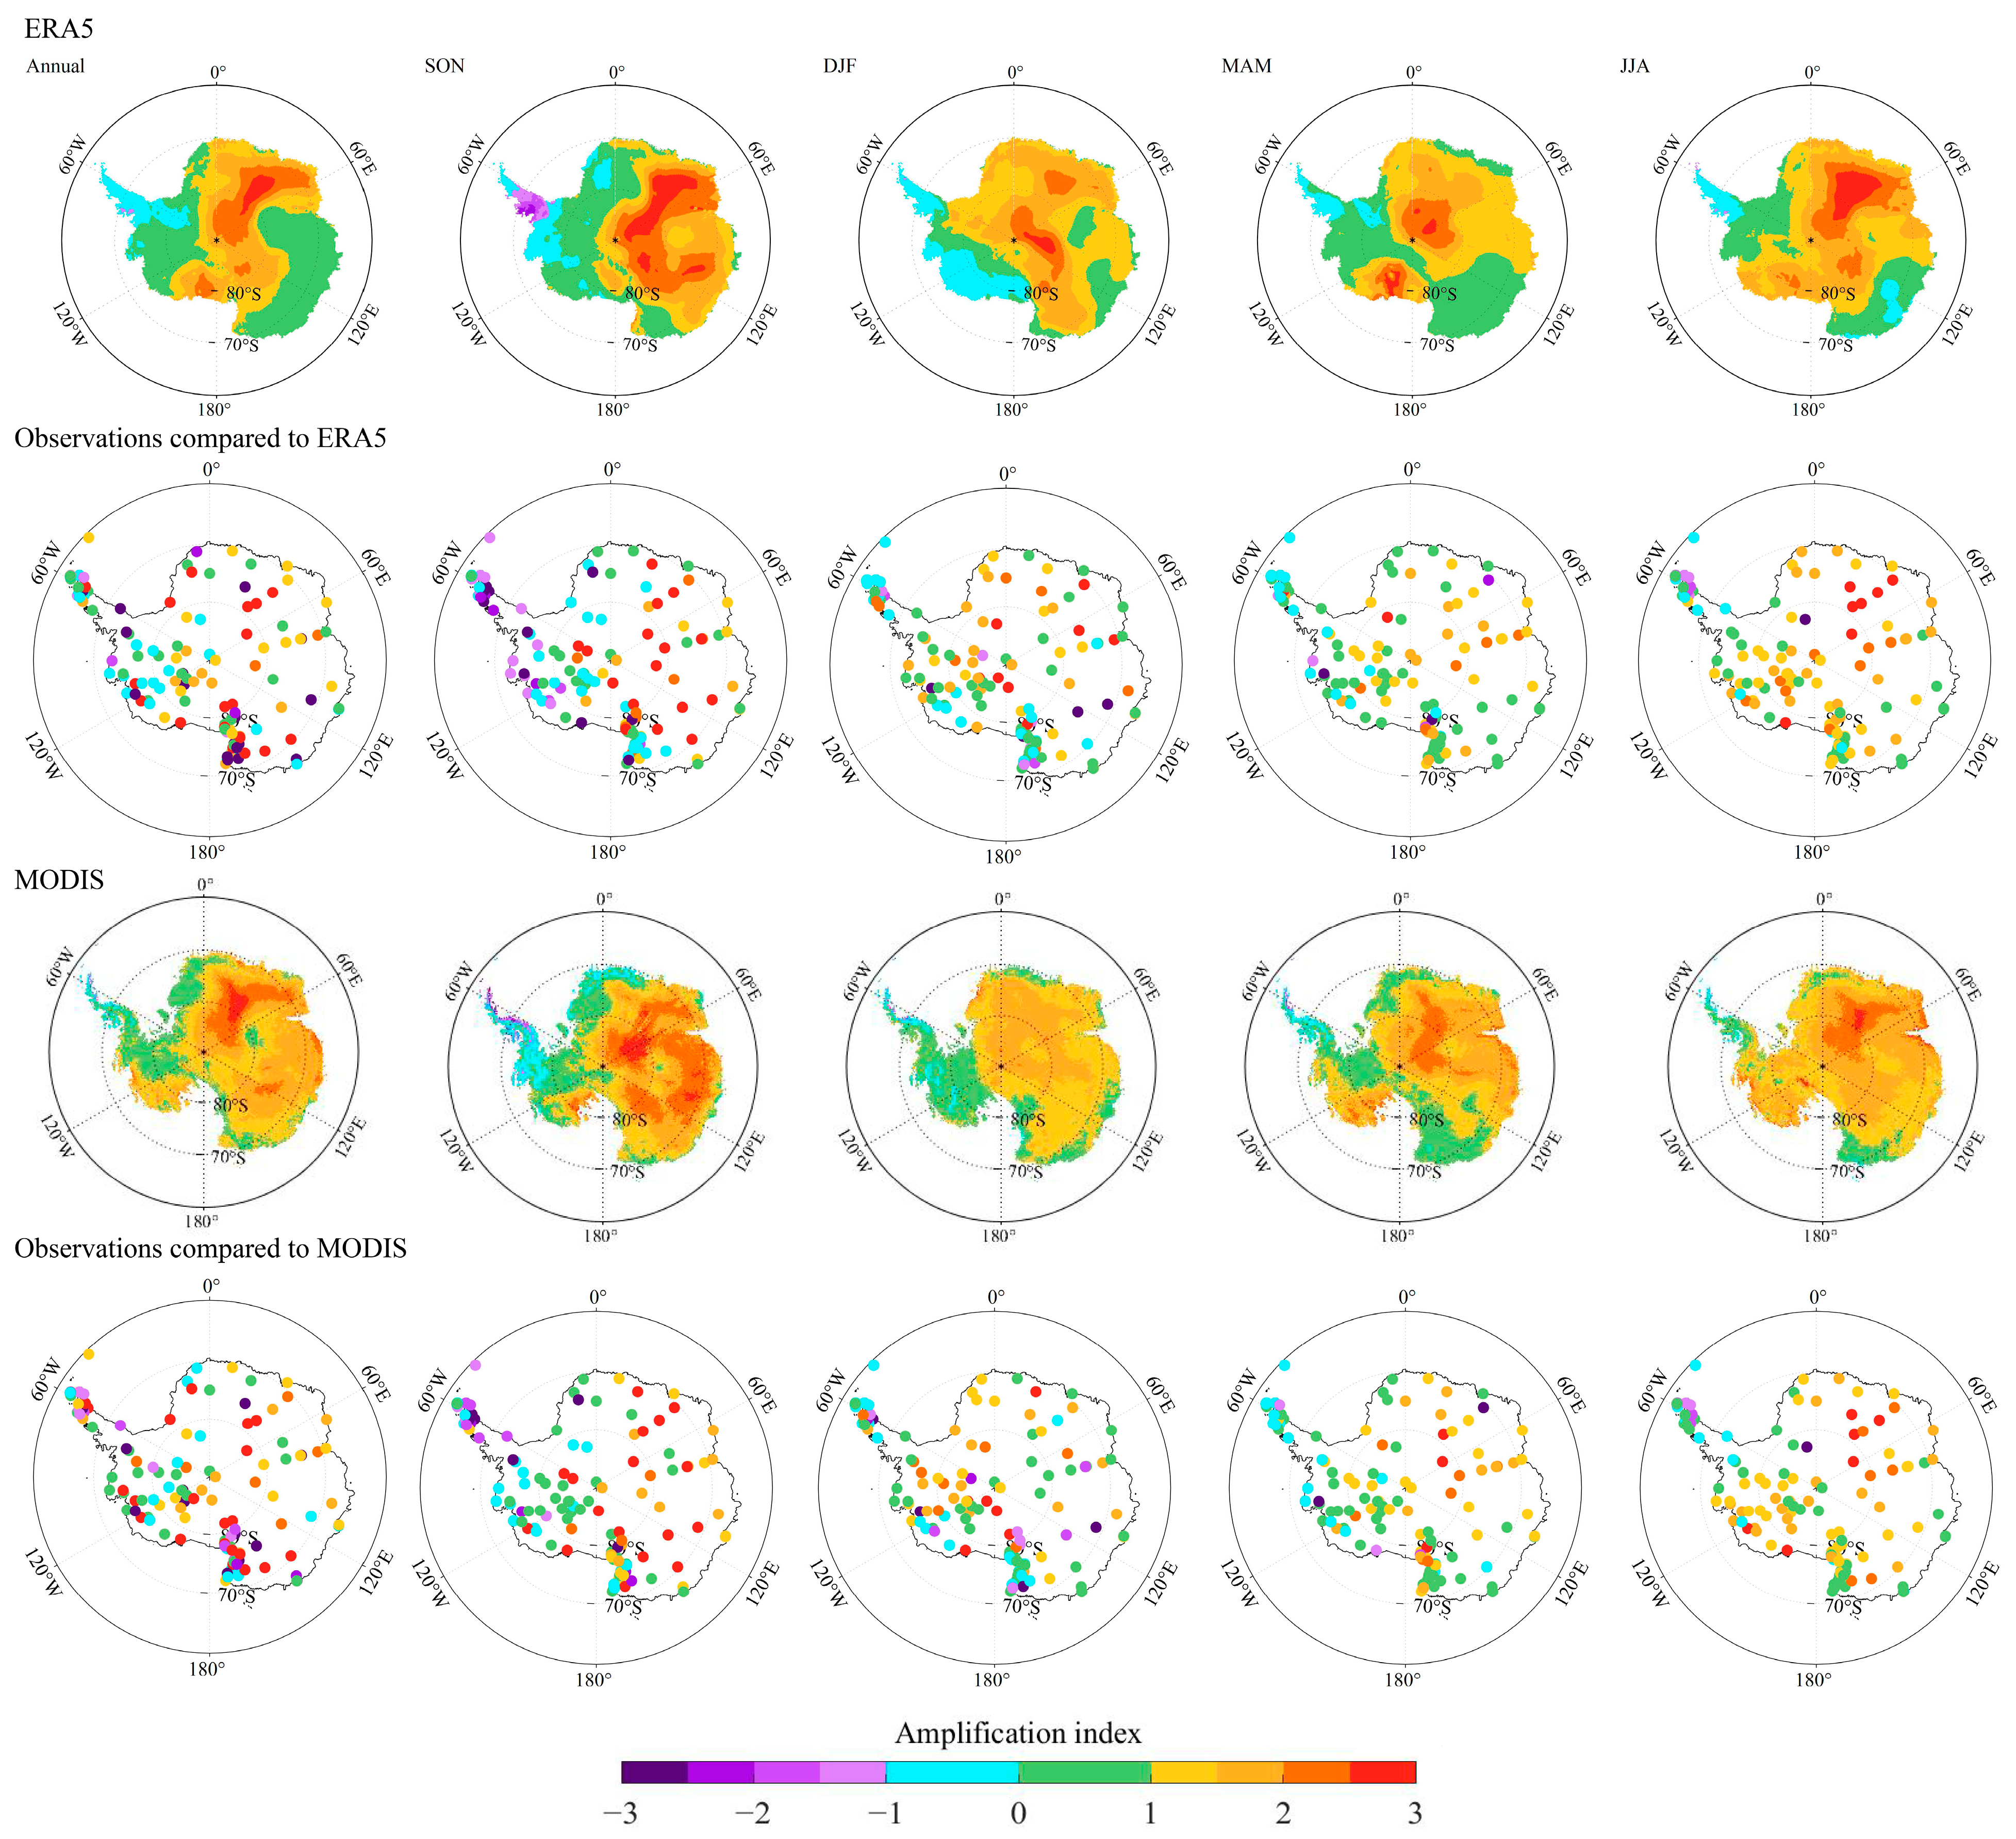
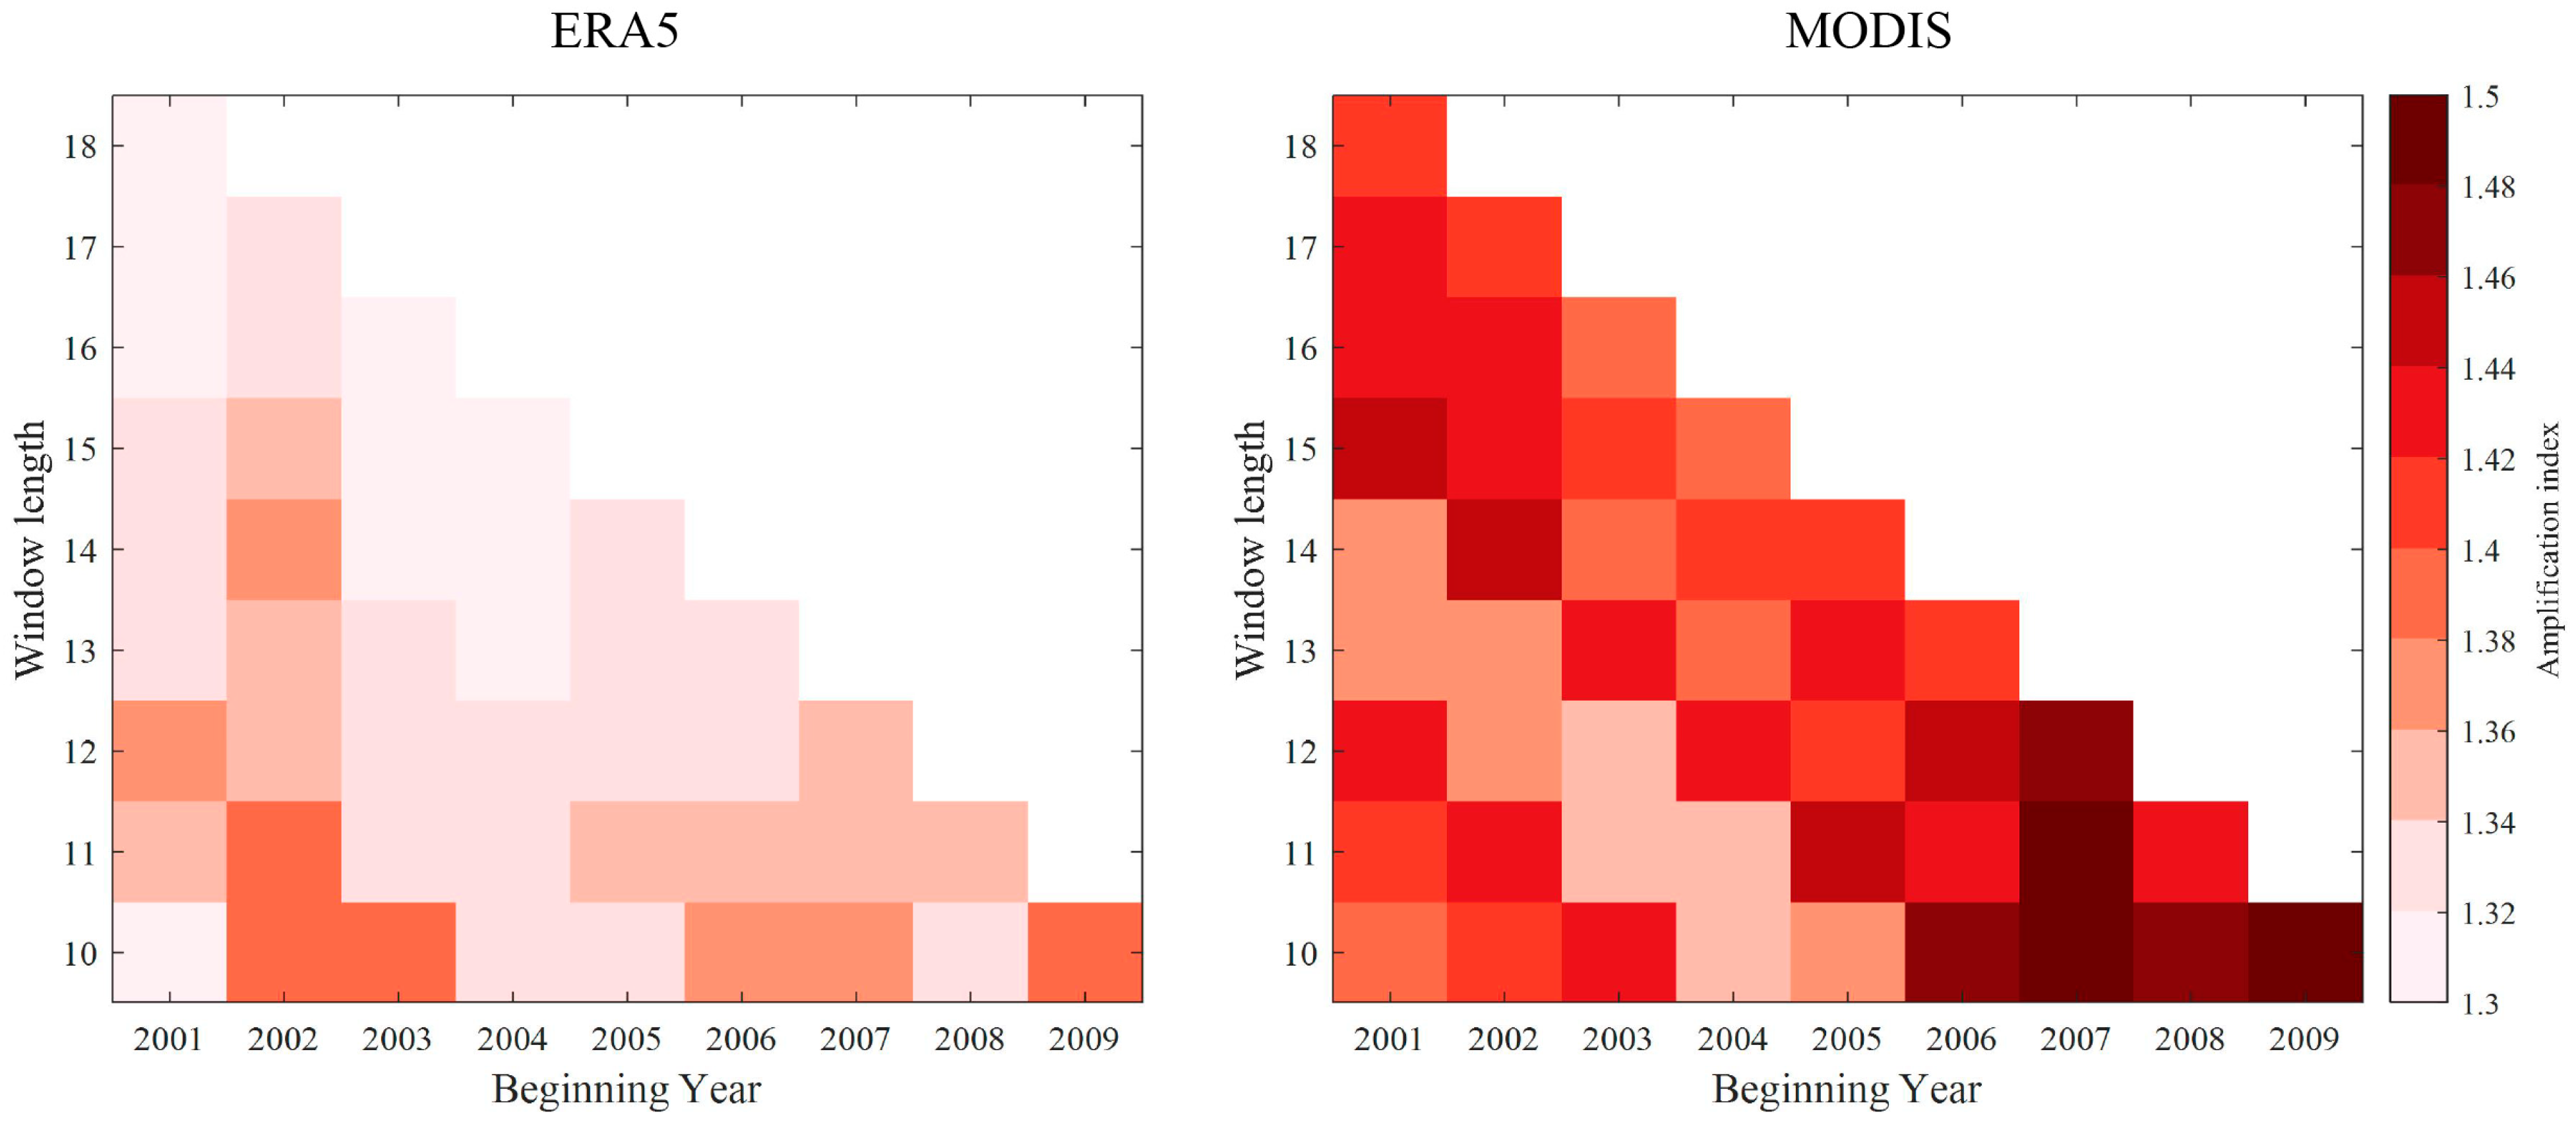
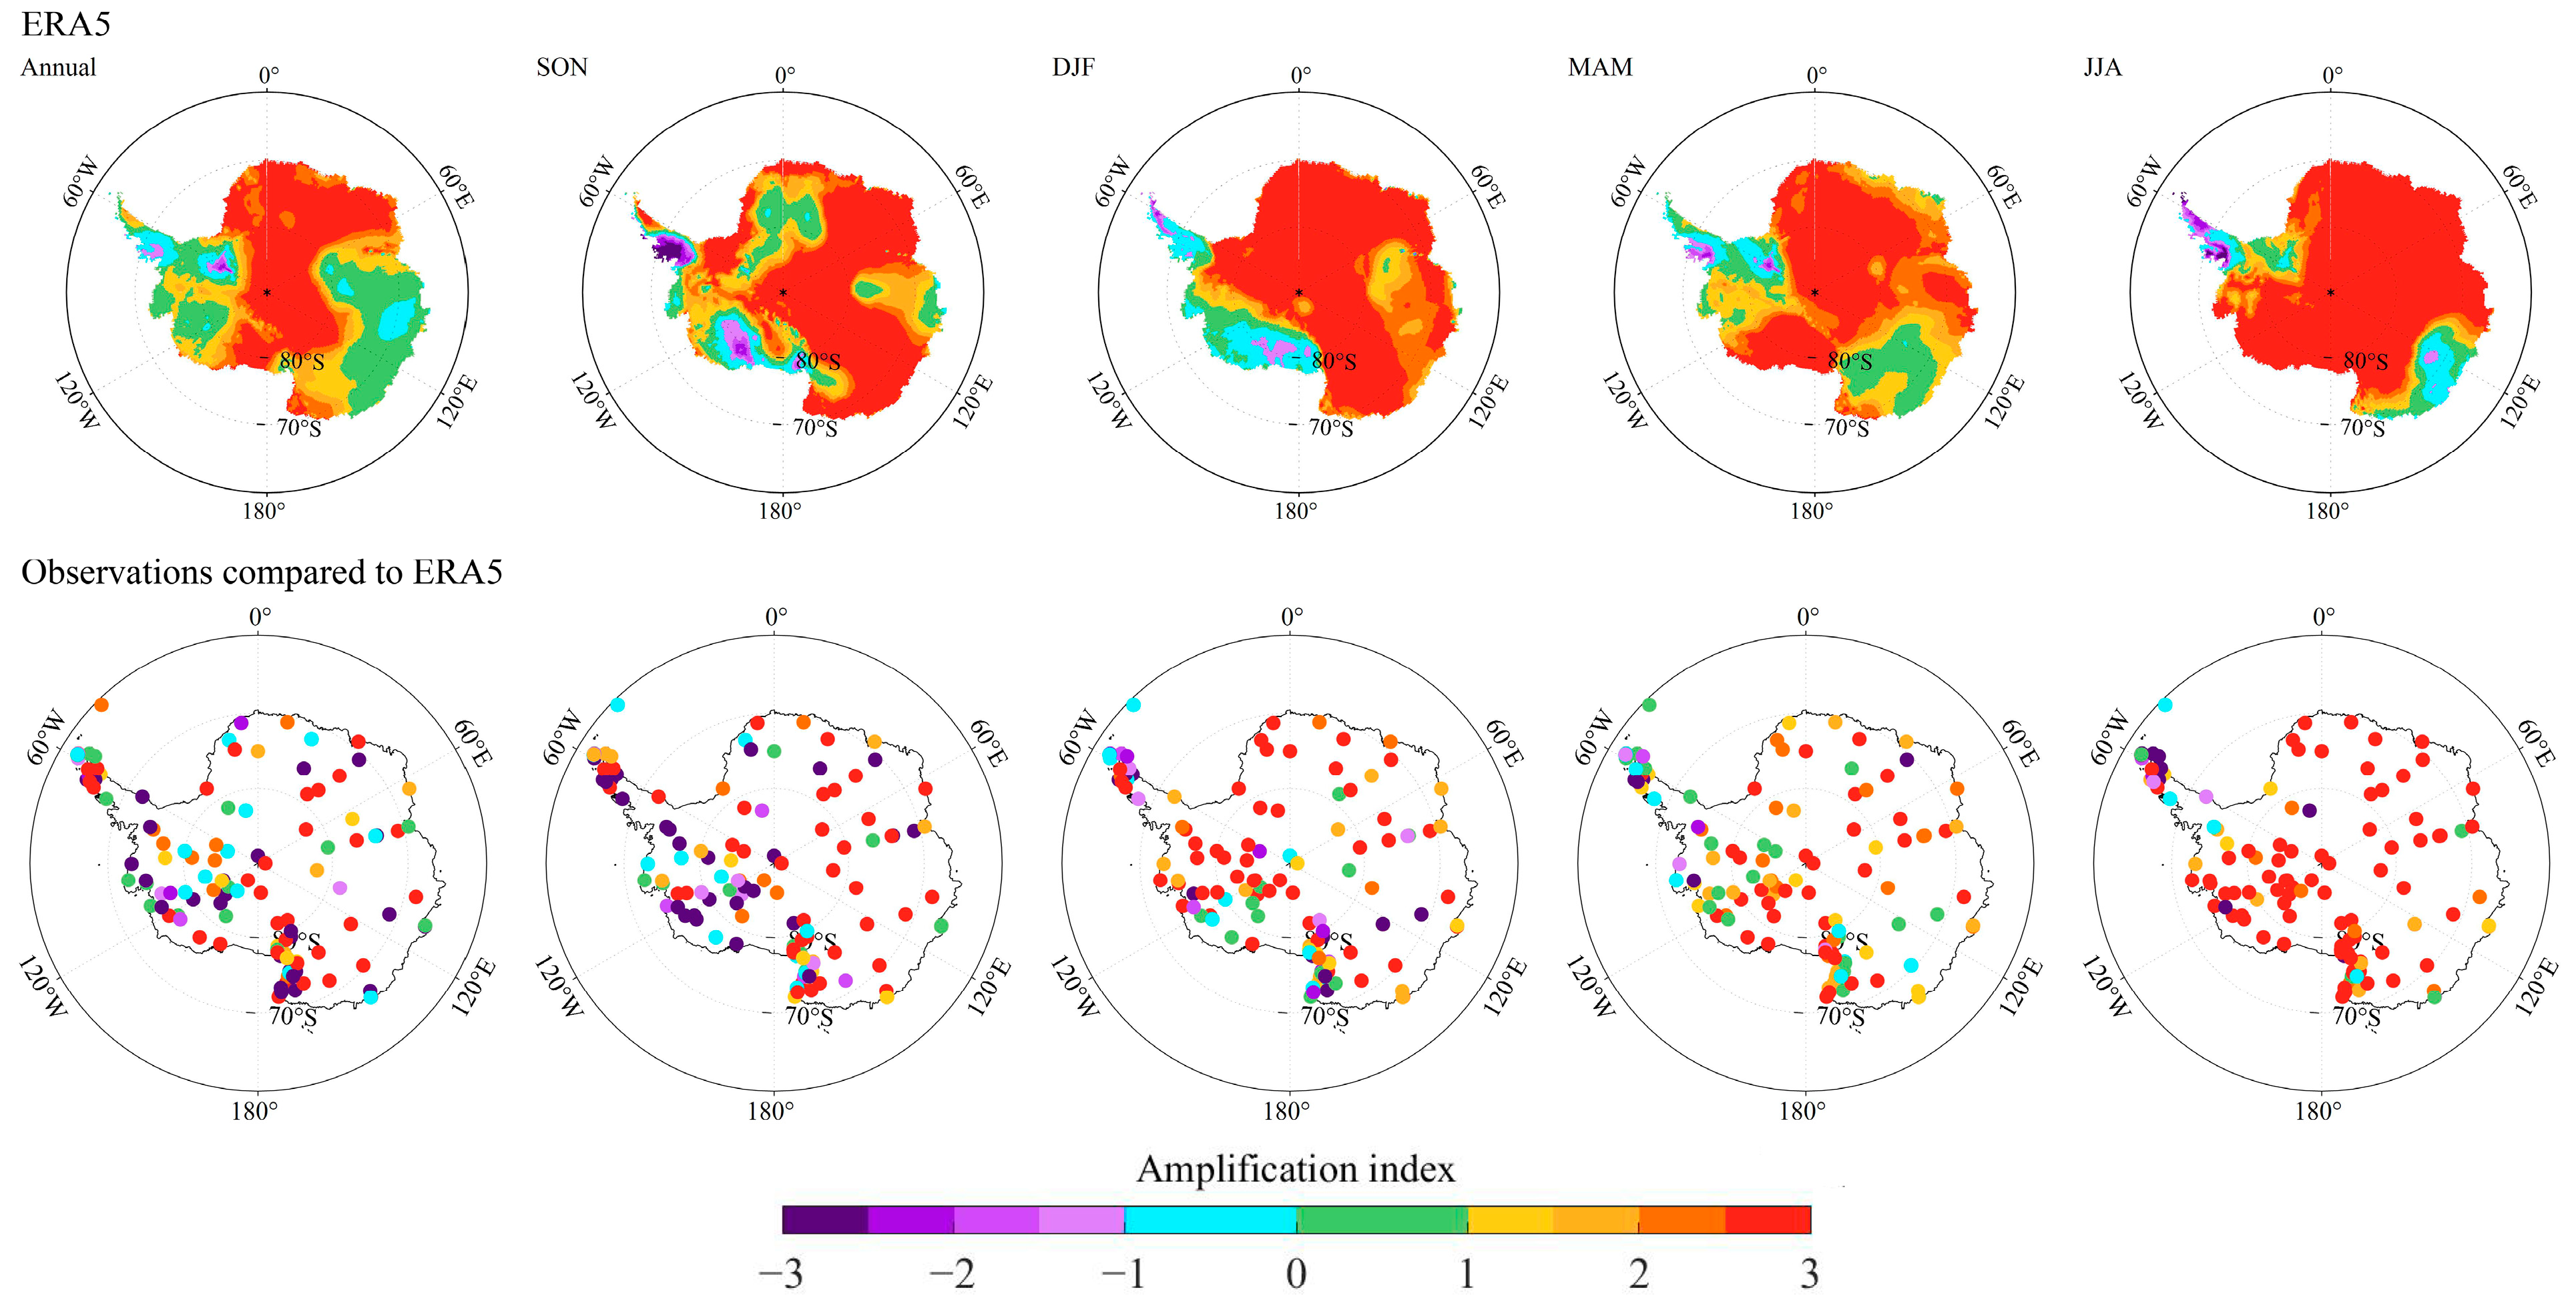
3.3. The Antarctic Amplification from MODIS Observations and ERA5

To explore the AnA for the land region in the Southern Hemisphere, we first quantify AnA by calculating the AnA index. Table 1 shows the annual and seasonal amplification indices of Antarctica and its three sub regions from ERA5 and MODIS observations. For the whole Antarctica, AnA occurs in all cases from the MODIS, with an amplification index of 1.41, 1.37, 1.27, 1.36 and 1.53 in annual, spring, summer, autumn and winter, respectively, and the corresponding value from ERA5 is 1.31, 1.34, 1.32, 1.32 and 1.46, respectively. Consistent with ERA5, MODIS observation results show that the AnA is strongest in austral winter and weakest in summer. Among the sub regions in Antarctica, ERA5 and the MODIS both reflect the greatest amplification in East Antarctica, and the corresponding amplification index is 1.58 (1.53), 1.66 (1.72), 1.45 (1.63), 1.49 (1.48) and 1.61 (1.64) in annual, spring, summer, autumn and winter from the MODIS (ERA5), respectively. The amplification is most conspicuous in austral spring, and is corresponding to the obvious warming of the spring temperature over East Antarctica (Figure 3). For West Antarctica, the amplification occurs in austral autumn and winter, and is absent in spring and summer. The annual amplification in West Antarctica can be captured in MODIS observations, with the amplification index of 1.12, whereas the signal is missing in ERA5. However, no amplification is found in the Antarctic Peninsula, from both ERA5 and MODIS observations.
The spatial patterns of the annual and seasonal amplification indices over Antarctica from ERA5 and the MODIS are shown in Figure 10. On an annual scale, the amplification dominates in East Antarctica and does not manifest in the Antarctic Peninsula. Moreover, the annual AnA from ERA5 disappears in the region that extends 70–150°E inwards near the coast of East Antarctica. In all seasons, the amplification signal cannot be captured in the Antarctic Peninsula in general. The amplification is most widespread in austral winter, which is consistent with the strongest AnA for Antarctica in austral winter. Although the magnitude of the amplification indices from the MODIS and ERA5 are slightly different, the signals they express are basically the same. Compared with ERA5 and the MODIS, most stations located in West Antarctica do not exhibit the AnA sign on an annual scale, while in East Antarctica the opposite is true. On seasonal scales, most stations located in the northern Antarctic Peninsula fail to capture the amplification signal. Generally, the AnA reflected by observations is most conspicuous in austral winter, with the amplification index higher than 1 at more than 80 stations.
In addition, we calculate the annual and seasonal amplification indices from the MODIS daytime and nighttime observations, and the results are summarized in Table 2. The amplification always occurs in Antarctica and East Antarctica, and the signal disappears in the Antarctic Peninsula. For Antarctica, the amplification index is 1.35 (1.44), 1.31 (1.43), 1.31 (1.32), 1.33 (1.39) and 1.52 (1.55) in annual, spring, summer, autumn and winter from daytime observations (nighttime observations), respectively. The amplification is strongest in the nighttime, followed by the whole day, and weakest in the daytime in general, which indicates that the amplification of minimum temperature is conspicuous. The greatest amplification occurs in East Antarctica, and the corresponding amplification index is 1.51 (1.62), 1.56 (1.76), 1.47 (1.54), 1.47 (1.51) and 1.59 (1.63) in annual, spring, summer, autumn and winter from daytime observations (nighttime observations), respectively. For the daytime observations, the amplification is strongest in austral winter in Antarctica and East Antarctica. However, the East Antarctic amplification from nighttime observations is most obvious in austral spring. For West Antarctica, the amplification is strongest in austral winter, with the amplification index of 1.42 and 1.43 for daytime and nighttime observations, respectively, and the amplification is absent in austral spring and summer, which is similar to that in the whole day from the MODIS.
To analyze the ability of the MODIS to retrieve AnA using limited data, Figure 11 shows the annual AnA index with differing start years and interval lengths from ERA5 and MODIS observations. Clearly, the AnA always occurs, and the intensity of AnA from the MODIS is stronger than that from ERA5, with the difference of the AnA index between them lower than 0.2. The MODIS illustrates that the greatest AnA appears in the period 2009–2018, with the amplification index of 1.49, and the strong AnA also can be captured in ERA5, with the index of 1.40.

4. Discussion

Variations in near-surface temperature over Antarctica are inhomogeneous during the period 2001–2018. East Antarctica has always been considered as a cooling region, whereas the widespread warming in austral spring is different from previous cognitions, and the phenomenon of spring warming has begun to attract attention. A previous study has analyzed the variations in near-surface air temperature based on 17 Antarctic stations, and found Antarctica has experienced extensive warming since 1979 [54]. In addition, the spring warming in East Antarctica has also been found in 1979–2019, based on the analysis of ERA5, and the warming relates to the increase of downward longwave radiation [11,37]. In austral autumn, the cooling in western East Antarctica closely connects to the ENSO (El Niño–Southern Oscillation), and the increased La Niña events can explain a portion of cooling in East Antarctica [18]. The increase of ENSO events may weaken the warming in West Antarctica and even turn into producing the opposite trend, and the autumn cooling in East Antarctica may also turn into a warming trend [18,55].
The AnA can be observed from the MODIS and ERA5, and is strong in austral autumn and winter and weak in austral summer, which is similar to the seasonal features of Arctic amplification [56,57]. The destabilizing ice albedo and lapse rate feedbacks over the Arctic and Antarctica are amplified by the poleward shift in ocean heat convergence, especially in the Arctic, and are associated with the stronger Arctic amplification relative to the AnA [58]. The polar amplification occurs as a response to greenhouse gas forcing, and the changes in atmospheric and oceanic heat transports, surface-albedo feedback and longwave feedbacks are thought to be the contributors [59,60,61]. The AnA calculated above is only for the land region. Considering that most of the Southern Hemisphere is covered by the ocean, the amplification index based on comparing temperature changes in land and ocean regions is further calculated based on ERA5. Figure 12 shows the zonal mean in the Southern Hemisphere for surface air temperature including the land and ocean, and only for the land region during the period 2001–2018. Clearly, the variations in high latitudes are higher than those in the middle and low latitudes when comprehensively considering sea and land, and the phenomenon is obvious in austral spring. However, the fast changes in high latitudes weaken or disappear when only the land region is considered. The amplification index over the Antarctica based on the land and ocean near-surface temperatures is higher than the index for the land region alone on all annual and seasonal scales, and the sign is most conspicuous in austral spring and winter (Figure 10 and Figure 13). When considering the influence of the ocean, the intensity of AnA is 2.27, 2.71, 2.74, 2.74 and 4.07 in annual, spring, summer, autumn and winter, respectively, which are obviously stronger compared with the changes in the land region. In addition, the regional difference is similar, with the greatest amplification in East Antarctica, followed by West Antarctica, and the weakest in the Antarctic Peninsula. Compared with the temperature changes in land and ocean regions in the Southern Hemisphere, AnA appears in more than 80% of the stations, and the greatest AnA can be observed in austral winter, with the amplification index higher than 1 at 118 stations. AnA is weak when only the land areas are considered. The above phenomenon reflects the positive influence of the ocean on AnA. During the period 1979–2019, AnA only occurs in austral spring and summer [37], and obvious AnA can be observed in 2001–2018, which indicates that the occurrence and intensity of AnA is related to the selection of time period. Limited by data, we only analyzed the temperature changes over 18 years, and the short time series will affect the analysis results to some extent. Previous studies found that the Antarctic Peninsula exhibits strong warming when the time series exceeds 30 years, and periods shorter than 30 years exhibit alternations of warming and cooling periods [13]. During the period 1999–2014, the significant annual and summer cooling trends can be observed in the Antarctic Peninsula [12], and the signal can be captured by MODIS observations. Therefore, remote sensing data of short time series are also a powerful tool in the Antarctic region where the measured data are extremely scarce.

5. Conclusions

In this study, we employ MODIS observations and ERA5 reanalysis data to provide an initial evaluation of temperature changes in Antarctica and its sub regions East Antarctica, West Antarctica and the Antarctic Peninsula during the period 2001–2018. We further explore the existence of Antarctic amplification (AnA) and calculate its amplification index to quantify the intensity of AnA, which aims to explore the AnA from MODIS land surface temperature observations.
Compared with the 128 stations’ observations, the MODIS can capture the variations in temperature, with the monthly correlation coefficients at 104 stations being higher than 0.90. In addition, MODIS and ERA5 temperatures are highly correlated, with correlation coefficients higher than 0.86. The temperature changes in Antarctica are positively correlated with the Southern Hemisphere, and the positive correlation also exists in East Antarctica and West Antarctica. However, the correlation between Antarctic Peninsula and Southern Hemisphere temperatures in the MODIS and ERA5 are different, and a negative correlation is shown in ERA5, while the MODIS captures a slight positive correlation. The annual and seasonal spatial patterns of temperature trends from the MODIS and ERA5 are basically consistent, and have seasonal variations and regional differences, although the trends are slight different. In austral spring, both the MODIS and ERA5 reflect the widespread warming trend in East Antarctica, which is different from previous cognition. However, the warming concentrates on West Antarctica and the Antarctic Peninsula in austral autumn, and is absent in most areas in East Antarctica. Moreover, the MODIS illustrates the negative correlation between SAM and the temperature over Antarctica, East Antarctica and West Antarctica, especially in austral winter, and the signal is similar in ERA5.
From the MODIS, AnA occurs on all annual and seasonal scales, with the amplification index higher than 1.27, and the greatest amplification occurs in austral winter and the weakest in austral summer. AnA exhibits seasonal and regional differences, and the characteristics of the MODIS and ERA5 are basically consistent. AnA is most conspicuous in East Antarctica, with the annual amplification index of 1.58 (1.53) from the MODIS (ERA5), and the amplification is strong in austral spring and winter. For West Antarctica, the amplification is strong in austral winter, and weak in austral spring. However, the Antarctic Peninsula always fails to capture the amplification signal. Corresponding to the amplification index of the changes in the regional temperature mean, the value of the amplification index that is higher than 1 concentrates on the East Antarctica region. In addition, the AnA can also be observed in MODIS daytime and nighttime observations, and has the same regional and seasonal differences as the daily average temperature. Importantly, AnA in nighttime observations is always stronger than that in daytime observations.
This study demonstrates the existence of AnA in MODIS land surface temperature observations, and AnA exhibits regional and seasonal differences. However, the mechanism of AnA is not clear yet. In order to understand the role of AnA in climate change better, future research needs to combine remote sensing data, measured data, and reanalysis data to explore the influencing factors of AnA.

Supplementary Materials

The following supporting information can be downloaded at: https://www.mdpi.com/article/10.3390/rs15143540/s1, Table S1: List of the selected meteorological stations including station names, latitude, longitude and elevation.

Author Contributions

Conceptualization, A.X. and J.Z.; methodology, A.X. and J.Z.; software, A.X. and J.Z.; validation, A.X. and X.Q.; formal analysis, A.X.; resources, A.X.; data curation, A.X.; writing—original draft preparation, A.X.; writing—review and editing, J.Z., X.Q. and S.W.; visualization, A.X.; supervision, A.X.; project administration, A.X. All authors have read and agreed to the published version of the manuscript.

Funding

This research was funded by the National Natural Science Foundation of China, grant number 42276260, the 2021 technical support talent project of the Chinese Academy of Sciences, and State Key Laboratory of Cryospheric Sciences, Northwest Institute of Eco-Environment and Resources, Chinese Academy of Sciences.

Data Availability Statement

ERA5 data presented in this study are openly available at https://cds.climate.copernicus.eu/#!/search?text=ERA5&type=dataset (accessed on 18 August 2022), MODIS observations are openly available at https://lpdaac.usgs.gov/products/mod11c3v061/ (accessed on 21 September 2022), AWSs data are openly available at https://amrdcdata.ssec.wisc.edu/dataset/antaws-dataset (accessed on 10 May 2023), and manual data are openly available at https://legacy.bas.ac.uk/met/READER/surface (accessed on 10 May 2023).

Acknowledgments

We thank the National Centre for Atmospheric Science, European Center for Medium-Range Weather Forecasts, Scientific Committee on Antarctic Research, and Wang Y.T. for providing data to improve the paper.

Conflicts of Interest

The authors declare no conflict of interest.

References

  1. King, J.; Turner, J. Antarctic Meteorology and Climatology; Cambridge Atmospheric and Space Science Series; Cambridge University Press: Cambridge, UK, 1997; pp. 1–12. [Google Scholar] [CrossRef]
  2. Rintoul, S.R.; Chown, S.L.; DeConto, R.M.; England, M.H.; Fricker, H.A.; Masson-Delmotte, V.; Naish, T.R.; Siegert, M.J.; Xavier, J.C. Choosing the future of Antarctica. Nature 2018, 558, 233–241. [Google Scholar] [CrossRef] [PubMed]
  3. Roussel, M.-L.; Lemonnier, F.; Genthon, C.; Krinner, G. Brief communication: Evaluating Antarctic precipitation in ERA5 and CMIP6 against CloudSat observations. Cryosphere 2020, 14, 2715–2727. [Google Scholar] [CrossRef]
  4. Gomez, N.; Pollard, D.; Holland, D. Sea-level feedback lowers projections of future Antarctic Ice-Sheet mass loss. Nat. Commun. 2015, 6, 8798. [Google Scholar] [CrossRef] [PubMed] [Green Version]
  5. Greene, C.A.; Gardner, A.S.; Schlegel, N.-J.; Fraser, A.D. Antarctic calving loss rivals ice-shelf thinning. Nature 2022, 609, 948–953. [Google Scholar] [CrossRef]
  6. Turner, J.; Colwell, S.R.; Marshall, G.J.; Lachlan-Cope, T.A.; Carleton, A.M.; Jones, P.D.; Lagun, V.; Reid, P.A.; Iagovkina, S. Antarctic climate change during the last 50 years. Int. J. Climatol. 2005, 25, 279–294. [Google Scholar] [CrossRef]
  7. Thompson, D.W.J.; Solomon, S. Interpretation of recent Southern Hemisphere climate change. Science 2002, 296, 895–899. [Google Scholar] [CrossRef] [Green Version]
  8. Marshall, G.J. Half-century seasonal relationships between the Southern Annular Mode and Antarctic temperatures. Int. J. Climatol. 2007, 27, 373–383. [Google Scholar] [CrossRef] [Green Version]
  9. Clem, K.R.; Fogt, R.L. South Pacific circulation changes and their connection to the tropics and regional Antarctic warming in austral spring, 1979–2012. J. Geophys. Res. Atmos. 2015, 120, 2773–2792. [Google Scholar] [CrossRef]
  10. Raphael, M.N.; Marshall, G.J.; Turner, J.; Fogt, R.L.; Schneider, D.; Dixon, D.A.; Hosking, J.S.; Jones, J.M.; Hobbs, W.R. The Amundsen Sea Low Variability, Change, and Impact on Antarctic Climate. Bull. Am. Meteorol. Soc. 2016, 97, 111–121. [Google Scholar] [CrossRef]
  11. Sato, K.; Simmonds, I. Antarctic skin temperature warming related to enhanced downward longwave radiation associated with increased atmospheric advection of moisture and temperature. Environ. Res. Lett. 2021, 16, 064059. [Google Scholar] [CrossRef]
  12. Turner, J.; Lu, H.; White, I.; King, J.C.; Phillips, T.; Hosking, J.S.; Bracegirdle, T.J.; Marshall, G.J.; Mulvaney, R.; Deb, P. Absence of 21st century warming on Antarctic Peninsula consistent with natural variability. Nature 2016, 535, 411–415. [Google Scholar] [CrossRef] [Green Version]
  13. Gonzalez, S.; Fortuny, D. How robust are the temperature trends on the Antarctic Peninsula? Antarct. Sci. 2018, 30, 322–328. [Google Scholar] [CrossRef] [Green Version]
  14. Steig, E.J.; Schneider, D.P.; Rutherford, S.D.; Mann, M.E.; Comiso, J.C.; Shindell, D.T. Warming of the Antarctic ice-sheet surface since the 1957 International Geophysical Year. Nature 2009, 457, 459–462. [Google Scholar] [CrossRef] [Green Version]
  15. Bromwich, D.H.; Nicolas, J.P.; Monaghan, A.J.; Lazzara, M.A.; Keller, L.M.; Weidner, G.A.; Wilson, A.B. Central West Antarctica among the most rapidly warming regions on Earth. Nat. Geosci. 2013, 6, 139–145. [Google Scholar] [CrossRef] [Green Version]
  16. Lachlan-Cope, T.; Connolley, W. Constellations between the tropical Pacific and the Amundsen-Bellingshausen Seas: Role of the El Niño-Southern Oscillation. J. Geophys. Res. 2006, 111, D23101. [Google Scholar] [CrossRef] [Green Version]
  17. Ding, Q.; Steig, E.J.; Battisti, D.S.; Kuettel, M. Winter warming in West Antarctica caused by central tropical Pacific warming. Nat. Geosci. 2011, 4, 398–403. [Google Scholar] [CrossRef] [Green Version]
  18. Clem, K.R.; Renwick, J.A.; McGregor, J. Autumn Cooling of Western East Antarctica Linked to the Tropical Pacific. J. Geophys. Res. Atmos. 2018, 123, 89–107. [Google Scholar] [CrossRef]
  19. van den Broeke, M.R.; van Lipzig, N.P.M. Factors controlling the near-surface wind field in Antarctica. Mon. Weather. Rev. 2003, 131, 733–743. [Google Scholar] [CrossRef]
  20. Marshall, G.J.; Orr, A.; Turner, J. A Predominant Reversal in the Relationship between the SAM and East Antarctic Temperatures during the Twenty-First Century. J. Clim. 2013, 26, 5196–5204. [Google Scholar] [CrossRef] [Green Version]
  21. Lambert, F.; Kug, J.S.; Park, R.J.; Mahowald, N.; Winckler, G.; Abe-Ouchi, A.; O’Ishi, R.; Takemura, T.; Lee, J.H. The role of mineral-dust aerosols in polar temperature amplification. Nat. Clim. Chang. 2013, 3, 487–491. [Google Scholar] [CrossRef]
  22. Masson-Delmotte, V.; Kageyama, M.; Braconnot, P.; Charbit, S.; Krinner, G.; Ritz, C.; Guilyardi, E.; Jouzel, J.; Abe-Ouchi, A.; Crucifix, M.; et al. Past and future polar amplification of climate change: Climate model intercomparisons and ice-core constraints. Clim. Dyn. 2006, 26, 513–529. [Google Scholar] [CrossRef]
  23. Stuecker, M.F.; Bitz, C.M.; Armour, K.C.; Proistosescu, C.; Kang, S.M.; Xie, S.-P.; Kim, D.; McGregor, S.; Zhang, W.; Zhao, S.; et al. Polar amplification dominated by local forcing and feedbacks. Nat. Clim. Chang. 2018, 8, 1076–1081. [Google Scholar] [CrossRef]
  24. Holland, M.M.; Bitz, C.M. Polar amplification of climate change in coupled models. Clim. Dyn. 2003, 21, 221–232. [Google Scholar] [CrossRef]
  25. Goosse, H.; Kay, J.E.; Armour, K.C.; Bodas-Salcedo, A.; Chepfer, H.; Docquier, D.; Jonko, A.; Kushner, P.J.; Lecomte, O.; Massonnet, F.; et al. Quantifying climate feedbacks in polar regions. Nat. Commun. 2018, 9, 1919. [Google Scholar] [CrossRef] [Green Version]
  26. Gao, K.; Duan, A.; Chen, D.; Wu, G. Surface energy budget diagnosis reveals possible mechanism for the different warming rate among Earth’s three poles in recent decades. Sci. Bull. 2019, 64, 1140–1143. [Google Scholar] [CrossRef] [Green Version]
  27. Chen, J.-L.; Kang, S.-C.; Meng, X.-H.; You, Q.-L. Assessments of the Arctic amplification and the changes in the Arctic sea surface. Adv. Clim. Chang. Res. 2019, 10, 193–202. [Google Scholar] [CrossRef]
  28. Cohen, J.; Zhang, X.; Francis, J.; Jung, T.; Kwok, R.; Overland, J.; Ballinger, T.J.; Bhatt, U.S.; Chen, H.W.; Coumou, D.; et al. Divergent consensuses on Arctic amplification influence on midlatitude severe winter weather. Nat. Clim. Chang. 2020, 10, 20–29. [Google Scholar] [CrossRef]
  29. Rantanen, M.; Karpechko, A.Y.; Lipponen, A.; Nordling, K.; Hyvarinen, O.; Ruosteenoja, K.; Vihma, T.; Laaksonen, A. The Arctic has warmed nearly four times faster than the globe since 1979. Commun. Earth Environ. 2022, 3, 168. [Google Scholar] [CrossRef]
  30. You, Q.; Cai, Z.; Pepin, N.; Chen, D.; Ahrens, B.; Jiang, Z.; Wu, F.; Kang, S.; Zhang, R.; Wu, T.; et al. Warming amplification over the Arctic Pole and Third Pole: Trends, mechanisms and consequences. Earth-Sci. Rev. 2021, 217, 103625. [Google Scholar] [CrossRef]
  31. Stocker, T.F.; Qin, D.; Plattner, G.-K.; Tignor, M.; Allen, S.K.; Boschung, J.; Nauels, A.; Xia, Y.; Bex, V.; Midgley, P.M. Climate Change 2013: The Physical Science Basis. Contribution of Working Group I to the Fifth Assessment Report of the Intergovernmental Panel on Climate Change; Long-Term Climate Change: Projections, Commitments and Irreversibility; Cambridge University Press: Cambridge, UK; New York, NY, USA, 2013. [Google Scholar]
  32. Marshall, J.; Scott, J.R.; Armour, K.C.; Campin, J.M.; Kelley, M.; Romanou, A. The ocean’s role in the transient response of climate to abrupt greenhouse gas forcing. Clim. Dyn. 2015, 44, 2287–2299. [Google Scholar] [CrossRef] [Green Version]
  33. Smith, D.M.; Screen, J.A.; Deser, C.; Cohen, J.; Fyfe, J.C.; Garcia-Serrano, J.; Jung, T.; Kattsov, V.; Matei, D.; Msadek, R.; et al. The Polar Amplification Model Intercomparison Project (PAMIP) contribution to CMIP6: Investigating the causes and consequences of polar amplification. Geosci. Model. Dev. 2019, 12, 1139–1164. [Google Scholar] [CrossRef] [Green Version]
  34. Hahn, L.C.; Armour, K.C.; Zelinka, M.D.; Bitz, C.M.; Donohoe, A. Contributions to Polar Amplification in CMIP5 and CMIP6 Models. Front. Earth Sci. 2021, 9, 710036. [Google Scholar] [CrossRef]
  35. Xie, A.; Zhu, J.; Kang, S.; Qin, X.; Xu, B.; Wang, Y. Polar amplification comparison among Earth’s three poles under different socioeconomic scenarios from CMIP6 surface air temperature. Sci. Rep. 2022, 12, 16548. [Google Scholar] [CrossRef] [PubMed]
  36. Zhu, J.; Xie, A.; Qin, X.; Wang, Y.; Xu, B.; Wang, Y. An Assessment of ERA5 Reanalysis for Antarctic Near-Surface Air Temperature. Atmos 2021, 12, 217. [Google Scholar] [CrossRef]
  37. Wang, S.M.; Xie, A.H.; Zhu, J.P. Does polar amplification exist in Antarctic surface during the recent four decades? J. Mt. Sci. 2021, 18, 2626–2634. [Google Scholar] [CrossRef]
  38. Zhu, J.; Xie, A.; Qin, X.; Xu, B.; Wang, Y. Assessment of Antarctic Amplification Based on a Reconstruction of Near-Surface Air Temperature. Atmosphere 2023, 14, 218. [Google Scholar] [CrossRef]
  39. Masson-Delmotte, V.; Zhai, P.; Pirani, A.; Connors, S.L.; Péan, C.; Berger, S.; Caud, N.; Chen, Y.; Goldfarb, L.; Gomis, M.I. (Eds.) IPCC, 2021: Climate Change 2021: The Physical Science Basis. Contribution of Working Group I to the Sixth Assessment Report of the Intergovernmental Panel on Climate Change; Cambridge University Press: Cambridge, UK, 2021; in press. [Google Scholar]
  40. Yang, Y.Z.; Cai, W.H.; Yang, J. Evaluation of MODIS Land Surface Temperature Data to Estimate Near-Surface Air Temperature in Northeast China. Remote Sens. 2017, 9, 410. [Google Scholar] [CrossRef] [Green Version]
  41. Li, L.; Zha, Y. Estimating monthly average temperature by remote sensing in China. Adv. Space Res. 2019, 63, 2345–2357. [Google Scholar] [CrossRef]
  42. Zhu, W.B.; Lu, A.F.; Jia, S.F. Estimation of daily maximum and minimum air temperature using MODIS land surface temperature products. Remote Sens. Environ. 2013, 130, 62–73. [Google Scholar] [CrossRef]
  43. Reinart, A.; Reinhold, M. Mapping surface temperature in large lakes with MODIS data. Remote Sens. Environ. 2008, 112, 603–611. [Google Scholar] [CrossRef]
  44. Fréville, H.; Brun, E.; Picard, G.; Tatarinova, N.; Arnaud, L.; Lanconelli, C.; Reijmer, C.; van den Broeke, M. Using MODIS land surface temperatures and the Crocus snow model to understand the warm bias of ERA-Interim reanalyses at the surface in Antarctica. Cryosphere 2014, 8, 1623. [Google Scholar] [CrossRef] [Green Version]
  45. Wang, Y.; Zhang, X.; Ning, W.; Lazzara, M.A.; Ding, M.; Reijmer, C.H.; Smeets, P.C.J.P.; Grigioni, P.; Heil, P.; Thomas, E.R.; et al. The AntAWS dataset: A compilation of Antarctic automatic weather station observations. Earth Syst. Sci. Data 2023, 15, 411–429. [Google Scholar] [CrossRef]
  46. Hind, A.; Zhang, Q.; Brattstrom, G. Problems encountered when defining Arctic amplification as a ratio. Sci. Rep. 2016, 6, 30469. [Google Scholar] [CrossRef] [PubMed]
  47. Wang, Y.; Huang, F.; Fan, T. Spatio-temporal variations of Arctic amplification and their linkage with the Arctic oscillation. Acta Oceanol. Sin. 2017, 36, 42–51. [Google Scholar] [CrossRef]
  48. Fang, M.; Li, X.; Chen, H.W.; Chen, D. Arctic amplification modulated by Atlantic Multidecadal Oscillation and greenhouse forcing on multidecadal to century scales. Nat. Commun. 2022, 13, 1865. [Google Scholar] [CrossRef]
  49. Pietroni, I.; Argentini, S.; Petenko, I. One Year of Surface-Based Temperature Inversions at Dome C, Antarctica. Bound.-Layer Meteorol. 2014, 150, 131–151. [Google Scholar] [CrossRef] [Green Version]
  50. Parish, T.R.; Bromwich, D.H. Instrumented aircraft observations of the katabatic wind regime near Terra Nova Bay. Mon. Weather Rev. 1989, 117, 1570–1585. [Google Scholar] [CrossRef]
  51. Bromwich, D.H.; Carrasco, J.F.; Stearns, C.R. Satellite observations of katabatic-wind propagation for great distances across the Ross Ice Shelf. Mon. Weather Rev. 1992, 120, 1940–1949. [Google Scholar] [CrossRef]
  52. Vihma, T.; Tuovinen, E.; Savijärvi, H. Interaction of katabatic winds and near-surface temperatures in the Antarctic. J. Geophys. Res. 2011, 116, D21119. [Google Scholar] [CrossRef]
  53. Zhang, X.Y.; Dong, X.; Zeng, J.; Hou, S.G.; Smeets, P.C.J.P.; Reijmer, C.H.; Wang, Y.T. Spatiotemporal Reconstruction of Antarctic Near-Surface Air Temperature from MODIS Observations. J. Clim. 2022, 35, 5537–5553. [Google Scholar] [CrossRef]
  54. Turner, J.; Marshall, G.J.; Clem, K.; Colwell, S.; Phillips, T.; Lu, H. Antarctic temperature variability and change from station data. Int. J. Climatol. 2020, 40, 2986–3007. [Google Scholar] [CrossRef] [Green Version]
  55. Nicolas, J.P.; Bromwich, D.H. New Reconstruction of Antarctic Near-Surface Temperatures: Multidecadal Trends and Reliability of Global Reanalyses. J. Clim. 2014, 27, 8070–8093. [Google Scholar] [CrossRef]
  56. Cohen, J.; Screen, J.A.; Furtado, J.C.; Barlow, M.; Whittleston, D.; Coumou, D.; Francis, J.; Dethloff, K.; Entekhabi, D.; Overland, J.; et al. Recent Arctic amplification and extreme mid-latitude weather. Nat. Geosci. 2014, 7, 627–637. [Google Scholar] [CrossRef] [Green Version]
  57. Dai, H. Roles of Surface Albedo, Surface Temperature and Carbon Dioxide in the Seasonal Variation of Arctic Amplification. Geophys. Res. Lett. 2021, 48, e2020GL090301. [Google Scholar] [CrossRef]
  58. Singh, H.A.; Garuba, O.A.; Rasch, P.J. How Asymmetries Between Arctic and Antarctic Climate Sensitivity Are Modified by the Ocean. Geophys. Res. Lett. 2018, 45, 13031–13040. [Google Scholar] [CrossRef] [Green Version]
  59. Winton, M. Amplified Arctic climate change: What does surface albedo feedback have to do with it? Geophys. Res. Lett. 2006, 33, L03701. [Google Scholar] [CrossRef] [Green Version]
  60. Spielhagen, R.F.; Werner, K.; Sorensen, S.A.; Zamelczyk, K.; Kandiano, E.; Budeus, G.; Husum, K.; Marchitto, T.M.; Hald, M. Enhanced Modern Heat Transfer to the Arctic by Warm Atlantic Water. Science 2011, 331, 450–453. [Google Scholar] [CrossRef] [Green Version]
  61. Screen, J.A.; Deser, C.; Simmonds, I. Local and remote controls on observed Arctic warming. Geophys. Res. Lett. 2012, 39, L10709. [Google Scholar] [CrossRef] [Green Version]
Figure 1. The location and topographic map of the Antarctic Ice Sheet.
Remotesensing 15 03540 g001
Figure 2. Spatial distribution of 128 stations cited in the text. Note that the numbers refer to the lists in Table S1.
Remotesensing 15 03540 g002
Figure 3. Correlation coefficients and bias of monthly surface temperature simulation for 128 stations from MODIS observations and ERA5. Note: the correlation coefficients are all significant at the 95% confidence interval.
Remotesensing 15 03540 g003
Figure 4. Comparisons between station time series and MODIS at four selected stations located in the East Antarctica coast, the interior of East Antarctica, West Antarctica and the Antarctic Peninsula.
Remotesensing 15 03540 g004
Figure 5. The mean annual and seasonal temperature anomalies for surface temperature based on ERA5 (solid line) and MODIS land surface temperatures (dotted line), spatially averaged over Antarctica, and the sub regions of East Antarctica, West Antarctica and the Antarctic Peninsula, and the Southern Hemisphere, respectively. The seasonal scale is for austral seasons of spring (SON, September–November), summer (DJF, December–February), autumn (MAM, March–May), and winter (JJA, June–August), respectively.
Remotesensing 15 03540 g005
Figure 6. The distribution of temperature trend (°C per decade) over Antarctica for annual, austral spring (SON, September–November), summer (DJF, December–February), autumn (MAM, March–May) and winter (JJA, June–August) mean from ERA5 (left panel) and MODIS land surface temperatures (right panel), respectively. The gray shaded areas with trends significant at the 95% confidence level.
Remotesensing 15 03540 g006
Figure 7. The distribution of correlation coefficients between the ERA5 and MODIS temperatures over Antarctica for annual, austral spring (SON, September–November), summer (DJF, December–February), autumn (MAM, March–May) and winter (JJA, June–August). The gray stippling shows the regions that fail to pass the 95% significant confidence test.
Remotesensing 15 03540 g007
Figure 8. The correlation coefficients in the mean SAM indices and the corresponding near-surface temperatures over the Antarctic Ice Sheet (AIS), East Antarctic Ice Sheet (EAIS), West Antarctic Ice Sheet (WAIS) and Antarctic Peninsula (AP), for annual, austral spring (SON, September–November), summer (DJF, December–February), autumn (MAM, March–May) and winter (JJA, June–August) mean from ERA5 and MODIS observations. All the correlation coefficients are significant at the 95% confidence level.
Remotesensing 15 03540 g008
Figure 9. The distribution of annual correlation coefficients between the following variables—surface downward longwave radiation (sdlr), total column ozone (tco), specific-humidity at 850 hPa (q), total cloud cover (tcc) and cloud base height (cbh)—and the temperature over Antarctica. The gray stippling shows the regions that fail to pass the 95% significant confidence test.
Remotesensing 15 03540 g009
Figure 10. Spatial patterns of amplification index over Antarctica for annual, austral spring (SON, September–November), summer (DJF, December–February), autumn (MAM, March–May) and winter (JJA, June–August) mean from ERA5 and the MODIS, and the amplification index from 128 stations compared with ERA5 and the MODIS, respectively.
Remotesensing 15 03540 g010
Figure 11. Annual Antarctic amplification index with differing start years and interval lengths from ERA5 and MODIS observations.
Remotesensing 15 03540 g011
Figure 12. Surface air temperature including ocean and land regions, and for land only (°C per decade) trends of zonal average in different latitudes based on ERA5 during 2001–2018 in the Southern Hemisphere for annual and austral spring (SON, September–November), summer (DJF, December–February), autumn (MAM, March–May) and winter (JJA, June–August), respectively.
Remotesensing 15 03540 g012
Figure 13. Similar to Figure 10, but for the amplification index in ERA5 based on the Southern Hemisphere including both ocean and land regions, and the amplification index from 128 stations compared with ERA5.
Remotesensing 15 03540 g013
Table 1. Amplification index of annual and seasonal temperatures in the Antarctic Ice Sheet (AIS), and the sub regions of the East Antarctic Ice Sheet (EAIS), West Antarctic Ice Sheet (WAIS) and Antarctic Peninsula (AP) from MODIS and ERA5 land surface temperatures.
MODIS
AnnualSONDJFMAMJJA
AIS1.411.371.271.361.53
EAIS1.581.661.451.491.61
WAIS1.120.850.921.161.42
AP0.12−0.790.12−0.050.47
ERA5
AIS1.311.341.321.321.46
EAIS1.531.721.631.481.64
WAIS0.980.760.821.101.23
AP−0.59−1.40−0.24−0.28−0.42
Table 2. Similar to Table 1, but for MODIS daytime and nighttime observations.
Daytime Observations
AnnualSONDJFMAMJJA
AIS1.351.311.311.331.52
EAIS1.511.561.471.471.59
WAIS1.090.861.001.101.42
AP0.12−0.610.18−0.030.37
nighttime observations
AIS1.441.431.321.391.55
EAIS1.621.761.541.511.63
WAIS1.130.830.901.201.43
AP0.11−0.940.06−0.080.56
Disclaimer/Publisher’s Note: The statements, opinions and data contained in all publications are solely those of the individual author(s) and contributor(s) and not of MDPI and/or the editor(s). MDPI and/or the editor(s) disclaim responsibility for any injury to people or property resulting from any ideas, methods, instructions or products referred to in the content.

