Abstract
Solar photovoltaic panels (PV) provide great potential to reduce greenhouse gas emissions as a renewable energy technology. The number of solar PV has increased significantly in recent years and is expected to increase even further. Therefore, accurate and global mapping and monitoring of PV modules with remote sensing methods is important for predicting energy production potentials, revealing socio-economic drivers, supporting urban planning, and estimating ecological impacts. Hyperspectral imagery provides crucial information to identify PV modules based on their physical absorption and reflection properties. This study investigated spectral signatures of spaceborne PRISMA data of 30 m low resolution for the first time, as well as airborne AVIRIS-NG data of 5.3 m medium resolution for the detection of solar PV. The study region is located around Irlbach in southern Germany. A physics-based approach using the spectral indices nHI, NSPI, aVNIR, PEP, and VPEP was used for the classification of the hyperspectral images. By validation with a solar PV ground truth dataset of the study area, a user’s accuracy of 70.53% and a producer’s accuracy of 88.06% for the PRISMA hyperspectral data, and a user’s accuracy of 65.94% and a producer’s accuracy of 82.77% for AVIRIS-NG were achieved.
1. Introduction
In light of climate change and the need for reducing greenhouse gas emissions, a global increasing demand of energy seems challenging. Renewable energies such as solar photovoltaic (PV) provide a promising means toward a climate friendly future. The International Energy Agency (IEA) expects that renewable energy capacities will grow by about 50% between 2019 and 2024 worldwide. The biggest growth potential of almost 60% of the predicted growth is seen in solar PV [1] as the costs for solar panels are comparatively low and they have a low environmental impact [2]. The expansion of solar PV renewable energies is led by the European Union, India, and Vietnam [1].
Many stakeholders in the energy sector, e.g., grid operators, manufacturing industries, energy system modelers, and environmental authorities [3] as well as market and network operators are dependent on precise information of PV locations, distribution, power capacity, and energy production potential [4]. Knowledge about the distribution of PV plants is fundamental for estimating the social and ecological impact, i.e., impacts on biodiversity, local climate, air temperature, energy balance, energy access, and affordability [5,6] as well as water availability and soil degradation [7]. Information about the distribution and location of PV plants is also used in urban planning [8] and environmental monitoring [9]. Moreover, a comprehensive and up-to-date database would help monitoring progress towards a more sustainable future linking to the Sustainable Development Goals (SDGs) of Affordable and Clean Energy and Climate Action as well as Life on Land for determining impacts of PV installations on biodiversity [6]. Furthermore, socioeconomic drivers of renewable energy infrastructure on a global perspective are of interest to estimate future energy development and power plant distribution [10]. However, continuous and up-to-date large-scale global monitoring systems of PV plant locations and power capacities yet do not exist [11].
Acquiring in situ data by field observations or citizen surveys is often expensive and very time consuming [4]. In Germany, every stakeholder in the electricity and gas market has been obliged to register him-/herself and their installations at the so called core energy market data register (www.marktstammdatenregister.de) since 31 January 2019. This shall ensure an up-to-date and comprehensive database throughout Germany [12]. Yet, these methods are usually limited to state or national level [4]. Remote sensing on the other hand allows spatially precise monitoring of land cover change on a large scale [5]. Especially spaceborne satellite remote sensing images offer numerous benefits, including rapid data acquisition, frequent updates, and independence from ground conditions [9]. Therefore, a lot of potential and a new research field is seen in the large-scale monitoring of PV modules through remote sensing data [13]. Nevertheless, there are still a lot of open research questions and challenges regarding the identification of solar PV modules in space- or airborne imagery [14].
Two popular approaches to identify PV modules in space- or airborne imagery data exist. One method for solar PV module detection is the physics-based approach.
Solar radiation interacts differently with each of earth’s surfaces (land, water, atmosphere) [15]. Each surface material has its unique spectral signature that is provided in imagery spectroscopy data [16]. Knowing these spectral characteristics of different materials allows the reconstruction from measured reflectance values [17]. To identify, e.g., PV modules in imaging spectroscopy data, the material specific absorption characteristics can be replicated through different indices [3]. Czirjak [18] found that solar panels share a similar spectral signature allowing for detection, regardless of the manufacturer or construction of the modules. Imaging spectroscopy, or hyperspectral imaging (HSI), measures reflectance in the 400 to 2500 nm range which, combined with the knowledge of surface and atmosphere characteristics, provides valuable knowledge for various earth science investigations [15]. Compared to multispectral imaging (MSI) sensors, HSI spectrometers provide a much better spectral resolution as they measure a complete spectrum for every image point (pixel) [17]. While multispectral sensors usually collect data for five to ten discrete bands, each 50 to 400 nm wide, hyperspectral sensors measure the complete spectral fingerprint existing of hundreds of bands, continuously measured with a relatively narrow bandwidth of 1 to 15 nm [19].
PV modules are usually made of a transparent glass cover that protects the modules combined with a highly transparent and thin layer of Ethylene Vinyl Acetate (EVA) next to the core PV cell. EVA is a hydrocarbon-bearing material that can be indicated by its typical high absorption at 1730 nm. PV cells are often made of crystalline silicon (C-Si). This material causes low reflectance values in the visible range (VIS). Additionally, a steep reflectance increase between 990 nm and 1150 nm is typical for C-Si materials. Furthermore, a strong absorption around 2200 nm is characteristic of spectral signatures of PV modules [3]. Since many other hydrocarbon-bearing materials, such as polyethylene, cover open surfaces (e.g., agriculture foil on fields), roofing polyethylene, and synthetic turf on sports fields have similar absorption properties to PV modules (especially in the 1730 nm region); a high inter-class similarity is found [3,20,21]. Moreover, PV modules show intra-class variability due to different colors, coating, age and degradation, illumination of the material (tilt angles of PV modules, exposition, sun position), and data pre-processing [3,13].
Due to the rather low spatial resolution of current space- and airborne hyperspectral sensors, data contain mostly mixed pixels of several pure materials (endmembers) [22]. Caused by the spectral similarity of the various materials, high-resolution imagery (ideally <0.3 m spatial resolution) is required [4,14].
Hyperspectral indices provide a robust method to learn more about the interaction of certain surfaces with electromagnetic radiation. The knowledge gained from spectral indices can be used, e.g., to derive requirements for future satellite missions regarding wavelengths, resolution, etc. When these missions exist and more knowledge is gained about spectral responses of PV modules around the world, enough data for data-intensive machine learning algorithms can be obtained.
The second approach to identify PV modules is using machine learning methods. For machine learning algorithms, a large number of elaborated and pixel-accurate labeled data samples that can be used for training and validation is necessary to ensure a good generalization. Moreover, computational efficiency has to be secured which can be challenging especially in the case of fully supervised segmentation. Yu et al. [11] developed a convolutional neural network (CNN) for the PV detection task within the DeepSolar project in 2018. They identified images containing positive samples with a CNN-based image classification on satellite images acquired from Google Static Maps with a spatial resolution of less than 30 cm. In a next step, they applied a semi-supervised segmentation that identifies system counts and panel sizes on the positive images. This approach identified solar PV systems across the United States with a recall of 88.5% and a precision of 93.1% in residential areas, and a recall of 90.5% and precision of 93.7% in non-residential areas [11].
Other than that, there are approaches using pixel-based machine learning algorithms [23] or non-negative-matrix-factorization-based unmixing methods for detection and area estimation of PV modules [22,24].
To achieve large-scale and automated mapping, machine learning methods prove effective, if proper training data exist. However, their practicality is hindered by the high costs of data acquisition and computation. Therefore, it is important to find user-friendly and cost-effective approaches for detecting PV plants using freely available medium-resolution images [2]. Compared to the statistically machine learning approach, using physical spectral information does not require a huge amount of training samples. Using physical properties such as spectral signatures and proper derived indices enables this approach to use it to generate training data for machine learning, which is the great advantage of the physics-based approach.
Ji et al. [3] focused on the physical absorption and reflection characteristics of PV modules using laboratory spectra and airborne high and medium resolution data (0.6 m and 1.2 m per pixel). Until now, no study used spaceborne hyperspectral data and/or data with a low spatial resolution (30 m) for the detection of PV modules. By calculating and optimizing five common spectral indices based on the physical characteristics of PV modules and corresponding spectral features, solar panels were detected in this study by spaceborne hyperspectral remote sensing data for the first time. Moreover, PV detection in the study area has not been performed before.
The objectives of this study are therefore to detect PV modules with a physics-based approach using:
- Spaceborne HSI data acquired by the Hyperspectral Precursor of the Application Mission (PRISMA) satellite with 30 m resolution
- Airborne HSI data acquired by the Airborne Visible InfraRed Imaging Spectrometer–Next Generation (AVIRIS-NG) with 5.3 m resolution
- Focus on solar PV plants with more than 10 kWp
2. Materials and Methods
The methodological approach of this study is summarized in the following Figure 1.
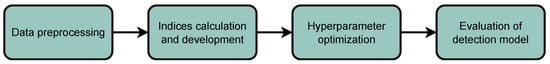
Figure 1.
Workflow of the methodological approach of this study.
2.1. Study Area
The study area covers a region around Irlbach in the south-east of Germany (Figure 2). The entire area extents from about 48.7726 to 48.9012N and 12.5987 to 12.8087E and thus covers approximately 215 km. Most of the land surface is covered by agricultural fields besides some small urban areas and forests. The Danube river crosses the north-eastern parts of the study area. Numerous roof top PV modules as well as several large scale PV power plants—mainly on grassland—can be found all over the study area.
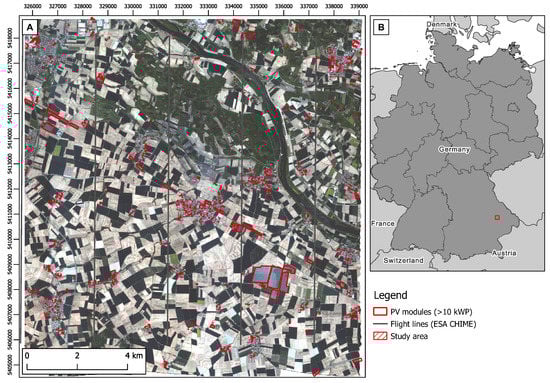
Figure 2.
Map of the study area showing (A) the airborne HSI data of AVIRIS-NG acquired as part of ESA CHIME mission preparations on 30 May 2021, including the flight lines. The HSI data are shown in true color. Ground truth data of solar PV modules with more than 10 kWp are shown on the map (Source: Bavarian Agency for the Environment, Energie-Atlas Bayern: Photovoltaikanlagen-WMS). (B) provides an overview of the study area in Bavaria, south-east Germany.
2.2. AVIRIS-NG Data and Preprocessing
To identify solar PV surfaces, AVIRIS-NG (Airborne Visible InfraRed Imaging Spectrometer–Next Generation) data were used. The airborne hyperspectral data were acquired on 30th May 2021 as part of the ESA’s Copernicus Hyperspectral Imaging Mission for the Environment mission (CHIME) preparation [25]. The data were downloaded from https://ares-observatory.ch/esa_chime_mission_2021/ (accessed on 14 November 2022).
The AVIRIS-NG is a nadir viewing push-broom scanner [26] with a high signal-to-noise ratio (SNR) of >2000 at 600 nm and >1000 at 2200 nm [19]. With an accuracy of 95% [19], the scanner was built for high performance spectroscopy [27].
The measurement flight over Irlbach provided spectral reflectance information about the earth’s surface within the spectral range of 377 to 2510 nm divided in 425 bands. This implies a spectral sampling frequency of ±5 nm (Figure 3). The ground sampling distance (GSD) within the Irlbach flight campaign was about 5.3 m [25].
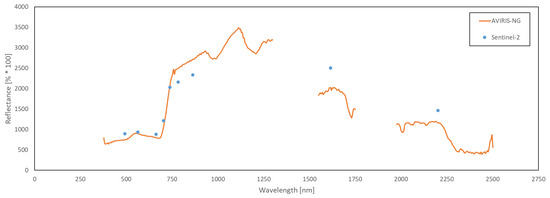
Figure 3.
Spectral signature of polycrystalline solar PV modules from hyperspectral AVIRIS-NG (orange line) and multispectral Sentinel-2 (blue dots) data. While the AVIRIS-NG covers the spectrum from 377 to 2500 nm with a spectral resolution of 5 nm, the nine bands of Sentinel-2 range from 492 to 2202 nm.
Data-preprocessing was performed and saturated atmospheric water vapor reflections were removed, assuming a spatially invariant atmosphere [19]. Since different spectral ranges have to be removed, depending on the actual atmospheric conditions during data acquisition [28], the AVIRIS-NG bands 186 to 234 (1299 to 1549 nm) and 276 to 319 (1750 to 1974 nm) were removed based on the atmospheric distortion by water vapor in water pixels (Figure 3). Pure water surfaces absorb solar radiation in the SWIR and therefore are not expected to show any reflections in this range.
2.3. PRISMA Data and Preprocessing
Hyperspectral Precursor of the Application Mission (PRISMA) is a HSI satellite, equipped with a pushbroom scanner, delivering low resolution images of 30 × 30 m [29]. PRISMA was developed, owned, and controlled by the Agenzia Spaziale Italiana (ASI) and was launched on March 22nd, 2019. It was brought in a sun-synchronous orbit at 615 km altitude, has an inclination of 98.19, and is at 1030 h of local time on descending node. The mission is set for five years. PRISMA is built with two sensors: a panchromatic camera module (PAN) and hyperspectral camera module (HYC). With 237 bands in total, the visible and near infrared (VNIR) from 400 to 1010 nm, the near infrared (NIR) up to 1400 nm, and shortwave infrared (SWIR) up to 2505 nm are measured. In total, 66 bands cover the VIS/NIR with a spectral resolution of ±9 nm and 171 bands are allocated to NIR/SWIR with a spectral resolution ±9 nm. The HYC has a GSD of 30 m [29]. PRISMA data were acquired on 23 March 2022 and provided by the ASI. Noise in the spectral signature caused by saturated atmospheric water vapor was removed and validated analogous to the AVIRIS-NG data. Since there are known issues regarding the orthorectification of the PRISMA data [30], a geometric correction using ground control points (GCPs) and second order polynomial transformation had to be performed.
2.4. PV Ground Truth Data
For model validation and parameter optimization, ground truth data of solar PV modules were used. Information on PV module locations were taken from the Energy Atlas of Bavaria service provided by the Bavarian Agency for the Environment. The service shows all Bavarian PV modules that received financial support under the Renewable Engery Resources Act (EEG) as point data and is available as WMS (https://www.lfu.bayern.de/gdi/wms/energieatlas/photovoltaikanlagen? (accessed on 14 November 2022)). The size of PV modules varies greatly. Only data of solar PV plants and roofing modules with a power of more than 10 kWp were used for this study and digitized as polygon. The minimum output of 10 kWp was chosen—assuming an output of 0.2 kWp per m [31] and considering the spatial resolution of the AVIRIS-NG data of 5.3 × 5.3 m multiplied by two—to ensure a minimum of two pixel per ground truth PV which corresponds to installations of more than 50 m. Some additional PV modules were found and added by visual assessment. All relevant polygons (PV plants) within the study area were filtered and extracted to a ground truth shape layer. For AVIRIS-NG, the shape layer was converted to a 5.3 × 5.3 m raster layer with gdal using the centrum-overlapping method. Rasterization for PRISMA was different due to the coarser resolution of 30 × 30 m. In a first step, the polygon layer was rastered to a 1 × 1 m resolution with gdal using the centrum-overlapping method. In a second step, the fine raster was transformed to a 30 m resolution by assigning the proportion of 1 m PV pixel within the 30 m pixel. Afterwards, only 30 m pixels with a minimum of 50% overlapping area with the PV modules were assigned to a valid ground truth pixel to ensure a minimum of 50% spectral influence of PV modules within each such positive ground truth pixel. This approach lasts in PV plants with a power greater than 180 kWp as ground truth for the PRISMA data. The resulting raster layers are of Boolean data type with zeros for no PV and one for PV pixel. The raster data provide the ground truth for the quantitative evaluation of the optimum threshold combinations for AVIRIS-NG and PRISMA, respectively.
2.5. Indices
For detection of PV modules in the study area, a spectral indices-based approach was conducted using the HSI data. By finding proper thresholds for each index, PV modules were classified by logical AND operation of all indices. A first overview of the considered indices is given in Figure 4, while the indices are explained in detail in the following subsections.
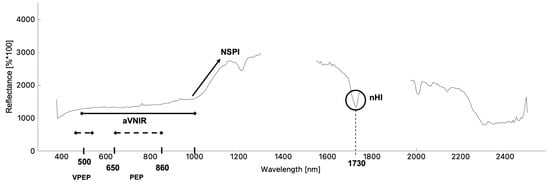
Figure 4.
Overview of the five spectral indices nHI, NSPI, aVNIR, PEP, and VPEP that have been calculated to see their applicability to detect PV modules in airborne and spaceborne data with a spatial resolution of 5.3 m (AVIRIS) and 30 m (PRISMA) per pixel. The presented PV spectrum origins from PV modules installed on top of an industrial building and was acquired with AVIRIS-NG.
2.5.1. Normalized Hydrocarbon Index (nHI)
The hydrocarbon index (HI) [32] describes the characteristic hydrocarbon absorption in the SWIR around 1730 nm, which was first found by Cloutis [33]. The reflectance drop at 1730 nm is caused by several C-H stretching overtones and combination bands [33]. Ji et al. [3] criticized that the HI does not consider the spectral variation (intra-class variability) of PV modules. Based on a finding of Clark and Roush [34] that topographic and atmospheric effects could be reduced by calculating band depth assuming a spectral continuum, Ji et al. [3] applied this approach on the HI in order to minimize the influence of different detection angles and expositions. For calculating the normalized HI (nHI) developed by Ji et al. [3], the band depth of each channel is divided by the reflectance R at the respective band center as well as the spectral shoulders:
where
For this study, the shoulders A and C were found at 1689 nm and 1745 nm, respectively, while the center B was set at 1728 nm.
2.5.2. Normalized Solar Panel Index (NSPI)
About 90% of all installed solar PV modules are built from crystalline silicon (C-Si) solar cells [35]. Poly-C-Si and mono-C-Si both are materials which can be indicated by their decreasing energy absorption feature from 600 to 1150 nm [36,37]. The Normalized Solar Panel Index (NSPI) reflects the rapid increase in reflectance from about 1000 nm and is another spectral key feature of solar panels with a silicon solar cell [3]. The index was first used by Czirjak [18] in 2017 and is calculated as follows (Equation (3)):
2.5.3. Index of Average Reflectance in VNIR (aVNIR)
Most PV modules are built blackish or dark bluish for maximum absorption of solar energy in the VNIR region (500–1000 nm) [18]. Ji et al. [3] calculated the average reflectance in VNIR (aVNIR) index, which takes into account these characteristics and served mainly for the elimination of roofing polyethylene. The aVNIR index addresses the low average reflectance of PV modules in the VNIR range (Equation (4)):
with n representing the number of bands between 500 and 1000 nm.
2.5.4. PolyEthylene Peak (PEP) and PolyEthylene Peak in Visible Range (VPEP)
The PolyEthylene Peak (PEP) and PolyEthylene Peak in Visible range (VPEP) indices [3] can be used to distinguish between PV modules and polyethylene surfaces (PEP) (Equation (5)) and synthetic turf (VPEP) (Equation (6)). The spectral characteristics PEP and VPEP are targeting the strong spectral absorption of polyethylene surfaces in the spectral range of 800 to 900 nm which leads to a reflectance peak between 650 and 860 nm of polyethylene surfaces but not for PV modules. The idea behind VPEP is that artificial playgrounds are usually green and artificial running tracks usually are red while PV modules are dark bluish or black. Therefore, synthetic turf shows high reflectance in VIS green and red while PV modules do not show this characteristic in reflectance [3].
2.6. Accuracy Metrics
The indices described in Section 2.2 can be classified into two groups: (1) PV detection indices such as so nHI, NSPI and (2) indices excluding other surface materials such as aVNIR, PEP, and VPEP. All indices represent physical properties of the measured surface materials, thus splitting data into training and test data to evaluate over-fitting was not necessary. To measure the accuracy of the detection model and validate its performance, the confusion matrix was utilized for the binary classification of positive “PV” class and negative “no PV” class. The accuracy metrics producer’s accuracy () or recall, user’s accuracy () or precision, specificity (S), overall accuracy (), and -score were applied:
where are the true positive, the true negative, FP the false positive, and the false negative pixel-wise classifications.
While the describes the probability of a PV surface being classified as such, the is the probability of a classified PV being an actual PV class. The represents the harmonic mean of and .
2.7. Threshold Classification Model & Hyperparameter Optimization
The classification is based on individual thresholds for each index with an AND operation to combine the different indices. Thus, two classes (1 = ‘PV’ and 0 = ‘No PV’) were defined as: 1 (’PV’): ; 0 (’No PV’): , with the respective threshold of index (see Table 1). The classification was performed pixel-wise.

Table 1.
Hyperparameter (thresholds of indices) search intervals for the grid search approach.
Table 1 shows the grid search parameter of the thresholds hyperparameter tuning of the index-based classification model. After a qualitative trial and error with respect to the obtained thresholds of [3], the start, end, and step size values were determined to ensure the optimum value lying within the defined boundaries. For spaceborne PRISMA data and for airborne AVIRIS-NG data, 116,640 combinations and 35,280 combinations in total were tested, respectively. To find the optimal hyperparameters for the detection model, a systematic grid search of threshold combinations was performed using the -score accuracy metric for validating the performance of the indices combinations.
3. Results
3.1. Solar PV Detection Using AVIRIS-NG
Best classification results in terms of -score for the solar PV module detection with AVIRIS-NG data were achieved for the following hyperparameters by grid search: , , , , and . Classification of the entire dataset took about 0.0615 s for the optimal hyperparameters. Figure 5 shows the results of the detection meeting the above conditions of all five indices. In addition to the large PV plants, roofing PV modules were also partly detected. The detail map (C) in Figure 5 contains two PV plants which could not be detected, probably due to different materials or surrounding (vital) vegetation and fields influences, since the thresholds for nHI and NSPI were set low to ensure including most of the PV pixels. The thresholds were optimized to also detect the sun reflection pixels in the middle of the solar park in Gänsdorf, the biggest solar park in study area (Figure 1).
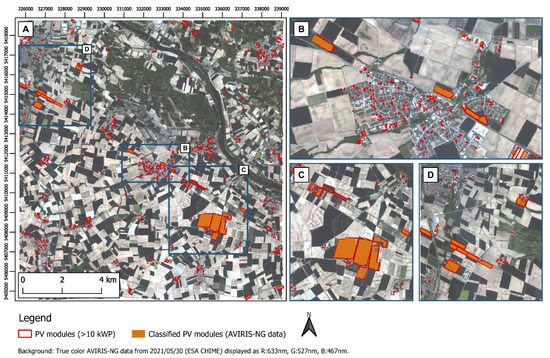
Figure 5.
Classification results for the airborne HSI data of AVIRIS-NG acquired as part of ESA CHIME mission preparations on 30 May 2021. The HSI data are shown in true color for the entire study area (A), as well as for three details of the map (B–D). Ground truth data of solar PV modules with more than 10 kWp (Source: Bavarian Agency for the Environment, Energie-Atlas Bayern: Photovoltaikanlagen-WMS) are shown on the map.
Table 2 summarizes the optimal classification results in terms of the accuracy metrics. A maximum -score of 73.40%, resulting from a user’s accuracy of 65.94% and a producer’s accuracy of 82.77%, was achieved. A higher producer’s accuracy can be explained by the unbalanced classes in the dataset, since much more none-PV pixel exist than PV pixel.
Table 2.
Optimal results of index-based classification using AVIRIS-NG and PRISMA data.
Figure 6 shows the isolated contribution of the nHI to the detection of solar PV parks, and roofing modules. As can be seen, the information provided by the nHI are crucial for detecting solar PVs. While most of the PV pixel show nHI values around 0.15 to 0.2, the threshold was set to 0.06 to include the sun reflections in the middle of the solar PV park in Gänsdorf (Figure 6C). The two solar PV parks at the northern boundary of the study area were not detected by the nHI, probably due to strong vegetation influences to the spectral mixture. A lot of false positives can be obtained within the Danube river.
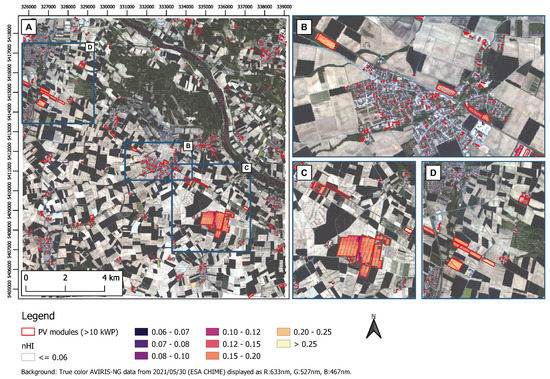
Figure 6.
nHI calculated from the AVIRIS-NG data acquired on 30 May 2021 for the entire study area (A), as well as for three details of the map (B–D) with the solar PV park Gänsdorf in detail map (C). Solar PV modules with more than 10 kWp (Source: Bavarian Agency for the Environment, Energie-Atlas Bayern: Photovoltaikanlagen-WMS) are shown.
An isolated analysis of the contribution of the NSPI is shown in Figure 7. Although most areas of the large PV parks showed values between 0.8 and 0.15, the optimal threshold was set to 0.01 to include all pixel of the modules. Depending on the type of PV module, the threshold must be relatively low (about 0.01) to detect the material (Figure 7D). Agricultural fields of bare soil were also included by the NSPI threshold, while vital vegetation, forest, and water bodies (Danube river) were excluded.
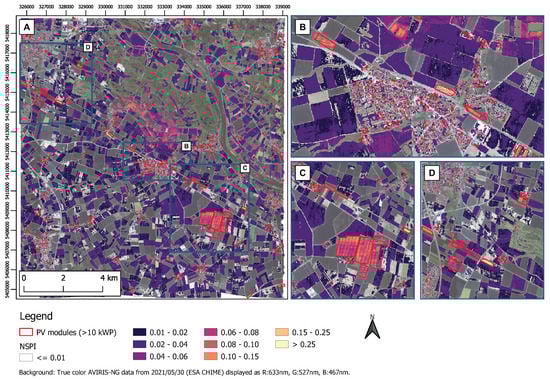
Figure 7.
NSPI calculated from the AVIRIS-NG data acquired on 30 May 2021 for the entire study area (A), as well as for three details of the map (B–D) with the solar PV park Gänsdorf in detail map (C). Solar PV modules with more than 10 kWp (Source: Bavarian Agency for the Environment, Energie-Atlas Bayern: Photovoltaikanlagen-WMS) are shown.
Figure 8 shows the isolated contributions of the parameter aVNIR, PEP, and VPEP. The aVNIR reflects the mean reflectance in the visible spectral range. Thus, bare soils and harvested fields as well as bright areas are excluded by the threshold of 2600. On the other hand, forests and the Danube river (water bodies) show the smallest aVNIR values (<1400). Therefore, an additional threshold of a lower limit for the aVNIR could help to exclude the respective land covers. The PEP does not contain crucial information since only very small areas were excluded by this index. The VPEP was able to distinguish agricultural plastic (plastic mulched farmland and plastic covered greenhouses) from the solar PV materials.
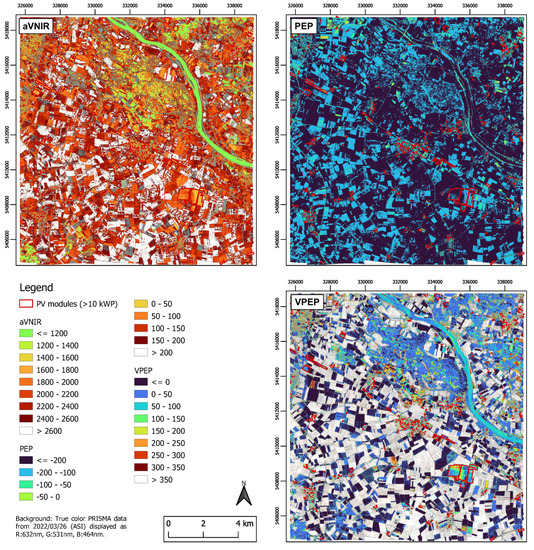
Figure 8.
aVNIR, PEP, and VPEP calculated from the AVIRIS-NG data acquired on 30 May 2021. Solar PV modules with more than 10 kWp (Source: Bavarian Agency for the Environment, Energie-Atlas Bayern: Photovoltaikanlagen-WMS) are shown.
3.2. Solar PV Detection Using PRISMA
The best classification results in terms of -score for the solar PV module detection with PRISMA data were achieved for the following hyperparameters by grid search: , , , , and . Classification of the entire dataset took about 2 s for the optimal hyperparameters. Figure 9 gives an overview of the performance results of the detection meeting the above conditions of all five indices. While large PV plants were detected, small roofing PV modules were not found by the 30 m resolution PRISMA data. Therefore, the filtering of the ground truth data for PV modules covering at least 50% of a PRISMA pixel proved to be valid. The detail map (C) in Figure 8 contains two PV plants which could not be detected, as was also found for the AVIRIS-NG data. In addition to the large PV plants, single smaller modules were also detected (Figure 9B).
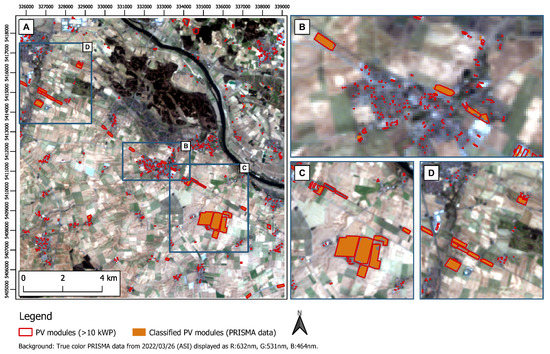
Figure 9.
Classification results for the spaceborne HSI data of PRISMA acquired from ASI on 26 March 2022 for the entire study area (A), as well as for three details of the map (B–D) with the solar PV park Gänsdorf in detail map (C). The HSI data are shown in true color. Ground truth data of solar PV modules with more than 10 kWp (Source: Bavarian Agency for the Environment, Energie-Atlas Bayern: Photovoltaikanlagen-WMS) are shown on the map. PRISMA Product-© Italian Space Agency (ASI) 2022. All rights reserved.
Table 2 shows the classification results of PRISMA compared to AVIRIS-NG. Surprisingly, the performance using PRISMA data was significantly better in terms of user’s and producer’s accuracy. A maximum -score of 78.33%, resulting from a user’s accuracy of 70.53% and a producer’s accuracy of 88.06%, was achieved with the PRISMA data. A higher producer’s accuracy can be explained analogously to the AVIRIS-NG data by the unbalanced classes in the dataset, since much more non-PV pixels exist than PV pixels.
As can be seen from Figure 10, the information provided by the nHI are crucial for detecting solar PVs. While most of the PV pixel show nHI values around 0.1 to 0.15, the threshold was set to 0.03 to include mixed pixel at the boundaries of the PV areas (B). Differences between the PV module surfaces can be seen from the difference of the nHI values in the center (less mixture of surrounding materials) of the panels in (C) and in (D) of Figure 10 with high and low nHI values, respectively.
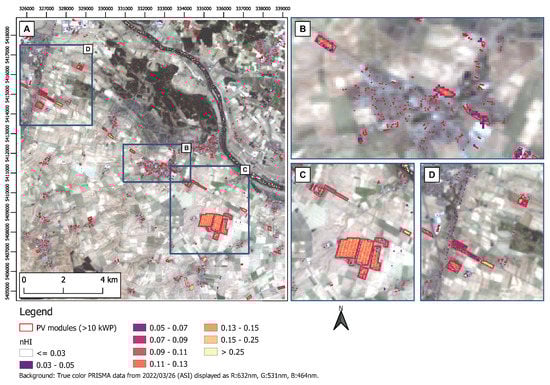
Figure 10.
nHI calculated from the PRISMA data acquired on 26 March 2022 for the entire study area (A), as well as for three details of the map (B–D) with the solar PV park Gänsdorf in detail map (C). Solar PV modules with more than 10 kWp (Source: Bavarian Agency for the Environment, Energie-Atlas Bayern: Photovoltaikanlagen-WMS) are shown. PRISMA Product-© Italian Space Agency (ASI) 2022. All rights reserved.
Similarly to the nHi, the NSPI was also tuned to a low threshold of 0.07 to include boundary pixel and various PV module materials or spectral mixtures (Figure 11). This leads to false positives in areas of forests with NSPI values up to 0.11. The Danube river showed a very high NSPI greater than 0.25. All of the large scale PV plants were sharply found by the applied NSPI threshold. Central pixels of the large scale PV plants showed NSPI values greater than 0.15.
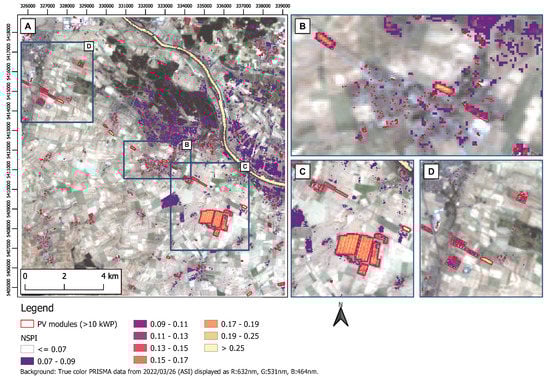
Figure 11.
NSPI calculated from the PRISMA data acquired on 26 March 2022 for the entire study area (A), as well as for three details of the map (B–D) with the solar PV park Gänsdorf in detail map (C). Solar PV modules with more than 10 kWp (Source: Bavarian Agency for the Environment, Energie-Atlas Bayern: Photovoltaikanlagen-WMS) are shown. PRISMA Product-© Italian Space Agency (ASI) 2022. All rights reserved.
In Figure 12 the isolated contributions of aVNIR, PEP, and VPEP are shown. While forests and the Danube river were indicated by low values under 1200, the large scale PV plants in the south-eastern part of the study area showed a homogeneous pattern with values ranging from 1400 to 1800. These land cover types may therefore be excluded by an additional lower limit. Bare soils and harvested fields were partly excluded by the threshold of 2600. Using the PEP with a lower limit of 100 and an upper limit of 1600 allowed for excluding water bodies, e.g., the Danube river (Figure 12). The VPEP showed an exclusion of agricultural fields and plasticulture of plastic mulched farmlands or plastic covered fields.
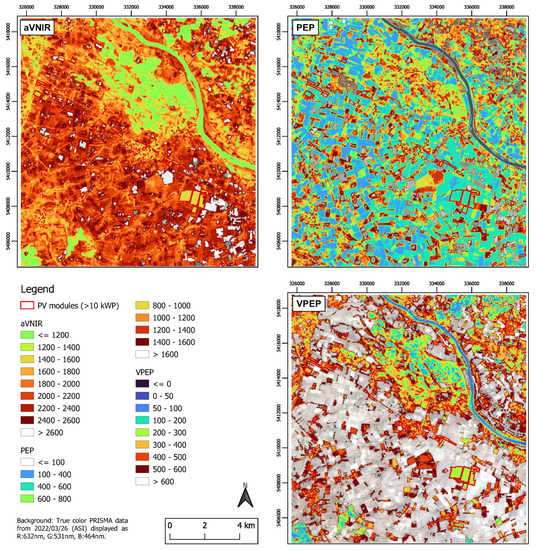
Figure 12.
aVNIR, PEP, and VPEP calculated from the PRISMA data acquired on 26 March 2022. Solar PV modules with more than 10 kWp (Source: Bavarian Agency for the Environment, Energie-Atlas Bayern: Photovoltaikanlagen-WMS) are shown. PRISMA Product-© Italian Space Agency (ASI) 2022. All rights reserved.
3.3. Qualitative Spectral Characteristics
The lower the spatial resolution of the HSI data, the higher the mixture of different surface materials with different reflectances within a pixel. These mixed spectral signals do not describe a single pure material rather than multiple materials surrounding the PV pixels. Bare soil, vegetation and grassland underneath and between solar panels, as well as the distance between the modules determine the obtained reflectances acquired from AVIRIS-NG and PRISMA.
Especially mixed pixels of solar parks and vital vegetation between the solar panels showed a dominant vegetation influence in the spectral signature of the AVIRIS-NG data, likely due to the significant increase in red edge. aVNIR and PEP use wavelength in the area around red edge (690 to 730 nm). By qualitative analysis of the mixed pixels, it was found that spectra of PV modules influenced by surrounding vegetation showed an S-curve between about 763 and 873 nm for AVIRIS-NG, while pure vegetation spectra of fields and forests did not show this characteristic (Figure 13).
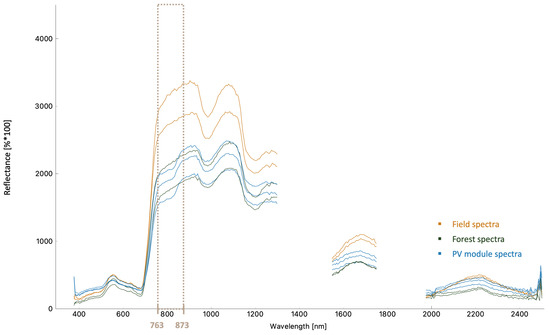
Figure 13.
Comparison of spectral signatures of vegetation on a field, a forest, and a PV module with surrounding vegetation. The rapid increase in the red edge is also abundant in the mixed PV spectrum, thus missing the typically low reflectance of PV modules up to 1000 nm. The S-curve between 763 and 873 nm is obtained only in the mixed PV spectrum.
Although this spectral characteristic was used for detection by calculating the curvature or convexity of the spectra, no significant improvement was obtained with this additional information. The spectral signatures of PRISMA showed no differences (S-curve) in the 763 to 873 nm range for pure vegetation and PV modules with dominant vegetation influences.
4. Discussion
This study aimed to evaluate the feasibility of PV module detection with space- and airborne HSI data of spatial resolutions of 30 and 5.3 m, respectively. The methodological approach of this study was based on physical absorption and reflection features using spectral indices adapted from Ji et al. [3]. Compared to machine learning approaches, e.g., Yu et al. [11], the index-based approach did not required any training samples, except for validation and hyperparameter tuning. Nevertheless, well-acquired and preprocessed HSI data are needed.
The nHI, as introduced by Ji et al. [3], performed well in terms of the detection of PV modules (user’s accuracy) without causing low precision. However, a strong spectral influence of surrounding vegetation can level the valley at 1730 nm, which limits the performance of the nHI.
Compared to Ji et al. [3], the optimal thresholds out of 35,280 (AVIRIS-NG) or 116,640 (PRISMA) tested combinations resulted in lower nHI and NSPI values. While higher nHI and NSPI thresholds are proposed by Ji et al. [3] to separate PV modules from roofing polyethylene (nHI) and roofing tiles (NSPI), the NSPI turned out to proper distinguish from vital vegetation, forest, and water bodies (Danube river).
Another reason for the low optimal nHI and NSPI values might be the spatial resolution and its associated spectral mixture.
Since the lower and upper limits of the hyperparameter search intervals were not found as optimum values, it can be assumed that the intervals chosen were wide enough and contained the overall optimum value.
The user’s accuracy or sensitivity of the PV module detection in this study (65.94% for AVIRIS-NG and 70.53% for PRISMA) is comparable to the performance of Ji et al. [3] with a user’s accuracy of 74%. The machine learning detection by Yu et al. [11] however achieved a user’s accuracy of 93%.
The producer’s accuracy or precision achieved in this study (82.77% for AVIRIS-NG and 88.06% for PRISMA) exceeded the precision of Ji et al. [3] with 74% and was in range with the precision of 89% of Yu et al. [11] with the machine learning approach.
Taking into account the higher resolutions of 0.3 m, 0.6 m, and 1.2 m in the other studies, the accuracies of this study seem reasonable and of good quality, although other studies proposed high resolution HSI data of 0.3 m or higher for proper PV module detection [3,4,14]. This is argued by the high intra- and inter-class variability of spectral signatures from various PV modules and materials, leading to mix-ups with non PV materials [3,14]. Additionally, the spectral mixture of several materials with lower resolution HSI data has a great influence on the intra- and inter-class variability [22].
Nevertheless, the results indicated a superior performance of the PV detection using PRISMA data with 30 m resolution. This might be due to the lower resolution of PRISMA compared to AVIRIS-NG including the lower resolution ground truth data containing only PV plants with a power of more than 180 kWp. Small-scale roofing PV modules were therefore excluded by the ground truth condition of a minimum of 50% PV plant overlap per 30 m pixel. Especially for small PV plants, distortions in the data, e.g., caused by the roof angle, can lead to detection errors.
In addition, model evaluation time for a specific threshold combination took about 0.0615 s for the PRISMA and about 2 s for the AVIRIS-NG data, indicating advantages of the spaceborne data.
It was found from the results that the detection of PV pixels was strongly influenced by background and surrounding surface materials: vegetation growing under or beside the solar panels, and the type of PV module construction (e.g., angle, density of individual PV modules within a power plant) lead to mixed spectral signals and superimpose the pure spectral PV signature—especially for boundary pixels of PV power plants. Due to the spatial resolution, AVIRIS-NG boundary pixels were more influenced by the density of the PV modules, while PRISMA data had a stronger mixture of surrounding vegetation and other materials. Other PV materials and interactions with background materials may lead to other spectral signatures which are not covered by the used indices. It is most likely that PV panels around the world are made of similar materials, but the background signals might be different. Thus, the actual components of the spectral mixture rather than only laboratory measured PV materials have to be taken into account for tuning the threshold values of the hyperspectral indices or performing spectral unmixing. However, the indices represent physical reflection properties (spectral fingerprint) of the PV materials, making the physics/index-based approach generally robust and transferable to other regions—independent of influences, such as more or less sun.
In addition to resolution-dependent differences in the spectral mixture of the AVIRIS-NG and PRISMA signals, the different acquisition dates of AVIRIS-NG (30 May 2022) and PRISMA (26 March 2022) might also cause different spectral responses, especially due to the different phenological stages of the acquisition dates.
Although an object-based detection approach was reasonable, the performance evaluation was more accurate using the pixel-based approach. However, by aggregating neighbouring pixels of the same class, small and large roofing PV modules in dense urban areas are identified as one single PV plant and large PV plants do not always show a complete homogeneous and connected pattern, leading to a split in multiple PV objects. The object-based approach has the advantage of allowing a lower limit for the size of detected PV plants.
5. Conclusions
This study aimed to evaluate the applicability of airborne AVIRIS-NG and spaceborne PRISMA hyperspectral data to detect solar PV plants. The spectral indices nHI and NSPI were used identify possible PV pixels, while the indices aVNIR, PEP, and VPEP were used to exclude similar surface materials. This physics-based approach provides a robust, transferable, and scalable PV detection method.
After hyperparameter optimization of the individual thresholds of the spectral indices, detection results of user’s accuracy 65.94% and producer’s accuracy 82.77% for AVIRIS-NG, and user’s accuracy 70.53% and producer’s accuracy 88.06% for the PRISMA data were achieved. Thus, 5.3 m medium-resolution AVIRIS-NG and 30 m low-resolution HSI data of airborne and spaceborne sensors were satisfactorily utilized for solar PV plant detection.
It was challenging to detect PV modules with strong vegetation influences, therefore spectral unmixing might be promising for further investigations. The soiling effect on PV panels can also be taken into account by performing spectral unmixing. However, spectral unmixing requires expensive field studies to obtain sufficient endmember spectra. Using only observations from vegetation- and snow-free winter months may also provide more pure PV pixels. Proper classifications of land surfaces as PV plants can be used to estimate energy production potentials on a large scale to enhance sustainable energies or to optimize maintenance, e.g., the cleaning of modules in desert areas [13].
Future studies may elaborate on including information on expositions to check for improvement of the PV classification. In addition, a hierarchical approach of combining the spectral indices and additional information about the PV modules in the study area (e.g., type, age, degradation) might improve detection.
It is also of high interest to investigate the performance of the new EnMAP hyperspectral satellite with 30 m spatial resolution in detecting PV power plants with the methods described in this study. Increased spatial and temporal coverage with EnMAP of PV surfaces around the world will provide more insights into mixed spectral signatures of PV modules in the future.
Author Contributions
C.J.: conceptualization, methodology, software, formal analysis, validation, investigation, data curation, writing—original draft preparation, writing—review and editing, visualization; H.S.V.: formal analysis, validation, investigation, data curation, writing—original draft preparation, writing—review and editing, visualization; T.H.: conceptualization, methodology, supervision; H.B.: conceptualization, resources, project administration, funding acquisition, supervision. All authors have read and agreed to the published version of the manuscript.
Funding
This research was funded by the Bavarian Ministry of Economic Affairs, Regional Development and Energy under the funding line BayVFP Förderlinie Mobilität-Raumfahrt within the project HyperPin.
Data Availability Statement
The data presented and generated in this study are available on request from the corresponding author.
Acknowledgments
A patent at the European Patent Office (EP4080404) has been requested for parts of this research.
Conflicts of Interest
The authors declare no conflict of interest.
Abbreviations
The following abbreviations are used in this manuscript:
| ASI | Agenzia Spaziale Italiana |
| AVIRIS-NG | Airborne Visible InfraRed Imaging Spectrometer-Next Generation |
| aVNIR | Index of average reflectance in VNIR |
| CHIME | Copernicus Hyperspectral Imaging Mission for the Environment mission |
| EnMAP | Environmental Mapping and Analysis Program |
| ESA | European Space Agency |
| EVA | Ethylene Vinyl Acetate |
| HI | Hydrocarbon Index |
| nHI | Normalized Hydrocarbon Index |
| NSPI | Normalized Solar Panel Index |
| PRISMA | Hyperspectral Precursor of the Application Mission |
| PV | photovoltaic |
| SDGs | Sustainable Development Goals |
| VIS | visible light range |
References
- International Energy Agency. Renewables 2019. Analysis and Forecast to 2024. Available online: https://www.iea.org/reports/renewables-2019 (accessed on 10 December 2022).
- Xia, Z.; Li, Y.; Chen, R.; Sengupta, D.; Guo, X.; Xiong, B.; Niu, Y. Mapping the rapid development of photovoltaic power stations in northwestern China using remote sensing. Energy Rep. 2022, 8, 4117–4127. [Google Scholar] [CrossRef]
- Ji, C.; Bachmann, M.; Esch, T.; Feilhauer, H.; Heiden, U.; Heldens, W.; Hueni, A.; Lakes, T.; Metz-Marconcini, A.; Schroedter-Homscheidt, M.; et al. Solar photovoltaic module detection using laboratory and airborne imaging spectroscopy data. Remote Sens. Environ. 2021, 266, 112692. [Google Scholar] [CrossRef]
- Malof, J.M.; Bradbury, K.; Collins, L.M.; Newell, R.G. Automatic detection of solar photovoltaic arrays in high resolution aerial imagery. Appl. Energy 2016, 183, 229–240. [Google Scholar] [CrossRef]
- Wang, J.; Liu, J.; Li, L. Detecting Photovoltaic Installations in Diverse Landscapes Using Open Multi-Source Remote Sensing Data. Remote Sens. 2022, 14, 6296. [Google Scholar] [CrossRef]
- Dunnett, S.; Sorichetta, A.; Taylor, G.; Eigenbrod, F. Harmonised global datasets of wind and solar farm locations and power. Sci. Data 2020, 7, 130. [Google Scholar] [CrossRef] [PubMed]
- Hernandez, R.; Easter, S.; Murphy-Mariscal, M.; Maestre, F.; Tavassoli, M.; Allen, E.; Barrows, C.; Belnap, J.; Ochoa-Hueso, R.; Ravi, S.; et al. Environmental impacts of utility-scale solar energy. Renew. Sustain. Energy Rev. 2014, 29, 766–779. [Google Scholar] [CrossRef]
- Wu, A.N.; Biljecki, F. Roofpedia: Automatic mapping of green and solar roofs for an open roofscape registry and evaluation of urban sustainability. Landsc. Urban Plan. 2021, 214, 104167. [Google Scholar] [CrossRef]
- Ge, F.; Wang, G.; He, G.; Zhou, D.; Yin, R.; Tong, L. A Hierarchical Information Extraction Method for Large-Scale Centralized Photovoltaic Power Plants Based on Multi-Source Remote Sensing Images. Remote Sens. 2022, 14, 4211. [Google Scholar] [CrossRef]
- Evans, J.; Kiesecker, J. Shale Gas, Wind and Water: Assessing the Potential Cumulative Impacts of Energy Development on Ecosystem Services within the Marcellus Play. PLoS ONE 2014, 9, e89210. [Google Scholar] [CrossRef]
- Yu, J.; Wang, Z.; Majumdar, A.; Rajagopal, R. DeepSolar: A Machine Learning Framework to Efficiently Construct a Solar Deployment Database in the United States. Joule 2018, 2, 2605–2617. [Google Scholar] [CrossRef]
- Bundesnetzagentur. Daten und Fakten zum Marktstammdatenregister. 2020. Available online: https://www.bundesnetzagentur.de/SharedDocs/Downloads/DE/Sachgebiete/Energie/Unternehmen_Institutionen/DatenaustauschUndMonitoring/MaStR/Factsheet.pdf?__blob=publicationFile&v=1 (accessed on 24 November 2022).
- EnMaP. EnMAP Images from the Lower Lausitz-An East-German Region in Transition. Available online: https://www.enmap.org/news/2022-10-19/ (accessed on 21 November 2022).
- de Hoog, J.; Maetschke, S.; Ilfrich, P.; Kolluri, R.R. Using Satellite and Aerial Imagery for Identification of Solar PV: State of the Art and Research Opportunities. In Proceedings of the Proceedings of the Eleventh ACM International Conference on Future Energy Systems, Virtual Event Australia, 22–26 June 2020; pp. 308–313. [CrossRef]
- Green, R.O.; Eastwood, M.L.; Sarture, C.M.; Chrien, T.G.; Aronsson, M.; Chippendale, B.J.; Faust, J.A.; Pavri, B.E.; Chovit, C.J.; Solis, M.; et al. Imaging Spectroscopy and the Airborne Visible/Infrared Imaging Spectrometer (AVIRIS). Remote Sens. Environ. 1998, 65, 227–248. [Google Scholar] [CrossRef]
- Heiden, U.; Segl, K.; Roessner, S.; Kaufmann, H. Determination of robust spectral features for identification of urban surface materials in hyperspectral remote sensing data. Remote Sens. Environ. 2007, 111, 537–552. [Google Scholar] [CrossRef]
- Bach, H. Die Bestimmung Hydrologischer und Landwirtschaftlicher Oberflächenparameter aus Hyperspektralen Fernerkundungsdaten; Münchener Universitätsschriften/Fakultät für Geowissenschaften/Münchener geographische Abhandlungen; Geobuch-Verlag: Munich, Germany, 1995; ISBN 978-3-925308-81-9. [Google Scholar]
- Czirjak, D.W. Detecting photovoltaic solar panels using hyperspectral imagery and estimating solar power production. J. Appl. Remote Sens. 2017, 11, 026007. [Google Scholar] [CrossRef]
- Bhattacharya, B.K.; Green, R.O.; Rao, S.; Saxena, M.; Sharma, S.; Ajay Kumar, K.; Srinivasulu, P.; Sharma, S.; Dhar, D.; Bandyopadhyay, S.; et al. An Overview of AVIRIS-NG Airborne Hyperspectral Science Campaign Over India. Curr. Sci. 2019, 116, 1082. [Google Scholar] [CrossRef]
- Somers, B.; Asner, G.P.; Tits, L.; Coppin, P. Endmember variability in Spectral Mixture Analysis: A review. Remote Sens. Environ. 2011, 115, 1603–1616. [Google Scholar] [CrossRef]
- Zhang, J.; Rivard, B.; Sánchez-Azofeifa, A.; Castro-Esau, K. Intra- and inter-class spectral variability of tropical tree species at La Selva, Costa Rica: Implications for species identification using HYDICE imagery. Remote Sens. Environ. 2006, 105, 129–141. [Google Scholar] [CrossRef]
- Karoui, M.; Benhalouche, F.; Deville, Y.; Djerriri, K.; Briottet, X.; Houet, T.; Le Bris, A.; Weber, C. Partial Linear NMF-Based Unmixing Methods for Detection and Area Estimation of Photovoltaic Panels in Urban Hyperspectral Remote Sensing Data. Remote Sens. 2019, 11, 2164. [Google Scholar] [CrossRef]
- Chen, Z.; Kang, Y.; Sun, Z.; Wu, F.; Zhang, Q. Extraction of Photovoltaic Plants Using Machine Learning Methods: A Case Study of the Pilot Energy City of Golmud, China. Remote Sens. 2022, 14, 2697. [Google Scholar] [CrossRef]
- Karoui, M.S.; Benhalouche, F.z.; Deville, Y.; Djerriri, K.; Briottet, X.; Bris, A.L. Detection And Area Estimation For Photovoltaic Panels In Urban Hyperspectral Remote Sensing Data By An Original Nmf-Based Unmixing Method. In Proceedings of the IGARSS 2018-2018 IEEE International Geoscience and Remote Sensing Symposium, Valencia, Spain, 22–27 July 2018; pp. 1640–1643. [Google Scholar] [CrossRef]
- Wocher, M.; Berger, K.; Verrelst, J.; Hank, T. Retrieval of carbon content and biomass from hyperspectral imagery over cultivated areas. ISPRS J. Photogramm. Remote Sens. 2022, 193, 104–114. [Google Scholar] [CrossRef]
- JPL, E. AVIRIS-Next Generation. Data-New Data Aquisitions. Available online: https://avirisng.jpl.nasa.gov/newdata.html (accessed on 18 November 2022).
- Chapman, J.W.; Thompson, D.R.; Helmlinger, M.C.; Bue, B.D.; Green, R.O.; Eastwood, M.L.; Geier, S.; Olson-Duvall, W.; Lundeen, S.R. Spectral and Radiometric Calibration of the Next Generation Airborne Visible Infrared Spectrometer (AVIRIS-NG). Remote Sens. 2019, 11, 2129. [Google Scholar] [CrossRef]
- Thompson, D.R.; Guanter, L.; Berk, A.; Gao, B.C.; Richter, R.; Schläpfer, D.; Thome, K.J. Retrieval of Atmospheric Parameters and Surface Reflectance from Visible and Shortwave Infrared Imaging Spectroscopy Data. Surv. Geophys. 2019, 40, 333–360. [Google Scholar] [CrossRef]
- ASI (Ed.) PRISMA Product Specification Document Issue 2.3 Date 12/03/2020; ASI: Feasterville-Trevose, PA, USA, 2020; Available online: http://prisma.asi.it/missionselect/docs/PRISMA%20Product%20Specifications_Is2_3.pdf (accessed on 20 November 2022).
- Baiocchi, V.; Giannone, F.; Monti, F. How to Orient and Orthorectify PRISMA Images and Related Issues. Remote Sens. 2022, 14, 1991. [Google Scholar] [CrossRef]
- Doormann, G. SolaranlagenPortal. Leistung von Photovoltaikanlagen. 2023. Available online: https://www.solaranlagen-portal.com/photovoltaik/leistung (accessed on 10 April 2023).
- Kühn, F.; Oppermann, K.; Hörig, B. Hydrocarbon Index—An algorithm for hyperspectral detection of hydrocarbons. Int. J. Remote Sens. 2004, 25, 2467–2473. [Google Scholar] [CrossRef]
- Cloutis, E.A. Spectral Reflectance Properties of Hydrocarbons: Remote-Sensing Implications. Science 1989, 245, 165–168. [Google Scholar] [CrossRef]
- Clark, R.N.; Roush, T.L. Reflectance spectroscopy: Quantitative analysis techniques for remotesensing applications. J. Geophys. Res. Solid Earth 1984, 89, 6329–6340. [Google Scholar] [CrossRef]
- Silvestre, S.; Tahri, A.; Tahri, F.; Benlebna, S.; Chouder, A. Evaluation of the performance and degradation of crystalline silicon-based photovoltaic modules in the Saharan environment. Energy 2018, 152, 57–63. [Google Scholar] [CrossRef]
- Schinke, C.; Christian Peest, P.; Schmidt, J.; Brendel, R.; Bothe, K.; Vogt, M.R.; Kröger, I.; Winter, S.; Schirmacher, A.; Lim, S.; et al. Uncertainty analysis for the coefficient of band-to-band absorption of crystalline silicon. AIP Adv. 2015, 5, 067168. [Google Scholar] [CrossRef]
- Deng, Q.; Wang, Z.; Wang, S.; Shao, G. Simulation of planar Si/Mg 2 Si/Si p-i-n heterojunction solar cells for high efficiency. Sol. Energy 2017, 158, 654–662. [Google Scholar] [CrossRef]


Disclaimer/Publisher’s Note: The statements, opinions and data contained in all publications are solely those of the individual author(s) and contributor(s) and not of MDPI and/or the editor(s). MDPI and/or the editor(s) disclaim responsibility for any injury to people or property resulting from any ideas, methods, instructions or products referred to in the content. |
© 2023 by the authors. Licensee MDPI, Basel, Switzerland. This article is an open access article distributed under the terms and conditions of the Creative Commons Attribution (CC BY) license (https://creativecommons.org/licenses/by/4.0/).