Article

Hierarchical Refined Composite Multi-Scale Fractal Dimension and Its Application in Feature Extraction of Ship-Radiated Noise

1
School of Automation and Information Engineering, Xi’an University of Technology, Xi’an 710048, China
2
Shaanxi Key Laboratory of Complex System Control and Intelligent Information Processing, Xi’an University of Technology, Xi’an 710048, China
*
Author to whom correspondence should be addressed.
Remote Sens. 2023, 15(13), 3406; https://doi.org/10.3390/rs15133406
Submission received: 18 May 2023 / Revised: 14 June 2023 / Accepted: 4 July 2023 / Published: 5 July 2023
(This article belongs to the Special Issue Remote Sensing in Intelligent Maritime Research)

Abstract

:
The fractal dimension (FD) is a classical nonlinear dynamic index that can effectively reflect the dynamic transformation of a signal. However, FD can only reflect signal information of a single scale in the whole frequency band. To solve this problem, we combine refined composite multi-scale processing with FD and propose the refined composite multi-scale FD (RCMFD), which can reflect the information of signals at a multi-scale. Furthermore, hierarchical RCMFD (HRCMFD) is proposed by introducing hierarchical analysis, which successfully represents the multi-scale information of signals in each sub-frequency band. Moreover, two ship-radiated noise (SRN) multi-feature extraction methods based on RCMFD and HRCMFD are proposed. The simulation results indicate that RCMFD and HRCMFD can effectively discriminate different simulated signals. The experimental results show that the proposed two-feature extraction methods are more effective for distinguishing six types of SRN than other feature-extraction methods. The HRCMFD-based multi-feature extraction method has the best performance, and the recognition rate reaches 99.7% under the combination of five features.

1. Introduction

A ship-radiated noise signal (SRN) contains various ship information, such as the type, tonnage, and speed of the ship target, hence has always been a focus of research [1,2,3,4,5]. In particular, the study of ship-radiated noise at sea has guiding significance for national maritime defense security [6,7]. However, the marine environment is frightfully complex, and ships are often accompanied by other noise signals in the course of driving, which cause serious interference with SRN reception. Therefore, a method to extract the features of SRN related to express ship information is of great significance to the navigation safety of ships [8,9].
Traditional time domain and frequency domain analysis techniques have been successfully applied to stationary and linear signals with periodic phenomena [10,11,12]. However, SRN is usually complex, nonstationary, and nonlinear, and time domain or frequency domain analysis cannot display detailed information on SRN [13,14,15]. Thus, it is necessary to study feature extraction methods based on the nonlinear dynamic index to analyze SRN [16,17,18,19]. Many commonly used nonlinear dynamic indexes, such as the Lempel–Ziv complexity (LZC), dispersion entropy (DE), permutation entropy (PE), and fractal dimension (FD), can quantify the features of SRN in complex environments [20,21,22,23]. Nevertheless, these indexes all have limitations.
On the one hand, SRN information is usually embedded in different time-scale domains, and the feature extraction methods based on the above indexes only carry out single-scale analysis and cannot fully describe the features of SRN [24,25]. To address this issue, it is popular to use an index based on multi-scale processing to extract signal features [26,27,28,29,30]. However, with the increase in scale factors, the length of the coarse-grained signal decreases dramatically, which leads to poor stability in analyzing short signals. To settle this issue, some scholars have proposed a variation of the index based on refined composite multi-scale processing (RCMP) by changing the starting point of signal subsequence sampling points. Examples include refined composite multi-scale LZC (RCMLZC), refined composite multi-scale DE (RCMDE), and refined composite multi-scale PE (RCMPE). These methods have been successfully applied to fault diagnosis [31], underwater acoustic signal processing [32], and other fields [33,34]. The above-mentioned research results indicated that the index based on RCMP overcomes the disadvantage of low stability caused by the increase in the scale factor of the index based on multi-scale processing and can reflect the information of short signals more comprehensively.
On the other hand, feature extraction methods based on common indexes can only reflect the signal information in the whole frequency band, which is very unfriendly when the signals contain complex frequency components and fault information contains different sub-frequency bands. To overcome this defect, Jiang et al. proposed hierarchical entropy to evaluate the complexity of signals on different sub-frequency band nodes to obtain more abundant, effective information [35]. Inspired by Jiang, Zhu et al. proposed hierarchical fuzzy entropy to estimate the complexity of signals, which has been successfully applied to the field of fault diagnosis [36]. To reflect the information of the fuel pressure wave signal more comprehensively and accurately, Song et al. combined DE and hierarchical analysis to propose hierarchical dispersion entropy, which improves the anti-interference and signal bandwidth variation sensitivity [37]. These results revealed that the index based on hierarchical analysis considers the information of high-frequency and low-frequency components of the signal by analyzing the signal sub-frequency bands, which expresses more abundant signal information in many aspects.
At present, multi-scale processing has been introduced to FD, and its effectiveness has been proven on various selected random signals and chaotic signals [38]. To better reflect the multi-scale and different sub-frequency information of SRNs, the refined composite multi-scale fractal dimension (RCMFD) and the hierarchical RCMFD (HRCMFD) are proposed for the first time. In general, the innovation of this paper can be summarized as follows: (1) On the basis of FD, a new complexity index RCMFD is proposed by introducing RCMP, which improves the ability of the FD to represent scale information. (2) To enhance the characterization ability of RCMFD, HRCMFD is proposed by using hierarchy RCMP (HRCMP), which can express the signal information in each sub-frequency band at multiple scales. (3) The effectiveness of the proposed two indexes is proven by a simulation experiment; the results show that RCMFD and HRCMFD have stronger separability for simulated signals. (4) Two SRN feature-extraction methods based on RCMFD and HRCMFD are proposed, and their advantages in SRN feature extraction are verified by comparison with other feature extraction methods based on a nonlinear dynamic index.
The rest of this paper is organized as follows. Section 2 introduces the theories of FD, RCMFD, and HRCMFD; Section 3 illustrates the specific steps of two SRN feature extraction methods based on RCMFD and HRCMFD; in Section 4, simulated signal simulation experiments of FD, RCMFD, and HRCMFD are carried out to verify the effectiveness of the proposed two indexes; Section 5 presents two sets of SRN feature-extraction experiments, which prove the advantages of the two proposed methods; Section 6 discusses the classification performance of two proposed methods for six SRNs; Section 7 summarizes the conclusions.

2. Methodology

2.1. Fractal Dimension

Fractal dimension (FD), similar to entropy, is one of the most common chaotic measures. In this paper, the box dimension is choosen to measure the complexity of time series. Compared with other nonlinear dynamic indexes, FD has the advantage of simple calculation.
For a time series X = x i , i = 1 , 2 , , n cover it with a grid of the smallest possible side length σ ; N ( σ ) tabulates the number of grids covered by σ . Magnifying σ by a factor of r , the side length of the grid is expanded to r σ , and N ( r σ ) tabulates the number of grids covered by r σ , as follows:
(1) Calculate the minimum number N ( r σ ) of X covered by boxes:
p r σ m a x = m a x x r j 1 + 1 , x r j 1 + 2 , , x r j 1 + r + 1
p r σ m i n = m i n x r j 1 + 1 , x r j 1 + 2 , , x r j 1 + r + 1
p r σ = j = 1 n r p r σ m a x p r σ m i n
N r σ = p r σ r σ + 1
where j = 1 , 2 , , n r , r = 1,2 , , r m a x , r m a x < n , and r represents the magnification of the side length σ .
(2) Select the fitting curve l o g ( r σ ) ~ l o g N ( r σ ) with good linearity as the scale-free area, and the fitting curve can be defined as:
l o g N r σ = a l o g ( r σ ) + b
where r 1 r r 2 , r 1 , and r 2 are the starting point and ending point of the scale-free area, respectively.
(3) Calculate the slope of the fitting curve using the least squares method. This opposite of slope is the fractal dimension F D X , which can be expressed as:
F D X = ( r 2 r 1 + 1 ) l o g ( r ) l o g N r σ l o g ( r ) l o g N r σ r 2 r 1 + 1 ( l o g r ) 2 ( l o g r ) 2
where r 1 r r 2 . Figure 1 displays the calculation flow chart of FD.

2.2. Refined Composite Multi-Scale Fractal Dimension

The RCMFD can reflect time series information from multiple scales, and has strong anti-interference. The calculation process is as follows:
(1)
For a given a time series X = x i , i = 1 , 2 , , n , convert it to coarse-grained sequence Z t s as follows:
Z t ,   j s = 1 s s j 1 + t j s 1 + t x i         j = 1 , 2 , , n s ,   t = 1 , , s
where s represents the scale factor, n s is the integer of n s representing the length of the coarse-grained series, Z t , j s is the j - t h element of the t - t h subsequence.
(2)
For each subsequence Z t ,   j s , the F D X value is calculated according to the steps in Section 2.1.
(3)
The average value of FD of all coarse-grained series is taken as the result of RCMFD:
R C M F D ( X , s ) = 1 s t = 1 s F D ( Z t s )
where X represents the original time series, and s represents the scale factor. Taking s = 5 as an example, a schematic diagram of the coarse granulation process is given in Figure 2, and Figure 3 presents the flow calculation chart of RCMFD.

2.3. Hierarchical Refined Composite Multi-Scale Fractal Dimension

HRCMFD can extract and refine multi-scale information of different sub-frequency bands. The calculation steps of HRCMFD are as follows:
(1)
For a given time series X = x i , i = 1 , 2 , , n ,   n = 2 c , the average operator Q 0 and difference operator Q 1 are, respectively, defined as:
Q 0 = x 2 j + x 2 j + 1 2 ,   j = 1 ,   2 , , 2 c 1
Q 1 = x 2 j x 2 j + 1 2 ,   j = 1 ,   2 , , 2 c 1
where c is the positive integer, and Q 0 and Q 1 denote the low-frequency and high-frequency components of the original time series in the first level decomposition, respectively.
The k - t h layer operator Q j k (j = 0 or 1) can be demonstrated by using a matrix:
Q j k = 1 2 ( 1 ) j 2 0 0 0 0 0 0 1 2 ( 1 ) j 2 0 0 0 0 0 0 1 2 ( 1 ) j 2 2 c 1 × 2 c
(2)
Construct an n-dimensional vector [ l 1 ,   i 2 , ,   l n ] and an integer value e = l k k 2 k p l p , where { l p ,   p = 1 ,   2 , , k }   { 0 , 1 } represents the average operator or difference operator of the p - t h layer. Therefore, the hierarchical component of the e - t h node of the k - t h layer can be expressed as:
X k ,   e = Q l k k · Q l k 1 k 1 Q l 1 1 · X
(3)
According to the definition of RCMFD, calculate the RCMFD of each improved coarse grain series Z t s , so the final HRCMFD can be obtained by the following:
H R C M F D ( X , k , e , s ) = R C M F D ( X k ,   e , s )
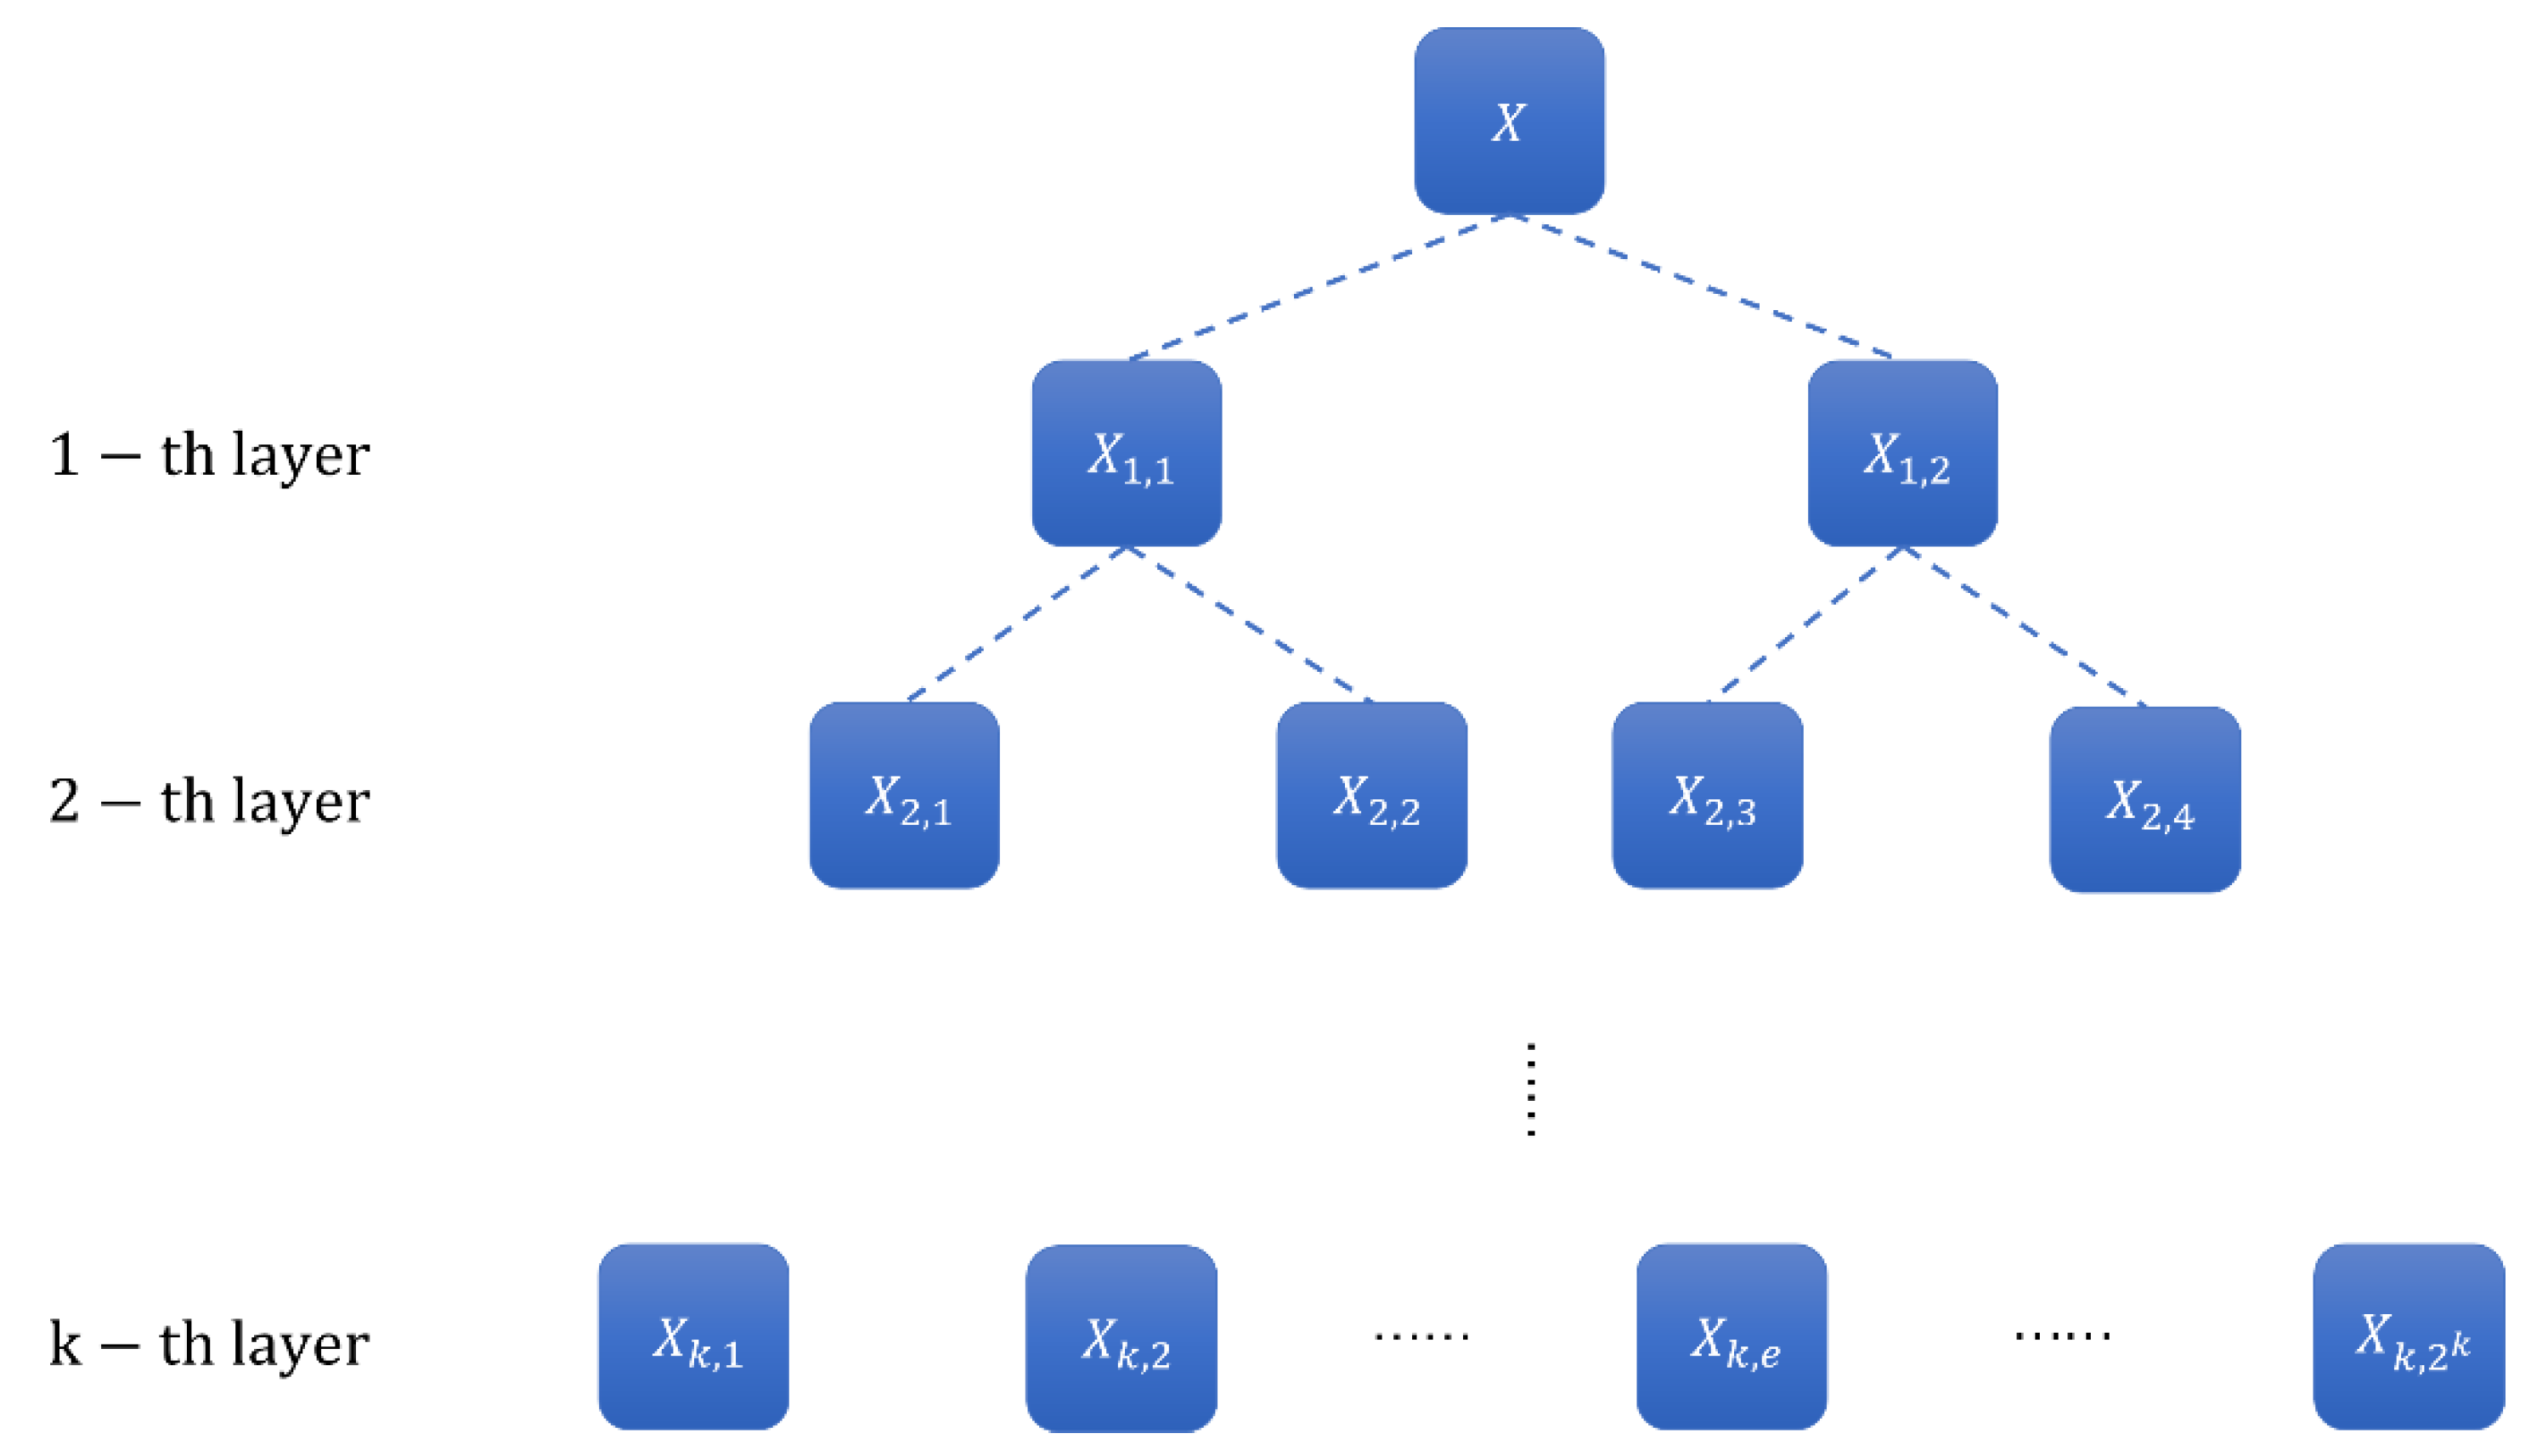
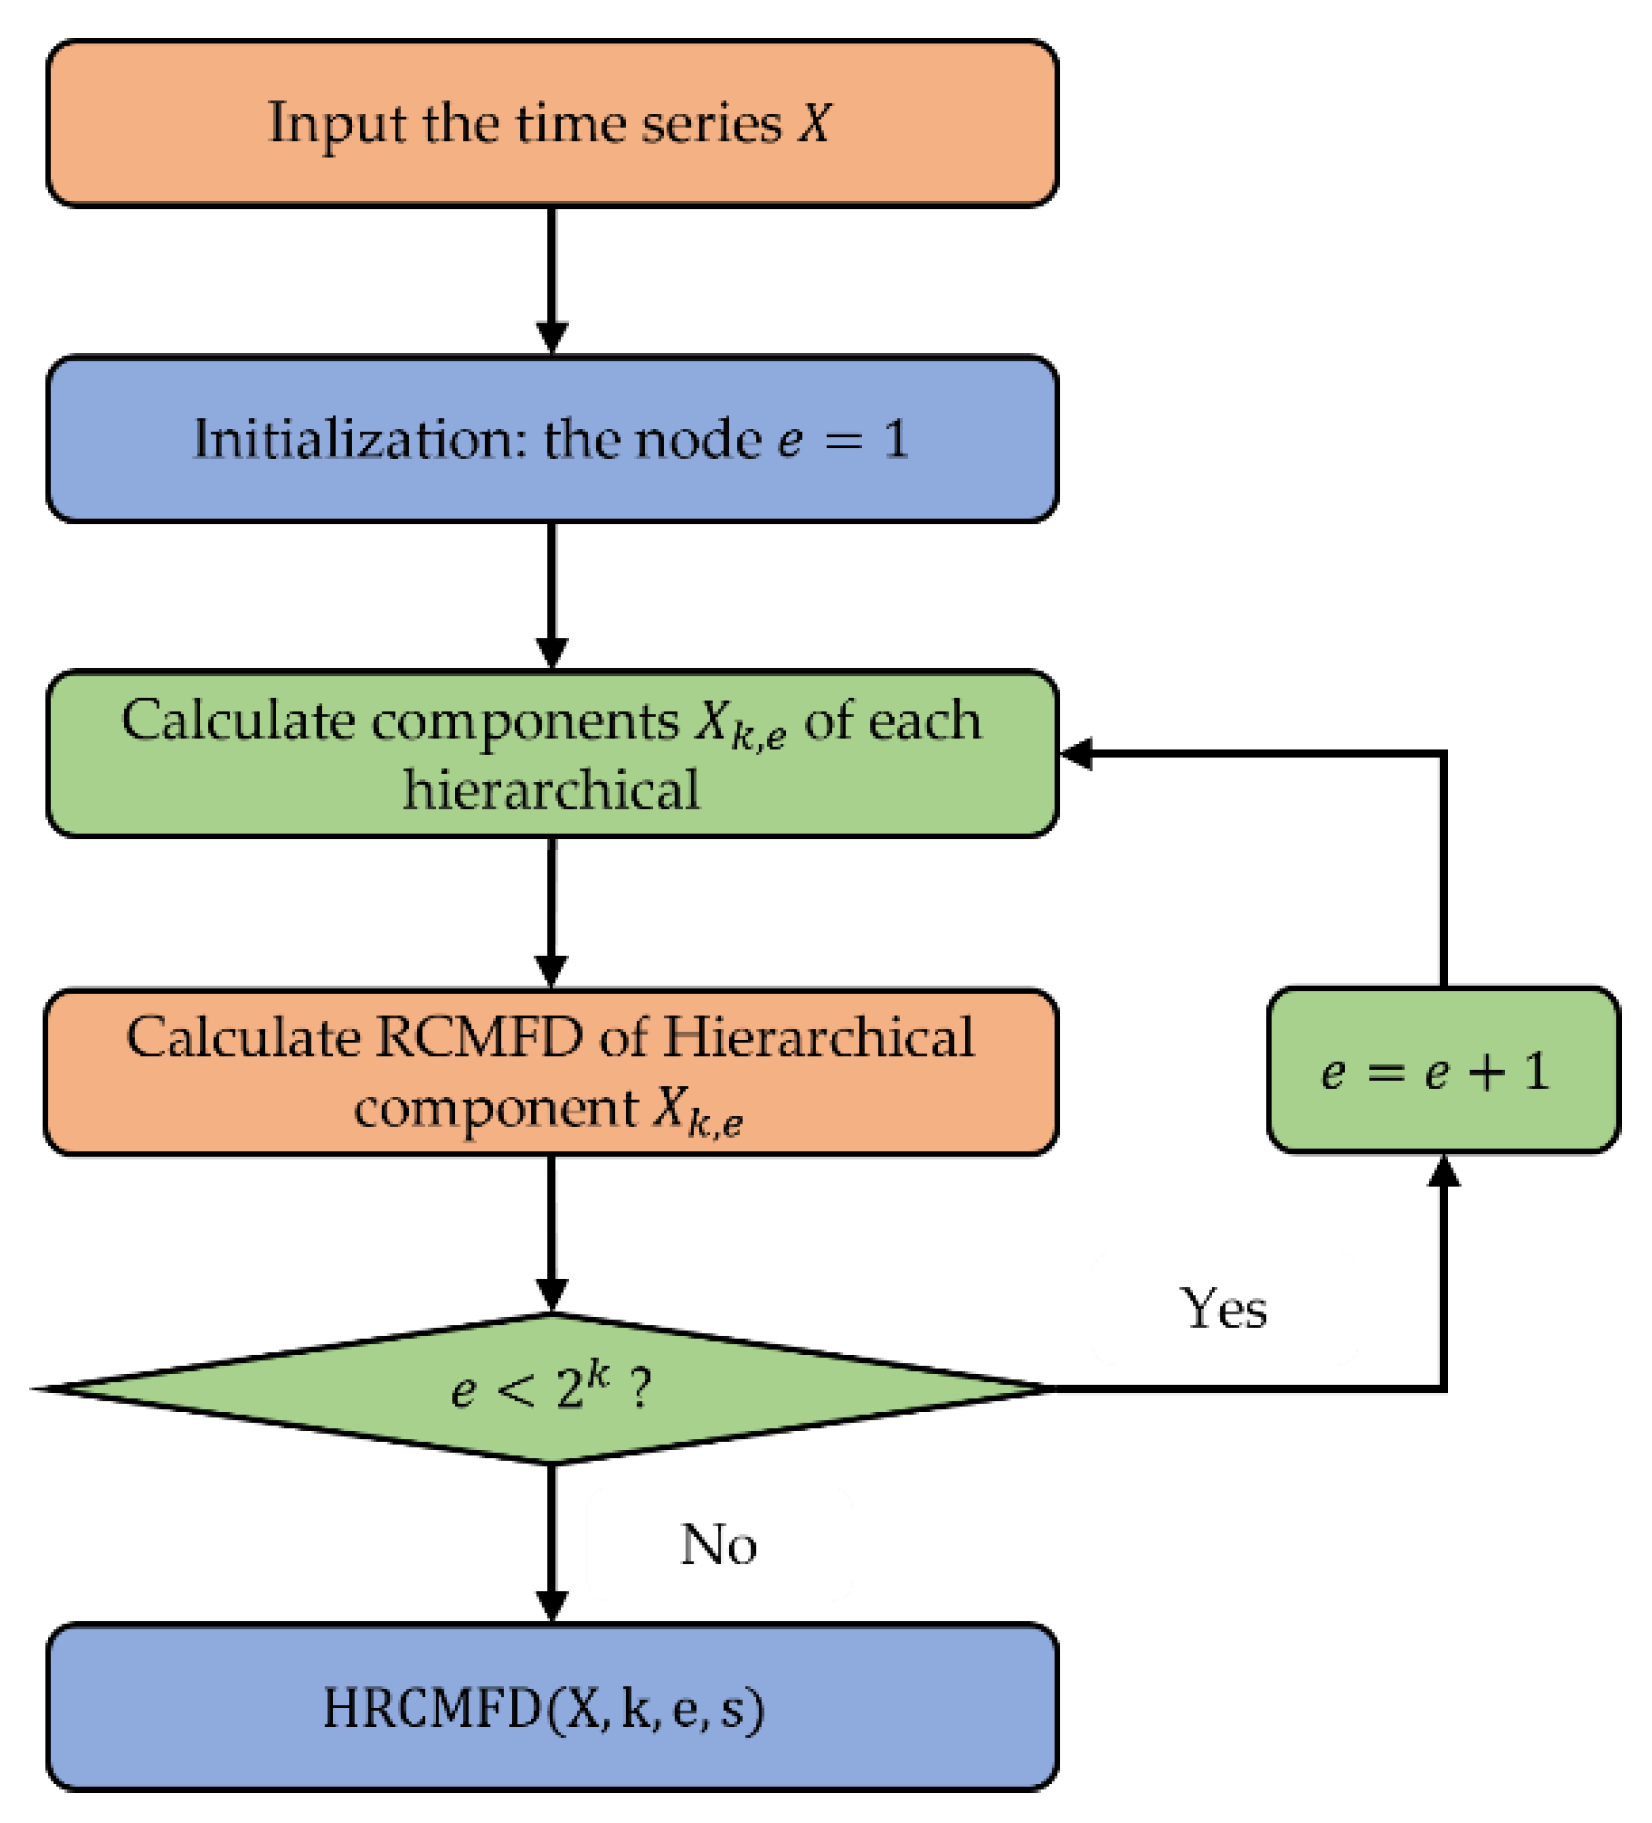
where X is the original time series, k is the decomposition layers, e is the node, and s is the scale factor. Figure 4 displays a schematic chart of hierarchical decomposition, and the flow calculation chart of HRCMFD is given in Figure 5.

3. Feature Extraction Method for SRN

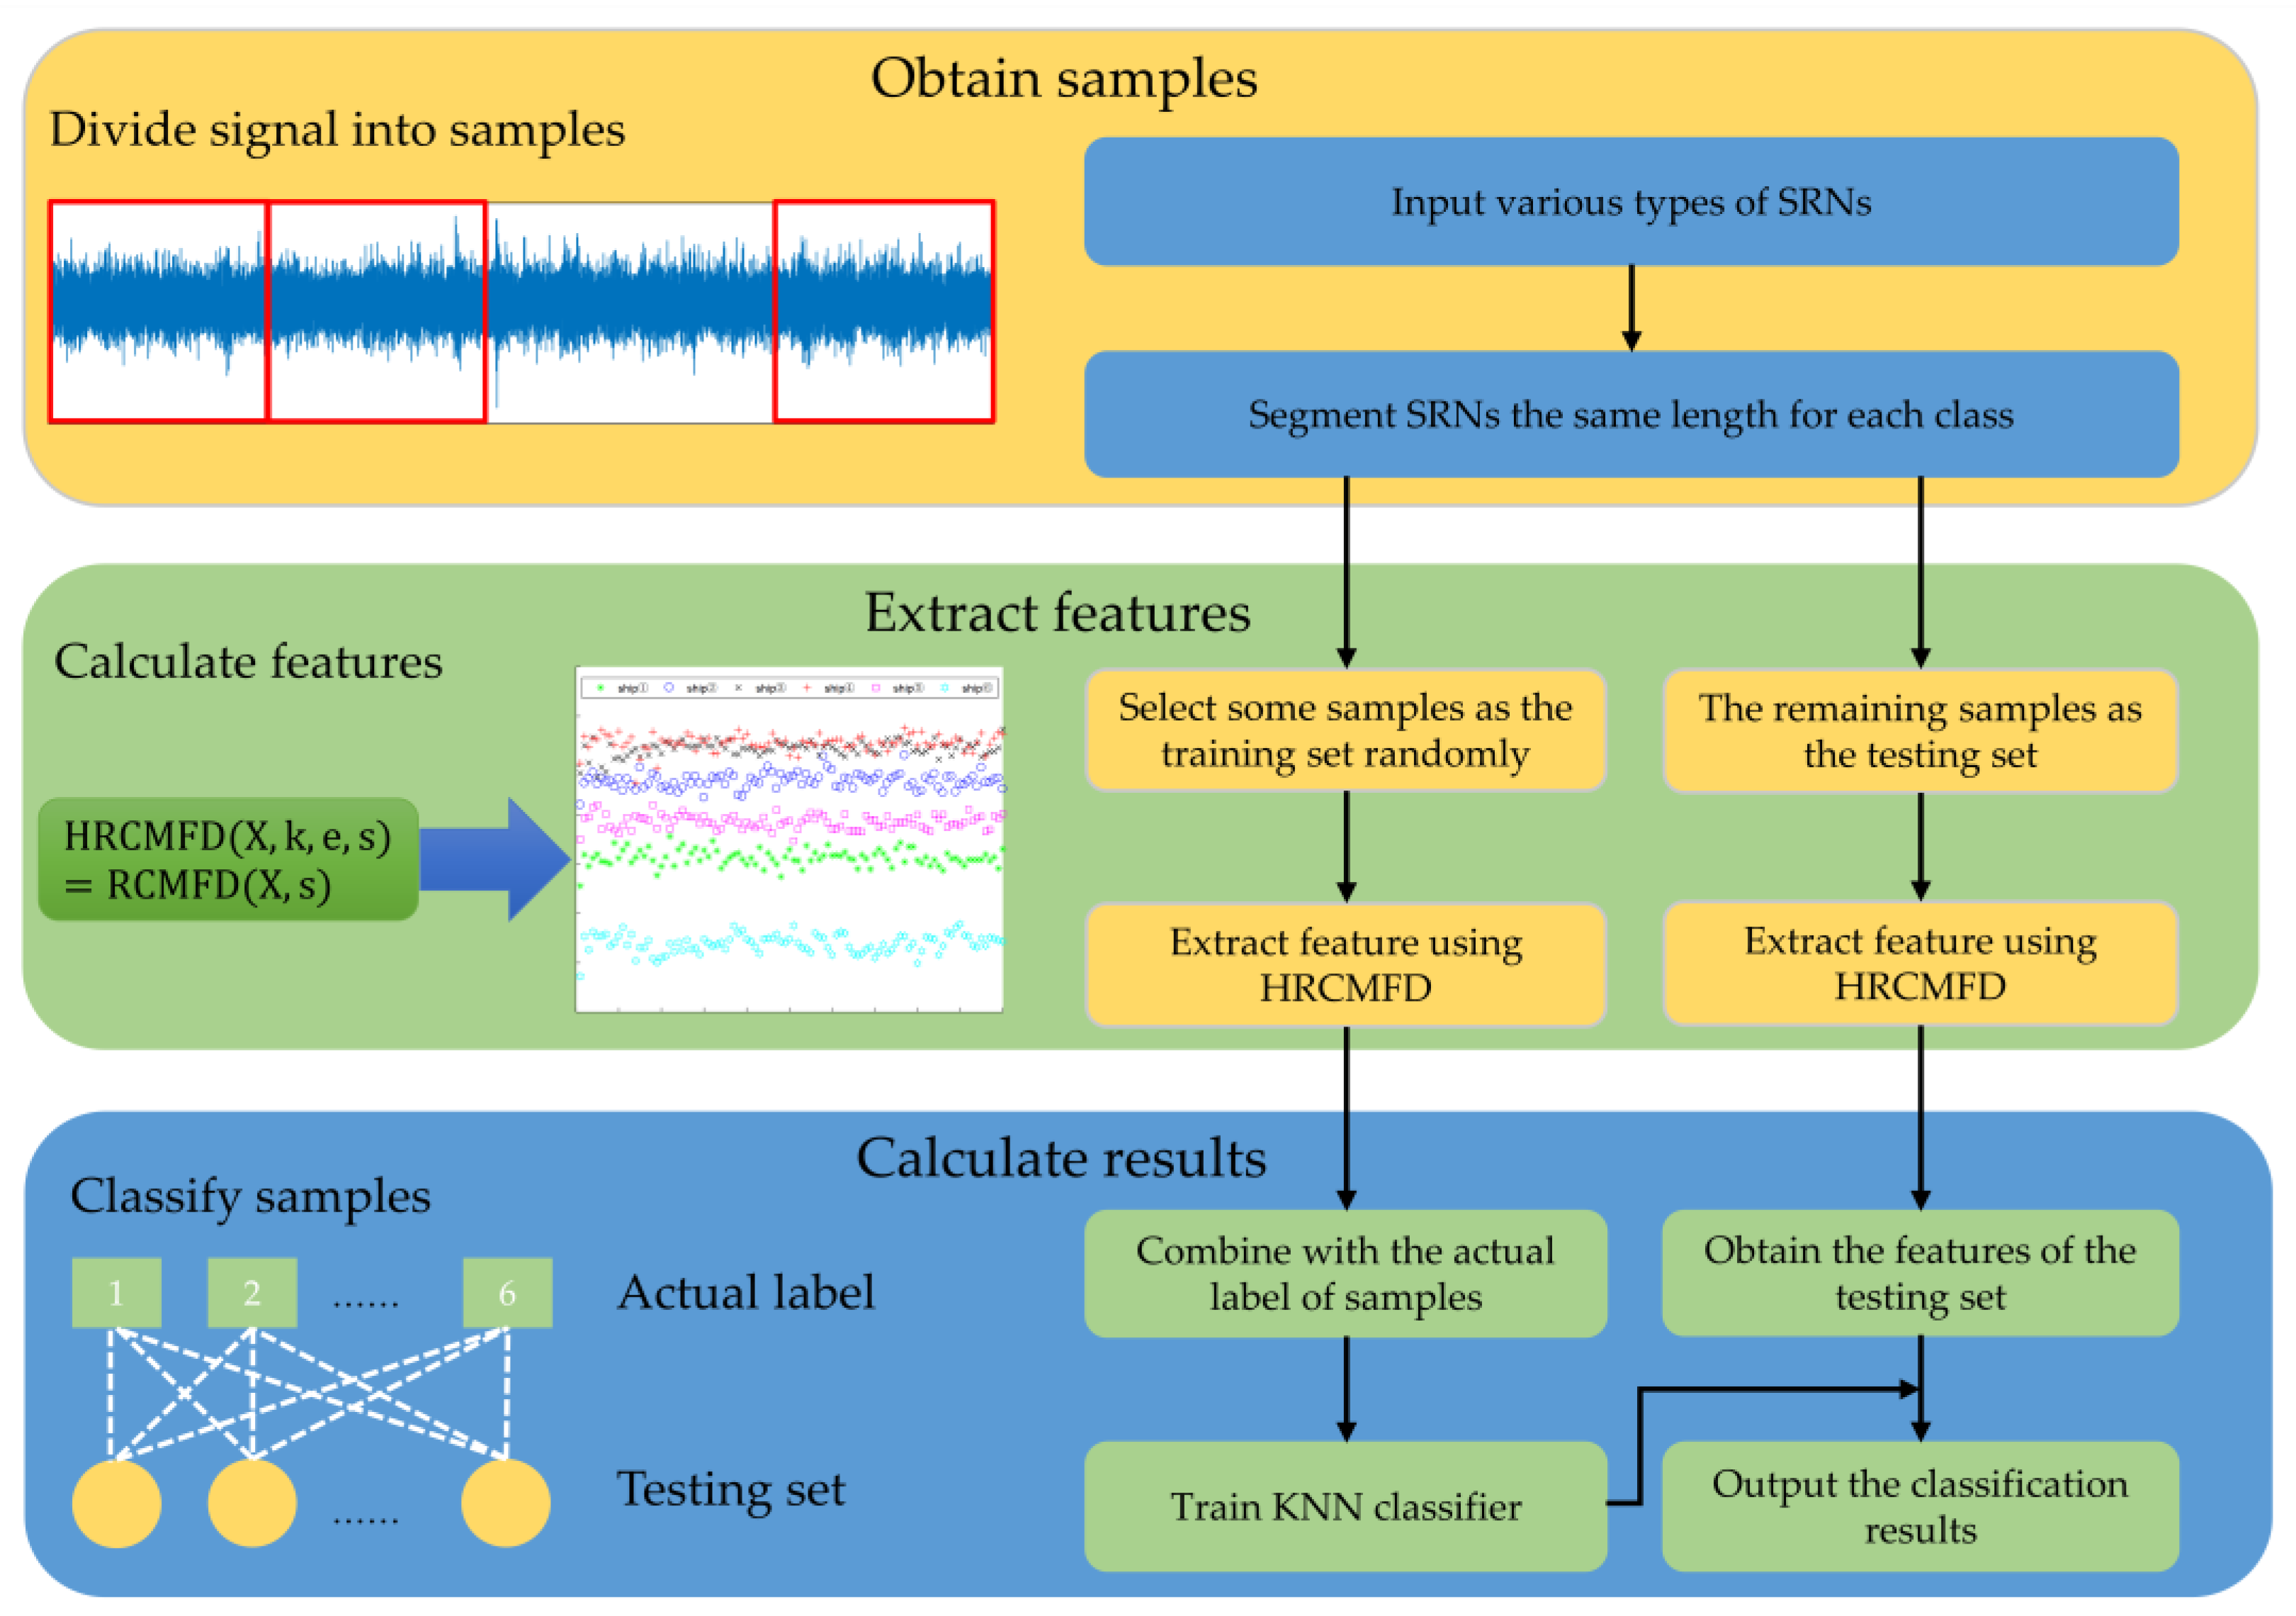
Two SRN multi-feature extraction methods based on RCMFD and HRCMFD are proposed, which extract two to five features of SRN, respectively. The steps of these two feature extraction methods are basically the same. We take the multi-feature extraction method based on HRCMFD as an example. Figure 6 shows the flow chart of the multi-feature extraction method based on HRCMFD. The specific experimental process is as follows.
Step 1: Multiple ship-radiated noise signals (SRNs) are used for feature extraction experiments, and each signal takes the same length as the sampling points.
Step 2: A specific length is used as the length of the sliding window, and the first sampling point is slid backward without overlapping to obtain multiple samples.
Step 3: Some obtained samples are randomly selected as the training set, and the rest are used as the test set.
Step 4: All samples are assigned multi-feature extraction methods based on HRCMFD to extract the feature information of SRN.
Step 5: The classification results of all signals with the same number of features are obtained by inputting the training set and test set into the K-nearest neighbor (KNN) classifier.

4. Analysis of Simulated Signals

4.1. Three Types of Simulated Signals

To prove the superiority of RCMFD and HRCMFD, comparative experiments for three common simulated signals are carried out, namely, Chen [39], Rossler [40], and Mackey-Glass [41]. The expressions of the three simulated systems are as follows:
(1)
Chen signal
Chen et al. discovered the Chen chaotic system in 1999, which is described as follows:
x ˙ = a y x                                   y ˙ = c a x x z + c z ˙ = x y b z                                      
where a , b , and c are given the values of 35, 3, and 28.
(2)
Rossler signal
The Rossler chaotic system is sensitive to control parameters and initial values, and its motion trajectory is bounded. The mathematical description is as follows:
x ˙ = ( y + z )                                                     y ˙ = x a y                                                             z ˙ = b z ( x c )                                    
where the values of parameters a , b , and c are assigned as 0.2, 0.4, and 5.7, respectively.
(3)
Mackey–Glass signal
The Mackey–Glass signal is a typical example of a time-delay chaotic system. Its expression is as follows:
x = b x + a x ( t τ ) 1 + x c ( t τ )
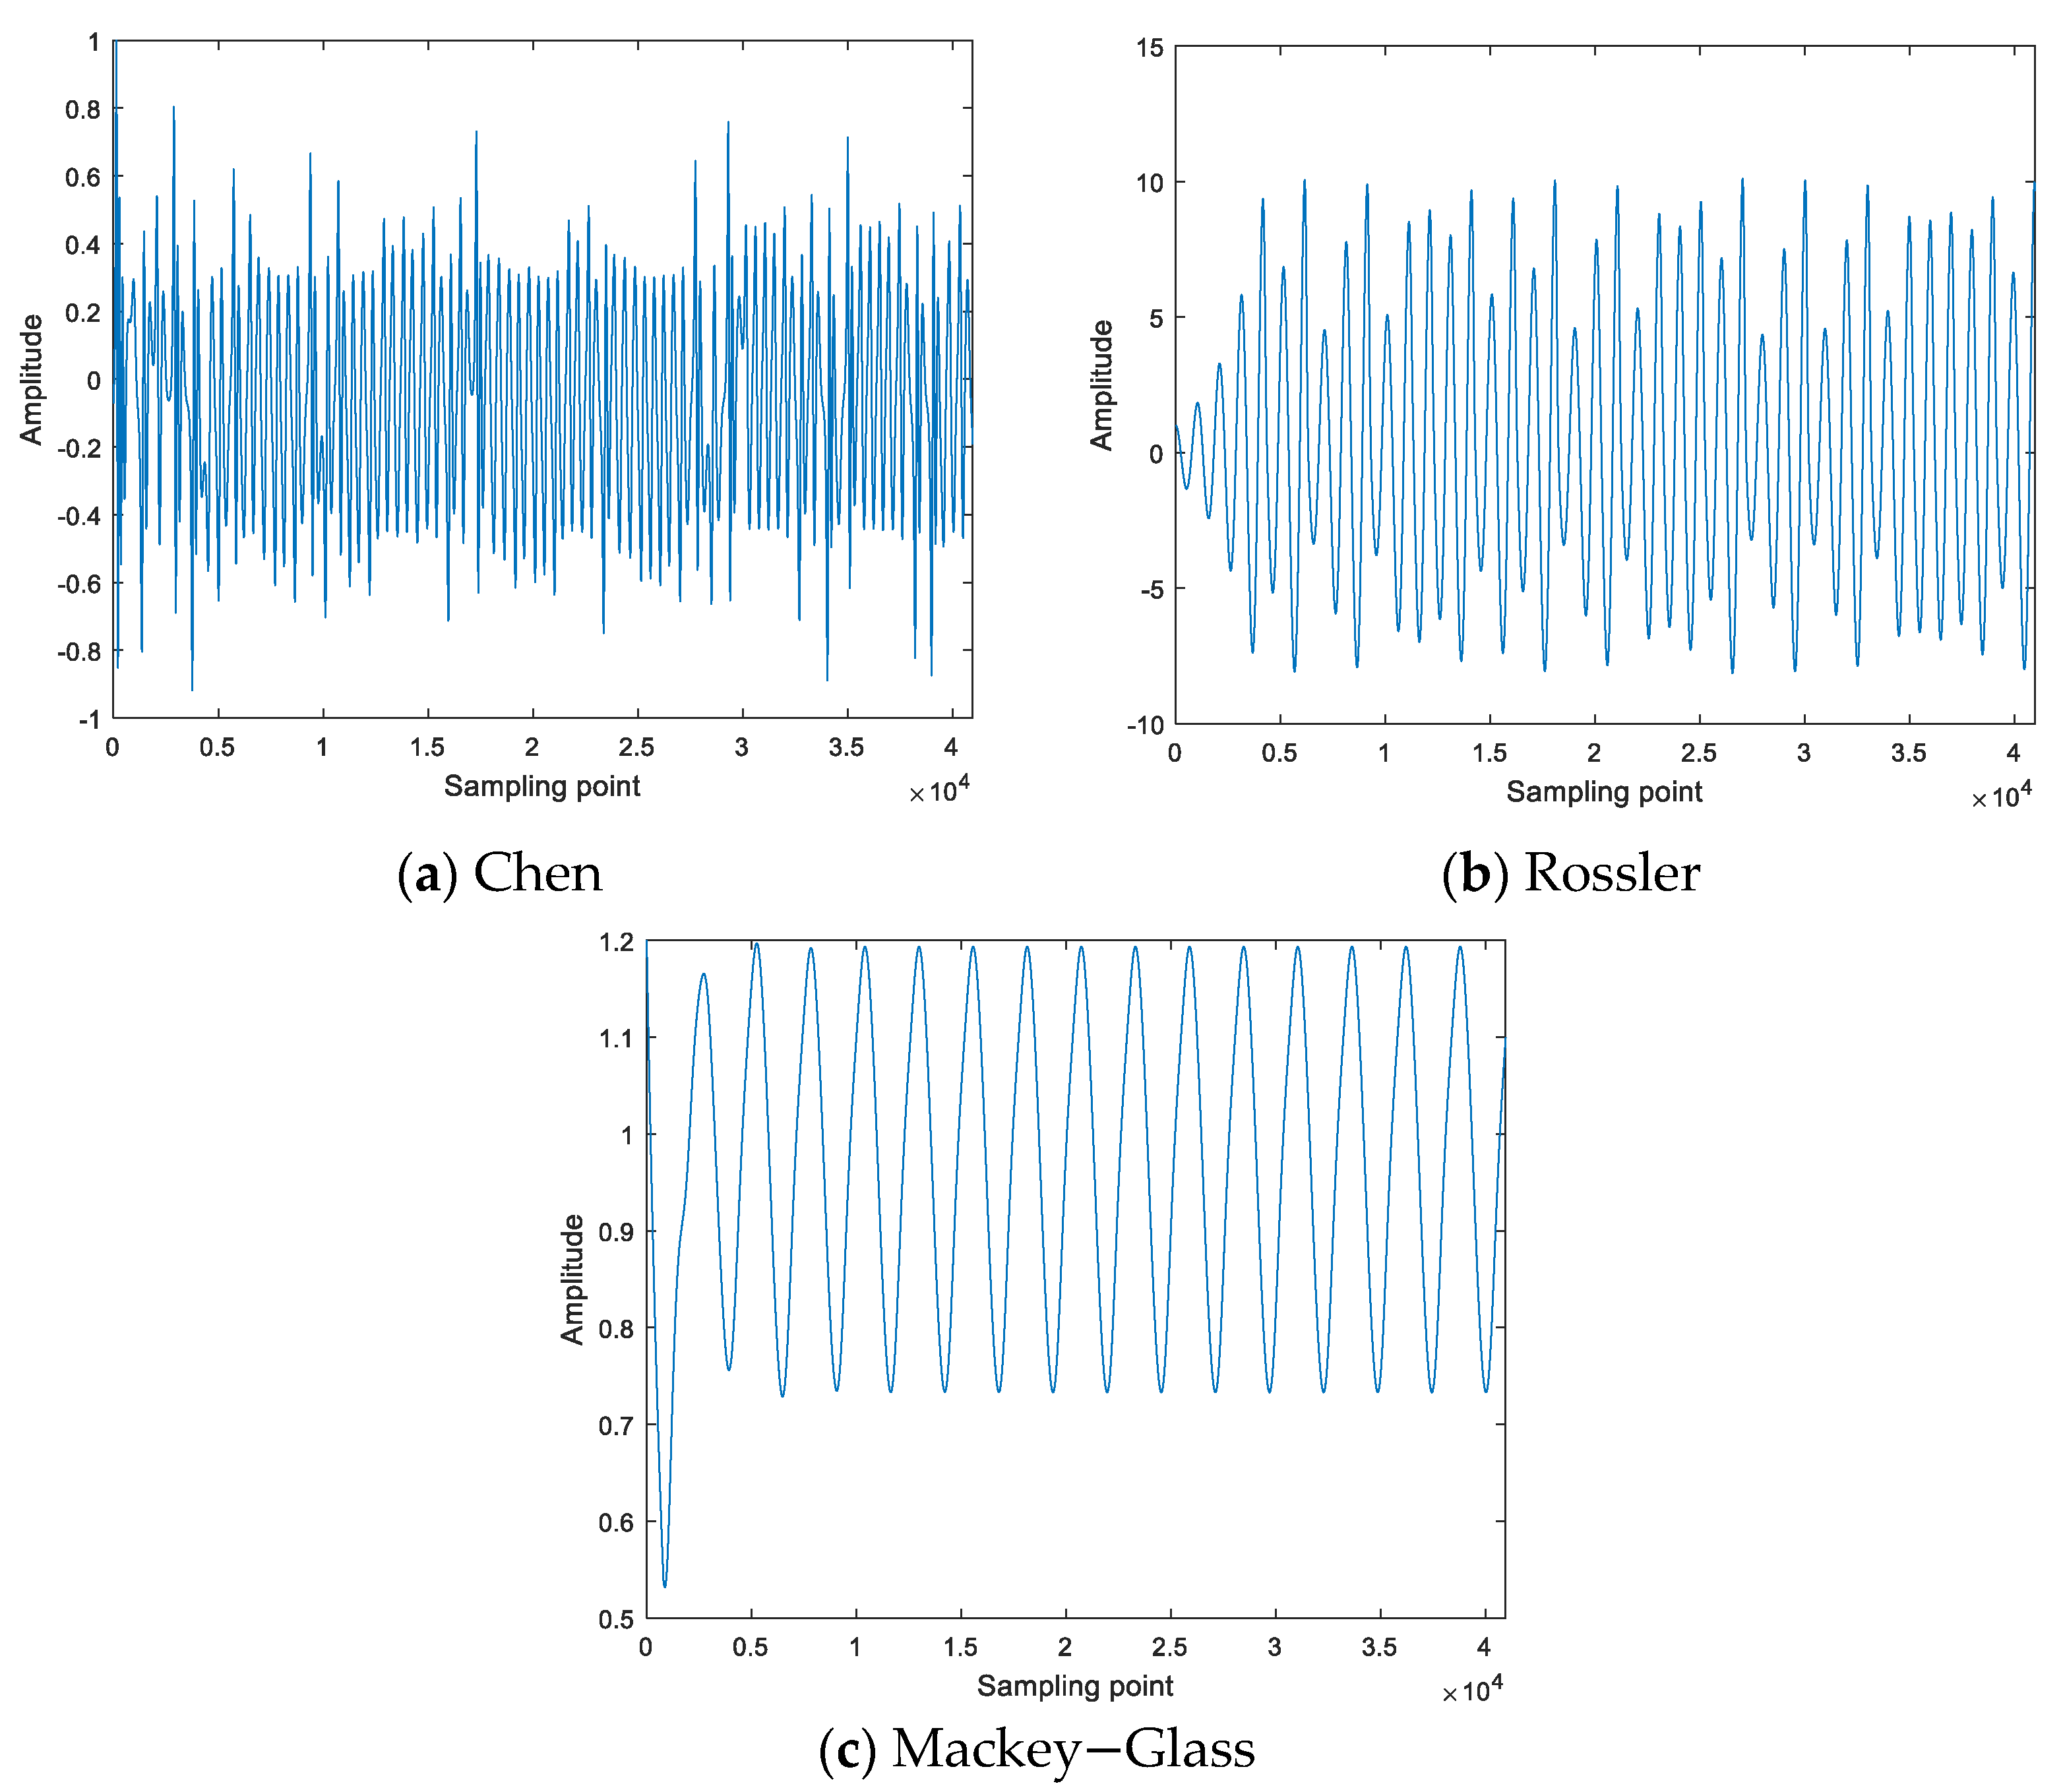
where the values of parameters a , b , c , and τ are set to 0.2, 0.1, 10, and 8, respectively. We choose the signals generated by x variables of three simulated signals as the research objects of this experiment. These research objects are Chen signals, Rossler signals, and Mackey–Glass signals. One hundred samples are collected for each signal, and each sample contains 4096 sampling points. Figure 7 presents the time domain waveforms of three simulated signals.

4.2. Single Feature Characterization of Simulated Signals

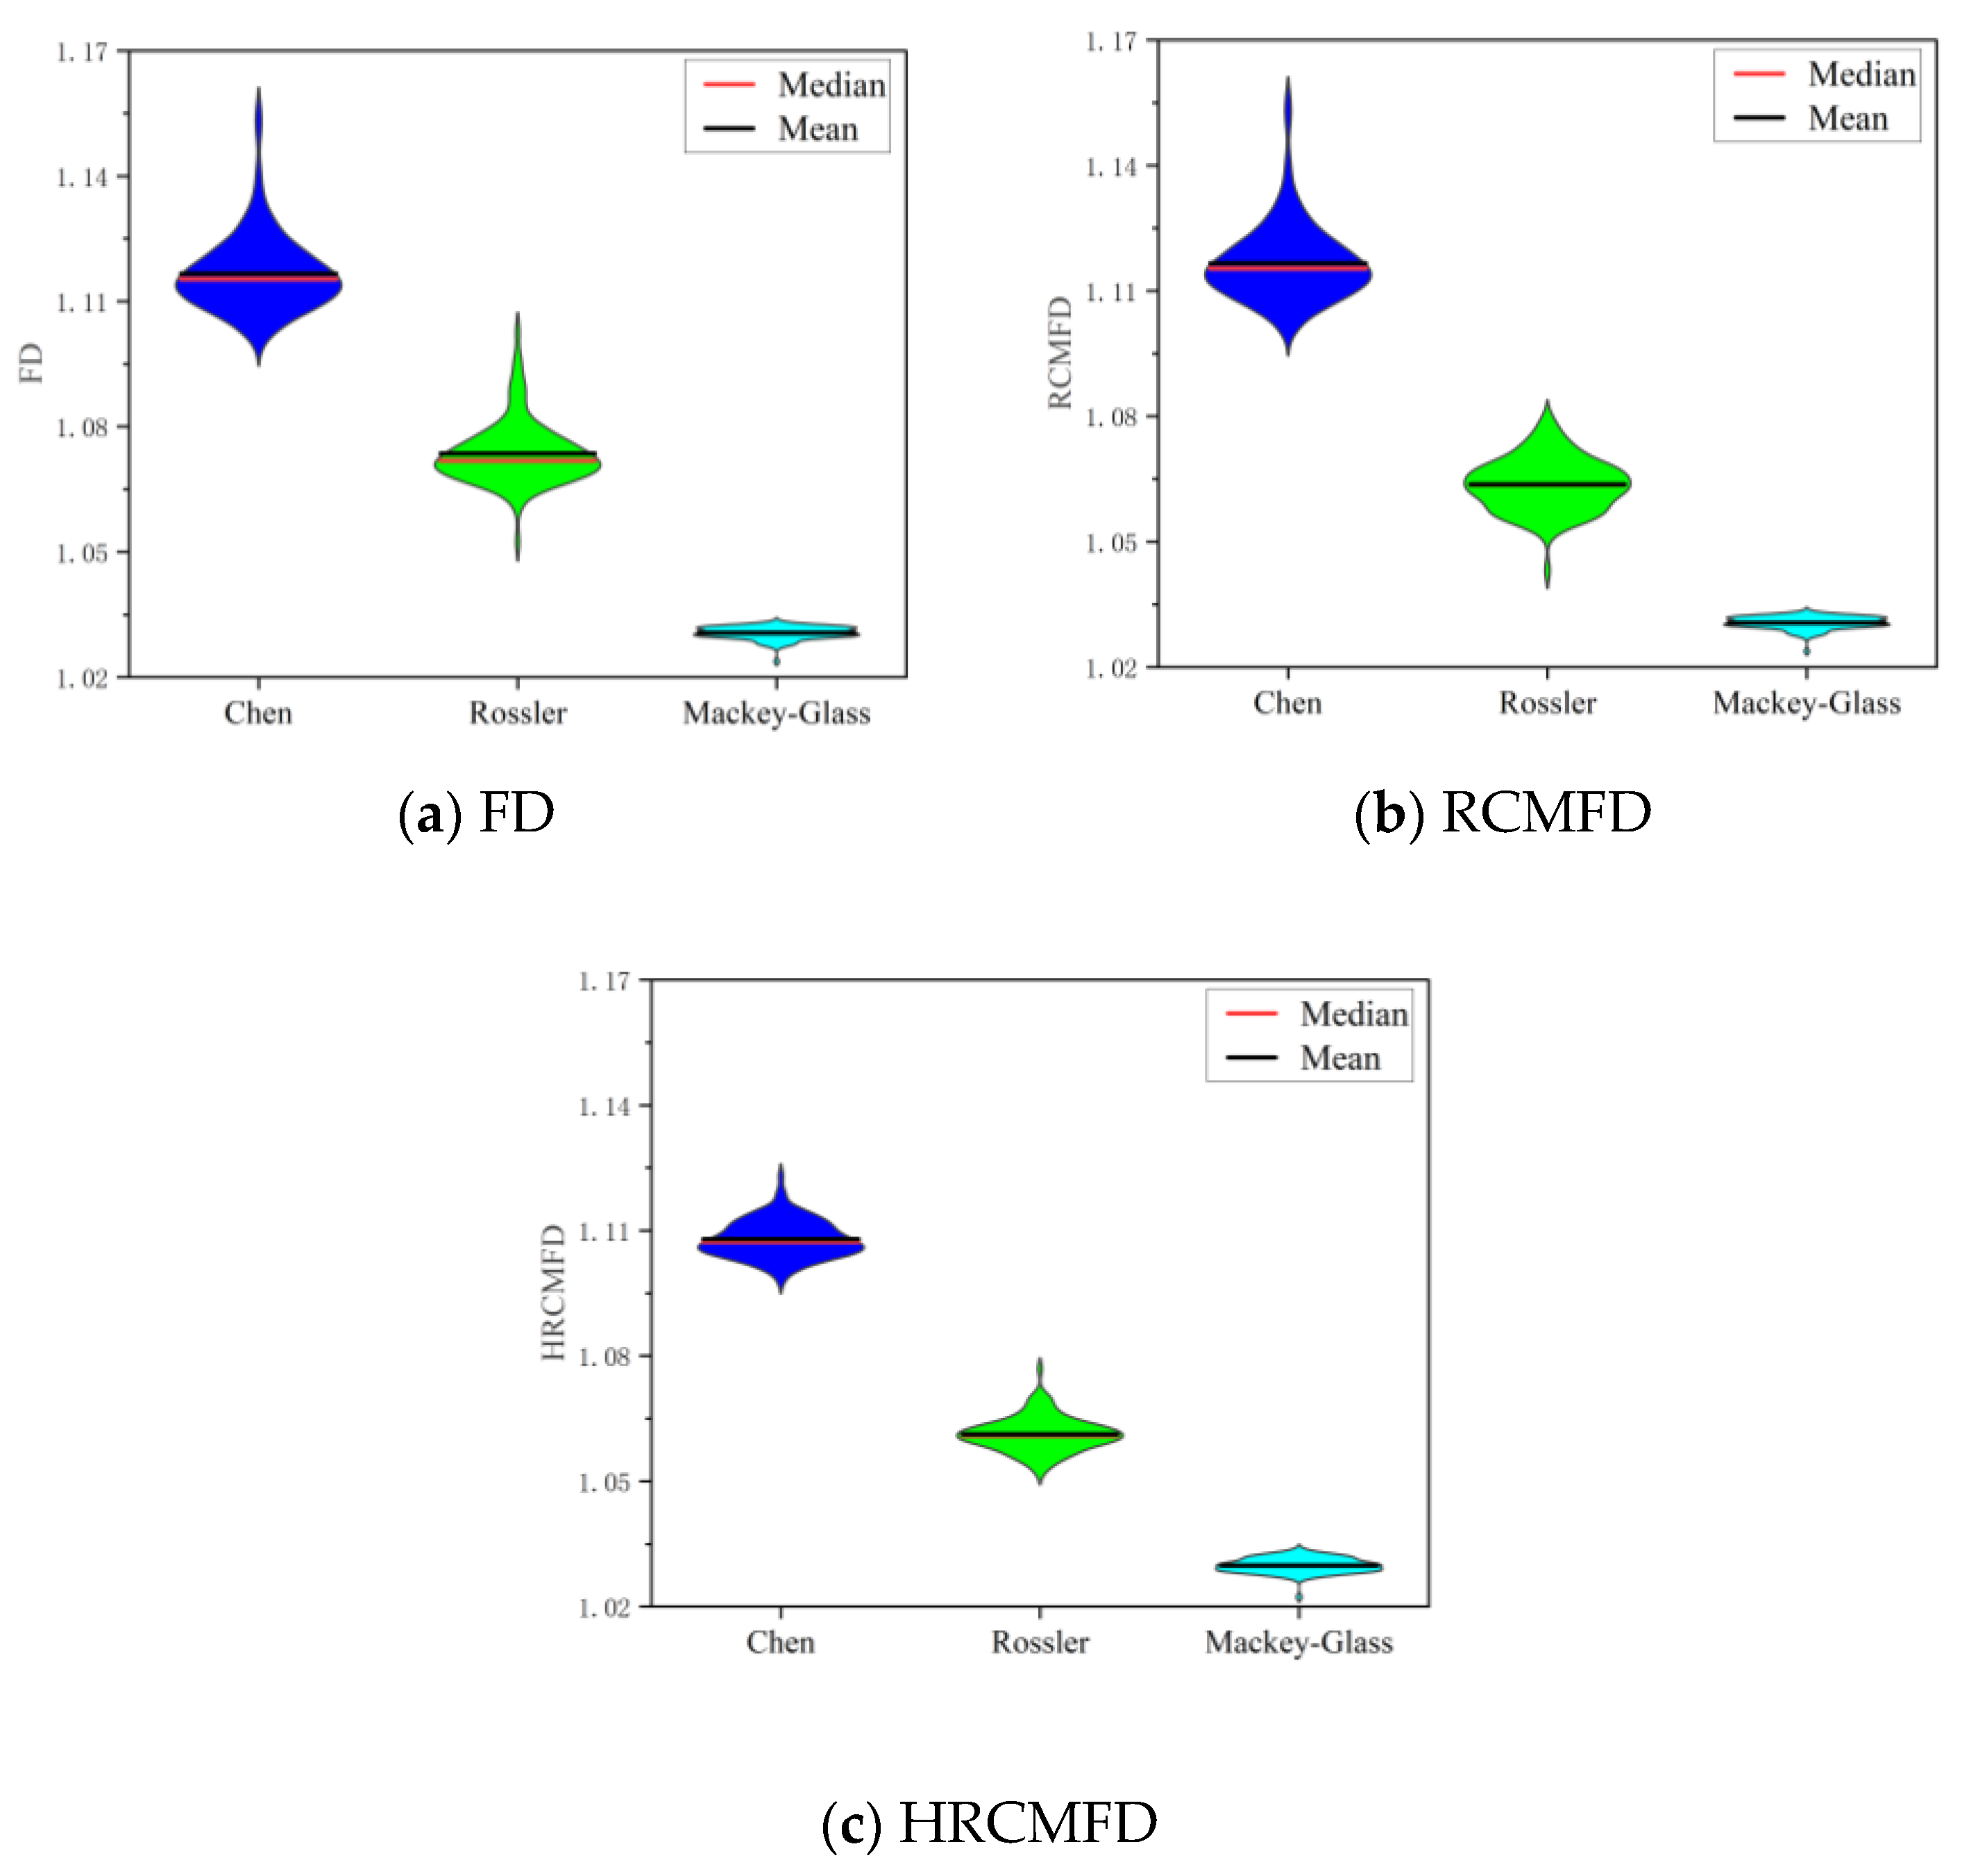
To judge the advantages and disadvantages of FD, RCMFD, and HRCMFD, we use them to extract single features of the complexity of three simulated signals. The single feature distribution of the three fractal dimension indexes for simulated signals is shown in Figure 8. From Figure 8, for each sub-figure, the median and mean values of three simulated signal features are significantly different; only Mackey–Glass signals can be distinguished by all indexes; Chen signals and Rossler signals have overlapping areas in the feature distribution figure of FD, but there is no overlap in the feature distribution figure of RCMFD and HRCMFD, which displays that the separability of RCMFD and HRCMFD is better for the three simulated signals; for RCMFD and HRCMFD, the feature distribution of the three simulated signals of HRCMFD is more compact, which indicates that HRCMFD is more stable when extracting the feature of three simulated signals. Therefore, it can be concluded that RCMFD and HRCMFD can distinguish the three kinds of simulated signals when they have a single feature, and HRCMFD has the best discrimination effect for the three simulated signals.

4.3. Multi-Feature Characterization of Simulated Signals

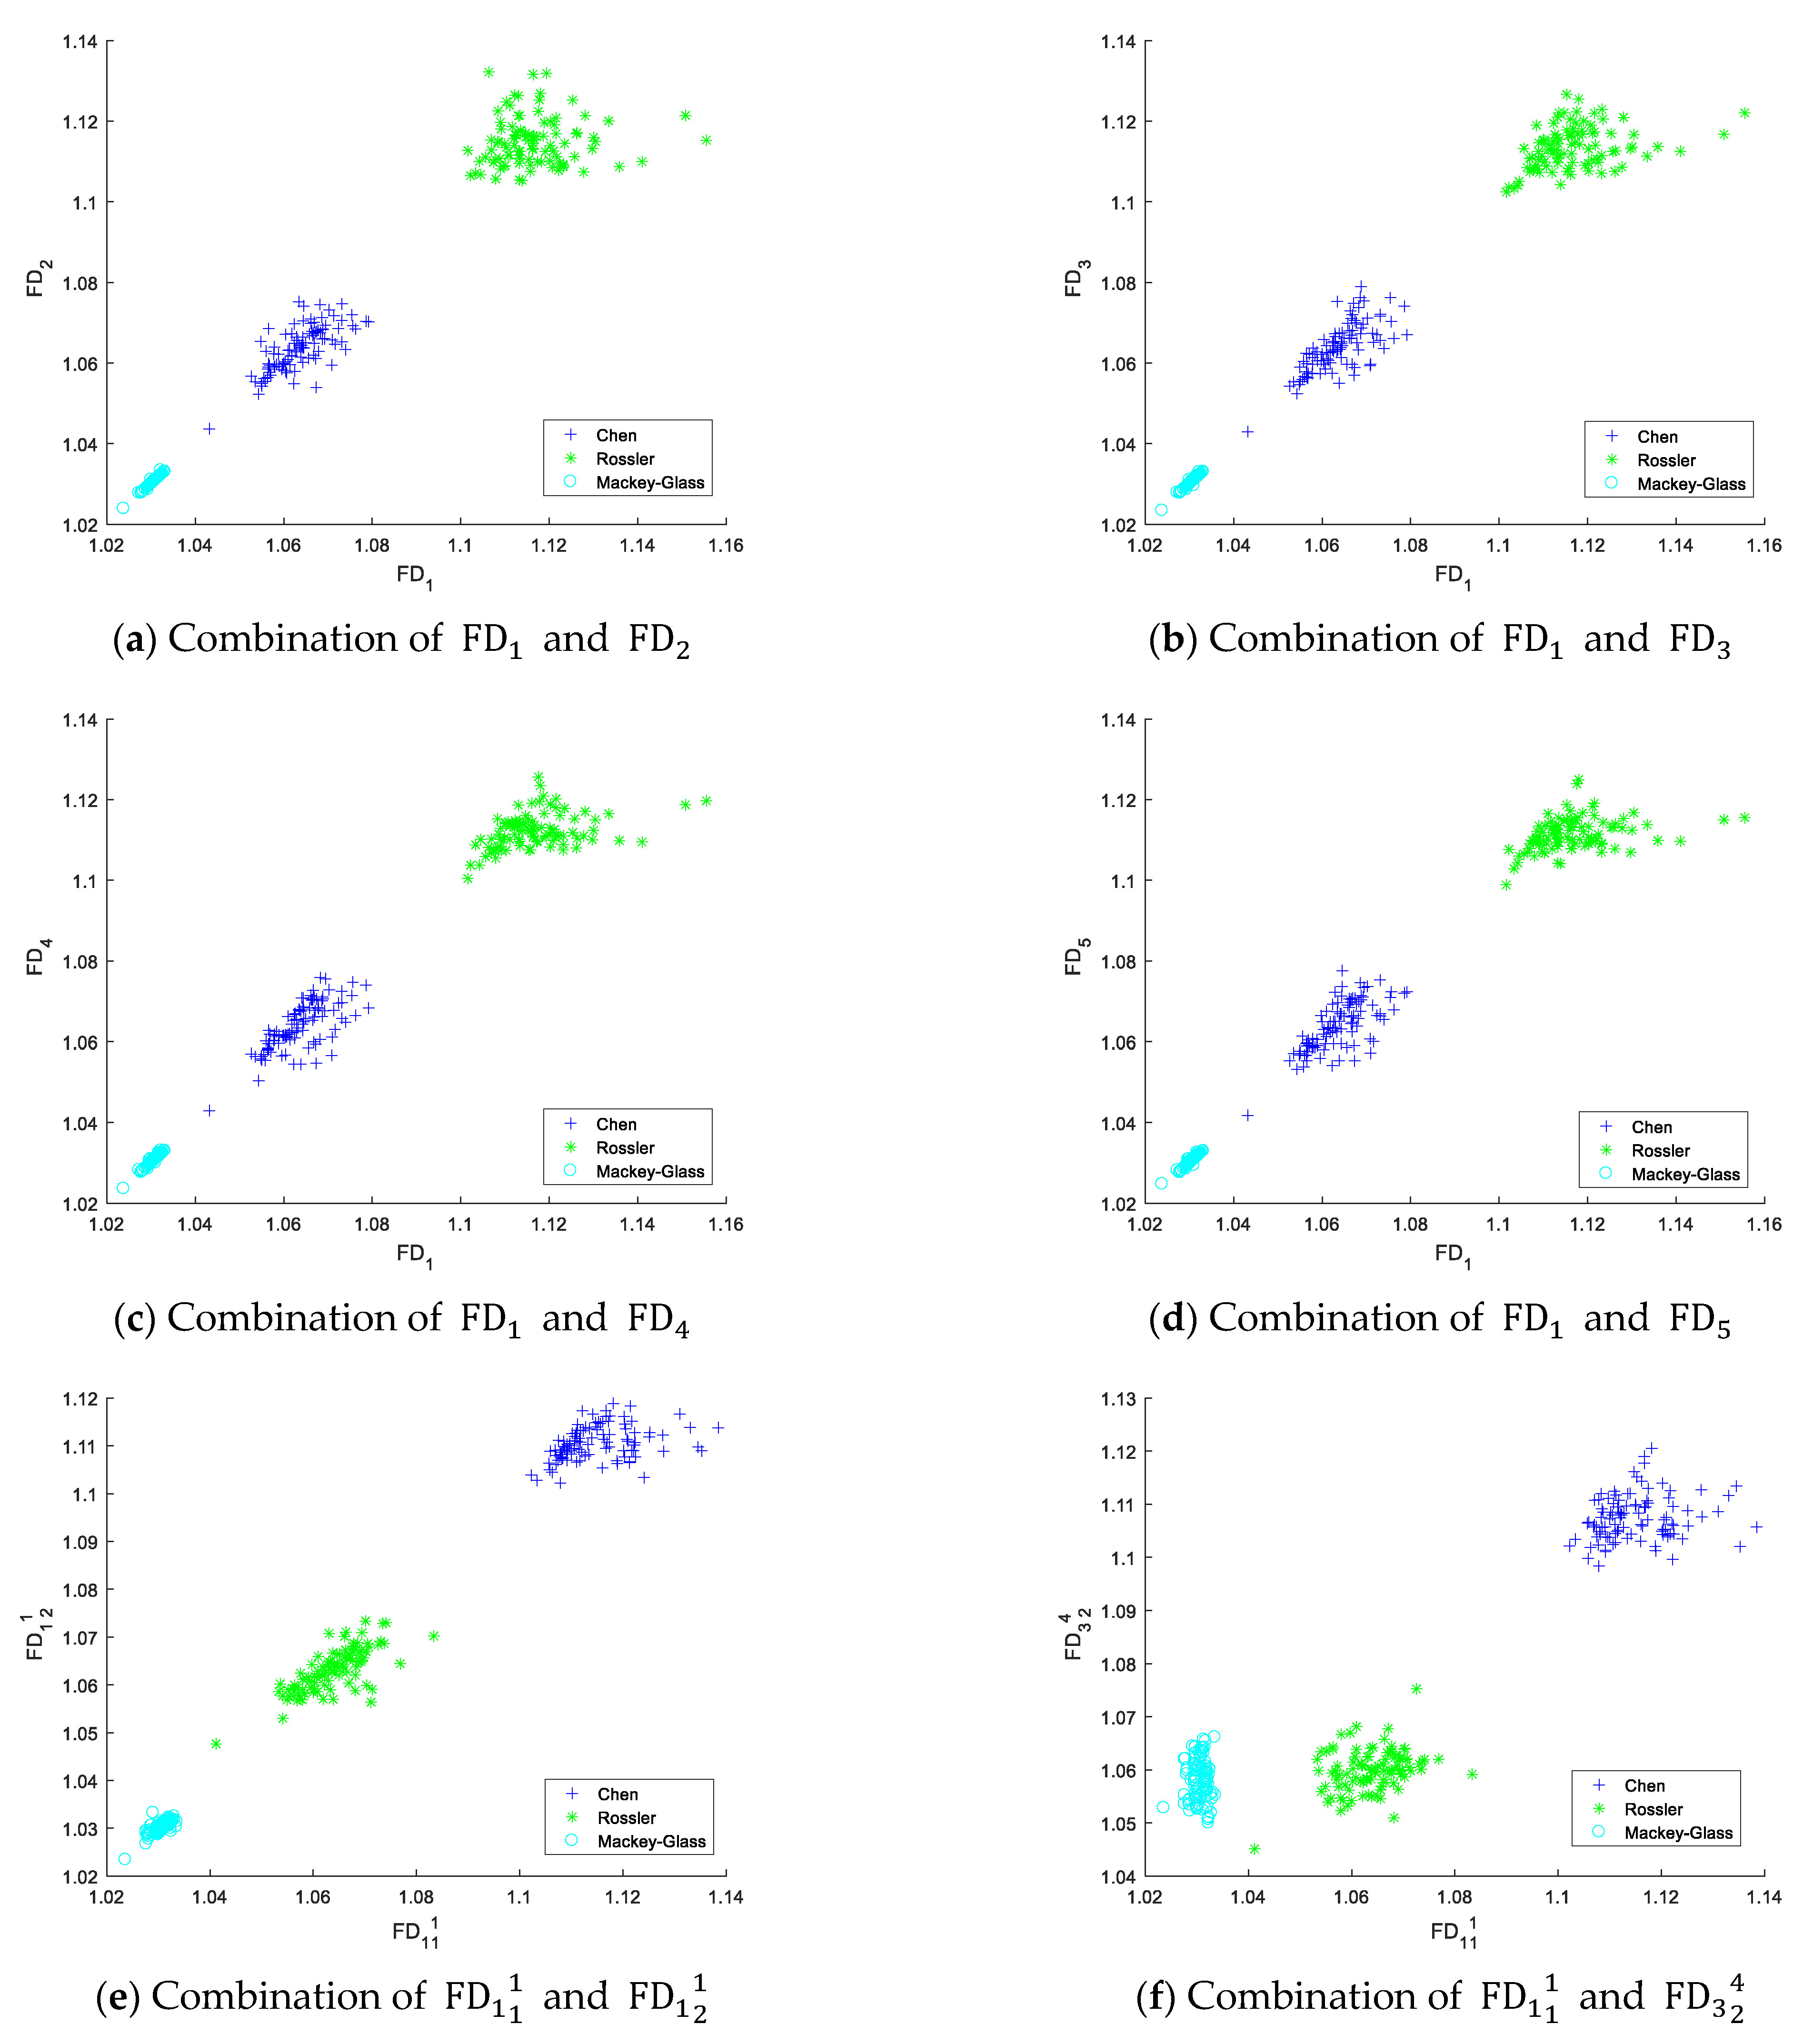
To more comprehensively compare the ability of the three indexes to distinguish simulated signals, the multi-feature distribution map of the three signals is drawn. Nevertheless, FD only reflects a single feature of the simulated signal, while RCMFD and HRCMFD improve the ability of FD to reflect the signal and can express the information of multi-feature of the signal. Figure 9 shows the feature distribution map of two fractal dimension indexes for simulated signals, where F D 1 represents the feature that RCMFD uses SF1. SF1 is the feature of the signal in the first scale, SF2 is the feature in the second scale, F D 1 1 1 represents the feature in which HRCMFD adopts the HRCMFD of the 1th node of the 1th layer under SF1, and so on. In Figure 9, form sub-figures (a–d), RCMFD can reflect and distinguish three kinds of simulated signals at each scale, and its ability to distinguish simulated signals is better under double features than under a single feature; in sub-figures (e,f), HRCMFD can completely distinguish three signals at different scales under each layer. These results indicate that RCMFD and HRCMFD are able to reflect more effective information, and RCMFD and HRCMFD can provide different scale information of the original signal and sub-frequency bands.

5. Feature Extraction of SRN

5.1. Data Sources of SRNs and Parameter Settings of Nonlinear Dynamic Indexes

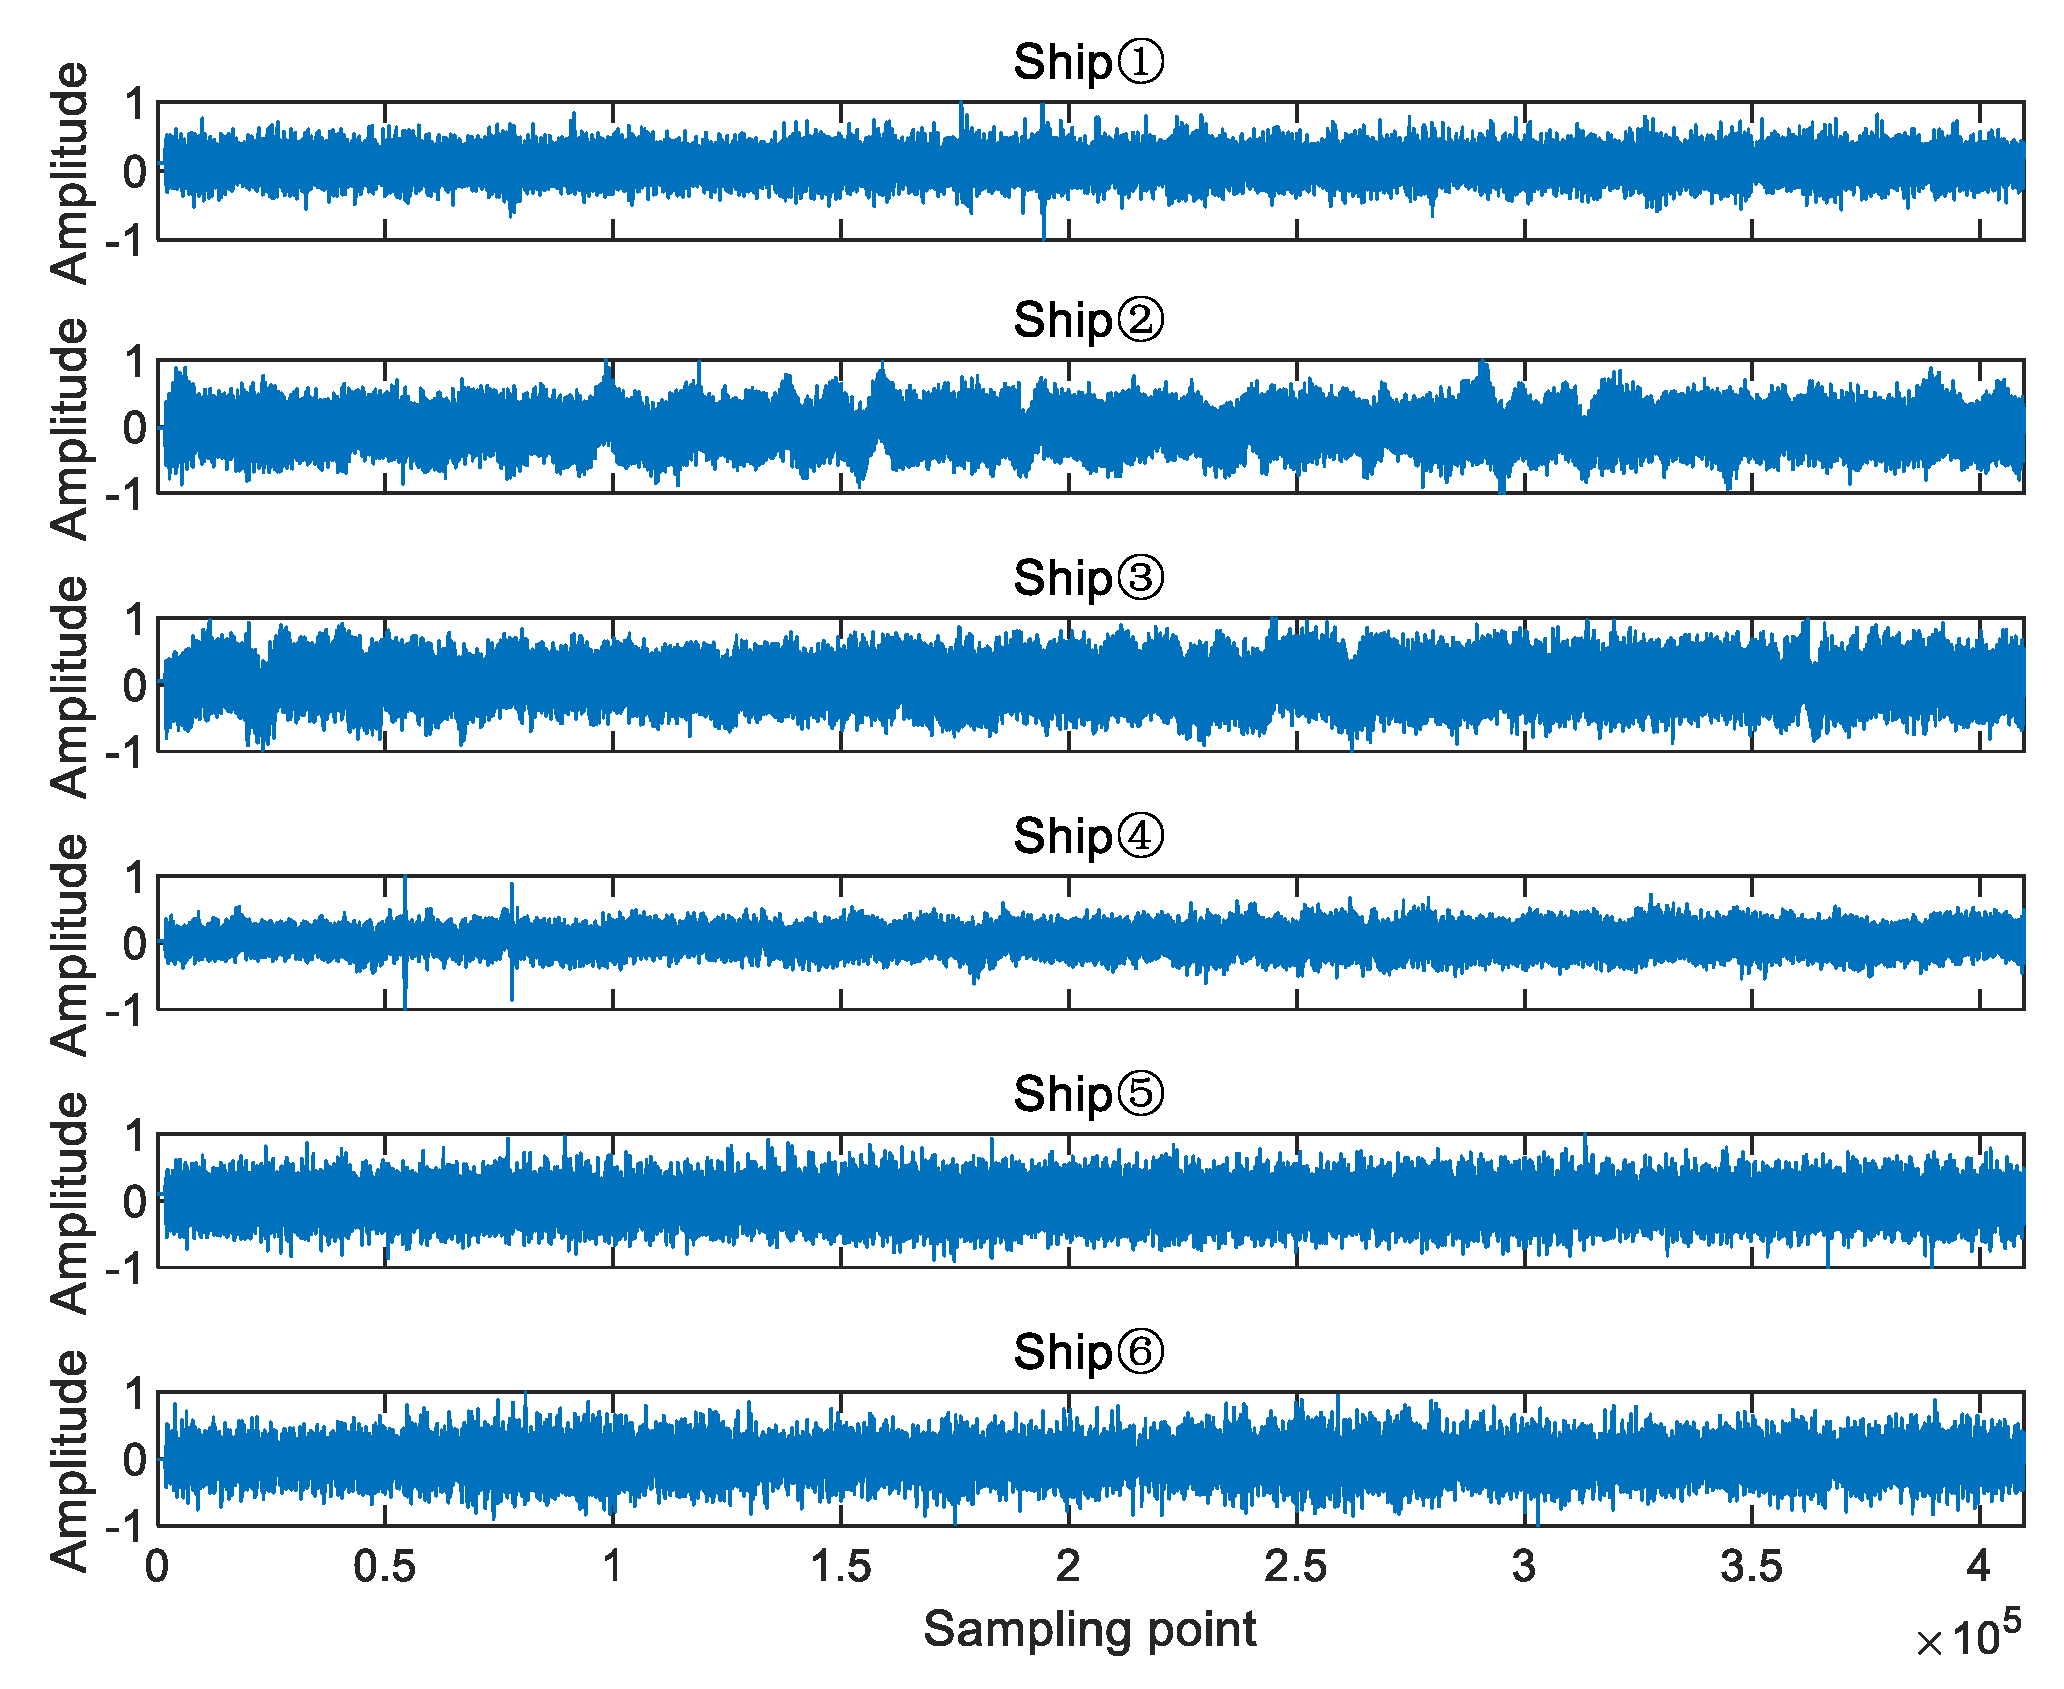
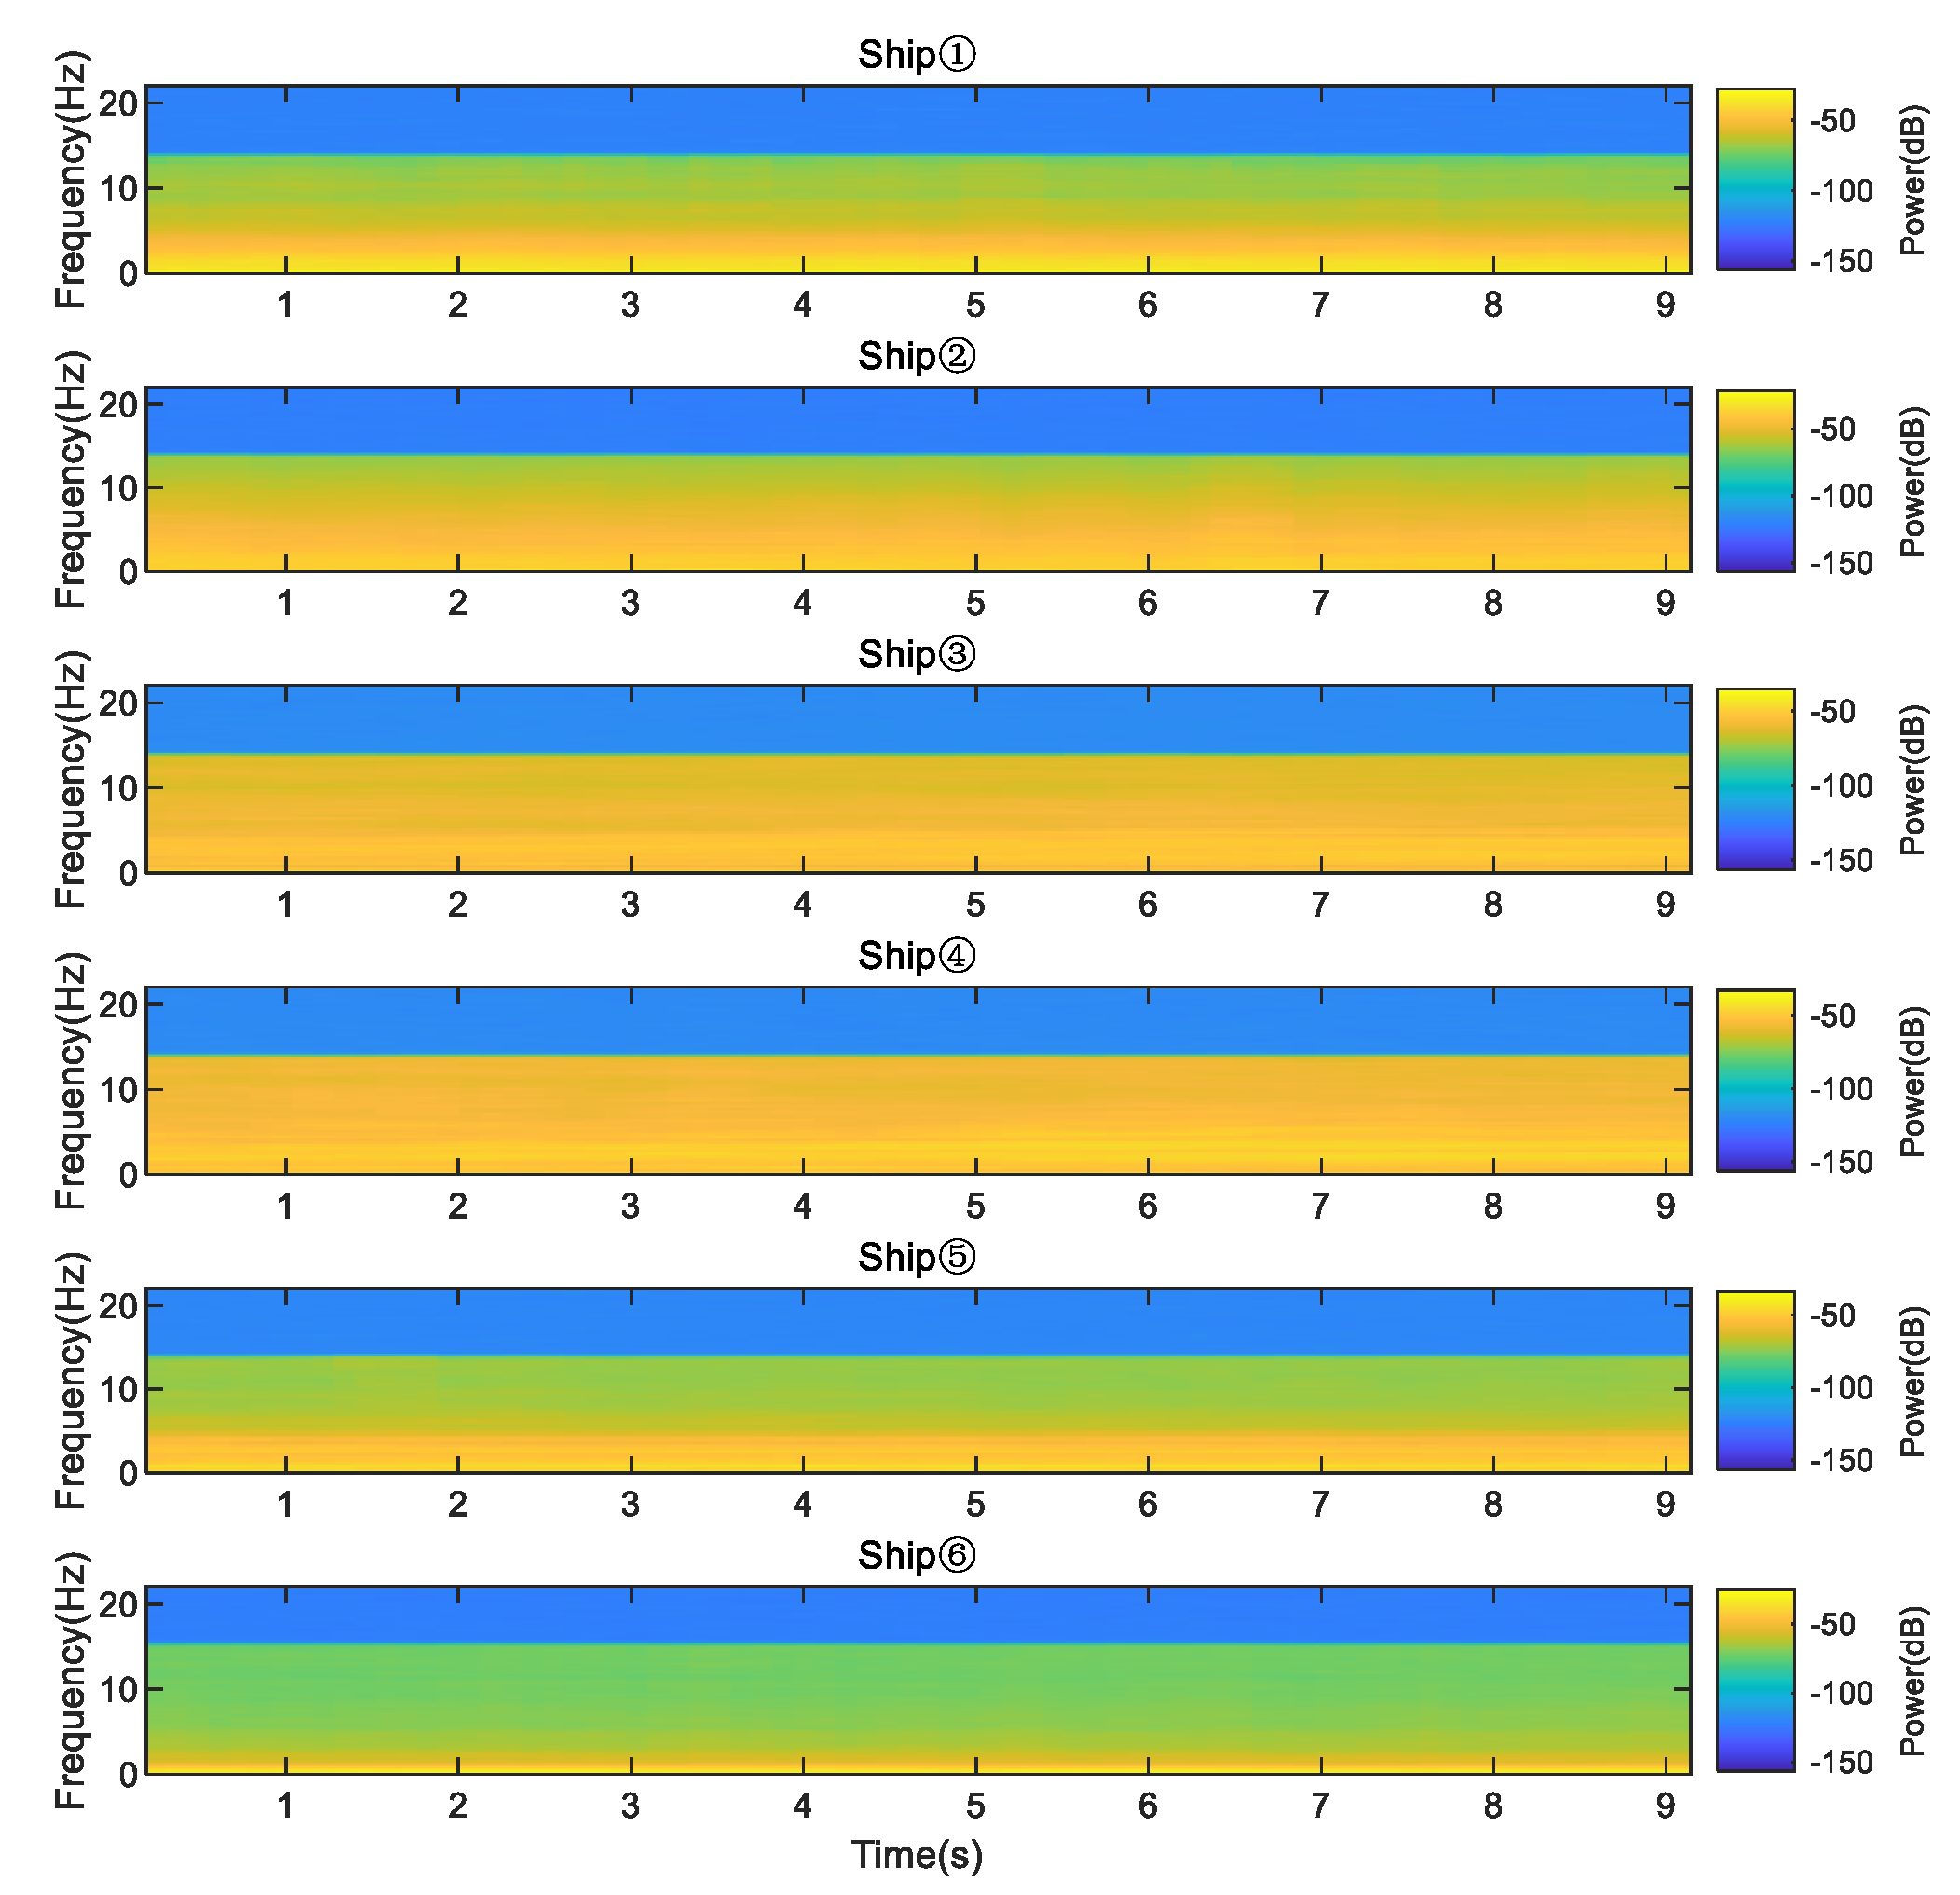
Six different SRNs (State Ferry Hydrophone, Freighter Hydrophone, Outboard Engine at 10 Knots, Outboard Engine at 20 Knots, Small Diesel Engine Hydrophone, and Cruise Ship Underwater) are randomly selected as the research objects from the same website [42], and they are named Ship①, Ship②, Ship③, Ship④, Ship⑤, and Ship⑥. A total of 409,600 sample points were taken for each type of SRN and evenly divided into 100 samples without overlap. Figure 10 presents the time domain waveforms of six types of SRNs. Figure 11 shows the frequency spectrogram of six types of SRNs.
From Figure 11, it can be seen that the main powers of the six SRNs are present in the low-frequency band, where the spectrograms of Ship① to Ship④ are very much alike, and the spectrograms of Ship⑤ and Ship⑥ are also similar; therefore, it can be concluded that the six SRNs cannot be distinguished from the perspective of the time-frequency domain. In the subsequent study, we choose to use the fractal dimension, a nonlinear dynamical index, for feature extraction to achieve an accurate classification of SRN.
To highlight the advantages of the proposed RCMFD and HRCMFD, six nonlinear dynamic indexes are introduced for comparison, including refined composite multi-scale DE (RCMDE), refined composite multi-scale LZC (RCMLZC), refined composite multi-scale PE (RCMPE), hierarchical RCMDE (HRCMDE), hierarchical RCMLZC (HRCMLZC), and hierarchical RCMPE (HRCMPE). Table 1 shows the parameter settings of eight kinds of nonlinear dynamic indexes.

5.2. Feature Extraction Using Indexes Based on RCMP

5.2.1. Single Feature Extraction and Classification

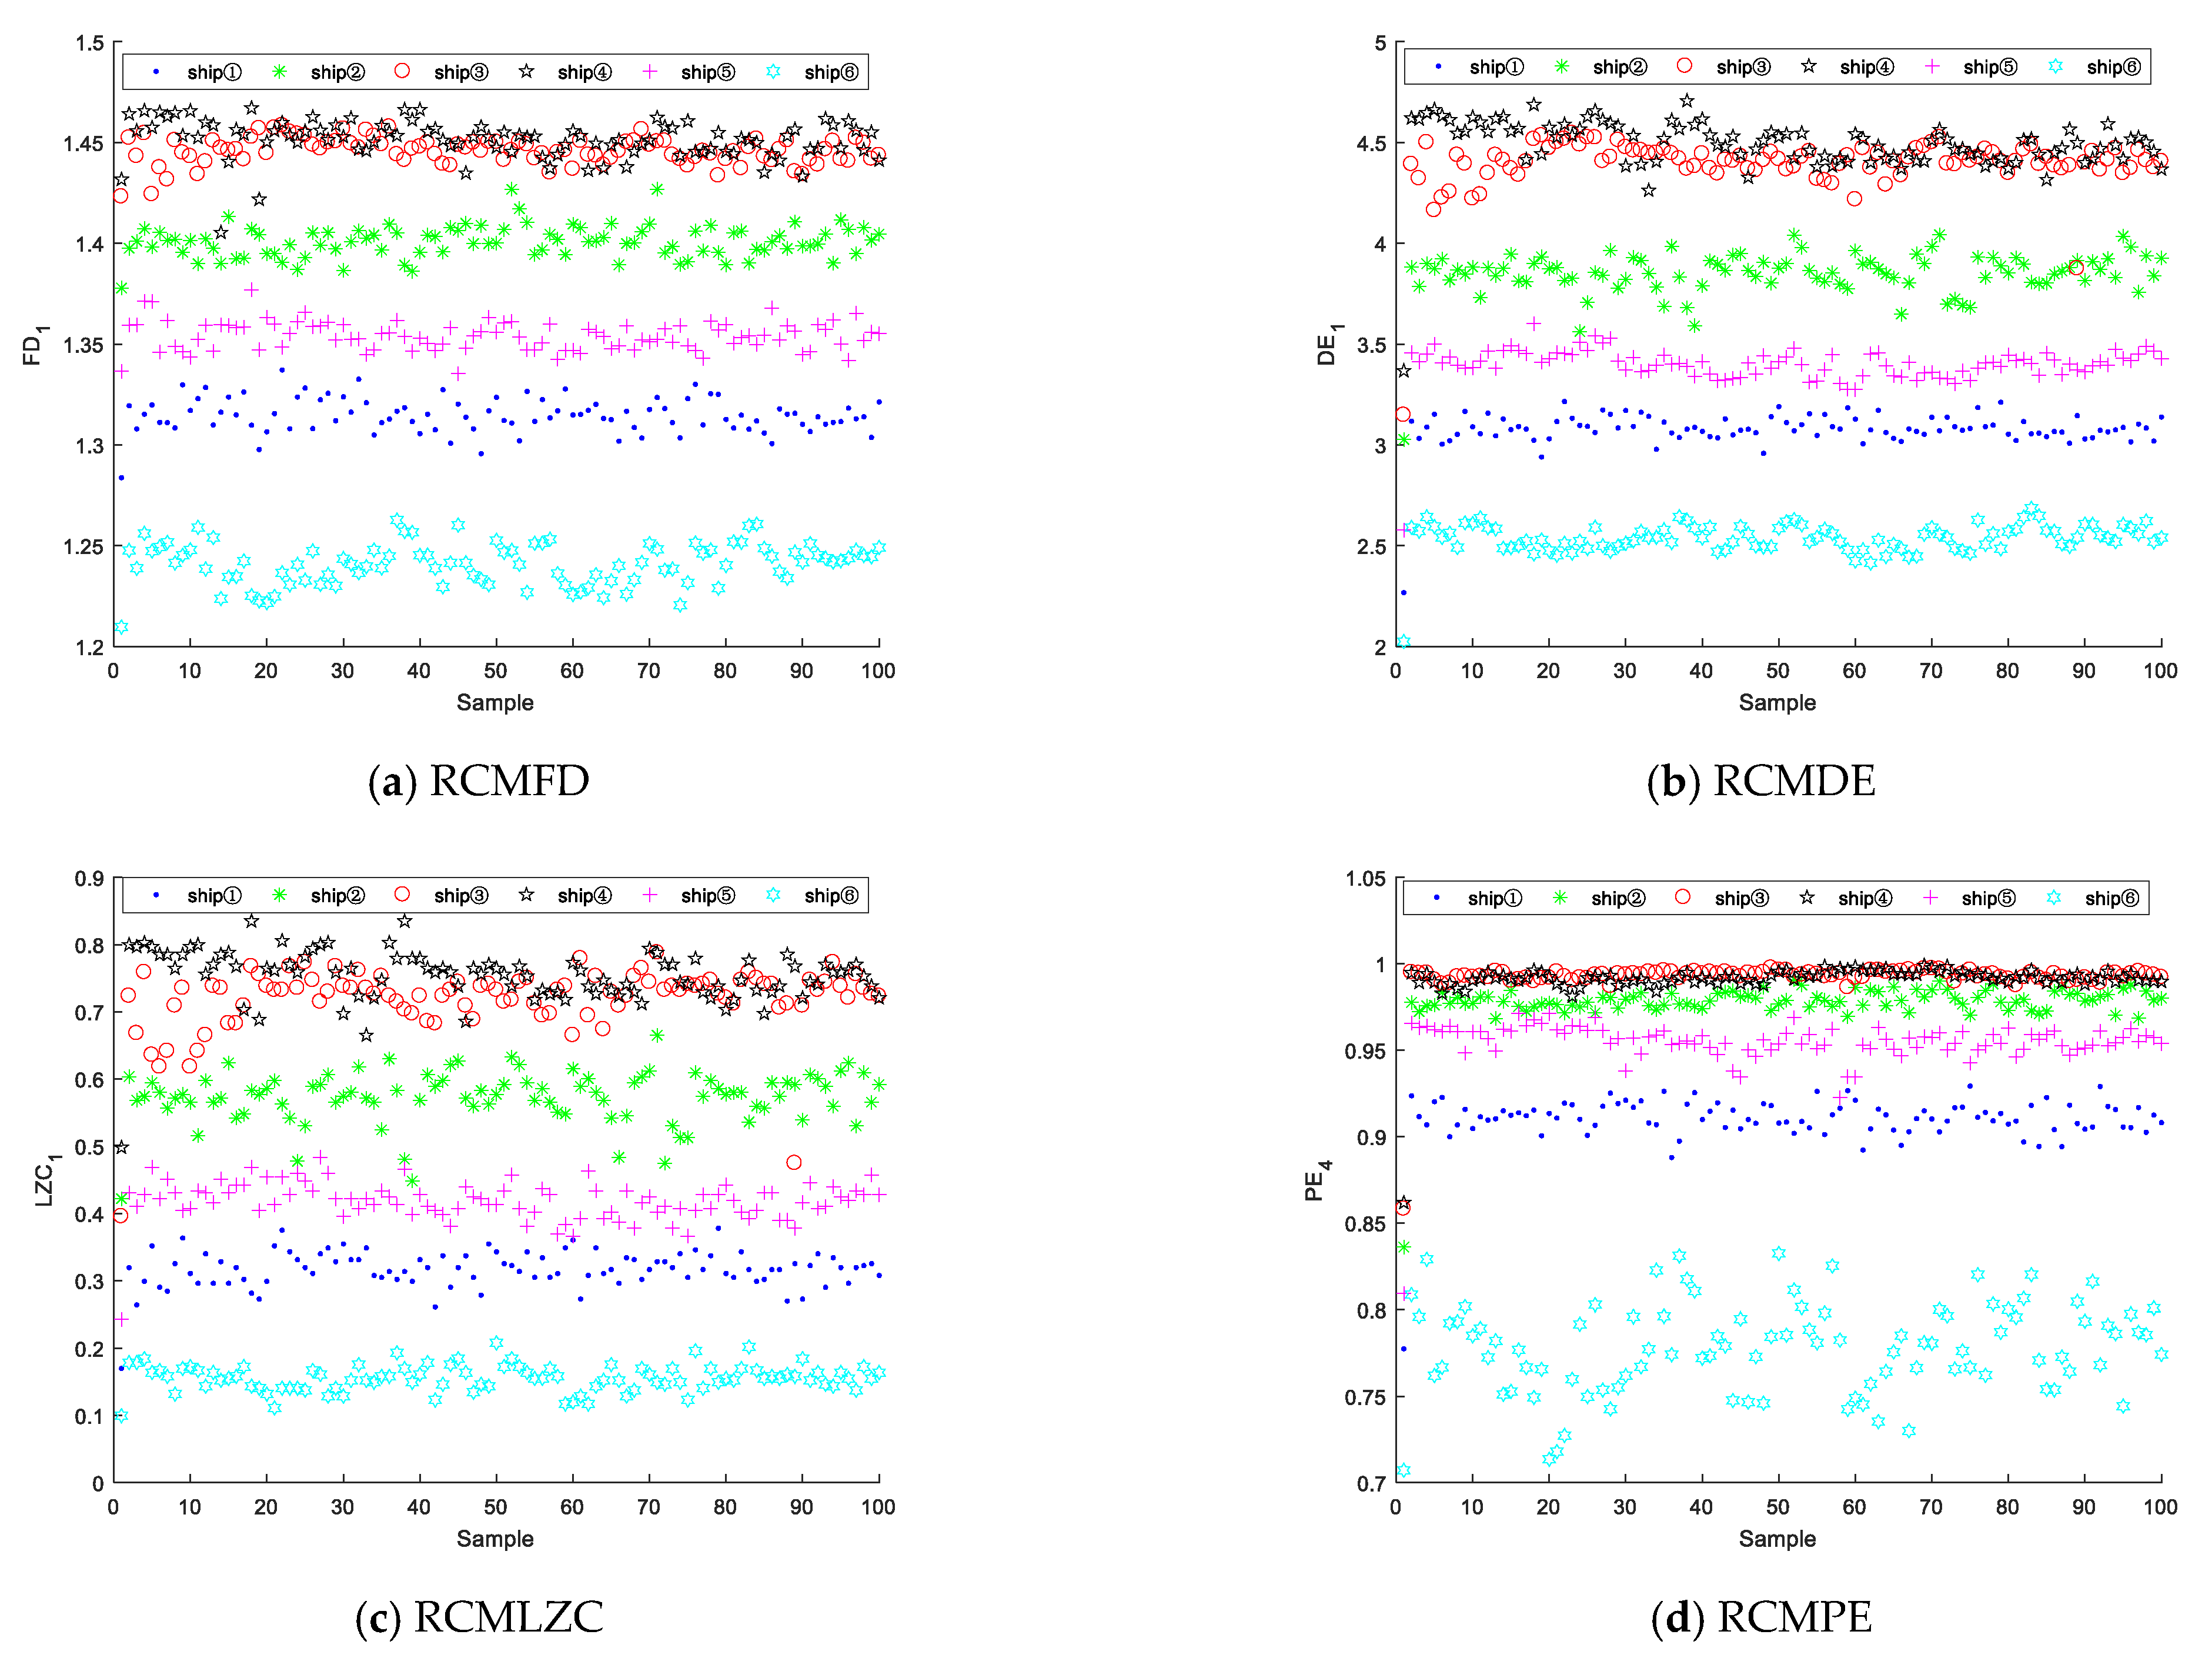
The nonlinear dynamic feature extraction methods based on RCMFD, RCMDE, RCMLZC, and RCMPE are used to extract and classify the six SRNs and compare the feature extraction effects. Figure 12 presents the single feature distribution results of four indexes based on RCMP corresponding to the highest average recognition rate (HARR), where F D 1 represents that RCMFD uses the feature of SF1, D E 1 represents that RCMDE uses the feature of SF1, and so on. It can be seen from Figure 12 that the features of Ship③ and Ship④ in the distribution figure of all indexes overlap seriously; compared with Figure 12a–c, the SRNs of d are the most overlapped, and Ship①, Ship②, Ship⑤, and Ship⑥ of (a) to (c) are independent of each other, while the SRN of (d) is only relatively independent of Ship⑥; therefore, RCMPE is more difficult for distinguishing six SRNs. The results show that compared with the feature extraction method based on RCMPE, the feature extraction method based on RCMLZC, RCMFD, and RCMDE has better recognition effects for six SRNs.
To more intuitively compare the recognition results of the four indexes for six SRNs, the recognition rate (RR) of each SRN under four indexes is calculated. Table 2 presents the HARR of a single feature for six types of SRNs corresponding to four nonlinear dynamic indexes based on RCMP. From Table 2, it can be seen that the HARR of all methods is lower than 85%, of which the highest is RCMFD and the lowest is RCMPE; the RR of four methods for Ship⑥ is 100%, and the feature extraction method based on RCMFD for ship① is 100% only; Ship④ and Ship③ are the most difficult to recognize, as the RR of all indexes is lower than 65%. Finally, to draw a conclusion, the single feature extraction method cannot accurately distinguish six types of SRNs.

5.2.2. Double-Feature Extraction and Classification

The double-feature extraction method based on RCMFD, RCMDE, RCMLZC, and RCMPE is adopted to improve the RR of six types of SRN. Their highest RRs are calculated separately. Figure 13 shows the double-feature distribution results of four nonlinear dynamic indexes based on RCMP corresponding to the HARR. Similar to the single-feature distribution, for the four indexes, the hardest SRNs to recognize are Ship③ and Ship④, among which Ship③ and Ship④ features of RCMPE almost overlap, and Ship⑥ is the easiest to identify; for RCMFD, compared with the other three indexes, the features of each SRN are relatively aggregated, and there is less overlap between the features of each SRN. Therefore, it can be concluded that RCMFD performs better in identifying six SRNs than the other three nonlinear dynamic indexes based on RCMP.
The HARR for each SRN under four indexes is calculated, and Table 3 presents the HARR of the double feature for six types of SRNs corresponding to four nonlinear dynamic indexes based on RCMP, in which F D 1 & F D 5 means double features of the RCMFD under SF1 and SF5, D E 2 & D E 5 signifies double features of the RCMDE under SF2 and SF5, and so on. As seen from Table 3, compared with a single feature, the HARR of all indexes in the double feature is improved; consistent with the feature distribution results, Ship③ and Ship④ are the most difficult to identify, the average recognition rate (ARR) of Ship⑥ is the highest, and there are three groups of feature extraction methods that have achieved a 100% RR for Ship⑥; when the HARR is reached, the feature combination of other indexes includes SF1 except RCMDE; RCMFD has the HARR for six types of SRNs, among which the RR for two SRNs reaches 100%. In conclusion, the feature extraction method based on RCMFD has the best recognition effect for six types of SRNs.

5.2.3. Multi-Feature Extraction and Classification

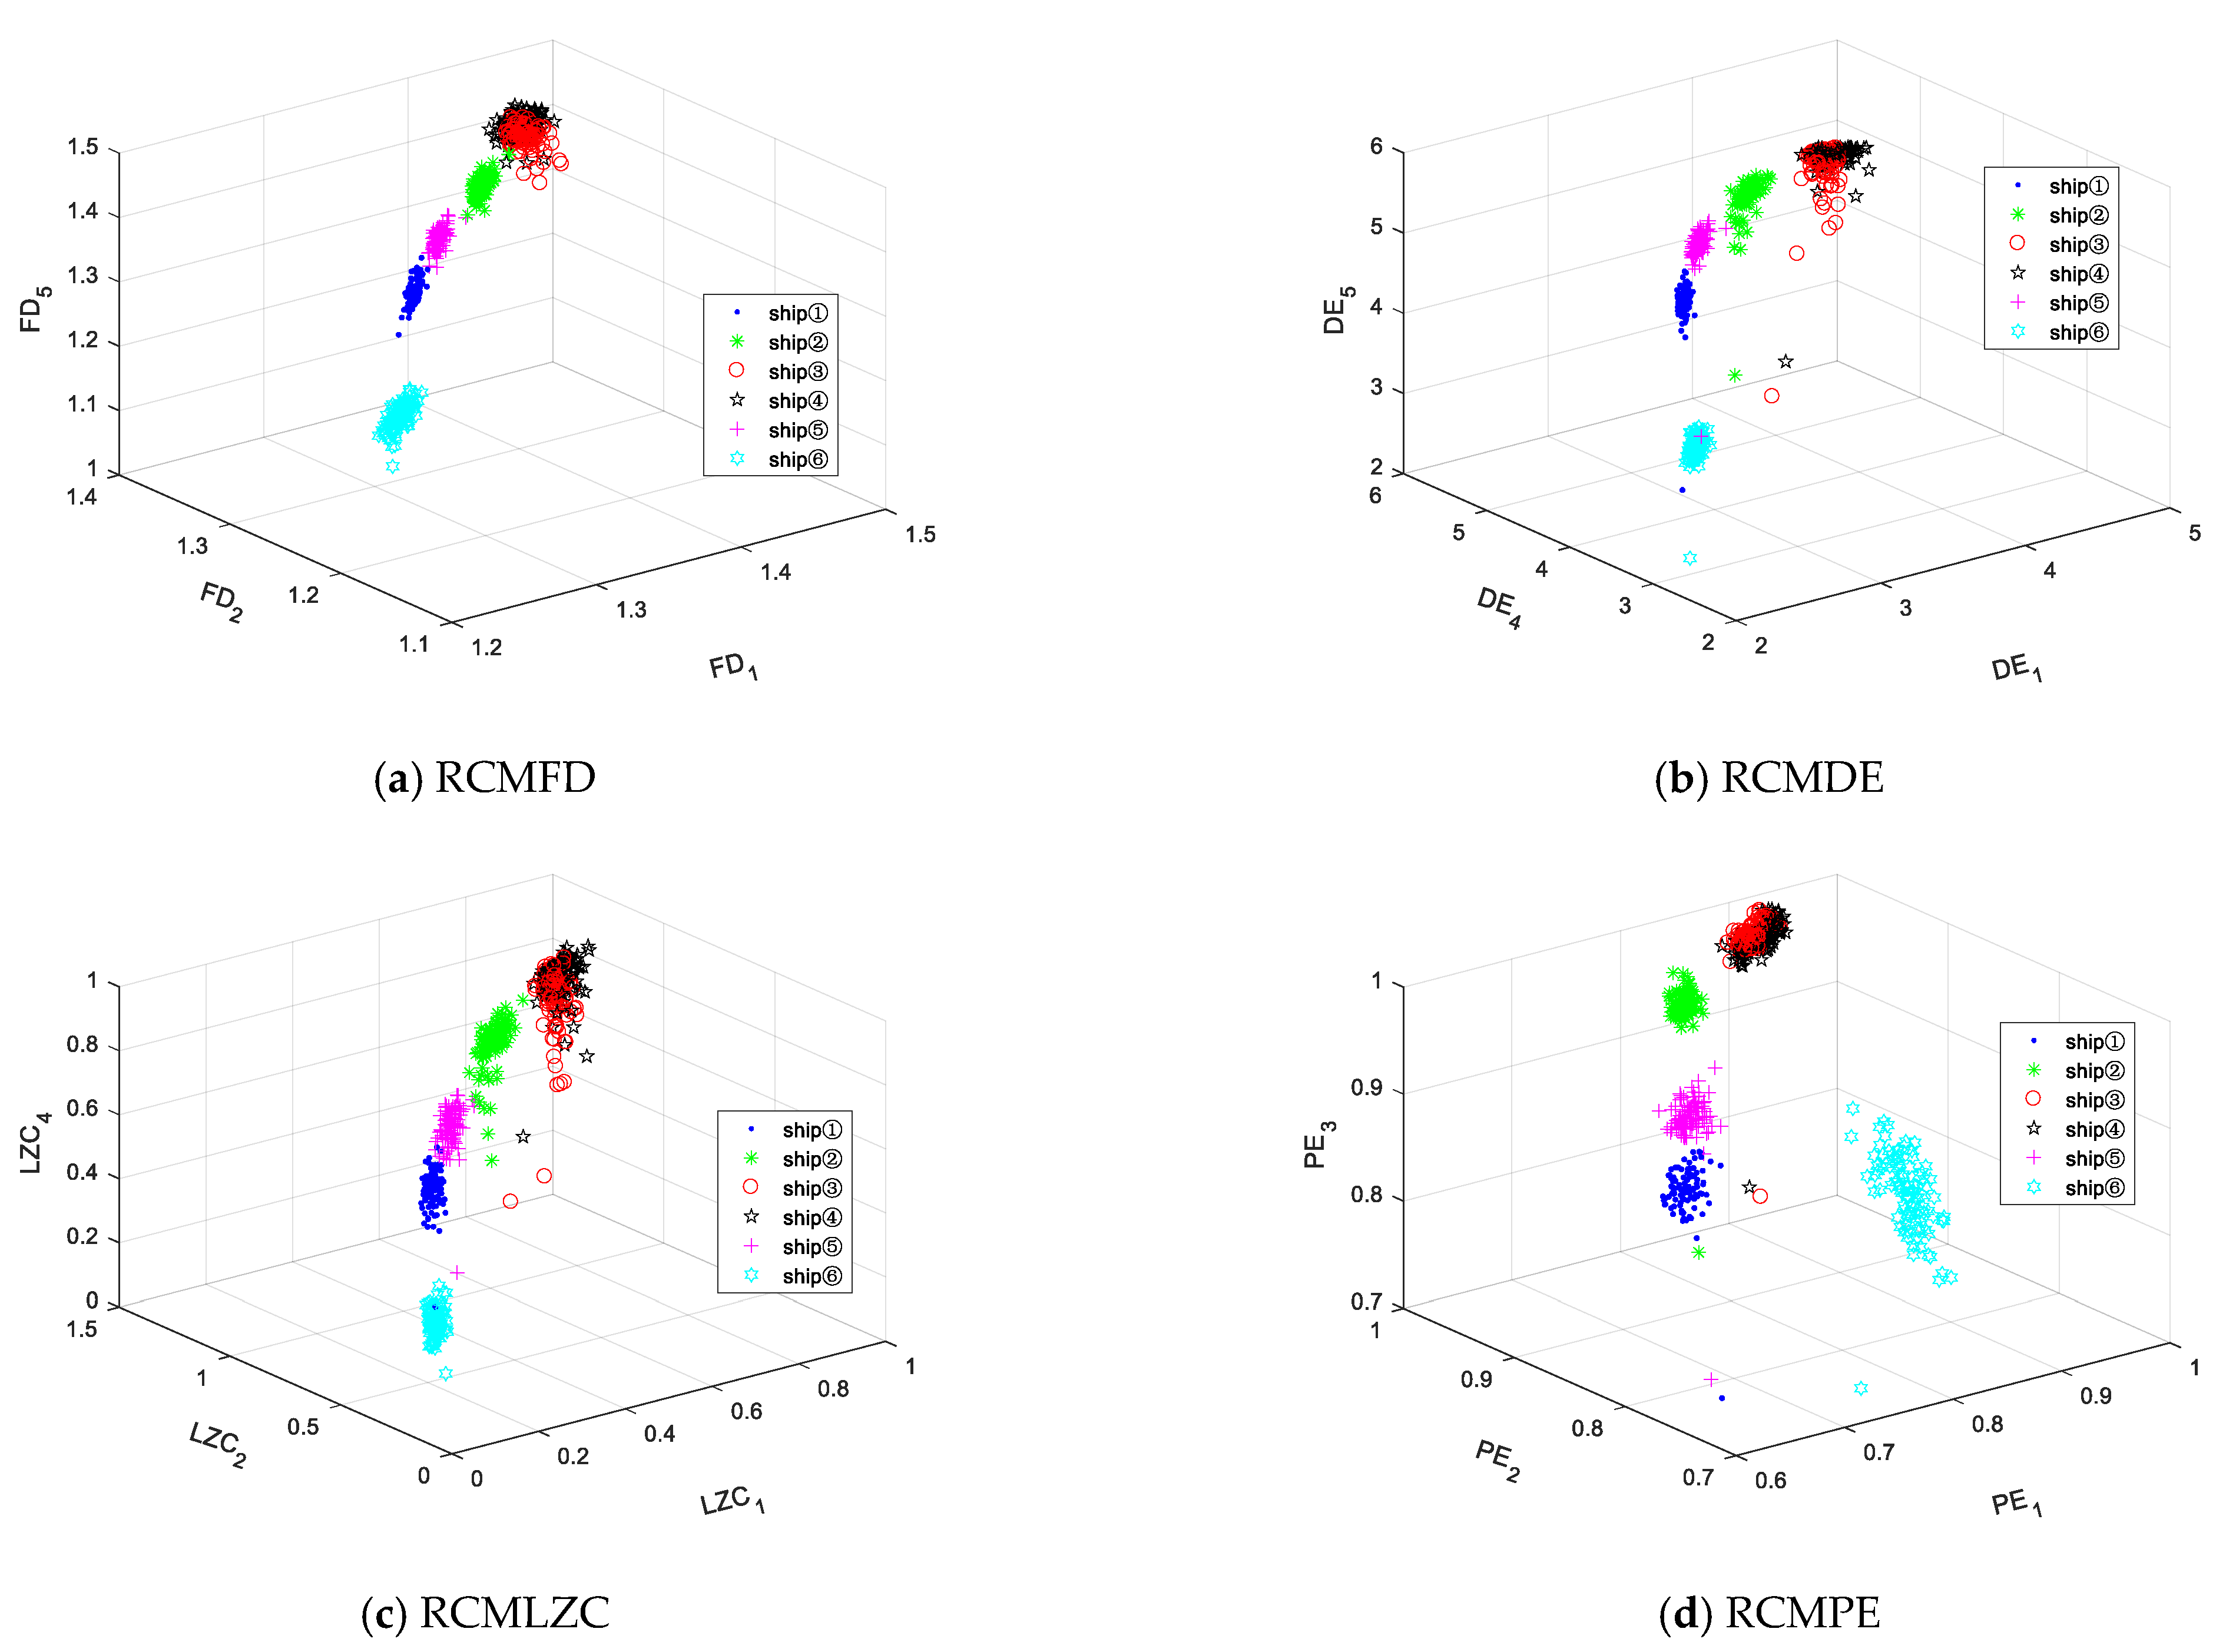
To further verify the effect of the feature quantity on feature extraction, triple-feature extraction methods based on the above-mentioned indexes are adopted to extract and classify six types of SRNs. Figure 14 displays the triple-feature distribution results of four nonlinear dynamic indexes based on RCMP corresponding to the HARR. It can be observed that there is little difference between the triple features and double features when distinguishing six SRNs; Ship③ and Ship④ are the worst to identify, and Ship⑥ is the easiest to distinguish among all the feature distributions; the feature distribution of each SRN in the RCMFD distribution figure is the most concentrated and has only a few overlapping parts. In other words, the distinguishing capability of the feature extraction method based on RCMFD for six types of SRNs is better than that of other feature extraction methods.
Different from single and double features, due to the limited space of this paper, we only list the HARR under the features of three, four, and five. Table 3 presents the HARR of multi-feature for six types of SRNs corresponding to four nonlinear dynamic indexes based on RCMP, in which F D 1 & F D 2 & F D 5 denotes three features of the RCMFD under SF1, SF2, and SF5, F D 1 & F D 2 & F D 4 & F D 5 represents four features of the RCMFD under SF1, SF2, SF4, and SF5, and so on. According to Table 4, all feature combinations with the HARR contain SF1; the HARR of all indexes shows a downward trend, among which RCMLZC is the most obvious; the HARR of RCMFD is the highest, but it is only slightly more than 90%. To conclude, compared with other methods, the feature extraction method based on RCMFD has the best RR for six SRNs.

5.3. Feature Extraction Using Indexes Based on HRCMP

5.3.1. Single-Feature Extraction and Classification

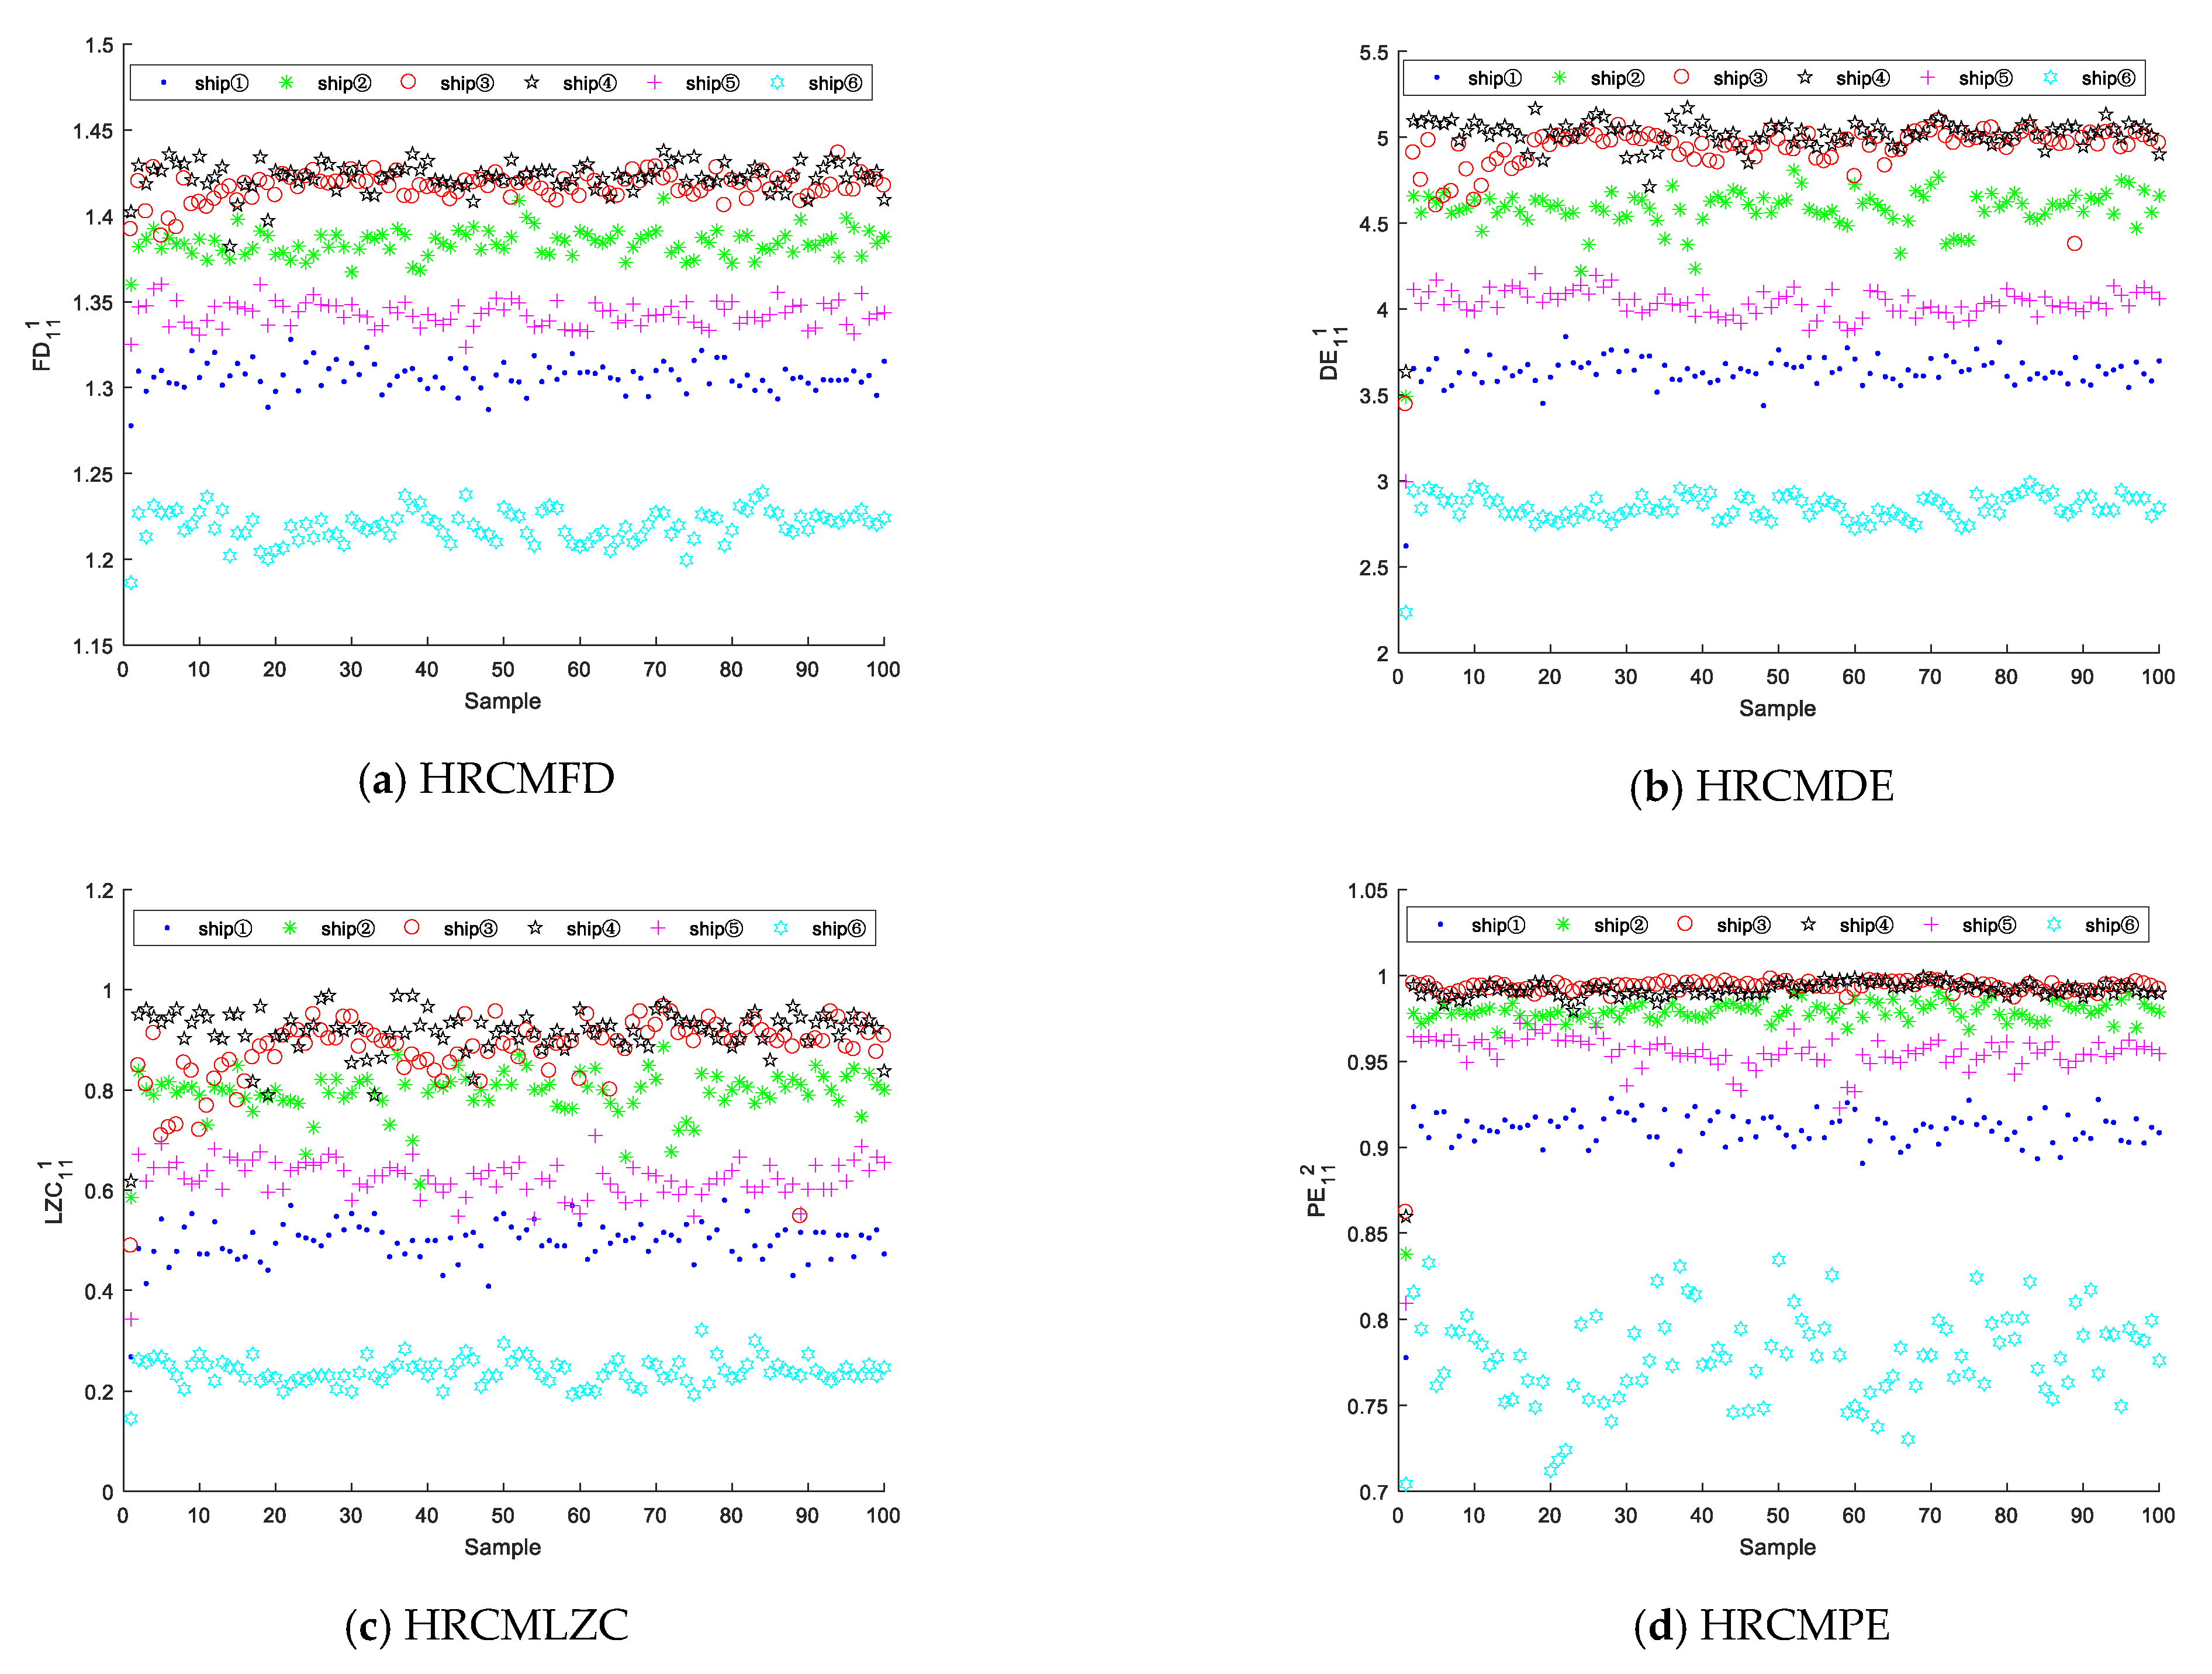
Because the refined composite indexes cannot distinguish the six SRNs well, hierarchical information is introduced to improve the recognition effect of the refined composite indexes for the six SRNs. Four nonlinear dynamic indexes, HRCMFD, HRCMDE, HRCMLZC, and HRCMPE, are introduced for feature extraction experiments. Figure 15 displays the single feature distribution results of four nonlinear dynamic indexes based on HRCMP corresponding to the HARR, where F D 1 1 1 represents the feature in which HRCMFD uses the hierarchical component of the 1th node of the 1th layer under SF1, D E 1 1 1 represents the feature in which HRCMDE uses the hierarchical component of the 1th node of the 1th layer under SF1, and so on. Figure 15 shows that similar to refined composite indexes, the four indexes based on HRCMP cannot distinguish Ship③ and Ship④, especially when Ship③ and Ship④ are almost completely mixed together in the distribution figure of HRCMPE, and Ship⑥ is best distinguished; in the HRCMLZC feature distribution, there are three types of SRNs mixed together, and HRCMPE has the worst SRN discrimination effect, with four types of SRNs mixed together. In summary, the feature-extraction method based on HRCMFD and HRCMDE under a single feature is superior to HRMLZC and HRCMPE for six types of SRNs.
Table 5 illustrates the HARR of a single feature for six types of SRNs corresponding to four kinds of nonlinear dynamic indexes based on HRCMP. It is obvious to draw from Table 5 that all the selected features with the HARR are at the 1th layer under SF1, and the features selected by the other three indexes except HRCMPE are at the 1th node; the RR of the four indexes for Ship⑥ is 100%, which is the easiest to recognize and consistent with the feature distribution results; the feature extraction method based on HRCMFD can recognize 100% of the two SRNs only, and have the highest HARR. Overall, the single feature extraction method cannot recognize six kinds of SRNs.

5.3.2. Double-Feature Extraction and Classification

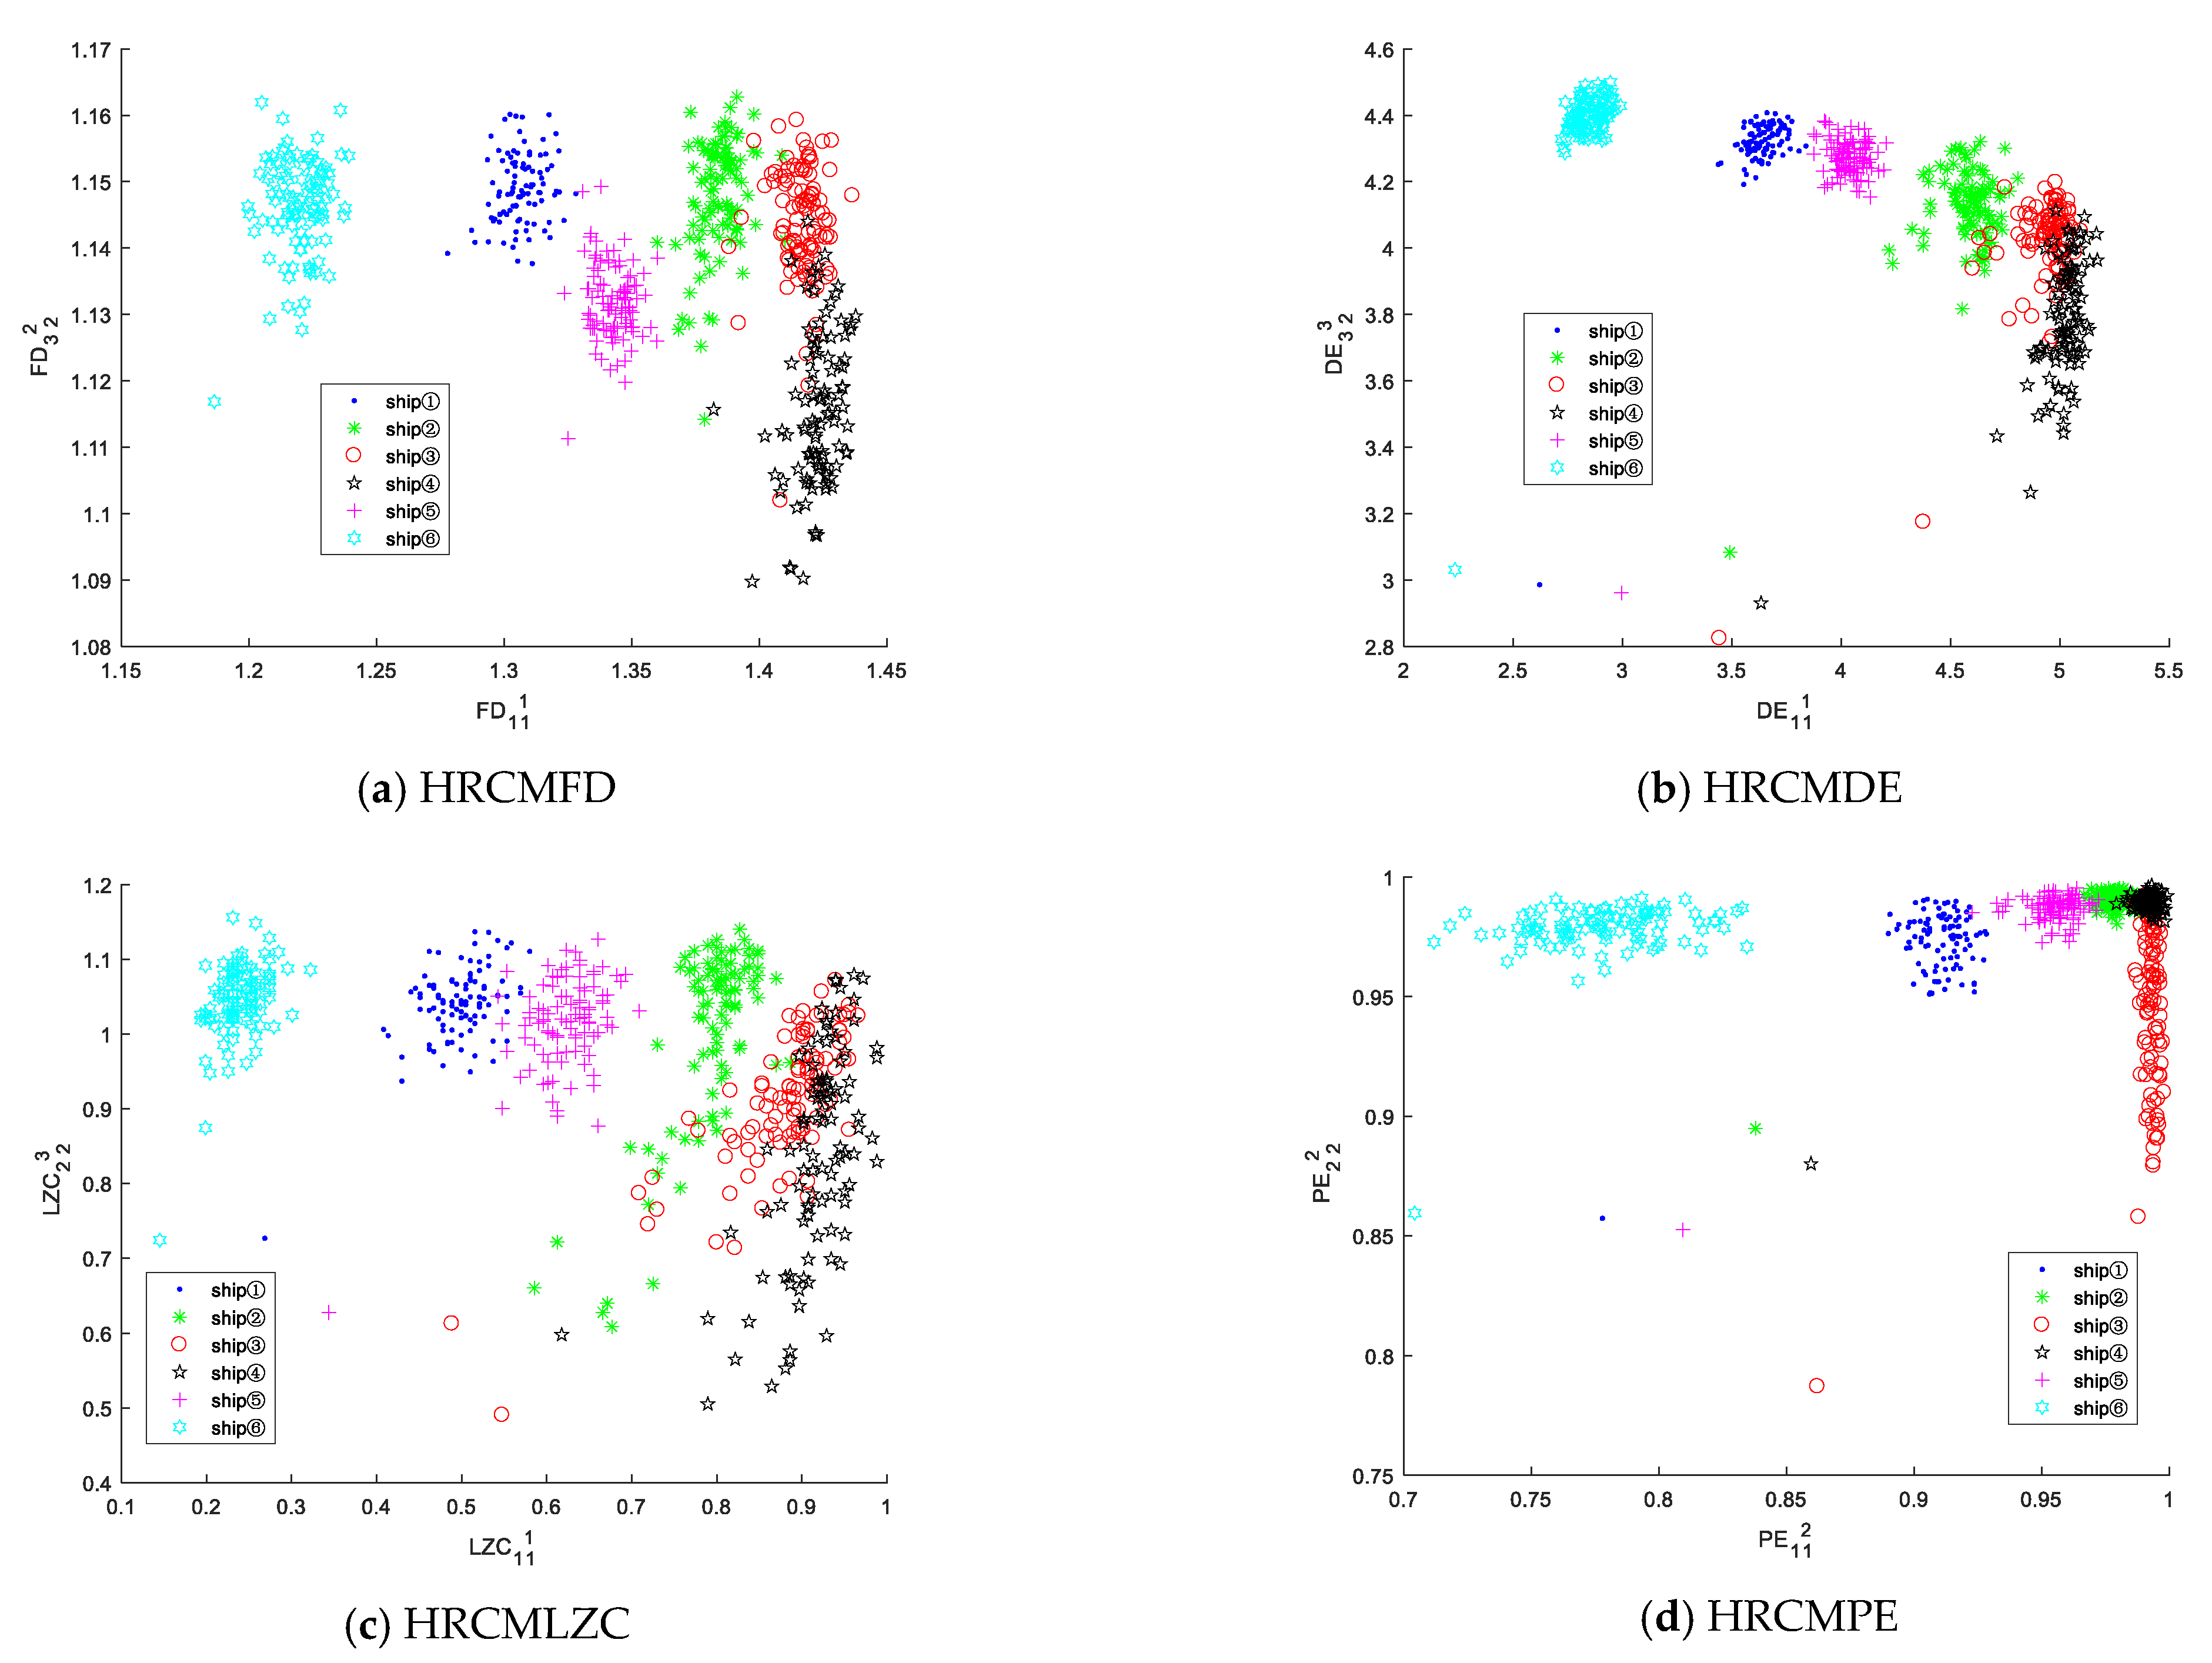
Due to the low RR of the single-feature extraction method, the double-feature extraction method is applied to distinguish six types of SRNs. The double-feature distribution results of four nonlinear dynamic indexes based on HRCMP corresponding to the HARR are illustrated in Figure 16. It can be observed that the features of Ship③ and Ship④ in the figure of HRCMFD, HRCMDE, and HRCMLZC are mixed together, and Ship① and Ship⑤ of HRCMLZC also have overlapping parts; for HRCMPE, there are three types of SRNs mixed together, namely, Ship②, Ship③, and Ship④; in the distribution figure of HRCMDE, the overlapping part of its Ship③ and Ship④ is more than that of HRCMFD. We can conclude that compared with the other indexes, the feature extraction method based on HRCMFD performs better in discerning six types of SRNs.
The HARR of double features for six types of SRNs corresponding to four nonlinear dynamic indexes based on HRCMP are shown in Table 6, in which F D 1 1 1 & F D 3 2 2 denotes double features of the HRCMFD under F D 1 1 1 and F D 3 2 2 , D E 1 1 1 & D E 3 2 3 signifies double features of the HRCMFD under D E 1 1 1 and D E 3 2 2 , and so on. As observed in Table 6, compared with the single-feature extraction method, the double-feature extraction method has significantly improved the recognition ability for six types of SRNs, the minimum improved HARR is approximately 10%, and all indexes have the lowest RR of 72% for SRNs; the feature extraction method based on HRCMFD has the best RR greater than or equal to 90% for six types of SRNs. In conclusion, compared with other methods, the feature extraction method based on HRCMFD has a HARR of 95% for six types of SRNs.

5.3.3. Multi-Feature Extraction and Classification

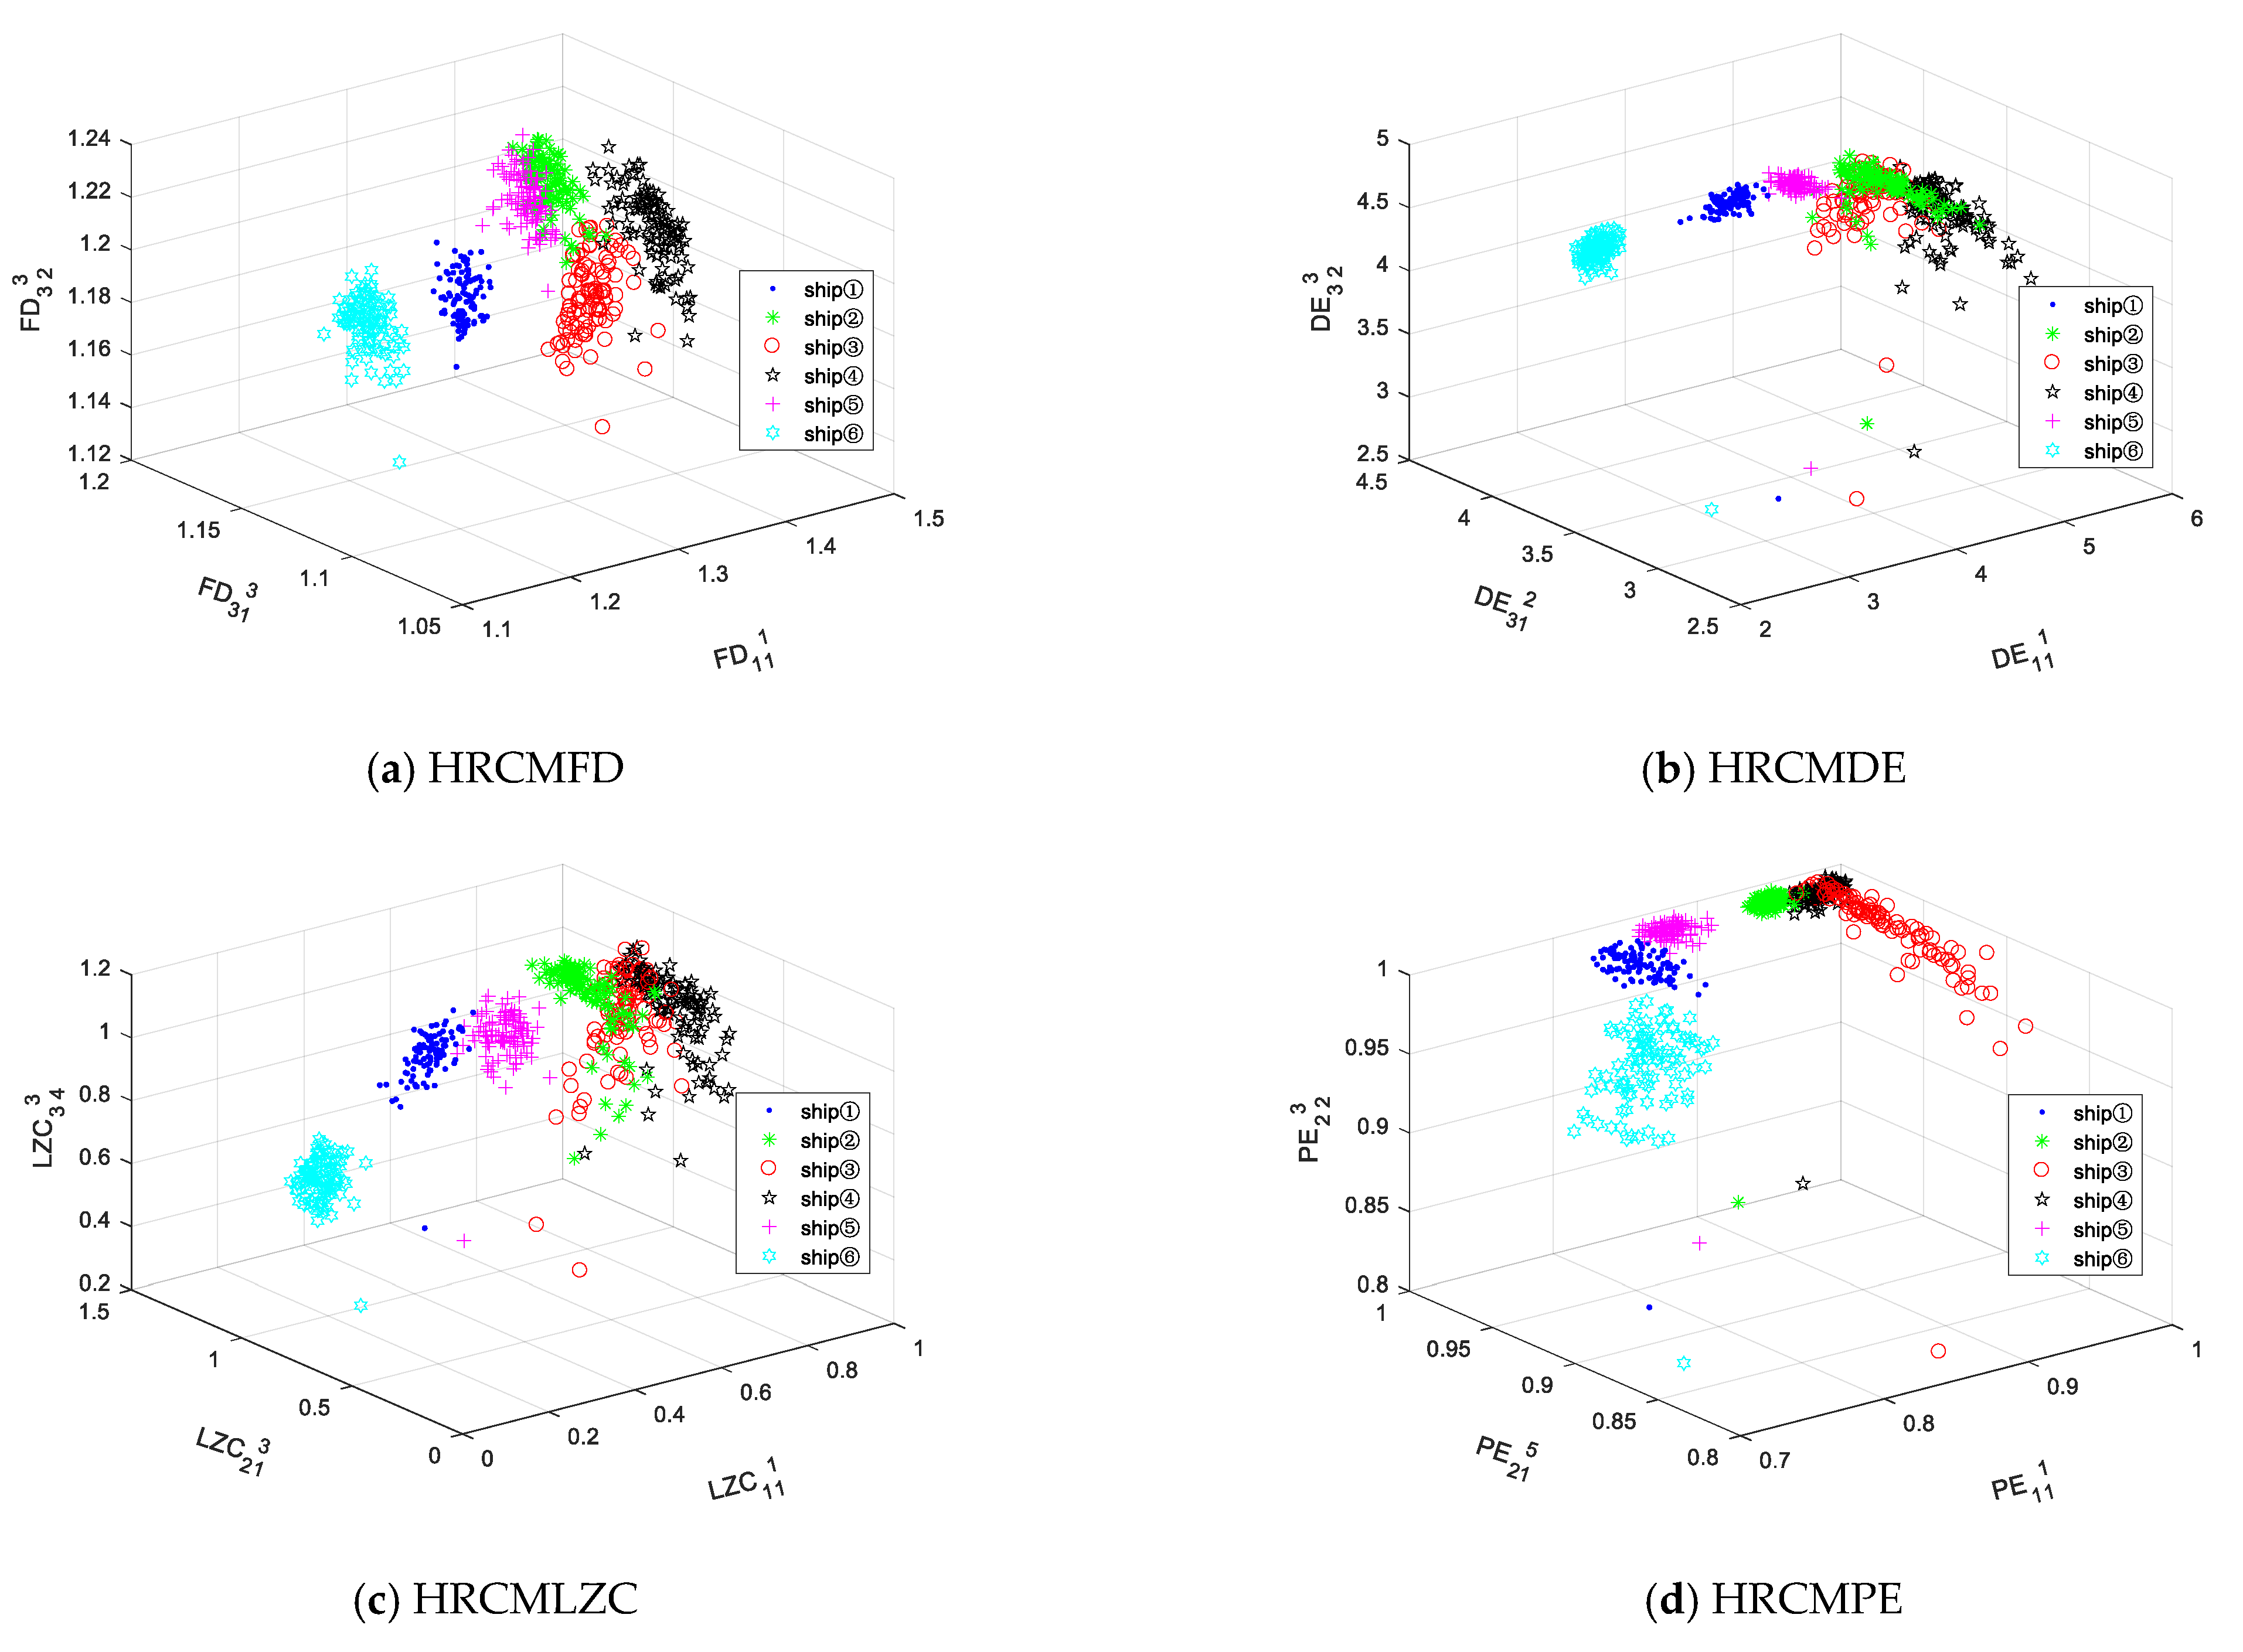
The triple-feature classification figures of the SRN are obtained last. Figure 17 displays the triple-feature distribution results of four nonlinear dynamic indexes based on HRCMP corresponding to the HARR. Different from the above feature distribution figure, Ship② and Ship⑤ of HRCMFD are mixed together; there are three kinds of SRNs of serious mixing in HRCMDE and HRCMLZC; for HRCMPE, except for ship⑥, other SRNs have overlapping parts. In summary, the feature extraction method based on RCMFD for six types of SRNs is better than those of other methods.
Table 7 shows the HARR of multi feature for six types of SRNs corresponding to four nonlinear dynamic indexes based on HRCMP, in which F D 1 1 1 & F D 3 2 3 & F D 3 1 3 represents double features of the HRCMFD under F D 1 1 1 , F D 3 2 3 , and F D 3 1 3 ; F D 1 1 1 & F D 3 1 3 & F D 3 2 5 & F D 3 3 1 represents double features of the HRCMFD under F D 1 1 1 , F D 3 1 3 , F D 3 , and F D 3 3 1 , and so on. We can observe that the HARR of all feature-extraction methods is increasing; the HARR of the feature-extraction method based on HRCMFD exceeds 99.0% in four features; except for the four features of HRCMDE, other feature combinations include the SF1 under the 1th node of the 1th layer. To conclude, multi-feature extraction methods have greatly improved the recognition ability of SRNs, among which the method based on HRCMFD is the best.

6. Discussion

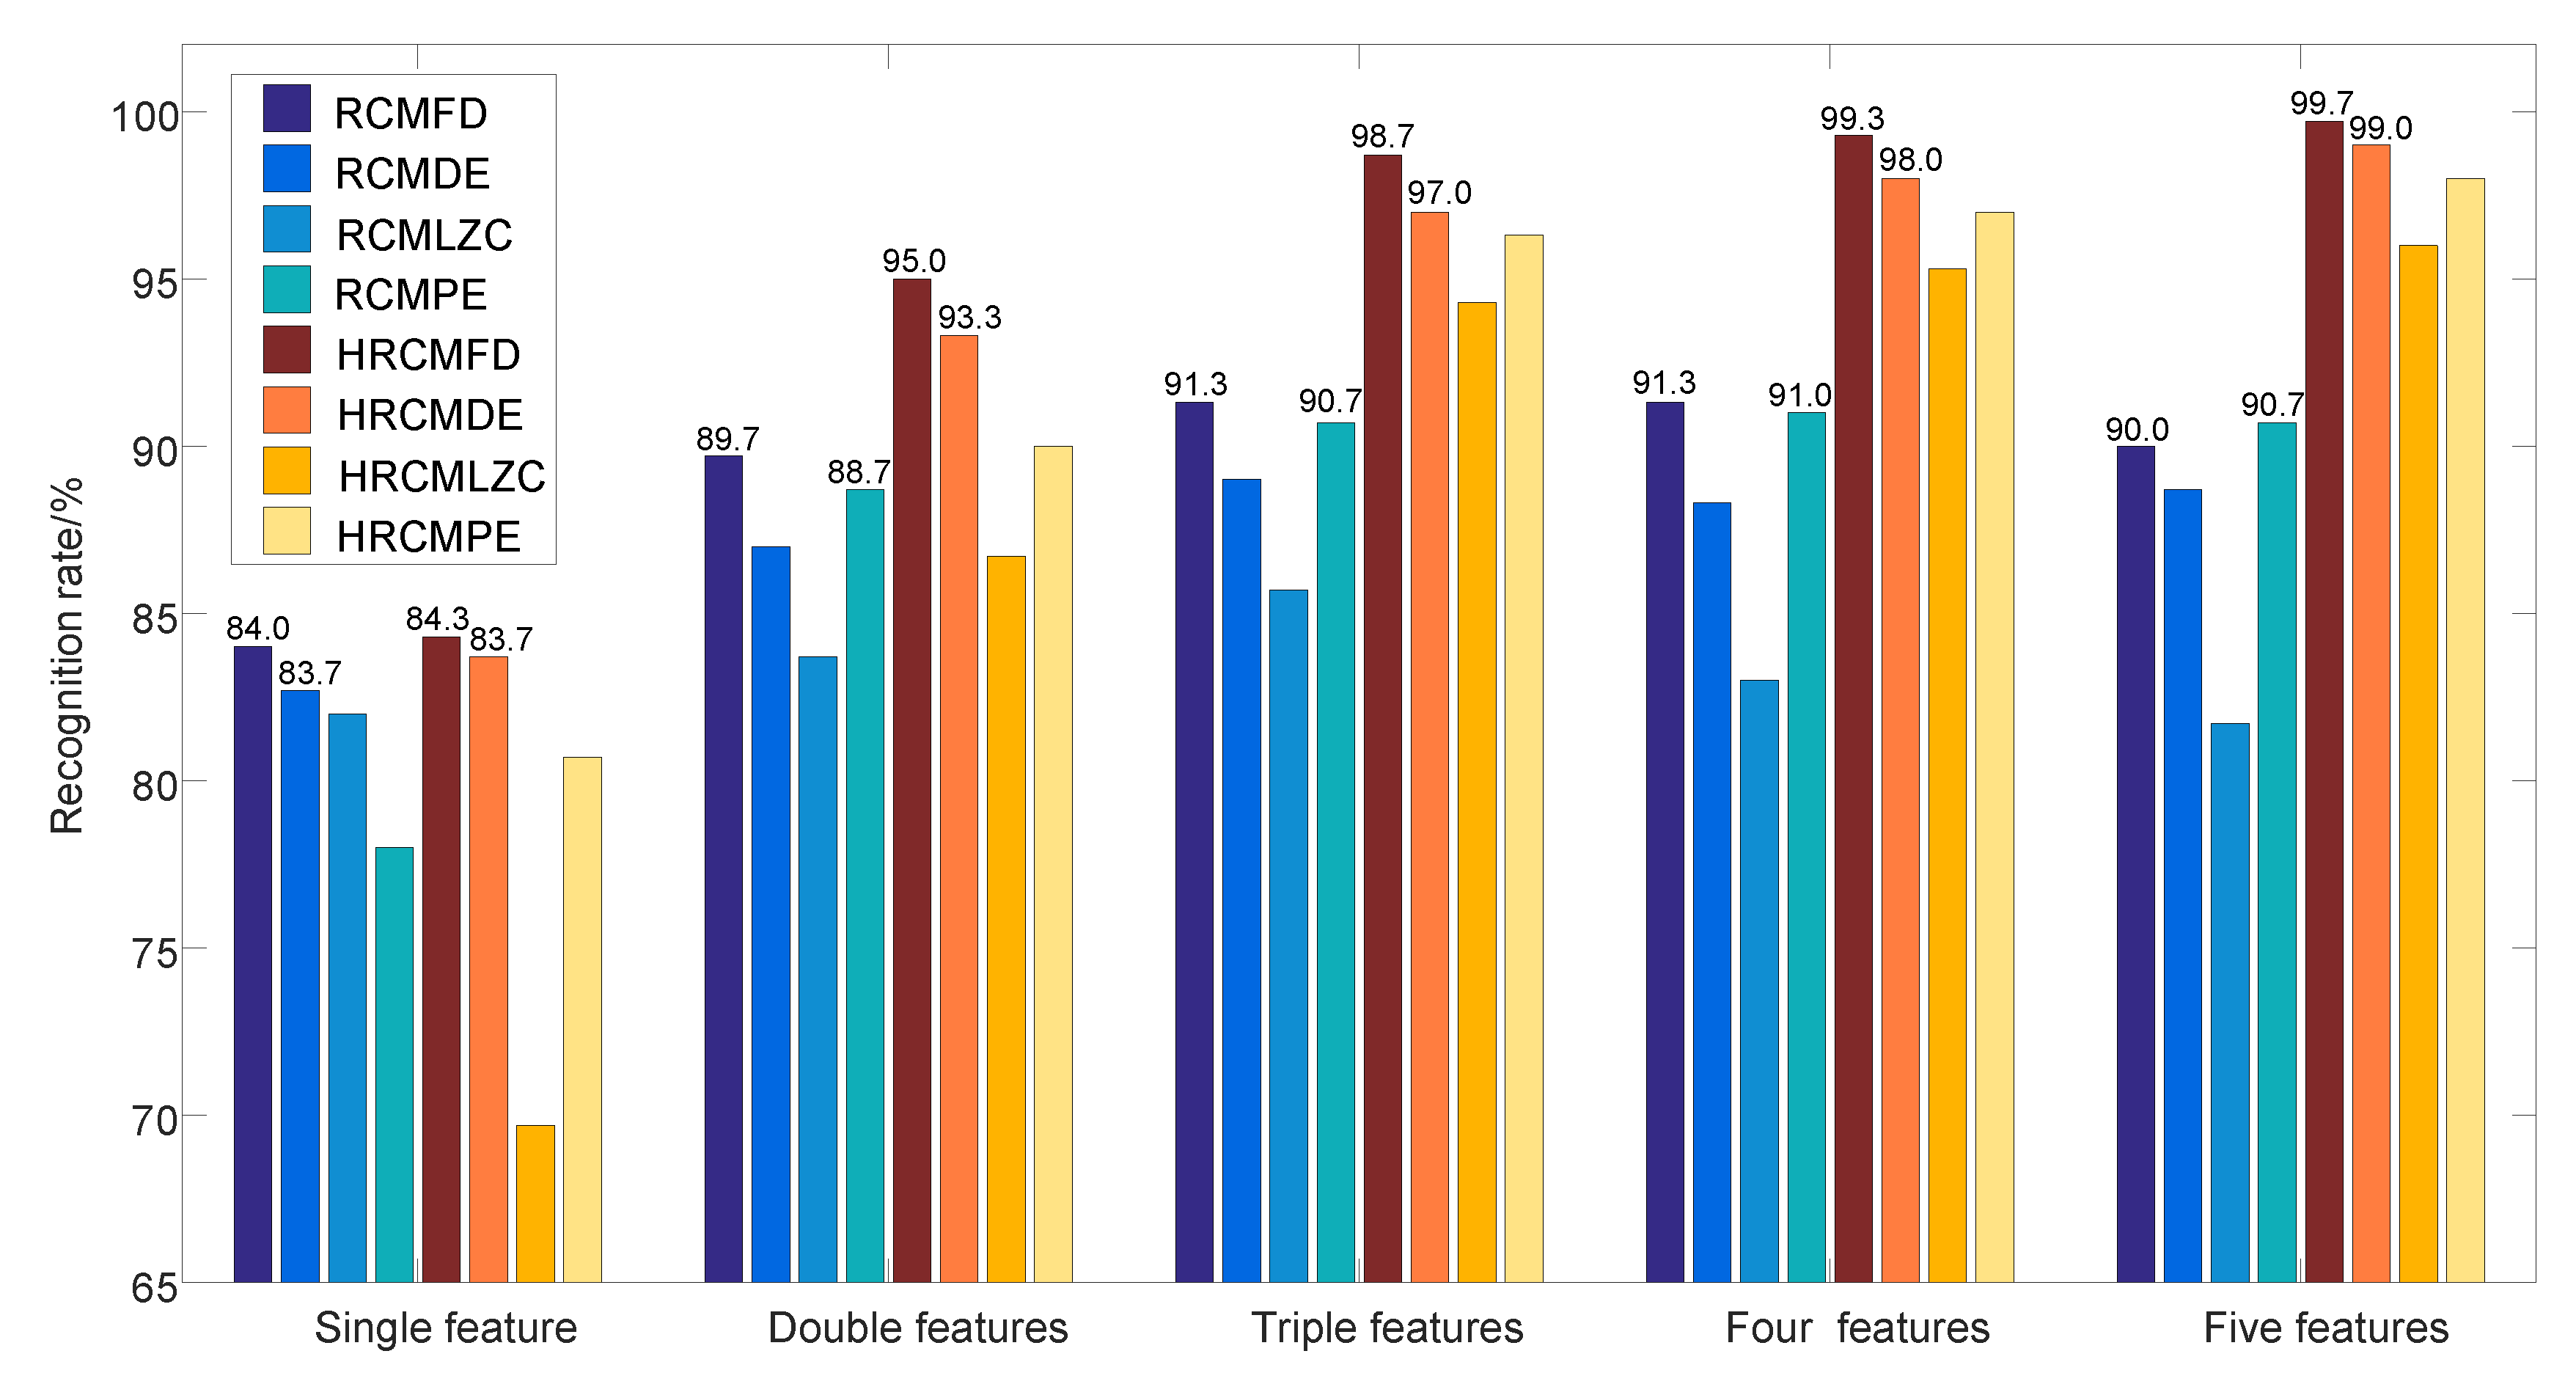
We propose two feature-extraction methods based on RCMFD and HRCMFD and then verify the effectiveness and superiority of the proposed methods in Section 5.2 and Section 5.3, respectively. To further highlight the difference between RCMFD and HRCMFD, all the HARR in the above experiments are visualized. Figure 18 displays the HARR of the feature-extraction methods based on eight nonlinear dynamic indexes.
It can be seen from Figure 18, on the whole, that the RR of all feature extraction methods based on refined composite multi-scale indexes for six types of SRNs will increase first and then remain balanced with the increase in the feature quantity, and the RR s of four and five features are basically unchanged. The indexes based on RCMP in this paper only calculate the features of five scales, which will result in redundant features. Therefore, it is not surprising that the RR is equal or even reduced as the feature number increases. Among the four feature extraction methods based on refined composite indexes, the HARR of feature-extraction methods based on RCMFD is the highest, and the ARR is 91.3% in the three features. By observing the feature figure of each part, it can be found that the RR of all feature extraction methods based on HRCMP indexes except single-feature HRCMLZC is higher than that of refined composite multi-scale feature extraction methods under the same conditions, and it is slightly different from the overall trend of indexes based on RCMP. This is because, although indexes based on RCMP can reflect the complexity features of SRNs at multiple scales, they can only reflect the SRN information of the whole frequency band, which causes frequent loss of low-frequency or high-frequency information, limiting the representation of SRNs. We find that this problem can be solved by adding hierarchical information, and it is different from the refined composite multi-scale feature extraction methods because the number of features extracted from each SRN has increased by 14 times with the addition of hierarchical information, which enhances the HARR of the extraction method as the feature quantity increases. Among the eight indexes, the feature extraction method based on HRCMFD performs best in all methods, and the RR of five features has been very close to 100%, reaching 99.7%. In addition, since all the above feature extraction methods have the least loss of SRN information under the first feature of the SRN, we find that when the value of RR reaches its maximum, most of the features of the refined composite multi-scale methods contain SF1, and most of the other hierarchical-refined composite multi-scale methods contain SF1 under the first node of the 1th layer. In this paper, many experiments have been carried out, and the results are applicable to any parameter of all indexes.

7. Conclusions

Two new FD-based nonlinear dynamic indexes are proposed, namely RCMFD and HRCMFD. Taking them as the complexity features of SRNs, two feature-extraction methods are proposed. The main conclusions can be summarized as follows:
(1)
RCMFD and HRCMFD are proposed as two new nonlinear dynamic indexes which enhance the signal characterization ability of FD from the scale and frequency. The simulation results also prove their superiority in identifying simulated signals;
(2)
The multi-feature extraction method based on RCMFD is proposed, which can reflect SRN information at multi-scales and extract features of SRNs more effectively. The experimental results show that the proposed feature-extraction method is superior to the other three methods based on RCMDE, RCMLZC, and RCMPE;
(3)
We propose a multi-feature extraction method based on HRCMFD for SRNs, which can extract multi-scale SRN features in each sub-frequency band and reflect SRN information more comprehensively. The experimental results indicate that the HARR of the proposed feature-extraction method for six SRNs is higher than that of the other seven methods, and the recognition rate is close to 100% when taking the number of five features.
In the initial study of this paper, the proposed HRCMFD achieves a comprehensive reflection of frequency band information and scale information, which provides a new reference for the feature extraction of complex signals. However, the utilization of hierarchical decomposition and fine composite multi-scale will consume more time cost (at least C s 1 · 2 n times the time, s is the scale factor, and k is the number of layers) and generate redundant features. Therefore, these two issues have become future research directions.

Author Contributions

Y.L.: Conceptualization, Methodology, Software, Writing; L.L.: Data curation, Writing, Original draft preparation, Software; S.Z.: Visualization, Investigation, Supervision. All authors have read and agreed to the published version of the manuscript.

Funding

This work was supported by Natural Science Foundation of Shaanxi Province (No. 2022JM-337) and National Science Foundation of China (No. U2034209).

Data Availability Statement

The data used to support the findings of this study are available from the corresponding author upon request.

Conflicts of Interest

The authors declare no conflict of interest.

References

  1. Bernardini, M.; Fredianelli, L.; Fidecaro, F.; Gagliardi, P.; Nastasi, M.; Licitra, G. Noise Assessment of Small Vessels for Action Planning in Canal Cities. Environments 2019, 6, 31. [Google Scholar] [CrossRef] [Green Version]
  2. Fredianelli, L.; Nastasi, M.; Bernardini, M.; Fidecaro, F.; Licitra, G. Pass-by characterization of noise emitted by different categories of seagoing ships in ports. Sustainability 2020, 12, 1740. [Google Scholar] [CrossRef] [Green Version]
  3. Fredianelli, L.; Bolognese, M.; Fidecaro, F.; Licitra, G. Classification of noise sources for port area noise mapping. Environments 2021, 8, 12. [Google Scholar] [CrossRef]
  4. Li, Y.; Tang, B.; Jiao, S. SO-slope entropy coupled with SVMD: A novel adaptive feature extraction method for ship-radiated noise. Ocean Eng. 2023, 280, 114677. [Google Scholar] [CrossRef]
  5. Li, Y.; Tang, B.; Yi, Y. A novel complexity-based mode feature representation for feature extraction of ship-radiated noise using VMD and slope entropy. Appl. Acoust. 2022, 196, 108899. [Google Scholar] [CrossRef]
  6. Yuan, F.; Ke, X.; Cheng, E. Joint Representation and Recognition for Ship-Radiated Noise Based on Multimodal Deep Learning. J. Mar. Sci. Eng. 2019, 7, 380. [Google Scholar] [CrossRef] [Green Version]
  7. Wang, S.; Zeng, X. Robust underwater noise targets classification using auditory inspired time–frequency analysis. Appl. Acoust. 2014, 78, 68–76. [Google Scholar] [CrossRef]
  8. Gassmann, M.; Wiggins, S.M.; Hildebrand, J.A. Deep-water measurements of container ship-radiated noise signatures and di-rectionality. J. Acoust. Soc. Am. 2017, 142, 1563. [Google Scholar] [CrossRef]
  9. Yan, J.; Sun, H.; Chen, H.; Junejo, N.U.R.; Cheng, E. Resonance-Based Time-Frequency Manifold for Feature Extraction of Ship-Radiated Noise. Sensors 2018, 18, 936. [Google Scholar] [CrossRef] [Green Version]
  10. Lin, L.; Chu, F. Feature extraction of AE characteristics in offshore structure model using Hilbert–Huang transform. Measurement 2011, 44, 46–54. [Google Scholar] [CrossRef]
  11. Bracewell, R.N. The Fourier Transform and Its Applications; McGraw-Hill: New York, NY, USA, 1986. [Google Scholar]
  12. Hu, Q.; Li, Y.; Sun, X.; Chen, M.; Bu, Q.; Gong, B. Integrating test device and method for creep failure and ultrasonic response of methane hydrate-bearing sediments. Rev. Sci. Instrum. 2023, 94, 025105. [Google Scholar] [CrossRef] [PubMed]
  13. Wu, Y.; Li, Y.; Chen, J. Prediction of underwater acoustic signal based on neural network. Microprocessors 2006, 27, 47–48. [Google Scholar]
  14. Liu, S.; Fu, X.; Xu, H.; Zhang, J.; Zhang, A.; Zhou, Q.; Zhang, H. A Fine-Grained Ship-Radiated Noise Recognition System Using Deep Hybrid Neural Networks with Multi-Scale Features. Remote. Sens. 2023, 15, 2068. [Google Scholar] [CrossRef]
  15. Xie, D.; Hong, S.; Yao, C. Optimized Variational Mode Decomposition and Permutation Entropy with Their Application in Feature Extraction of Ship-Radiated Noise. Entropy 2021, 23, 503. [Google Scholar] [CrossRef] [PubMed]
  16. Li, Y.; Geng, B.; Jiao, S. Dispersion entropy-based Lempel-Ziv complexity: A new metric for signal analysis. Chaos Solitons Fractals 2022, 161, 112400. [Google Scholar] [CrossRef]
  17. Li, Y.; Geng, B.; Tang, B. Simplified coded dispersion entropy: A nonlinear metric for signal analysis. Nonlinear Dyn. 2023, 111, 9327–9344. [Google Scholar] [CrossRef]
  18. Li, Y.; Gao, P.; Tang, B.; Yi, Y.; Zhang, J. Double Feature Extraction Method of Ship-Radiated Noise Signal Based on Slope Entropy and Permutation Entropy. Entropy 2021, 24, 22. [Google Scholar] [CrossRef]
  19. Li, Y.; Li, Y.; Chen, Z.; Chen, X. Feature Extraction of Ship-Radiated Noise Based on Permutation Entropy of the Intrinsic Mode Function with the Highest Energy. Entropy 2016, 18, 393. [Google Scholar] [CrossRef] [Green Version]
  20. Rostaghi, M.; Azami, H. Dispersion Entropy: A Measure for Time-Series Analysis. IEEE Signal Process. Lett. 2016, 23, 610–614. [Google Scholar] [CrossRef]
  21. Bandt, C.; Pompe, B. Permutation entropy: A natural complexity measure for time series. Phys. Rev. Lett. 2002, 88, 174102. [Google Scholar] [CrossRef]
  22. Lempel, A.; Ziv, J. On the complexity of finite sequences, Inform. IEEE Trans. Inf. Theory 1976, 22, 75–81. [Google Scholar] [CrossRef]
  23. Giorgilli, A.; Casati, D.; Sironi, L.; Galgani, L. An efficient procedure to compute fractal dimensions by box counting. Phys. Lett. A 1986, 115, 202–206. [Google Scholar] [CrossRef]
  24. Li, Y.; Yang, Y.; Li, G.; Xu, M.; Huang, W. A fault diagnosis scheme for planetary gearboxes using modified multi-scale symbolic dynamic entropy and mRMR feature selection. Mech. Syst. Signal Process. 2017, 91, 295–312. [Google Scholar] [CrossRef]
  25. Li, Y.; Tang, B.; Geng, B.; Jiao, S. Fractional Order Fuzzy Dispersion Entropy and Its Application in Bearing Fault Diagnosis. Fractal Fract. 2022, 6, 544. [Google Scholar] [CrossRef]
  26. Yeh, C.; Shi, W. Generalized multi-scale Lempel–Ziv complexity of cyclic alternating pattern during sleep. Nonlinear Dyn. 2018, 93, 1899–1910. [Google Scholar] [CrossRef]
  27. Li, Z.; Li, Y.; Zhang, K.; Guo, J. A Novel Improved Feature Extraction Technique for Ship-Radiated Noise Based on IITD and MDE. Entropy 2019, 21, 1215. [Google Scholar] [CrossRef] [Green Version]
  28. Mao, X.; Shang, P.; Xu, M. Measuring time series based on multi-scale dispersion Lempel-Ziv complexity and dispersion entropy plane. Chaos Solitons Fractals 2020, 137, 109868. [Google Scholar] [CrossRef]
  29. Li, Y.; Liu, F.; Wang, S. Multi-scale symbolic Lempel–Ziv: An effective feature extraction approach for fault diagnosis of railway vehicle systems. IEEE Trans. Ind. Inf. 2021, 17, 199–208. [Google Scholar] [CrossRef]
  30. Ibáñez-Molina, A.; Iglesias-Parro, S.; Soriano, M.; Aznarte, J. Multi-scale Lempel-Ziv complexity for EEG measures. Clin. Neu-Rophysiology 2015, 126, 541–548. [Google Scholar] [CrossRef]
  31. Humeau, H.; Wu, C.; Wu, S. Refined Composite Multi-scale Permutation Entropy to Overcome Multi-scale Permutation Entropy Length Dependence. IEEE Signal Process. Lett. 2015, 22, 2364–2367. [Google Scholar] [CrossRef]
  32. Azami, H.; Rostaghi, M.; Abásolo, D.; Escudero, J. Refined Composite Multi-scale Dispersion Entropy and its Application to Biomedical Signals. IEEE Trans. Biomed. Eng. 2017, 64, 2872–2879. [Google Scholar] [PubMed] [Green Version]
  33. Li, Y.; Wang, S.; Deng, Z. Intelligent fault identification of rotary machinery using refined composite multi-scale Lempel–Ziv complexity. J. Manuf. Syst. 2020, 61, 725–735. [Google Scholar] [CrossRef]
  34. Li, Y.; Jiao, S.; Geng, B. Refined composite multi-scale fluctuation-based dispersion Lempel–Ziv complexity for signal analysis. ISA Trans. 2023, 133, 273–284. [Google Scholar] [CrossRef]
  35. Jiang, Y.; Peng, C.-K.; Xu, Y. Hierarchical entropy analysis for biological signals. J. Comput. Appl. Math. 2011, 236, 728–742. [Google Scholar] [CrossRef] [Green Version]
  36. Zhu, K.; Li, H. A rolling element bearing fault diagnosis approach based on hierarchical fuzzy entropy and support vec-tor machine. Proc. Inst. Mech. Eng. Part C J. Mech. Eng. Sci. 2015, 230, 2314–2322. [Google Scholar] [CrossRef]
  37. Li, Y.; Xu, M.; Zhao, H.; Huang, W. Hierarchical fuzzy entropy and improved support vector machine based binary tree ap-proach for rolling bearing fault diagnosis. Mech. Mach. Theory 2016, 98, 114–132. [Google Scholar] [CrossRef]
  38. Yilmaz, A.; Unal, G. Multi-scale Higuchi’s fractal dimension method. Nonlinear. Dyn. 2020, 101, 1441–1455. [Google Scholar] [CrossRef]
  39. Tian, Y.; Wang, Z.; Lu, C.; Wang, Z. Bearing diagnostics: A method based on differential geometry. Mech. Syst. Signal Process. 2016, 80, 377–391. [Google Scholar] [CrossRef]
  40. Jin, Q.; Zhang, H.; Zhang, Y.; Cai, W.; Chi, M. An improved parallel MDBN with AVMD for nonlinear system modeling. IEEE Access 2020, 8, 18408–18419. [Google Scholar] [CrossRef]
  41. Godó, B.; Nagy, Á. Characterization of Rössler and Duffing maps with Rényi entropy and generalized complexity measures. J. Physics Conf. Ser. 2013, 410, 12090. [Google Scholar] [CrossRef]
  42. National Park Service. Available online: https://www.nps.gov/glba/learn/nature/soundclips (accessed on 8 May 2023).
Figure 1. The calculation flow chart of FD.
Remotesensing 15 03406 g001
Figure 2. The schematic chart of the coarse granulation process when s = 3 .
Remotesensing 15 03406 g002
Figure 3. The figure shows the flow calculation chart of RCMFD when s = 3 .
Remotesensing 15 03406 g003
Figure 4. The schematic chart of hierarchical decomposition.
Remotesensing 15 03406 g004
Figure 5. The flow calculation chart of HRCMFD.
Remotesensing 15 03406 g005
Figure 6. The flow chart of the multi-feature extraction method based on HRCMFD.
Remotesensing 15 03406 g006
Figure 7. The time domain waveforms of three simulated signals under 10 samples.
Remotesensing 15 03406 g007
Figure 8. The single feature distribution of three fractal dimension indexes for simulated signals.
Remotesensing 15 03406 g008
Figure 9. The double-feature distribution map of two fractal dimension indexes for simulated signals.
Remotesensing 15 03406 g009
Figure 10. The time domain waveforms of six types of SRNs.
Remotesensing 15 03406 g010
Figure 11. The frequency spectrogram of six types of SRNs.
Remotesensing 15 03406 g011
Figure 12. The single feature distribution results of four nonlinear dynamic index indexes based on RCMP corresponding to the HARR.
Remotesensing 15 03406 g012
Figure 13. The double-feature distribution results of four nonlinear dynamic indexes based on RCMP corresponding to the HARR.
Remotesensing 15 03406 g013
Figure 14. The triple-feature distribution results of four nonlinear dynamic indexes based on RCMP corresponding to the HARR.
Remotesensing 15 03406 g014
Figure 15. The single-feature distribution results of four nonlinear dynamic indexes based on HRCMP corresponding to the HARR.
Remotesensing 15 03406 g015
Figure 16. The double-feature distribution results of four nonlinear dynamic indexes based on HRCMP. corresponding to the HARR.
Remotesensing 15 03406 g016
Figure 17. The triple-feature distribution results of four nonlinear dynamic indexes based on HRCMP corresponding to the HARR.
Remotesensing 15 03406 g017
Figure 18. The HARR of feature-extraction methods based on eight nonlinear dynamic indexes.
Remotesensing 15 03406 g018
Table 1. The parameter settings of eight kinds of nonlinear dynamic indexes.
Nonlinear Dynamic IndexEmbedding DimensionTime DelayCategory NumberScale FactorDecomposition Level
RCMFD---53
RCMDE31653
RCMLZC---53
RCMPE31-53
HRCMFD---53
HRCMDE31653
HRCMLZC---53
HRCMPE31-53
Table 2. The HARR of a single feature for six types of SRNs corresponding to four nonlinear dynamic indexes based on RCMP.
Nonlinear
Dynamic
Index
SFSix Types of SRNsHARR
Ship①Ship②Ship③Ship④Ship⑤Ship⑥
RCMFD F D 1 100%92%54%62%96%100%84.0%
RCMDE D E 1 98%98%54%48%98%100%82.7%
RCMLZC L Z C 1 96%92%64%46%94%100%82.0%
RCMPE P E 4 98%76%60%38%96%100%78.0%
Table 3. The HARR of features for six types of SRNs corresponding to four nonlinear dynamic indexes based on RCMP.
Nonlinear Dynamic IndexSFSix Types of SRNsHARR
Ship①Ship②Ship③Ship④Ship⑤Ship⑥
RCMFD F D 1 & F D 5 100%94%64%84%96%100%89.7%
RCMDE D E 2 & D E 5 98%98%62%70%94%100%87.0%
RCMLZC L Z C 1 & L Z C 4 96%96%56%58%96%100%83.7%
RCMPE P E 1 & P E 2 100%98%80%60%96%98%88.7%
Table 4. The HARR of multi-feature for six types of SRNs corresponding to four nonlinear dynamic indexes based on RCMP.
Nonlinear Dynamic IndexHARR/SFNumber of Extracted Features
ThreeFourFive
RCMFDHARR91.3%91.3%90.0%
SF combination F D 1 & F D 2
& F D 5
F D 1 & F D 2 & F D 4
& F D 5
F D 1 & F D 2 & F D 3
F D 4 & F D 5
RCMDEHARR89.0%88.3%88.7%
SF combination D E 1 & D E 4
& D E 5
D E 1 & D E 2 & D E 3
& D E 5
D E 1 & D E 2 & D E 3
& D E 2 & D E 5
RCMLZCHARR85.7%83.0%81.7%
SF combination L Z C 1 & L Z C 2
& L Z C 4
L Z C 1 & L Z C 2 ,& L Z C 3
& L Z C 4
L Z C 1 & L Z C 2 & L Z C 3
& L Z C 4 & L Z C 5
RCMPEHARR90.7%91.0%90.7%
SF combination P E 1 & P E 2
& P E 3
P E 1 & P E 2 & P E 3 & P E 5 P E 1 & P E 2 & P E 3
& P E 4 & P E 5
Table 5. The HARR of a single feature for six types of SRNs corresponding to four kinds of nonlinear dynamic indexes based on HRCMP.
Nonlinear Dynamic IndexChosen FeatureSix Types of SRNsHARR
Ship①Ship②Ship③Ship④Ship⑤Ship⑥
HRCMFD F D 1 1 1 96%98%64%48%100%100%84.3%
HRCMDE D E 1 1 1 98%92%52%62%98%100%83.7%
HRCMLZC L Z C 1 1 1 88%94%48%14%66%100%69..7%
HRCMPE P E 1 1 2 98%96%60%42%88%100%80.7%
Table 6. The HARR of double features for six types of SRNs corresponding to four kinds of nonlinear dynamic indexes based on HRCMP.
Nonlinear Dynamic IndexChosen FeaturesSix Types of SRNsHARR
Ship①Ship②Ship③Ship④Ship⑤Ship⑥
HRCMFD F D 1 1 1
& F D 3 2 2
100%98%92%90%100%100%95.0%
HRCMDE D E 1 1 1
& D E 3 2 3
96%94%92%80%98%100%93.3%
HRCMLZC L Z C 1 1 1
& L Z C 2 2 3
88%98%66%72%96%100%86.7%
HRCMPE P E 1 1 2
& P E 2 2 2
94%98%92%64%92%100%90.0%
Table 7. The HARR of multi-feature for six types of SRNs corresponding to four kinds of nonlinear dynamic indexes based on HRCMP.
Nonlinear Dynamic IndexHARR/Chosen
Features
Number of Extracted Features
ThreeFourFive
HRCMFDHARR98.7%99.3%99.7%
Chosen features F D 1 1 1 & F D 3 2 3
& F D 3 1 3
F D 1 1 1 & F D 3 1 3 &
F D 3 2 5 & F D 3 3 1
F D 1 1 1 & F D 1 2 2 & F D 2 2 3
& F D 3 2 5 & F D 3 8 4
HRCMDEHARR97.0%98.0%99.0%
Chosen features D E 1 1 1 & D E 3 1 2
& D E 3 2 3
D E 1 2 4 & D E 3 2 2 &
D E 3 3 2 & D E 3 7 4
D E 1 1 1 & D E 1 2 5 & D E 3 2 2
& D E 3 4 4 & D E 3 7 4
HRCMLZCHARR94.3%95.3%96.0%
Chosen features L Z C 1 1 1 & L Z C 2 1 3
& L Z C 3 4 3
L Z C 1 1 1 & L Z C 2 1 5 & L Z C 2 4 2 &
L Z C 3 2 1
L Z C 1 1 1 & L Z C 1 1 3 & L Z C 1 1 4
& L Z C 3 2 1 & L Z C 3 3 4
HRCMPEHARR96.3%97.0%98.0%
Chosen features P E 1 1 1 & P E 2 1 5 & P E 2 2 3 P E 1 1 1 & P E 1 1 3 &
P E 2 2 1 & P E 3 1 4
P E 1 1 1 P E 1 1 3 & P E 2 2 1
& P E 3 1 4 & P E 3 4 3
Disclaimer/Publisher’s Note: The statements, opinions and data contained in all publications are solely those of the individual author(s) and contributor(s) and not of MDPI and/or the editor(s). MDPI and/or the editor(s) disclaim responsibility for any injury to people or property resulting from any ideas, methods, instructions or products referred to in the content.