Abstract
The pine wood nematode (PWN; Bursaphelenchus xylophilus) is a major invasive species in China, causing huge economic and ecological damage to the country due to the absence of natural enemies and the extremely rapid rate of infection and spread. Accurate monitoring of pine wilt disease (PWD) is a prerequisite for timely and effective disaster prevention and control. UAVs can carry hyperspectral sensors for near-ground remote sensing observations, which can obtain rich spatial and spectral information and have the potential for infected tree identification. Deep learning techniques can use rich multidimensional data to mine deep features in order to achieve tasks such as classification and target identification. Therefore, we propose an improved Mask R-CNN instance segmentation method and an integrated approach combining a prototypical network classification model with an individual tree segmentation algorithm to verify the possibility of deep learning models and UAV hyperspectral imagery for identifying infected individual trees at different stages of PWD. The results showed that both methods achieved good performance for PWD identification: the overall accuracy of the improved Mask R-CNN with the screened bands as input data was 71%, and the integrated method combining prototypical network classification model with individual tree segmentation obtained an overall accuracy of 83.51% based on the screened bands data, in which the early infected pine trees were identified with an accuracy of 74.89%. This study indicates that the improved Mask R-CNN and integrated prototypical network method are effective and practical for PWD-infected individual trees identification using UAV hyperspectral data, and the proposed integrated prototypical network enables early identification of PWD, providing a new technical guidance for early monitoring and control of PWD.
1. Introduction
Pine wilt disease (PWD) is the most dangerous and devastating forest disease caused by the pine wilt nematode (PWN) [1]. The PWN is an international quarantine target and is currently listed as an important quarantine pest in over 50 countries [2,3,4,5,6,7]. Since it was first discovered in 1982 at Zhongshan Mausoleum in Nanjing, the disease has occurred in 742 county-level administrative regions in 19 provinces in China, mainly affecting coniferous species such as Japanese red pine, horsetail pine, yellow mountain pine, cedar, and black pine. The number of pine trees lost to the disease has now accumulated to over hundreds of millions nationwide, resulting in significant economic and ecological service value losses to the country [8].
PWD control has been challenging due to its rapid onset and spread, as well as the high mortality rate of pine trees [9]. At present, there are three main methods for accurate monitoring of PWD: one is field survey, but it is intensive and inefficient due to the influence of forest terrain and large area; another is UAV visible remote sensing monitoring: this method can solve the problems of difficult field survey and large personnel input, but it only relies on manual visual discrimination; the last one is satellite remote sensing, which breaks through the limitation of geographical area, but it is hard to detect PWD individual trees because of the low resolution of images. In China’s efforts to prevent and control PWD, most surveys for abnormal color-changing trees are conducted manually by field survey. It is not only time-consuming and labor-intensive, but also impractical for monitoring disease occurrence in mountainous areas with steep slopes and dense forests, where most pine forests are located in China. As a result, it hinders timely and accurate monitoring and effective prediction of PWD disaster spread, often delaying the best time for disease control and causing unpredictable losses. Therefore, it is essential to explore methods for accurate monitoring, especially early identification of PWD.
The spectral characteristics of pine trees change when affected by PWD, which can be used to diagnose PWD infection stages [10]. There have been many studies using multispectral remote sensing techniques for PWD monitoring [9,11,12]. However, the spectral information obtained from multispectral remote sensing is not sufficient for early identification of PWD due to the subtle spectral response between healthy and early infected pine trees [13]. Through imaging or non-imaging spectral technology, hyperspectral remote sensing technology can obtain continuous spectral information of very narrow electromagnetic band features, which compensates for the shortage of multispectral remote sensing. It has been shown that hyperspectral remote sensing has the potential for early identification of PWD [14,15]. Therefore, the current hot issue in PWD monitoring is how to use hyperspectral technology for effective early detection of PWD.
In recent years, UAV remote sensing technology and machine learning has been increasingly applied in PWD monitoring [16,17,18,19]. UAV remote sensing technology has the advantages of fine grained observation, wider coverage, and real-time data acquisition, overcoming the limitations of ground surveys for PWD in terms of low efficiency, limited coverage, and insufficient human resources [20]. UAVs equipped with hyperspectral sensors can provide high-resolution and information-rich imagery while eliminating spatial and temporal constraints, offering an effective solution for timely and accurate PWD identification [21]. In the process of utilizing UAV remote sensing for PWD monitoring, the most critical technical issue is how to efficiently, automatically, and accurately identify abnormal color-changing PWD-infected trees from UAV imagery [10,22,23]. With the emergence of deep learning target detection algorithms such as YOLO [24], R-CNN [25], and SSD [26], deep learning techniques have been successfully applied to infection stage classification and diseased tree identification [14,27,28]. This research has demonstrated the capability of deep learning in accurately detecting trees infected with PWD and providing location information, helping to control the source of infection, and cut off the transmission route, thus curbing the spread of PWD to a certain extent [29]. However, there are still challenges in using deep learning for the identification of PWD-infected individual trees, such as effective differentiation between PWD-infected trees and crown discoloration caused by other factors, and early detection of infected living trees from healthy ones, resulting in limited detection accuracy and practical applications. Therefore, further novel methodologies must be explored to augment the detection accuracy of PWD infection stages, particularly the identification of early infected trees.
This study uses UAV hyperspectral imagery to first analyze the ability of the Mask R-CNN instance segmentation algorithm for identifying PWD-infected trees based on RGB synthetic imagery. Then, by adjusting the network input layer structure, the Mask R-CNN was improved for using hyperspectral data to classify PWD infection stages and detect early infected trees, and its performance when using all hyperspectral bands and screened bands as inputs was compared. Then an integrated framework combining pixel-based prototypical network classification model with an individual tree segmentation method was proposed for achieving PWD individual trees identification at the different infection stages. The accuracy of the two methods was finally evaluated, and the effectiveness of the two methods for identifying PWD-infected individual trees was compared. The results indicate that early detection and infection stage monitoring of PWD based on the proposed deep learning models can overcome the lag of manual visual observation and provide technical support for early detection and control of PWD.
2. Materials and Methods
2.1. Study Area and Ground Survey
This study was carried out in Chaohu, located in central Anhui Province, China, with geographical coordinates between 31°16′–32°N and 117°25′–117°58′E. It is a prefecture-level city in Anhui Province, under the administration of Hefei City. Chaohu is situated in the transitional zone from the Jianghuai hills to the Yangtze River plains. The topography is complex and includes five types of landforms, including low mountains, hills, mesas, plains (including lakeside plains and undulating plains), and waters. The topography is high in the north-west and south-east and low in the center, forming a butterfly-shaped, basin-like terrain. Chaohu has a distinctly subtropical humid monsoon climate characterized by four distinct seasons, a mild climate, abundant rainfall, and plenty of sunshine.
Chaohu City is one of the epidemic areas of PWD in China. In recent years, there has been a serious outbreak of PWD, and it is among the most affected areas of PWD occurrence in Anhui Province. The study area location and sample plots are shown in Figure 1.
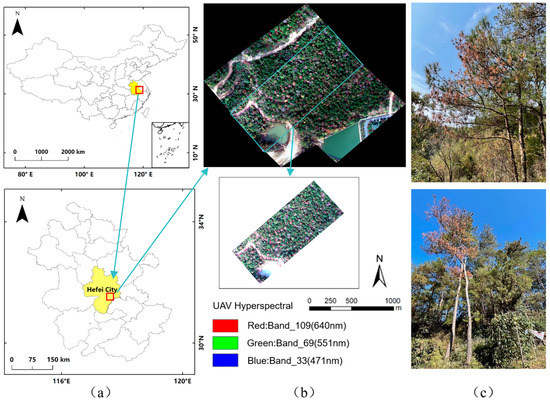
Figure 1.
Overview of the study areas. (a) The location of the study area. (b) The hyperspectral image (in true color composition) and location of sample plots. (c) Images of healthy and infected pine trees in the study area.
We carried out a field survey in November 2019. The study area is designated as a priority area for PWD prevention. The dominant tree species is horsetail pine, accompanied by some broadleaf evergreen trees. The color-changing pine trees have been tested by the local forest pest control and quarantine agency and have all been confirmed to be infected with PWD. We set up a total of six sample plots (25 m × 25 m) at the study site and located each tree individually with a handheld differential GPS S760 (SOUTH Surveying & Mapping, Guangzhou, China). In each plot, we measured the canopy width with a tape measure, tree species, the color of needles, tree vigor, and the PWD infection stage of each tree was also recorded. Healthy pine trees were also sampled and determined to be free of PWD infection by morphological and molecular identification in the laboratory [30,31].
2.2. Drone Data Collection and Preprocessing
On 5 November 2019, hyperspectral imagery with a spatial resolution of approximately 5.7 cm was acquired using a DJI m600 pro UAV (DJI, Shenzhen, China) equipped with a Nano-Hyperspec ultra-miniature airborne hyperspectral imaging spectrometer (Headwall Photonics, Fitchburg, MA, USA) through two UAV take-off and landing sorties at an altitude of approximately 120 m. The flight parameters of the DJI m600 pro UAV are listed in Table 1, and the main parameters of the hyperspectral sensor are listed in Table 2.

Table 1.
The flying parameters of DJI m600 pro UAV.

Table 2.
Main parameters of the hyperspectral sensor.
Pre-processing of the raw hyperspectral data mainly includes: radiometric calibration, atmospheric correction, geometric correction, topographic radiometric correction, and image spatial resolution resampling.
In this paper, the radiometric calibration is based on the calibration file provided by the Nano-Hyperspec ultra-miniature airborne hyperspectral imaging spectrometer, and we convert the DN values of the raw hyperspectral data into radiation brightness values, using the following formula:
where is the radiation correction factor; is the pixel brightness value of the raw data; is the corresponding image element dark current data recorded by the sensor; is the brightness value of the scattered light; and is the radiation brightness with unit of .
Atmospheric correction is a process to invert the true reflectance of features. The main purpose is to remove the influence of factors such as light and atmosphere from the reflectance of features to reflect the true reflectance of the features and to facilitate the extraction of surface features. Compared to images acquired by remote sensing satellites, UAV images are less affected by the atmosphere, and the correction process is relatively simple. This study uses the QUAC fast atmospheric correction tool in ENVI 5.3 (Version 5.3, Exelis Visual Information Solutions, Boulder, CO, USA) for atmospheric correction of hyperspectral data.
Geometric corrections were conducted by applying eight ground control points (corner points of two sample plots) whose positions were measured with a handheld differential GPS S760 (SOUTH Surveying & Mapping, Guangzhou, China) with an accuracy of 2 m.
Terrain correction is an important pre-processing process for remote sensing imagery in order to obtain the true surface reflectance, which can eliminate the influence of terrain factors on the spectral brightness values. In this study, topographic correction was completed using the SCS + C topographic correction model [32], and the formula is as follows:
where is the angle of incidence, and are the intercept and slope of the linear relationship between the pixel luminance value and before correction, respectively; is the solar zenith angle; is the slope; and is the corrected luminance value.
2.3. Division of PWD Infection Stage and Data Processing
2.3.1. Division of PWD Infection Stage
Referring to previous studies [33,34], we combined the ground survey and the spectral characteristics of UAV hyperspectral imagery in this study area to diagnose the infection stages of diseased pine trees (Figure 2). Early PWD-infected trees (Early infected trees) have no significant changes in ground characterization, loss of green in the crown of the UAV imagery, and a decrease in the spectral profile compared to healthy pine trees in the green wavelength range, i.e., the green attack stage. Middle PWD-infected trees (Middle infected trees) have loss of green needles visible at ground level and a distinct yellowing of the crown in the UAV imagery with an increase in the spectral profile compared to healthy pine trees in the yellow wavelength range, i.e., the yellow attack stage. Late PWD-infected trees (Late infected trees) have red needles visible from the ground, reddish-brown crowns on UAV imagery, and a spectral profile that rises in the red light wavelength range compared to healthy pine trees, i.e., the red attack stage. PWD-infected dead trees (Dead trees) have dry needles visible from the ground, a greyish-purple crown on the UAV imagery, and a spectral profile that rises in the blue light wavelength range compared to healthy pine trees, i.e., the grey attack stage.
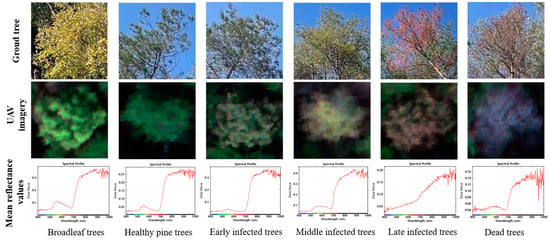
Figure 2.
PWD infection stage diagnosis.
As shown in Figure 2, there are some differences in the spectral profiles of broadleaf trees and PWD-infected trees, with the mean reflectance values near 950 nm differing from that of PWD-infected trees. We performed single wood spectral diagnostics on each tree in the study area to remove the effect of discolored broadleaf trees in the process of labeling PWD-infected trees in order to ensure the accuracy of sample labels. The spectral profiles of different infection stages of PWD are shown in Figure 3.
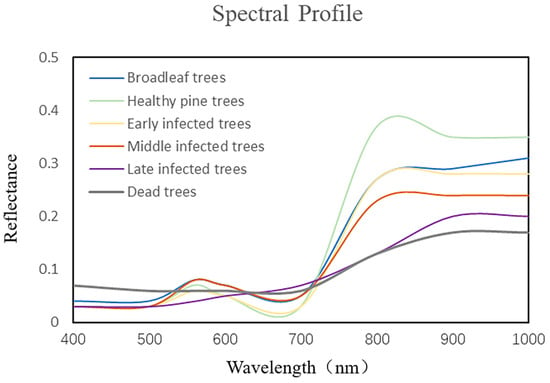
Figure 3.
Spectral curves of different PWD infection stages.
Based on the above, the PWD infection stages of pine trees were classified and shown in Table 3.

Table 3.
Stages of PWD infection.
2.3.2. RGB Data Processing
In this study, true color imagery was generated by combining bands R: 640 nm, G: 551 nm and B: 471 nm based on the pre-processed imagery from the UAV hyperspectral data, as shown in Table 4.

Table 4.
Wavelength bands used in RGB composite imagery.
2.3.3. Hyperspectral Feature Bands Filtering
Considering that the onset of the infected host plant is from late August to early November and the influence of clouds in the study area, this paper established a hyperspectral feature preferred bands dataset through information enhancement and feature bands selection based on the UAV hyperspectral imagery in October 2019.
Linear discriminant analysis (LDA), a linear projection technique proposed by Fisher [35], is used to perform band screening of hyperspectral features. The features after dimensionality reduction based on LDA can retain the valid classification information to the maximum extent. The principle is to project the data points in the training dataset into a low-dimensional space at training time, so that the projected points for samples of the same category are as close as possible and the projected points for samples of different categories are as far apart as possible. In forecasting, the forecast data is projected onto the line above, and the category to which it belongs is determined by the location of the projection point [36]. When modelling with LDA, we conduct 10 experiments in order to eliminate, as much as possible, the errors caused by sample set partitioning, in each of which the training and validation sets are randomly assigned.
According to the research results of Li et al. [37], a linear discriminant analysis was performed on each band of the UAV hyperspectral to filter out eight bands that were useful for distinguishing healthy pine trees from early PWD-infected trees, as shown in Table 5, and these eight bands were used to construct a feature preferred bands dataset for early PWD-infected individual tree identification.

Table 5.
Dataset of feature preferred bands.
2.3.4. PWD-Infected Individual Tree Species Sample Set Construction
The Mask R-CNN dataset has a segmentation size of 512 × 512. Based on Labelme data annotation software (Version 5.0.5, Computer Science and Artificial Intelligence Lab, Massachusetts Institute of Technology, Cambridge, MA, USA), the canopy profile of PWD-infected trees was outlined in the RGB composite imagery using the polygon creation function, and the spectral information was combined to diagnose the different infection stages by assigning a specific label to each category, with different numbers indicating different individuals under the same category. The annotation data was saved as a file in JSON format. A total of 878 trees were labelled and divided into training and validation sets in a ratio of 8:2. Table 6 shows the detailed information of the sample set.

Table 6.
Number of samples in dataset for Mask R-CNN instance segmentation model.
The prototypical network sample dataset was generated from JSON tagged sample mask files and vectorization based on the ArcGIS (Version 10.2, Esri, Redlands, CA, USA) platform in order to ensure consistent tagging of PWD-infected tree samples with the Mask R-CNN sample set. Since the prototypical network is a classification network and there are other ground cover types in the experimental area besides pine forests, samples of healthy pine trees, other woodlands, water bodies, and roads were also labelled to achieve full coverage of the classification results. The training sample, validation sample, and test sample were divided according to 2.5%, 2.5%, and 95% as shown in Table 7. The UAV hyperspectral full bands and feature preferred bands data from the study area were used as input data individually for classification and effect evaluation in order to compare the efficacy of these two datasets in identifying different stages of PWD-infected trees.

Table 7.
Classification system and sample set for prototypical network model.
2.4. Methods
This study applied the Mask R-CNN deep learning instance segmentation algorithm as the base model for identifying PWD infection stage of individual trees. Firstly, RGB imagery was composited and input into Mask R-CNN for identifying PWD-infected individual trees at different infection stages. Then the hyperspectral data were subjected to feature band selection to screen out sensitive bands that could improve the accuracy of early identification of PWD. Afterwards, by adjusting the network input layer structure, an improved Mask R-CNN model was constructed to enable hyperspectral full bands and screened bands data input and to verify the usefulness of rich spectral information for the identification of PWD-infected individual trees at different infection stages. Finally, an integrated framework was proposed combing a prototypical network classification method and an individual tree segmentation algorithm for individual tree infection stage identification, which was compared with improved Mask R-CNN to optimize the optimal model for PWD identification based on UAV hyperspectral technology and deep learning techniques. The technology flow chart of this research is shown in Figure 4.
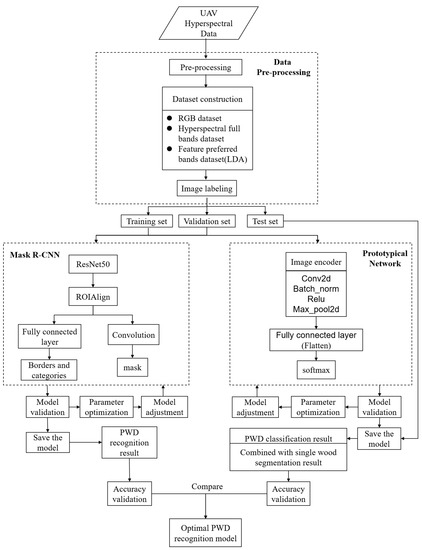
Figure 4.
Technology flow chart of research.
2.4.1. Mask R-CNN
Mask R-CNN is a pixel-level multi-objective instance segmentation algorithm proposed by He et al. [38]. Unlike traditional object detection models that can only output the bounding box of a target, Mask R-CNN can output pixel-level segmentation results for each target while retaining the target’s location and class information, which suggests that the task of detecting the degree of PWD susceptibility and individual tree canopy segmentation can be achieved simultaneously.
To further improve the performance of the model, Mask R-CNN utilizes a Feature Pyramid Network (FPN) in conjunction with ResNet for feature extraction. Based on the RoI Pooling layer, Mask R-CNN uses the RoI Align layer to solve the quantization mismatch problem and improve the accuracy of the bounding box suggestions. In Mask R-CNN, the RoI Align layer is able to generate a more accurate feature map of the region of interest, improving the accuracy of instance segmentation. The network structure of the Mask R-CNN is shown in Figure 5.
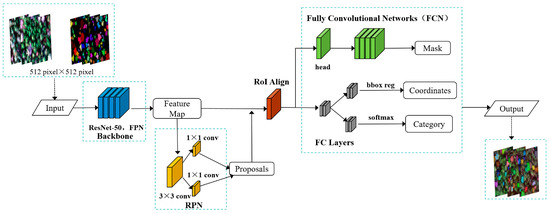
Figure 5.
Network structure of Mask R-CNN.
The loss function of Mask R-CNN consists of three components: target classification loss (), target bounding box regression loss () and target mask segmentation loss (), as shown in Equation (3).
where the Mask loss function represents the average binary cross-entropy loss of the decoupled mask branch and the classification branch. For RoI belonging to the kth class, only the kth mask is considered for calculation in the loss function. Such a definition allows for a mask to be generated for each class and for there to be no inter-class competition.
2.4.2. Improved Mask R-CNN Model
RPN and RoI Align in Mask R-CNN networks are ordinary non-learning processes that do not involve the updating of parameters. As the backbone feature extraction network of Mask R-CNN uses ResNet-50, the pre-trained ResNet-50 model was adapted to make the model meet the input requirements of hyperspectral imagery, and the structure of the improved Mask R-CNN model is shown in Figure 6.
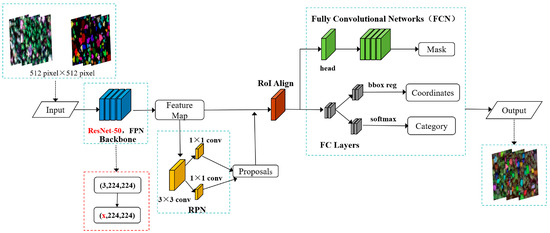
Figure 6.
Improved Mask R-CNN network structure.
ResNet-50 is a deep residual network with 50 layers of depth, consisting of multiple convolutional layers, a batch normalization layer, an activation function, and a fully connected layer. ResNet-50 has an input size of 3 × 224 × 224, i.e., 3 color channels (RGB), 224 pixels wide and 224 pixels high. Improving the number of input channels of Stage 0, i.e., from 3 color channels (RGB) to x channels, enables the input of 270 bands of hyperspectral imagery. ResNet already uses an adaptive pooling layer that is able to change the input image size from x × 512 × 512 to x × 224 × 224. The specific structure of the improved Mask R-CNN backbone feature extraction network is shown in Figure 7.
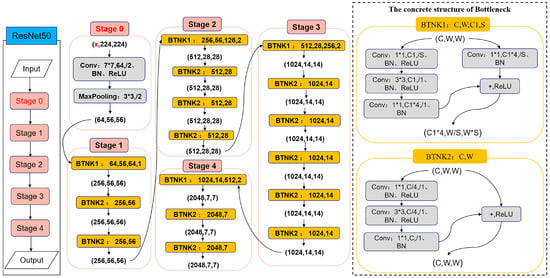
Figure 7.
Improved Mask R-CNN backbone feature extraction network.
2.4.3. Integrated Framework Combing Prototypical Network Classification Model and Individual Tree Segmentation Method
Mask R-CNN can achieve both PWD infection stage classification and individual tree canopy segmentation simultaneously, as it requires a high level of input sample labels, which may lead to identification accuracy that cannot meet the needs of PWD early detection. Therefore, we propose an integrated method combining a prototypical network classification model with an individual tree segmentation to improve the accuracy of early PWD monitoring.
In this study, a prototypical network structure is used to map sliced data with a window size of S × S into a low-dimensional embedding space by means of an embedding function. The embedding function consists of multiple convolutional structures (Layer 1 … Layer N, Layer last), each consisting of a convolutional layer (Conv2d), a batch normalization layer (Batch_norm), a non-linear activation function (Relu), and a maximum pooling layer (Max_pool2d). The convolutional layer extracts features by convolving the input data with a set of learnable filters, and the batch normalization layer normalizes each feature map by mean and unit variance to speed up training and improve generalization performance. The non-linear activation function increases the model representation capability by introducing a non-linear transformation, and the maximum pooling layer divides each feature map into regions and selects the maximum value in each region as the output, which is used to reduce the feature map size and improve translation invariance. In this way, the prototypical network can efficiently extract features from imagery and perform accurate classification.
At the end of the embedding function, the fully connected layer (Flatten) and the softmax function process the F feature values in the prototypical network, allowing the probability values of each category to be calculated as a basis for classification. Specifically, the fully connected layer maps the embedding vectors to an F-dimensional vector space, and the softmax function normalizes the values in that vector space to a probability distribution, representing the probability of each category. The final classification result is the probability value for each category based on the fully connected layer and the softmax function processing. Therefore, we can classify the input data into one of these categories based on these probability values. The classification process is shown in Figure 8.

Figure 8.
Prototypical network classification framework.
The prototypical network identifies the infection pixels of the entire image by classification at pixel level, but does not provide the exact location and canopy edge of the infected trees, i.e., it does not enable direct detection of PWD-infected individual trees. This study uses eCognition’s object-oriented multi-scale segmentation algorithm for imagery canopy extraction to construct an integrated method combining a prototypical network classification model with an individual tree segmentation for PWD-infected individual tree identification.
2.4.4. Experimental Design
First, the experiment used Mask R-CNN, an instance segmentation model based on deep learning algorithms, to input RGB synthetic imageries in order to achieve the recognition of infected individual trees at different infection stages of PWD. Secondly, the hyperspectral full bands and screened bands data are separately input into the improved Mask R-CNN, and the results are compared with those of the RGB dataset to explore the effect of the inclusion of hyperspectral information on optimizing the identification of PWD-infected individual trees and also to verify the role of sensitive bands in improving the accuracy of PWD early identification. ResNet-50 is used as the backbone feature extraction network in the model, and the pre-trained ResNet-50 model is fine-tuned to reduce training time and improve accuracy. In addition, we have optimized the anchor frame parameters. The batch size is set to 1 and the epochs to 300. Using the same polynomial learning rate, the initial learning rate is 0.001 and the learning rate at the end is 0.0001, decreasing at a fixed rate of decay. Using SGD as the optimizer, the momentum and weight decay were set to 0.9 and 0.0001, respectively.
Afterwards, the UAV hyperspectral imagery (3759 × 4061 × 270) and the feature preferred bands synthetic imagery (3759 × 4061 × 8) were used as data sources for the prototypical network classification. Based on the ground survey data, the mean north–south canopy width of horsetail pine in the sample plots in the study area is 2.6 m, the mean east–west canopy width is 2.5 m, and the mean canopy width is 2.55 m. Therefore, considering the imagery resolution of 0.05 m, 51 pixels was taken as the sample window size. The sample data with a final cropping window size of 51 × 51 was used as input data for the prototypical network.
The prototypical network structure used in this study had a convolutional layer output space dimension of 64 (F) and a convolutional kernel of size 3 × 3. The largest pooling layer had a pooling core of size 2 × 2. Using the same embedding function for the support and query sets and using them as input parameters for calculating loss and accuracy, the model was trained through Adam-SGD with an initial learning rate of 0.0001, which would be halved for every 2000 training sessions. The Euclidean distance was used as the metric function, and the negative log-likelihood function was chosen as the loss function for the training of the prototypical network. We adjusted the number of iterations (epochs/iterations) to 60/100 so that the training accuracy was close to 1 as possible. Table 8 lists the specific parameters of the prototypical network structure.

Table 8.
The specific parameters of the prototypical network structure.
For canopy segmentation, this study used eCognition’s object-oriented multi-scale segmentation technique for imagery canopy extraction. eCognition (Version 9.0, Trimble, Sunnyvale, CA, USA) is a remote sensing imagery analysis software based on object-oriented analysis that can be used to segment and classify objects in images. The results and accuracy of canopy segmentation after several trials showed that the best canopy segmentation results were obtained when the scale parameter was set to 51, the shape parameter was set to 0.8, and the compactness was set to 0.9 for multi-scale segmentation. We overlaid the prototypical network classification results with the individual tree canopy segmentation results to obtain the final identification results of individual trees at the different PWD infection stages.
We completed this study with the support of ArcGIS (Version 10.2, Esri, Redlands, CA, USA), ENVI (Version 5.3, Exelis Visual Information Solutions, Boulder, CO, USA), eCognition (Version 9.0, Trimble, Sunnyvale, CA, USA), Lableme (Version 5.0.5, Computer Science and Artificial Intelligence Lab., Massachusetts Institute of Technology, Cambridge, MA, USA), and Python programming based on the Pytorch framework. Windows 10 Professional and Pycharm were chosen as the software runtime platform. The hardware platform was selected with the appropriate GPU, CPU, and memory according to the computational volume, with the following information: (1) GPU: NVIDIA GeForce RTX 3090; (2) CPU: Intel(R) Xeon(R) W-2275 CPU @ 3.30 GHz 3.31 GHz; (3) Memory: 128 GB of RAM on board.
2.5. Evaluation Metrics
To assess the results of classification and segmentation, different assessment metrics were used, including average accuracy (), overall accuracy (), and coefficient [39]. These metrics were calculated based on true positives (), true negatives (), false positives (), false negatives (), and the total number of samples () in the following manner:
where is the number of categories; is the number of category correctly classified; is the number of true values of category; and is the number of predicted values of category.
3. Results
3.1. Recognition Results of PWD-Infected Individual Trees Using Improved Mask R-CNN
The recognition of PWD-infected individual trees based on the improved Mask R-CNN, with different datasets input, was obtained as shown in Figure 9, where the percentages indicate the probability of the detected individual tree results being that infection stage of PWD, with early infected trees shown as E, middle infected trees shown as M, late infected trees shown as L, and dead trees shown as D. As can be seen from Figure 9, using only RGB for PWD-infected individual tree identification, the individual tree detection and segmentation results are significantly inferior to those using the hyperspectral dataset. Comparing the detection results of the improved Mask R-CNN using full hyperspectral bands and feature preferred bands, it can be found that adding hyperspectral features can detect PWD-infected individual trees more effectively, reducing the number of missed detections and improving the individual tree detection accuracy.
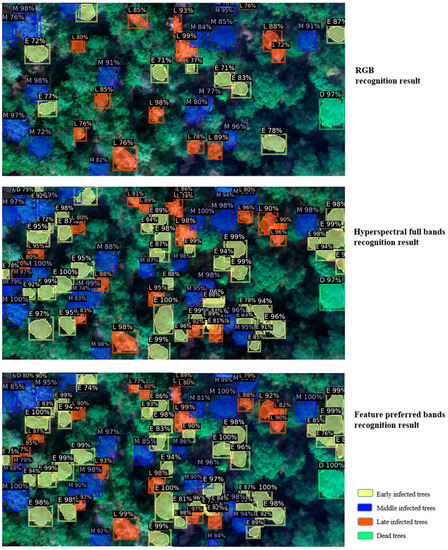
Figure 9.
Identification results of PWD-infected individual trees based on improved Mask R-CNN.
3.2. Detection Results of PWD-Infected Individual Trees Based on Integrated Prototypical Network
The results of the prototypical network classification experiments are shown in Figure 10. By observing the classification map, it is clear that the UAV hyperspectral imagery has a wealth of spectral information and is able to effectively differentiate between feature classes with large spectral differences, such as water bodies and roads. The other woodlands also have large spectral differences from the horsetail pine in the study area and can be distinguished by hyperspectral data. In the PWD-infected trees classification, the prototypical network based on a hyperspectral full bands dataset incorrectly classified some healthy pine trees as early infected trees, and there was also significant misclassification of late infected trees and dead trees. The reason is that the spectral distinction between early PWD-infected trees and healthy pine trees is not obvious, and there may be a lot of redundant information interference in the hyperspectral full bands dataset. Conversely, using the feature preferred bands dataset as input data enables better differentiation between healthy pine trees and early PWD-infected trees, and also enables better classification of late PWD-infected trees and dead trees. In addition, the main objective of band screening in this study was to distinguish healthy pine trees from early PWD-infected trees, and feature preferred bands for middle PWD-infected trees were missing. Therefore, the classification of middle PWD-infected trees using only the feature preferred bands produced more misclassifications than the hyperspectral full bands.
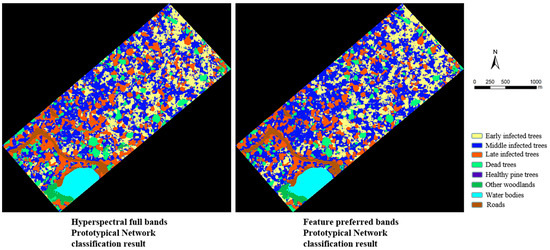
Figure 10.
Prototypical network classification result map.
In this study, eCognition was used to perform individual tree canopy segmentation on UAV hyperspectral imagery, combined with the results of prototypical network classification, to achieve the localization and extraction of individual trees at different PWD infection stages. The results and accuracy of canopy segmentation after several trials showed that the best canopy segmentation results were obtained when the scale parameter was set to 51, the shape parameter was set to 0.8, and the compactness was set to 0.9 for multi-scale segmentation.
During the field survey, we measured the canopy width (notated as REW and RSN) and position of the trees in the east–west and north–south directions in the sample plots, and verified the single tree positions by combining the field survey data and the UAV hyperspectral imagery. Due to the large number of trees in the validation sample site, we randomly and evenly selected 50 single trees and used visual interpretation to determine whether the marked trees had been successfully segmented. The results showed that 43 trees were correctly segmented with an accuracy of 86%. The results of the individual tree canopy extractions are shown in Table 9, with an average relative error of 9.57% for object-oriented multi-scale segmentation.

Table 9.
Extraction results of individual tree canopies.
Roads, water bodies, healthy pine trees, and other woodlands were removed from the prototypical network classification result in order to obtain a distribution map of different infection stages of PWD. It was then overlaid with the results of the individual tree segmentation to produce an individual tree segmentation result map of the different infection stages of PWD, as shown in Figure 11. Although there is some error in individual tree canopy segmentation, the prototypical network classification can obtain higher accuracy in early identification of PWD, which is better than that of Mask R-CNN, enabling more timely detection of PWD, as well as better determination of the degree of infection in PWD epidemic areas. In conclusion, the classification results of the prototypical network can be overlaid with the results of the individual tree canopy segmentation in order to obtain information on the location of infected trees at different stages of PWD. The proposed combined prototypical network classification model and individual tree segmentation method can support the detection of PWD and can effectively improve the efficiency of epidemic prevention and control.
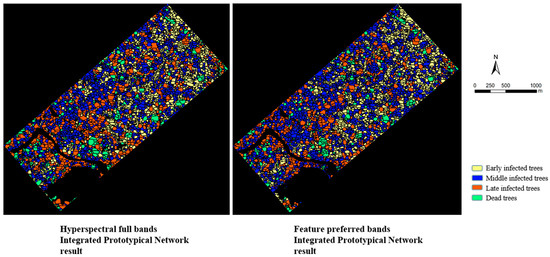
Figure 11.
Individual tree canopy segmentation combined with classification result map.
3.3. Comparison of the PWD Detection Results Using Improved Mask R-CNN and Integrated Prototypical Network
The overall accuracy evaluation of the PWD-infected tree identification methods is shown in Table 10. As can be seen, the feature preferred bands dataset obtained 71% and 83.51% overall accuracy (OA) on the improved Mask R-CNN method and the combined prototypical network classification model and individual tree segmentation method, respectively. While the integrated prototypical network method was able to obtain higher early identification accuracy (74.89%), an 11.39% improvement over improved Mask R-CNN, the other infection stages also obtained higher recognition accuracy (83.29% for middle infected trees; 87.86% for late infected trees; and 87.84% for dead trees). For the improved Mask R-CNN method, we have verified that the hyperspectral full bands dataset (OA: 68%) is better than the RGB dataset (OA: 64.60%) in distinguishing the PWD infection stages. However, there is a large amount of redundant data in the hyperspectral data, and we also verified that the feature preferred bands dataset has better PWD-infected individual tree recognition accuracy than the hyperspectral full bands dataset based on both the improved Mask R-CNN method and the prototypical network classification method. Based on the improved Mask R-CNN method, the hyperspectral full bands dataset and the feature preferred bands dataset obtained an overall accuracy of 68% and 71% for the PWD-infected individual tree identification, respectively. The overall accuracy of the prototypical network classification was 92.17% and 92.79% using the hyperspectral full bands dataset and the feature preferred bands dataset, respectively. Ultimately, combined with the individual tree segmentation results, the overall accuracy of individual infected tree detection reached 82.95% and 83.51%.

Table 10.
Overall accuracy evaluation.
Based on improved Mask R-CNN to identify PWD-infected individual trees, the feature preferred bands dataset obtained good identification results on different infection stages (63.50% for early infected trees; 77.50% for middle infected trees; 68.40% for late infected trees; and 74.50% for dead trees). Based on the combined prototypical network classification model and individual tree segmentation method to identify PWD-infected individual trees, the feature preferred bands dataset obtained better identification results in early, late, and dead stages (74.89% for early infected trees; 87.85% for late infected trees; 87.84% for dead trees), while the accuracy in the middle stage of infection (83.29% for the feature preferred bands dataset) decreased by 1.19% compared to the hyperspectral full bands dataset (84.48%). The reason is that the main objective of the band screening conducted in this study was to distinguish healthy pine trees from early PWD-infected trees, resulting in the absence of sensitive bands for middle PWD-infected trees. Therefore, more bands can be added to the prototypical network to construct the optimal dataset of different infection stage recognition to improve the classification accuracy of all the infection stages. A comparative diagram of the different methods for identifying PWD infection stages is shown in Figure 12.
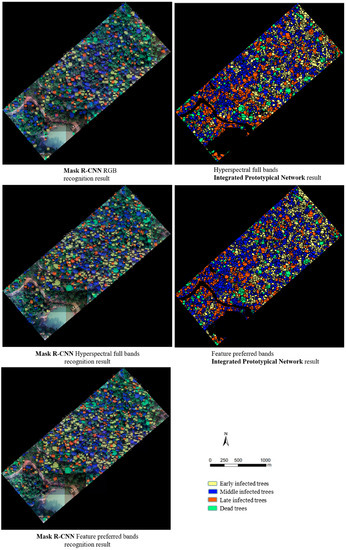
Figure 12.
Comparison chart of different methods to identify PWD infection stages.
4. Discussion
4.1. Detection Ability of Deep Learning Models Using RGB Image for PWD-Infected Trees
Previous research has employed deep learning target detection algorithms to detect PWD-infected individual trees using UAV-based RGB imagery and multispectral imagery. Xu et al. [12] employed the Faster R-CNN algorithm considering the influence of other dead trees and red broadleaf trees for identifying PWD-infected trees using ultra-high spatial resolution imagery from an unmanned aircraft equipped with a visible RGB digital camera, and the accuracy of PWD-infected trees identification was 75.64%. Yu et al. [29] conducted experiments utilizing UAV-based multispectral imagery and deep learning algorithms for early detection of PWD in Yiwu, Zhejiang province. The overall accuracy of YOLOv4 and Faster R-CNN reached 57.07% and 60.98%, respectively, and the optimal recognition accuracy of early PWD-infected trees was 48.88% based on Faster R-CNN. In this study, the Mask R-CNN method was introduced into the identification of PWD-infected individual trees for differentiation of infection stages. Mask R-CNN was able to reduce the error of anchor frame misclassification and better identify PWD-infected individual trees by segmenting the canopy boundary. The results showed that Mask R-CNN achieved better recognition of PWD-infected trees (OA: 64.60%) on the basis of distinguishing PWD infection stages, and the recognition of infected individual trees boundaries was better than that of Faster R-CNN, which is conducive to PWD early prevention and control. Previously, Li et al. [40] applied Mask R-CNN to tree species classification from UAV RGB images and achieved an overall accuracy of 63.24%. In contrast, the PWD-infected individual trees in this study were all horsetail pines, and the overall accuracy of Mask R-CNN based on RGB imagery reached 64.60%, indicating that the sensitive bands of PWD were correlated with RGB bands. In addition, the early recognition accuracy of Mask R-CNN for PWD-infected trees in this study reached 54.30%, which is higher than the early recognition accuracy of existing single-wood scale studies.
4.2. Comparison of Different Models for Identifying PWD-Infected Individual Trees
In this study, based on Mask R-CNN, the hyperspectral data input was achieved by improving the Mask R-CNN input channel, and an overall accuracy of 71% was obtained on the feature screened bands dataset, of which the PWD early recognition accuracy was 63.50%. The results show that the improved Mask R-CNN model achieves better individual tree segmentation and effectively improves the recognition accuracy of early PWD-infected trees based on hyperspectral data. However, due to the high input sample requirement of Mask R-CNN, the early recognition accuracy obtained by this method cannot meet the demand of PWD prevention and control.
The prototypical network model has the advantage of small sample learning, and its simple network structure makes the classification process more efficient and achieves higher classification accuracy [41,42]. Based on the prototypical network classification algorithm, using the hyperspectral full bands dataset and the feature preferred bands dataset as model inputs, this study achieved an overall accuracy of 92.17% and 92.79%, respectively, for all stages of PWD detection, with early identification accuracy reaching 82.17% and 83.21%, respectively. Previous studies have used 3D convolutional neural network models for early detection of PWD based on UAV hyperspectral imagery [14] and obtained an overall accuracy of 83.05% and an early identification accuracy of 59.76%. The constructed 3D-Res CNN model obtained an overall accuracy of 88.11% and an early identification accuracy of 72.86%. However, this study was pixel-based classification and could not obtain accurate locations of PWD-infected individual trees. In our study, the results of the prototypical network classification were further combined with individual tree canopy segmentation, which achieved an overall accuracy of 82.95% and 83.51% using hyperspectral full bands dataset and the feature preferred bands dataset, respectively, with 73.95% and 74.89% accuracy in the identification of early PWD-infected trees. The combined prototypical network classification model and individual tree segmentation method outperformed the Mask R-CNN model in terms of accuracy, especially for early identification of PWD. Therefore, the method based on prototypical classification overlaying with individual tree segmentation can support the detection of PWD, and the identification of early infected trees can effectively improve the efficiency of epidemic control.
4.3. Existing Deficiencies and Future Prospects
In this work, the two proposed methods can provide new technical guidance for early detection and monitoring of PWD infection stages. However, we also recognized the deficiencies of this study in order to provide some ideas for improvement that will be useful for future works. For the improved Mask R-CNN model, we only modified the input layer structure and optimized the anchor frame parameters, which can be considered to optimize the rest of the structure to improve the accuracy. Due to data constraints, we did not validate the migratory potential of the improved Mask R-CNN. In later work, the study area and sample datasets could be expanded. In this study, we only used LDA to perform band screening of hyperspectral features and selected eight sensitive bands to construct a comparison dataset. In future work, other data reduction methods can be used for dataset construction to improve the PWD identification accuracy. In addition, exploring more accurate single-wood segmentation methods is also an effective means of improving the accuracy of PWD-infected individual trees.
5. Conclusions
This study addresses the need for PWD prevention and control by using UAV remote sensing technology and a deep learning model for intelligent identification of PWD-infected individual trees, providing a feasible application solution for monitoring, prevention, and control of PWD based on UAV remote sensing technology. UAV-based hyperspectral data were applied to construct RGB, full bands, and feature preferred bands datasets, and intelligent recognition of PWD-infected individual trees was achieved by improving the input layer structure of the Mask R-CNN network model. Based on the improved Mask R-CNN model, an overall accuracy of 68% was obtained for the input hyperspectral full bands dataset, an improvement of 3.40% over the RGB dataset, in which the early accuracy was improved by 8.60%. The results show that hyperspectral data can effectively improve the accuracy of identifying PWD-infected individual trees and early infected trees that are little different from healthy pine trees in spectral reflectance. In addition, LDA was used for band screening, and eight sensitive bands were selected as the feature preferred bands dataset for experiments. An overall accuracy of 71% was obtained, of which the early identification accuracy reached 63.50%. The results show that the best identification results were obtained with the feature preferred bands dataset, and the identification accuracy of all infection stages was effectively improved. The results of this study provide a basis for identifying PWD-infected trees based on sensitive bands of multispectral data.
The improved Mask R-CNN method enables simultaneous classification of PWD infection stages and canopy segmentation of PWD-infected individual trees, but identification accuracy is limited by the high input sample requirement. To meet the needs of early monitoring and control of PWD, we propose an integrated method combining a prototypical network classification model with an individual tree segmentation algorithm for the identification of PWD-infected individual trees at different stages. Based on the prototypical network model, the UAV hyperspectral imagery was input for training to obtain the pixel-level classification results at different infection stages, which were combined with individual tree canopy segmentation to obtain PWD-infected individual tree identification results. An overall accuracy of 82.95% was achieved using the hyperspectral full bands dataset, with 73.95% accuracy for early infected trees identification. An overall accuracy of 83.51% was obtained using the feature preferred bands dataset, with 74.89% accuracy for early infected tree identification. Compared with the end-to-end Mask R-CNN model for individual tree segmentation, the integrated method improved the overall accuracy by 14.95% and 12.51% based on both the hyperspectral full bands dataset and the feature preferred bands dataset, respectively, and the early identification accuracy by 11.05% and 11.39%, respectively. Meanwhile, the identification accuracy of the other three infection stages was also improved, indicating that it is a feasible method for effective PWD monitoring.
Author Contributions
Conceptualization, H.L. and X.Z.; methodology, H.L., L.C., Z.Y. and X.Z.; software, H.L., L.C. and Z.Y.; validation, H.L., L.C., Z.Y. and N.L.; formal analysis, H.L. and X.Z.; investigation, H.L., N.L. and L.L.; resources, X.Z.; data curation, H.L., N.L. and L.C.; writing—original draft preparation, H.L.; writing—review and editing, X.Z.; visualization, H.L.; supervision, X.Z.; project administration, X.Z.; funding acquisition, X.Z. All authors have read and agreed to the published version of the manuscript.
Funding
This research was funded by the National Natural Science Foundation of China (31870534), and the China EU Science and Technology Cooperation Phase V (59257).
Data Availability Statement
The data is not available because the team data involves privacy issues.
Acknowledgments
The authors would like to thank N.W.L. and L.L. for the field investigation and X.L.Z., L.C., and Z.Q.Y. for their suggestion and modification to this paper.
Conflicts of Interest
The authors declare no conflict of interest.
References
- Futai, K. Pine Wood Nematode, Bursaphelenchus Xylophilus. Annu. Rev. Phytopathol. 2013, 51, 61–83. [Google Scholar] [CrossRef] [PubMed]
- Escuer, M.; Arias, M.; Bello, A. Occurrence of the Genus Bursaphelenchus Fuchs, 1937 (Nematoda: Aphelenchida) in Spanish Conifer Forests. Nematology 2004, 6, 155–156. [Google Scholar] [CrossRef]
- Futai, K. Role of Asymptomatic Carrier Trees in Epidemic Spread of Pine Wilt Disease. J. For. Res. 2003, 8, 253–260. [Google Scholar] [CrossRef]
- Jones, J.T.; Moens, M.; Mota, M.; Li, H.; Kikuchi, T. Bursaphelenchus Xylophilus: Opportunities in Comparative Genomics and Molecular Host-Parasite Interactions. Mol. Plant Pathol. 2008, 9, 357–368. [Google Scholar] [CrossRef]
- Proença, D.N.; Francisco, R.; Santos, C.V.; Lopes, A.; Fonseca, L.; Abrantes, I.M.O.; Morais, P.V. Diversity of Bacteria Associated with Bursaphelenchus Xylophilus and Other Nematodes Isolated from Pinus Pinaster Trees with Pine Wilt Disease. PLoS ONE 2010, 5, e15191. [Google Scholar] [CrossRef]
- Mota, M.M.; Vieira, P. Pine Wilt Disease: A Worldwide Threat to Forest Ecosystems; Springer: Berlin/Heidelberg, Germany, 2008; ISBN 9784431756545. [Google Scholar]
- Čerevková, A.; Mota, M.; Vieira, P. Bursaphelenchus Xylophilus (Steiner & Buhrer, 1934) Nickle 1970-Pinewood Nematode: A Threat to European Forests. For. J. 2014, 60, 125–129. [Google Scholar] [CrossRef]
- Ye, J. Epidemic Status of Pine Wilt Disease in China and Its Prevention and Control Techniques and Counter Measures. Sci. Silvae Sin. 2019, 55, 1–10. [Google Scholar]
- Zhang, B.; Ye, H.; Lu, W.; Huang, W.; Wu, B.; Hao, Z.; Sun, H. A Spatiotemporal Change Detection Method for Monitoring Pine Wilt Disease in a Complex Landscape Using High-Resolution Remote Sensing Imagery. Remote Sens. 2021, 13, 2083. [Google Scholar] [CrossRef]
- Iordache, M.D.; Mantas, V.; Baltazar, E.; Pauly, K.; Lewyckyj, N. A Machine Learning Approach to Detecting Pine Wilt Disease Using Airborne Spectral Imagery. Remote Sens. 2020, 12, 2280. [Google Scholar] [CrossRef]
- Zhang, S.; Huang, J.; Hanan, J.; Qin, L. A Hyperspectral GA-PLSR Model for Prediction of Pine Wilt Disease. Multimed. Tools Appl. 2020, 79, 16645–16661. [Google Scholar] [CrossRef]
- Xu, X.; Tao, H.; Li, C.; Cheng, C.; Guo, H.; Zhou, J. Detection and Location of Pine Wilt Disease Induced Dead Pine Trees Based on Faster R-CNN. Trans. Chin. Soc. Agric. Mach. 2020, 51, 228–236. [Google Scholar]
- Pan, J.; Lin, J.; Xie, T. Exploring the Potential of UAV-Based Hyperspectral Imagery on Pine Wilt Disease Detection: Influence of Spatio-Temporal Scales. Remote Sens. 2023, 15, 2281. [Google Scholar] [CrossRef]
- Yu, R.; Luo, Y.; Li, H.; Yang, L.; Huang, H.; Yu, L.; Ren, L. Three-Dimensional Convolutional Neural Network Model for Early Detection of Pine Wilt Disease Using Uav-Based Hyperspectral Images. Remote Sens. 2021, 13, 4065. [Google Scholar] [CrossRef]
- Li, N.; Huo, L.; Zhang, X. Classification of Pine Wilt Disease at Different Infection Stages by Diagnostic Hyperspectral Bands. Ecol. Indic. 2022, 142, 109198. [Google Scholar] [CrossRef]
- You, J.; Zhang, R.; Lee, J. A Deep Learning-Based Generalized System for Detecting Pine Wilt Disease Using RGB-Based UAV Images. Remote Sens. 2022, 14, 150. [Google Scholar] [CrossRef]
- Ecke, S.; Dempewolf, J.; Frey, J.; Schwaller, A.; Endres, E.; Klemmt, H.J.; Tiede, D.; Seifert, T. UAV-Based Forest Health Monitoring: A Systematic Review. Remote Sens. 2022, 14, 3205. [Google Scholar] [CrossRef]
- Tao, H.; Li, C.; Zhao, D.; Deng, S.; Hu, H.; Xu, X.; Jing, W. Deep Learning-Based Dead Pine Tree Detection from Unmanned Aerial Vehicle Images. Int. J. Remote Sens. 2020, 41, 8238–8255. [Google Scholar] [CrossRef]
- Deng, X.; Tong, Z.; Lan, Y.; Huang, Z. Detection and Location of Dead Trees with Pine Wilt Disease Based on Deep Learning and UAV Remote Sensing. AgriEngineering 2020, 2, 19. [Google Scholar] [CrossRef]
- Tang, L.; Shao, G. Drone Remote Sensing for Forestry Research and Practices. J. For. Res. 2015, 26, 791–797. [Google Scholar] [CrossRef]
- Torresan, C.; Berton, A.; Carotenuto, F.; Di Gennaro, S.F.; Gioli, B.; Matese, A.; Miglietta, F.; Vagnoli, C.; Zaldei, A.; Wallace, L. Forestry Applications of UAVs in Europe: A Review. Int. J. Remote Sens. 2017, 38, 2427–2447. [Google Scholar] [CrossRef]
- Einzmann, K.; Atzberger, C.; Pinnel, N.; Glas, C.; Böck, S.; Seitz, R.; Immitzer, M. Early Detection of Spruce Vitality Loss with Hyperspectral Data: Results of an Experimental Study in Bavaria, Germany. Remote Sens. Environ. 2021, 266, 112676. [Google Scholar] [CrossRef]
- Matese, A.; Toscano, P.; Di Gennaro, S.F.; Genesio, L.; Vaccari, F.P.; Primicerio, J.; Belli, C.; Zaldei, A.; Bianconi, R.; Gioli, B. Intercomparison of UAV, Aircraft and Satellite Remote Sensing Platforms for Precision Viticulture. Remote Sens. 2015, 7, 2971–2990. [Google Scholar] [CrossRef]
- Redmon, J.; Divvala, S.; Girshick, R.; Farhadi, A. You Only Look Once: Unified, Real-Time Object Detection. In Proceedings of the IEEE Computer Society Conference on Computer Vision and Pattern Recognition, Las Vegas, NV, USA, 27–30 June 2016. [Google Scholar]
- Girshick, R.; Donahue, J.; Darrell, T.; Malik, J. Rich Feature Hierarchies for Accurate Object Detection and Semantic Segmentation. In Proceedings of the IEEE Computer Society Conference on Computer Vision and Pattern Recognition, Columbus, OH, USA, 23–28 June 2014. [Google Scholar]
- Liu, W.; Anguelov, D.; Erhan, D.; Szegedy, C.; Reed, S.; Fu, C.Y.; Berg, A.C. SSD: Single Shot Multibox Detector. In Proceedings of the Computer Vision–ECCV 2016: 14th European Conference, Amsterdam, The Netherlands, 11–14 October 2016. Lecture Notes in Computer Science (including subseries Lecture Notes in Artificial Intelligence and Lecture Notes in Bioinformatics). [Google Scholar]
- Wu, B.; Liang, A.; Zhang, H.; Zhu, T.; Zou, Z.; Yang, D.; Tang, W.; Li, J.; Su, J. Application of Conventional UAV-Based High-Throughput Object Detection to the Early Diagnosis of Pine Wilt Disease by Deep Learning. For. Ecol. Manag. 2021, 486, 118986. [Google Scholar] [CrossRef]
- Hu, G.; Yin, C.; Wan, M.; Zhang, Y.; Fang, Y. Recognition of Diseased Pinus Trees in UAV Images Using Deep Learning and AdaBoost Classifier. Biosyst. Eng. 2020, 194, 138–151. [Google Scholar] [CrossRef]
- Yu, R.; Luo, Y.; Zhou, Q.; Zhang, X.; Wu, D.; Ren, L. Early Detection of Pine Wilt Disease Using Deep Learning Algorithms and UAV-Based Multispectral Imagery. For. Ecol. Manag. 2021, 497, 119493. [Google Scholar] [CrossRef]
- Iwahori, H.; Futai, K. Lipid Peroxidation and Ion Exudation of Pine Callus Tissues Inoculated with Pinewood Nematodes. Nematol. Res. (Jpn. J. Nematol.) 1993, 23, 79–89. [Google Scholar] [CrossRef]
- Gu, J.; Wang, J.; Braasch, H.; Burgermeister, W.; Schröder, T. Morphological and Molecular Characterisation of Mucronate Isolates (“M” Form) of Bursaphelenchus Xylophilus (Nematoda: Aphelenchoididae). Russ. J. Nematol. 2011, 19, 103–120. [Google Scholar]
- Soenen, S.A.; Peddle, D.R.; Coburn, C.A. SCS+C: A Modified Sun-Canopy-Sensor Topographic Correction in Forested Terrain. IEEE Trans. Geosci. Remote Sens. 2005, 43, 2148–2159. [Google Scholar] [CrossRef]
- Xu, H.C.; Luo, Y.Q.; Zhang, T.T.; Shi, Y.J. Changes of Reflectance Spectra of Pine Needles in Different Stage after Being Infected by Pine Wood Nematode. Guang Pu Xue Yu Guang Pu Fen Xi/Spectrosc. Spectr. Anal. 2011, 31, 1352–1356. [Google Scholar]
- dos Santos, C.S.S.; de Vasconcelos, M.W. Identification of Genes Differentially Expressed in Pinus Pinaster and Pinus Pinea after Infection with the Pine Wood Nematode. Eur. J. Plant Pathol. 2012, 132, 407–418. [Google Scholar] [CrossRef]
- Fisher, R.A. The Use of Multiple Measurements in Taxonomic Problems. Ann. Eugen. 1936, 7, 179–188. [Google Scholar] [CrossRef]
- Tharwat, A.; Gaber, T.; Ibrahim, A.; Hassanien, A.E. Linear Discriminant Analysis: A Detailed Tutorial. AI Commun. 2017, 30, 169–190. [Google Scholar] [CrossRef]
- Li, N. Research on Early Diagnostic Spectral Features of Pine Wilt Disease Based on Satellite-Airborne-Ground Remote Sensing Data. Ph.D. Thesis, Beijing Forestry University, Beijing, China, 2023. [Google Scholar]
- He, K.; Gkioxari, G.; Dollár, P.; Girshick, R. Mask R-CNN. IEEE Trans. Pattern Anal. Mach. Intell. 2020, 42, 386–397. [Google Scholar] [CrossRef]
- Congalton, R.G. A Review of Assessing the Accuracy of Classifications of Remotely Sensed Data. Remote Sens. Environ. 1991, 37, 35–46. [Google Scholar] [CrossRef]
- Li, Y.; Chai, G.; Wang, Y.; Lei, L.; Zhang, X. ACE R-CNN: An Attention Complementary and Edge Detection-Based Instance Segmentation Algorithm for Individual Tree Species Identification Using UAV RGB Images and LiDAR Data. Remote Sens. 2022, 14, 3035. [Google Scholar] [CrossRef]
- Tian, X.; Chen, L.; Zhang, X.; Chen, E. Improved Prototypical Network Model for Forest Species Classification in Complex Stand. Remote Sens. 2020, 12, 3839. [Google Scholar] [CrossRef]
- Chen, L.; Tian, X.; Chai, G.; Zhang, X.; Chen, E. A New CBAM-P-Net Model for Few-Shot Forest Species Classification Using Airborne Hyperspectral Images. Remote Sens. 2021, 13, 1269. [Google Scholar] [CrossRef]
Disclaimer/Publisher’s Note: The statements, opinions and data contained in all publications are solely those of the individual author(s) and contributor(s) and not of MDPI and/or the editor(s). MDPI and/or the editor(s) disclaim responsibility for any injury to people or property resulting from any ideas, methods, instructions or products referred to in the content. |
© 2023 by the authors. Licensee MDPI, Basel, Switzerland. This article is an open access article distributed under the terms and conditions of the Creative Commons Attribution (CC BY) license (https://creativecommons.org/licenses/by/4.0/).