
Use of Images Obtained by Remotely Piloted Aircraft and Random Forest for the Detection of Leaf Miner (Leucoptera coffeella) in Newly Planted Coffee Trees


 , ,
, ,  , and
, and 
Abstract
1. Introduction
2. Materials and Methods
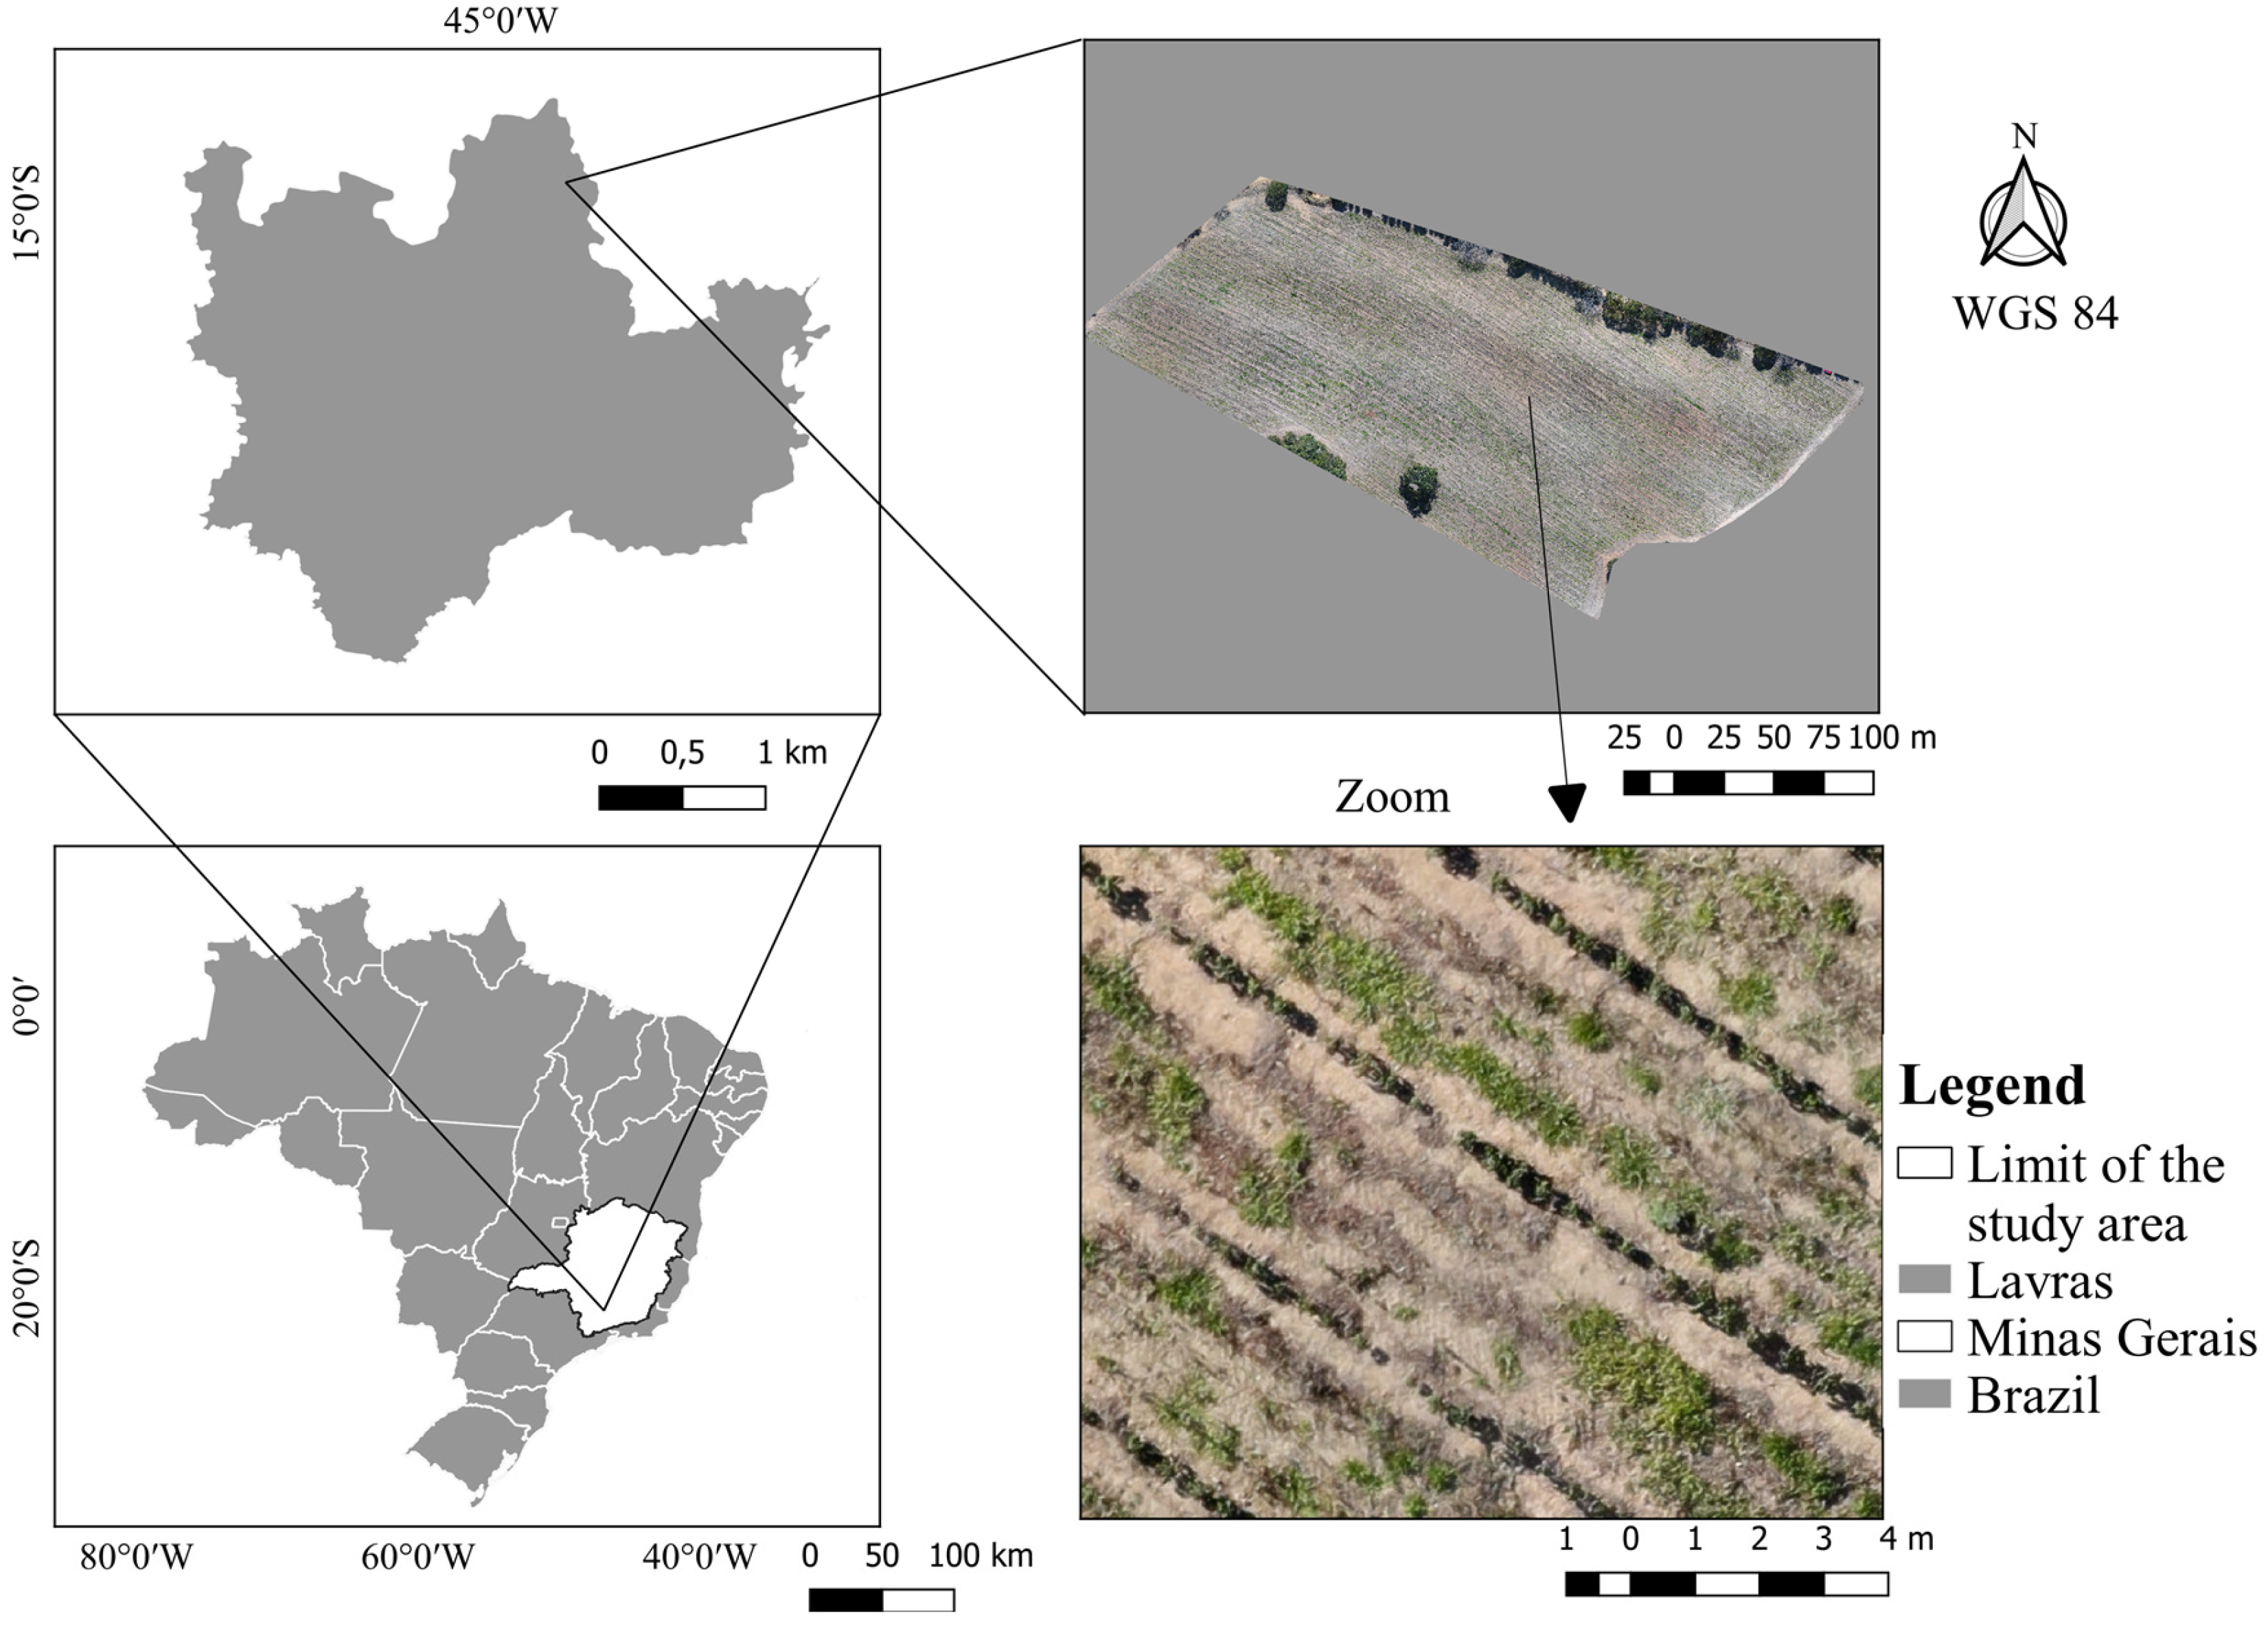
2.1. Study Area
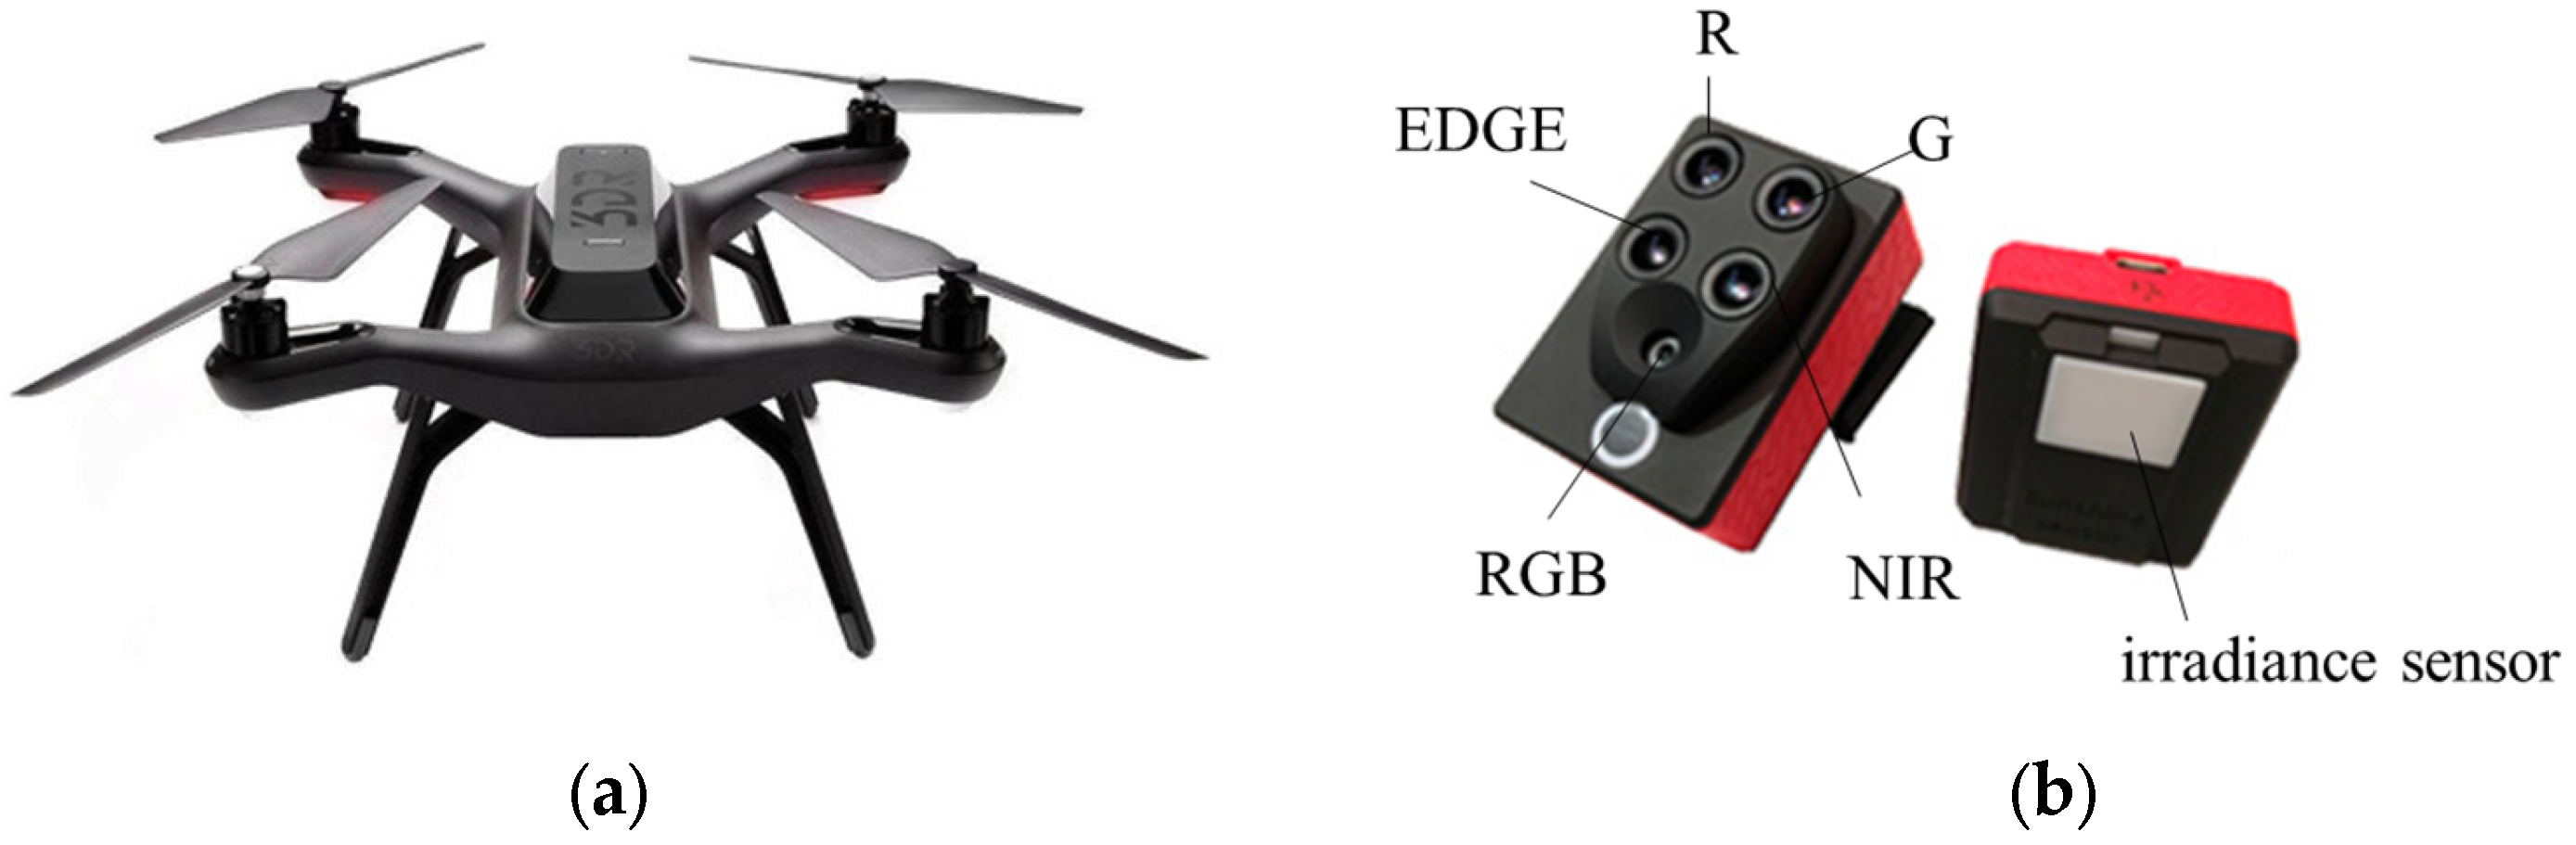
2.2. Aerial Data Collection
2.3. Image Processing
2.4. Classification Method
3. Results
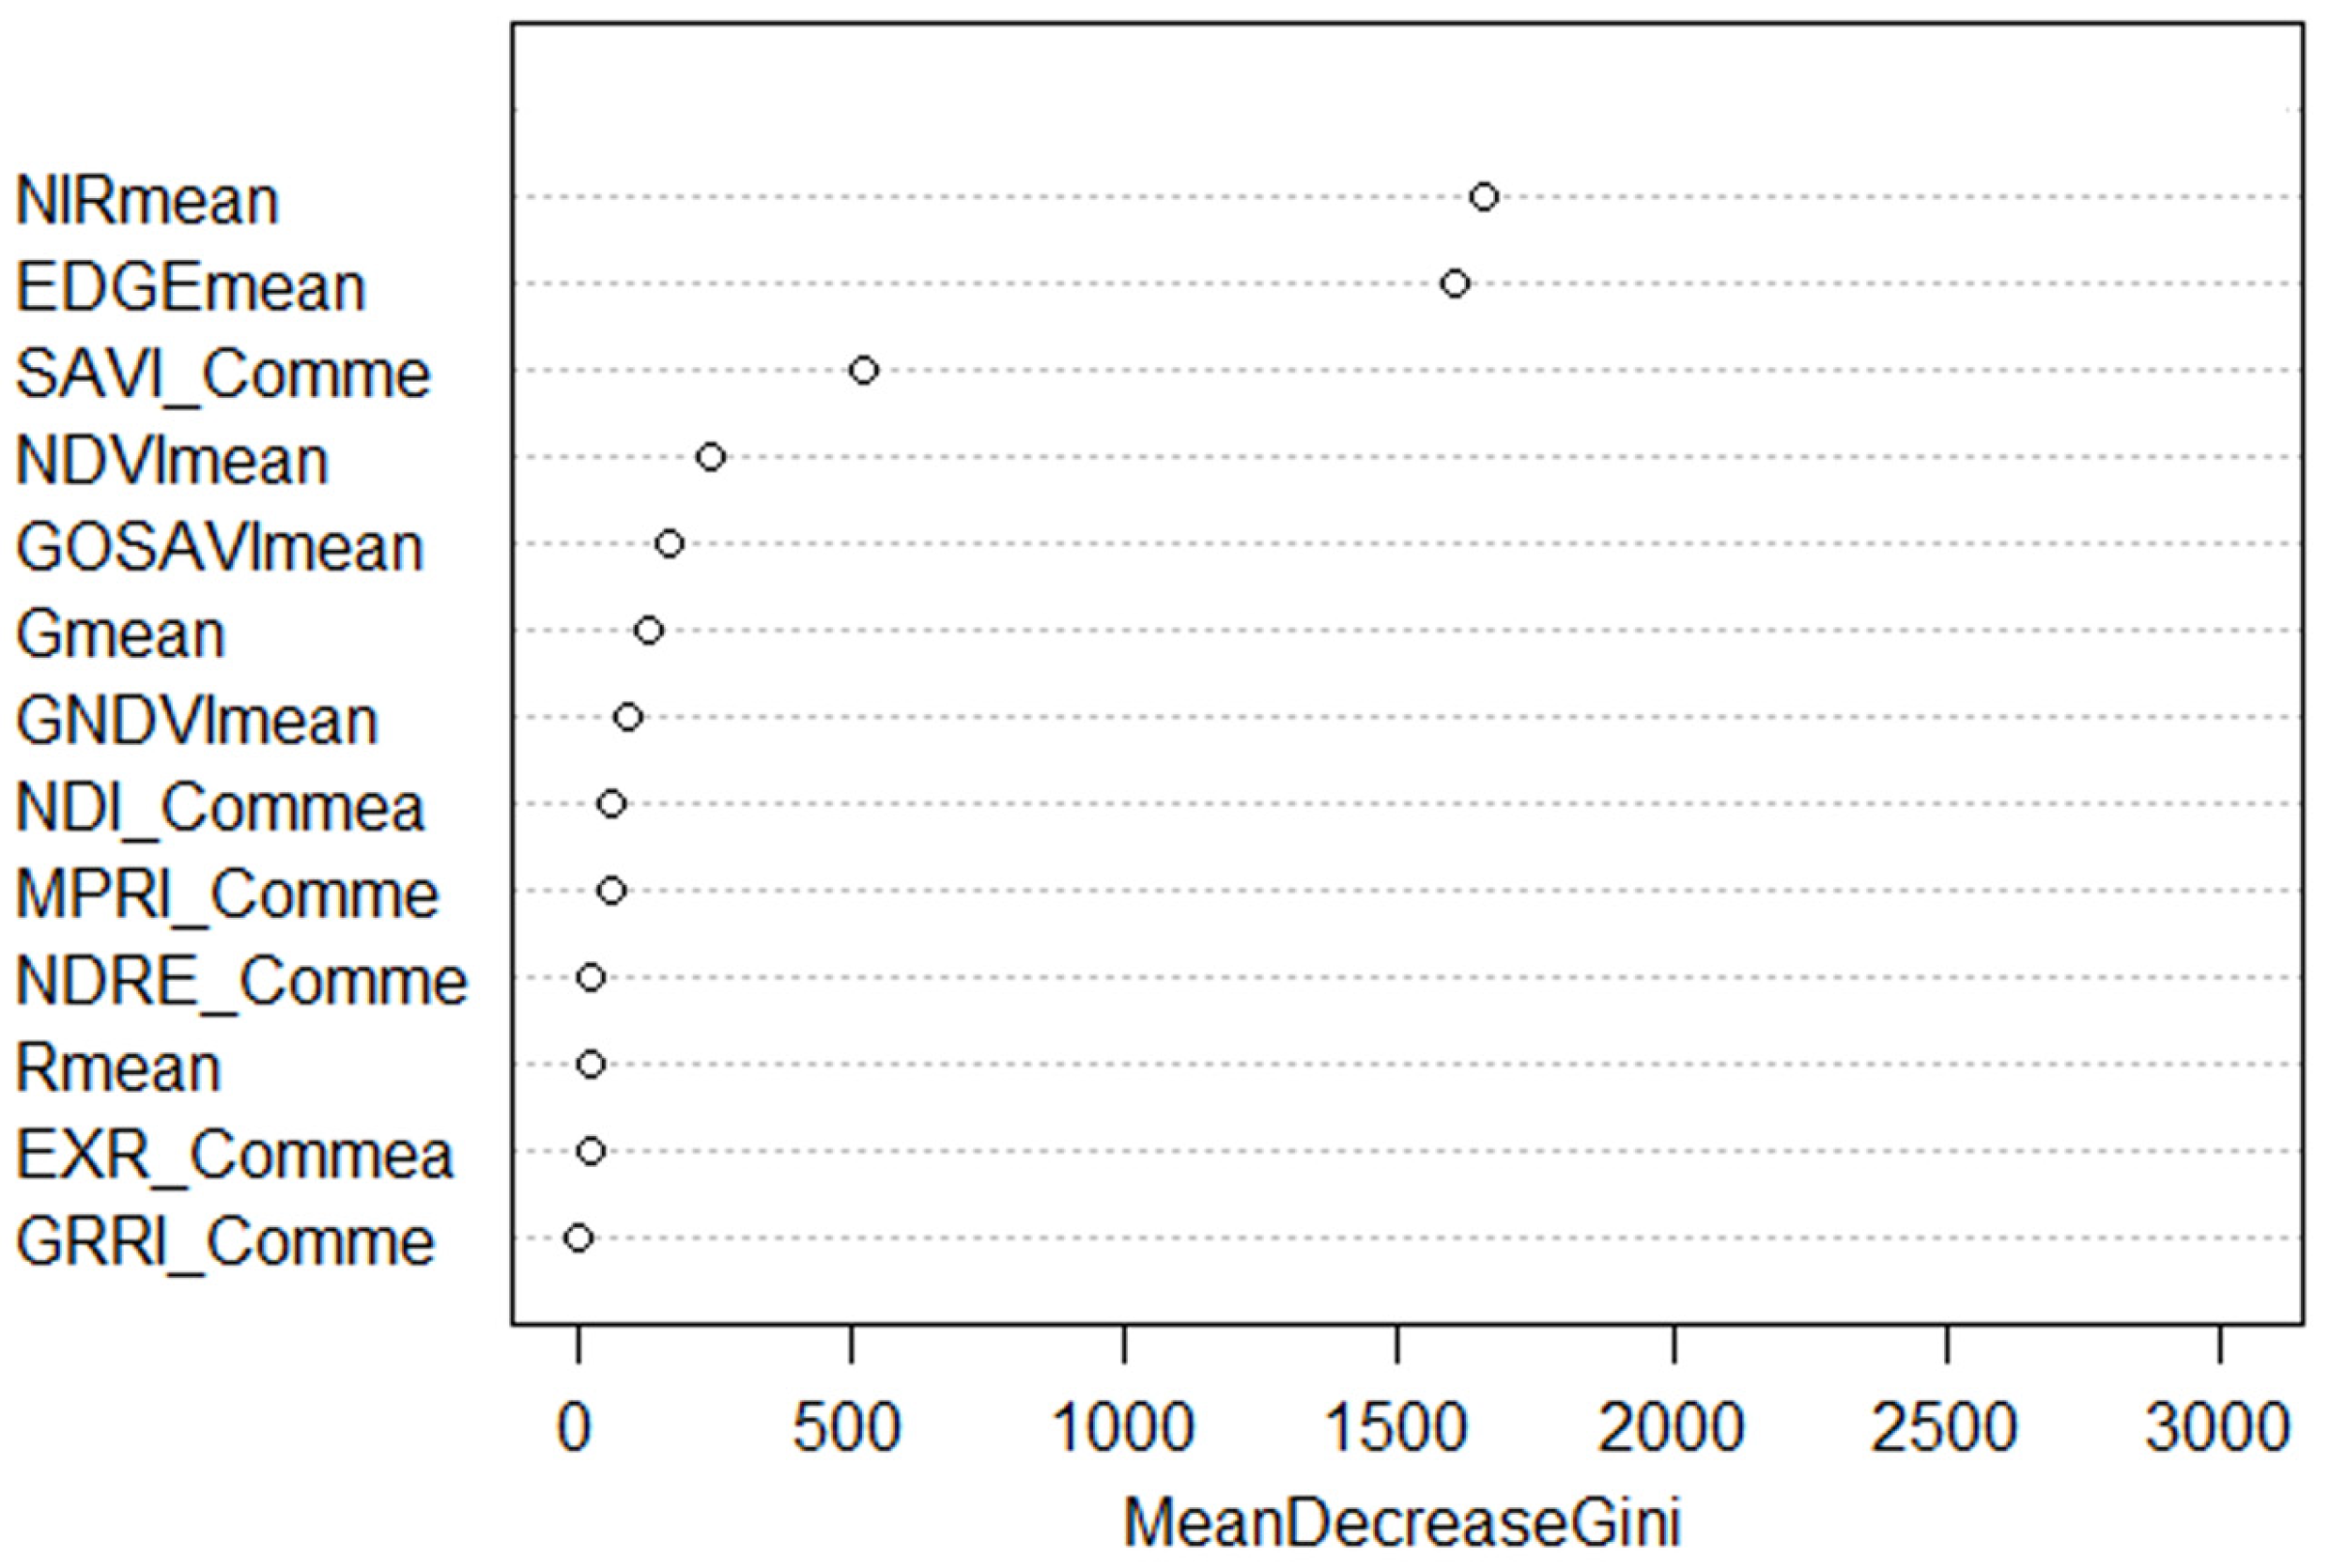
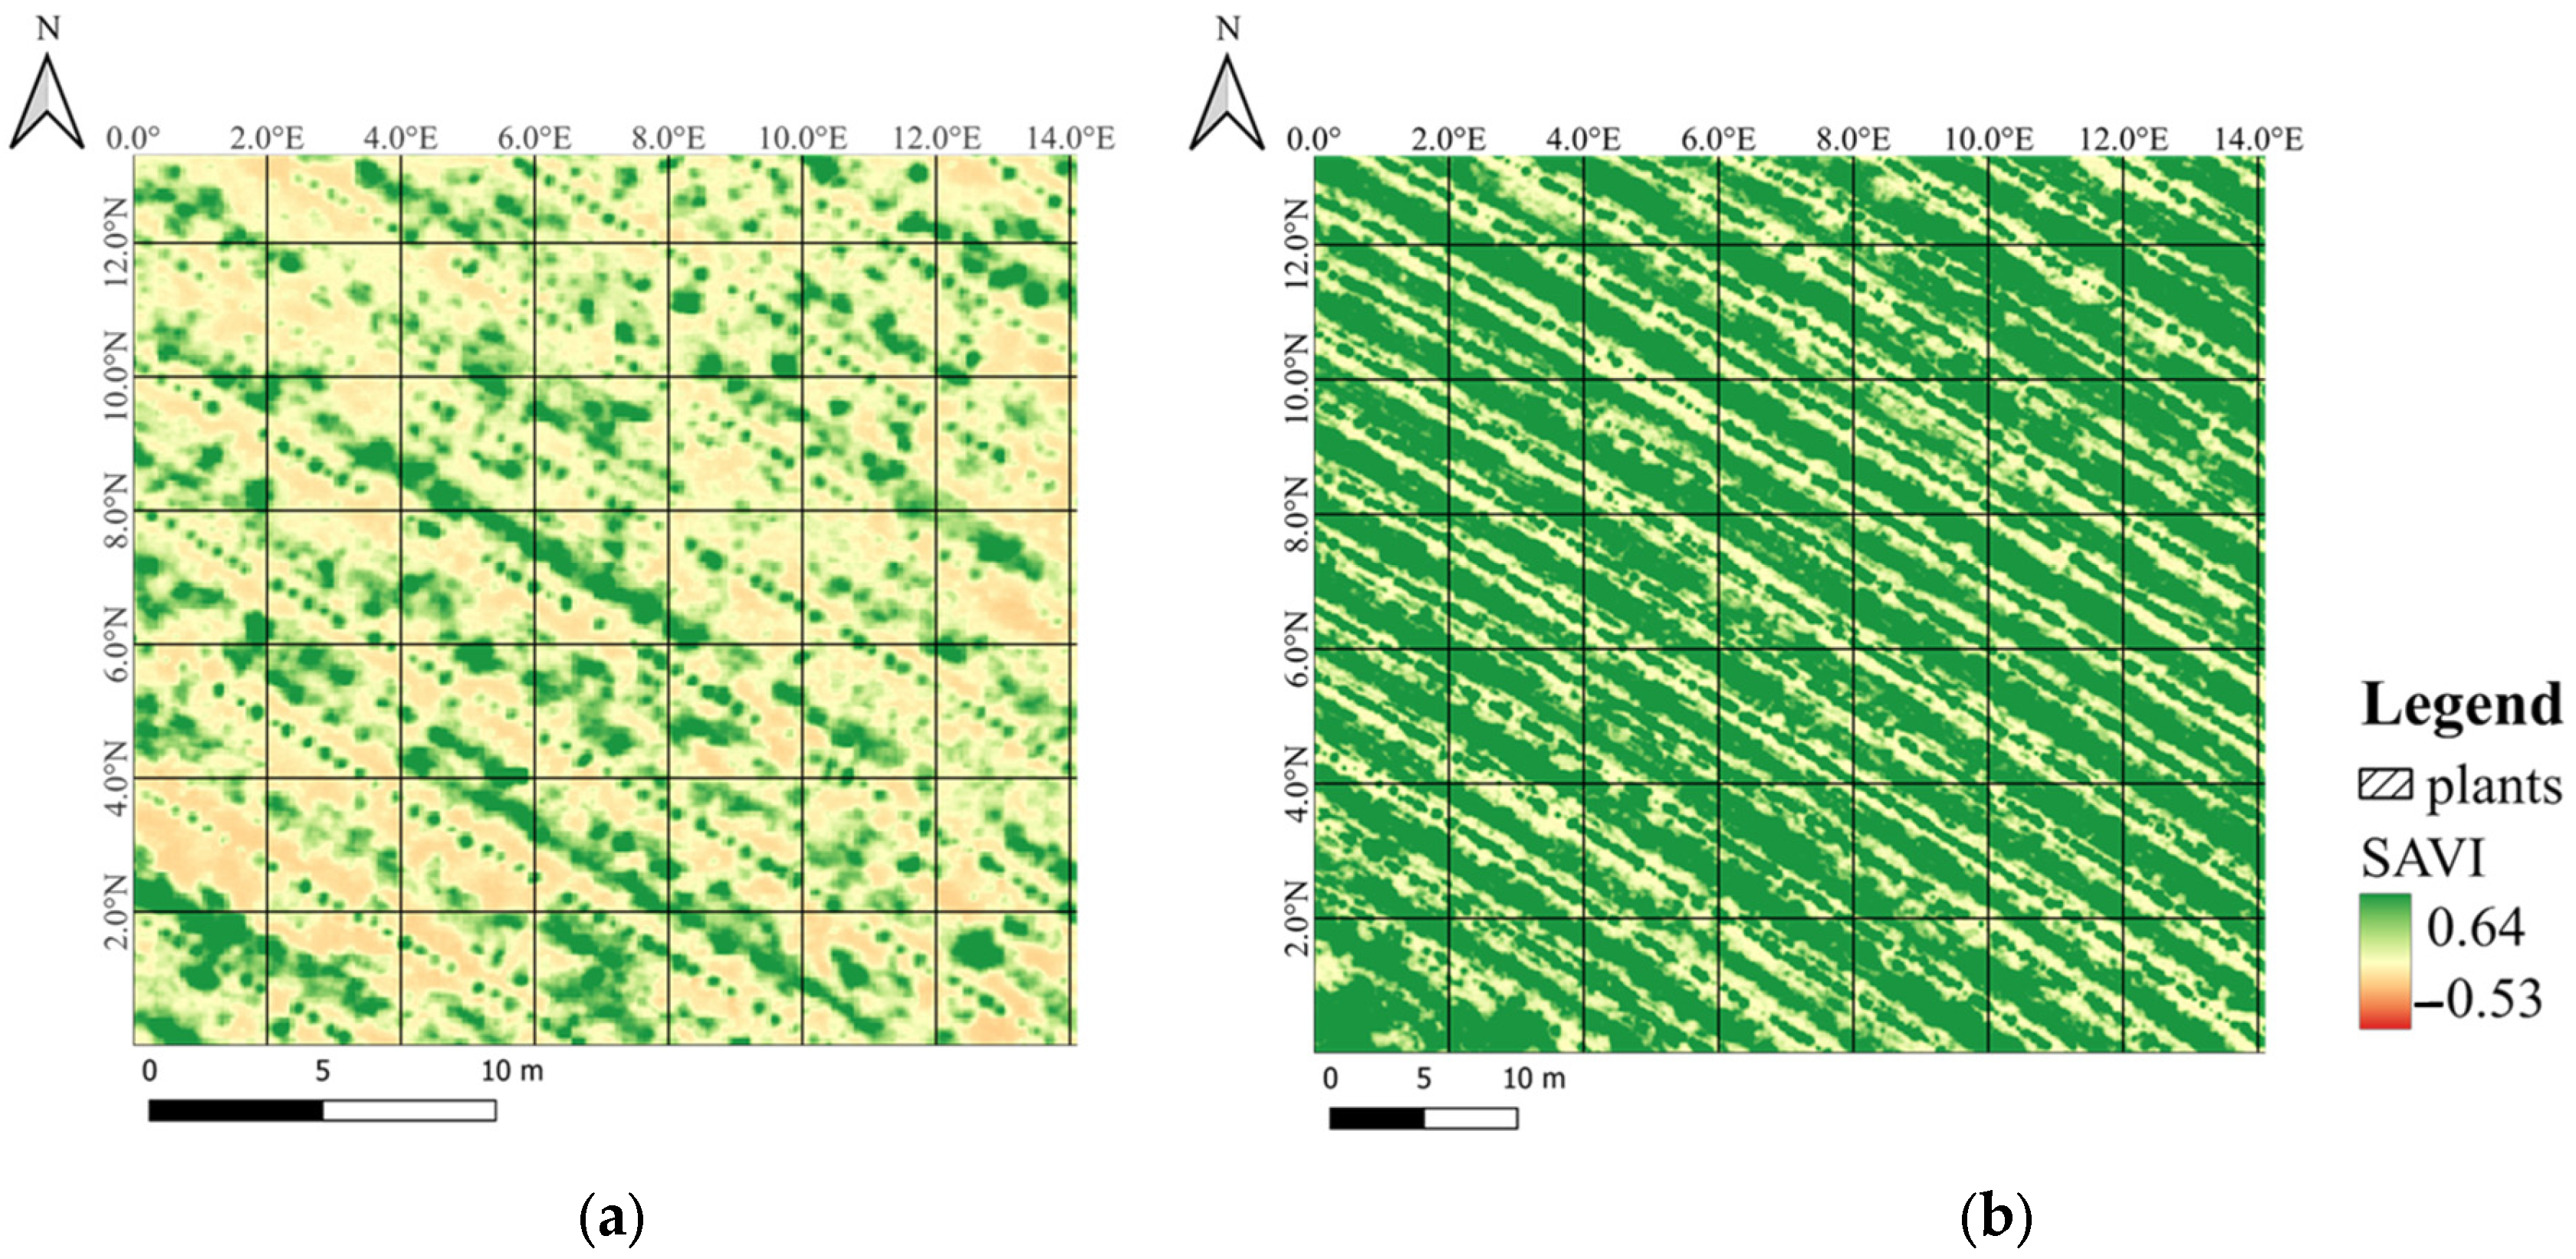
3.1. Exploratory Data Analysis
3.2. Overall Classifier Accuracy
4. Discussion
5. Conclusions
Author Contributions
Funding
Data Availability Statement
Acknowledgments
Conflicts of Interest
References
- United States Department of Agriculture (USDA). Available online: http://usda.mannlib.cornell.edu/MannUsda/viewDocumentInfo.do?documentID=1801 (accessed on 20 June 2023).
- Companhia Nacional de Abastecimento (CONAB). Available online: https://www.conab.gov.br/info-agro/safras/cafe/boletim-da-safra-de-cafe (accessed on 20 June 2023).
- Mesquita, C.M.; Melo, E.M.; Rezende, J.E.; Carvalho, J.S.; Fabri, M.A., Jr.; Moraes, N.C.; Araujo, W.G. Manual do Café: Implantação de Cafezais Coffea arábica L.; EMATER-MG: Belo Horizonte, Brazil, 2016; p. 50. [Google Scholar]
- Dantas, J.; Motta, I.O.; Vidal, L.A.; Nascimento, E.F.M.B.; Bílio, J.; Pupé, J.M.; Veiga, A.; Carvalho, C.; Lopes, R.B.; Rocha, T.L. A comprehensive review of the coffee leaf miner Leucoptera coffeella (Lepidoptera: Lyonetiidae)—A major pest for the coffee crop in Brazil and others Neotropical countries. Insects 2021, 12, 1130. [Google Scholar] [CrossRef]
- Matiello, J.B.; Santinato, R.; Almeida, S.R.; Garcia, A.W.R. Cultura de Café No Brasil: Manual de Recomendações, 2nd ed.; Futurama Editora: São Paulo, Brasil, 2020; p. 585. [Google Scholar]
- Franklin, A.M.; Martins, F.K.; Costa, E.S.; Nunes, J.F. Community of parasitoids associated with the ‘bicho-mineiro’ (Leucoptera coffeella Guérin-Mèneville) in coffee leaves (Coffea arabica L.) grown in the Southwest of Minas Gerais. Ciência et PRAXIS 2017, 10, 25–30. [Google Scholar]
- Rosado, M.C.; de Araújo, G.J.; Pallini, A.; Venzon, M. A consorciação de culturas de cobertura aumenta o controle biológico em lavouras de café. Biol. Controle 2021, 160, 104675. [Google Scholar]
- Santos, L.M.D.; Ferraz, G.A.E.S.; Marin, D.B.; Carvalho, M.A.D.F.; Dias, J.E.L.; Alecrim, A.D.O.; Silva, M.D.L.O.E. Vegetation Indices Applied to Suborbital Multispectral Images of Healthy Coffee and Coffee Infested with Coffee Leaf Miner. AgriEngineering 2022, 4, 311–319. [Google Scholar] [CrossRef]
- Bento, N.L.; Ferraz, G.A.E.S.; Amorim, J.D.S.; Santana, L.S.; Barata, R.A.P.; Soares, D.V.; Ferraz, P.F.P. Weed Detection and Mapping of a Coffee Farm by a Remotely Piloted Aircraft System. Agronomy 2023, 13, 830. [Google Scholar] [CrossRef]
- Santana, L.S.; Ferraz, G.A.E.S.; Santos, G.H.R.D.; Bento, N.L.; Faria, R.D.O. Identification and Counting of Coffee Trees Based on Convolutional Neural Network Applied to RGB Images Obtained by RPA. Sustainability 2023, 15, 820. [Google Scholar] [CrossRef]
- Santos, L.M.D.; Ferraz, G.A.E.S.; Carvalho, M.A.D.F.; Teodoro, S.A.; Campos, A.A.V.; Menicucci Neto, P. Use of RPA Images in the Mapping of the Chlorophyll Index of Coffee Plants. Sustainability 2022, 14, 13118. [Google Scholar] [CrossRef]
- Martins, G.D.; Galo, M.D.L.B.T.; Vieira, B.S. Detecting and mapping root-knot nematode infection in coffee crop using remote sensing measurements. IEEE J. Sel. Top. Appl. Earth Obs. Remote Sens. 2017, 10, 5395–5403. [Google Scholar] [CrossRef]
- Marin, D.B.; Ferraz, G.A.E.S.; Schwerz, F.; Barata, R.A.P.; Faria, R.O.; Dias, J.E.L. Unmanned aerial vehicle to evaluate frost damage in coffee plants. Precis. Agric. 2021, 22, 1845–1860. [Google Scholar] [CrossRef]
- Marin, D.B.; Santana, L.S.; Barbosa, B.D.S.; Barata, R.A.P.; Osco, L.P.; Ramos, A.P.M.; Guimarães, P.H.S. Detecting coffee leaf rust with UAV-based vegetation indices and decision tree machine learning models. Comput. Electron. Agric. 2021, 190, 106476. [Google Scholar] [CrossRef]
- Souza, T.P.; Castellani, M.A.; Lemos, R.N.S.D.; Maluf, R.P.; Moreira, A.A.; Silva, B.S.; Ribeiro, E.B. Seasonal occurrence, predation and parasitism of leucoptera coffeella (Guérin-Méneville, 1842) (Lepidoptera: Lyonetiidae) in coffee plants associated with grevillea trees. Coffee Sci. 2014, 9, 34–50. [Google Scholar]
- Berzoti, E.; Aquino, L.H. Sequential sampling plan to evaluate the infestation of the coffee leaf miner (Lepidoptera: Lyonetiidae) in southern Minas Gerais state, Brazil. Pesqui. Agropecuária Bras. 1994, 29, 695–705. [Google Scholar]
- Vilela, E.F.; Ferreira, W.P.M.; Castro, G.D.M.D.; Faria, A.L.R.D.; Leite, D.H.; Lima, I.A.; Venzon, M. New Spectral Index and Machine Learning Models for Detecting Coffee Leaf Miner Infestation Using Sentinel-2 Multispectral Imagery. Agriculture 2023, 13, 388. [Google Scholar] [CrossRef]
- Marin, D.B.; Alves, M.D.C.; Pozza, E.A.; Gandia, R.M.; Cortez, M.L.J.; Mattioli, M.C. Multispectral remote sensing in the identification and mapping of biotic and abiotic coffee tree variables. Rev. Ceres 2019, 66, 142–153. [Google Scholar] [CrossRef]
- Srivastava, A.; Jain, S.; Maity, R.; Desai, V.R. Demystifying artificial intelligence amidst sustainable agricultural water management. Curr. Dir. Water Scarcity Res. 2022, 7, 17–35. [Google Scholar]
- Wang, Z.; Ren, Z.; Li, X. Identification of Coffee Leaf Pests and Diseases based on Transfer Learning and Knowledge Distillation. Front. Comput. Intell. Syst. 2023, 5, 15–18. [Google Scholar] [CrossRef]
- Alvares, C.A.; Stape, J.L.; Sentelhas, P.C.; Gonçalves, J.L.M.; Sparovek, G. Köppen’s climate classification map for Brazil. Meteorologische 2013, 22, 711–728. [Google Scholar] [CrossRef] [PubMed]
- Santos, S.A.D.; Ferraz, G.A.E.S.; Figueiredo, V.C.; Volpato, M.M.L.; Machado, M.L.; Silva, V.A. Evaluation of the Water Conditions in Coffee Plantations Using RPA. Agriengineering 2023, 5, 65–84. [Google Scholar] [CrossRef]
- Meyer, G.E.; Hindman, T.W.; Laksmi, K. Machine Vision Detection Parameters for Plant Species Identification. In Precision Agriculture and Biological Quality; SPIE: Boston, MA, USA, 1999; Volume 3543, pp. 327–335. [Google Scholar]
- Gitelson, A.A.; Merzlyak, M.N. Signature analysis of leaf reflectance spectra: Algorithm development for remote sensing of chlorophyll. J. Plant Physiol. 1996, 148, 494–500. [Google Scholar] [CrossRef]
- Rondeaux, G.; Steven, M.; Baret, F. Optimization of soiladjusted vegetation indices. Remote Sens. Environ. 1996, 55, 95–107. [Google Scholar] [CrossRef]
- Gamon, J.A.; Surfus, J.S. Assessing leaf pigment content and activity with a reflectometer. New Phytol. 2013, 143, 105–117. [Google Scholar] [CrossRef]
- Yang, Z.; Willis, P.; Mueller, R. Impact of band-ratio enhanced AWIFS image to crop classifcation accuracy. In Proceedings of the 17th William Pecora Memorial Remote Sensing Symposium, Denver, CO, USA, 18–20 November 2008; American Society for Photogrammetry & Remote Sensing: Bethesda, MD, USA, 2008; pp. 1–11. [Google Scholar]
- Mao, W.; Wang, Y.; Wang, Y. Real-time detection of between-row weeds using machine vision. In Proceedings of the 2003 ASAE Annual Meeting; American Society of Agricultural and Biological Engineers, Las Vegas, NV, USA, 27–30 July 2003. [Google Scholar]
- Gitelson, A.; Merzlyak, M.N. Quantitative estimation of chlorophyll-a using refectance spectra: Experiments with autumn chestnut and maple leaves. J. Photochem. Photobiol. B Biol. 2004, 22, 247–252. [Google Scholar] [CrossRef]
- Rouse, J.W.; Haas, R.H.; Schell, J.A.; Deering, D.W. Monitoring vegetation systems in the great plains with ERTS. In Proceedings of the Earth Resources Technology Satellite (ERTS) Symposium, NASA SP-351, Washington, DC, USA, 10–14 December 1974; pp. 309–317. [Google Scholar]
- Huete, A.R. A soil-adjusted vegetation index (SAVI). Remote Sens. Environ. 1988, 25, 95–309. [Google Scholar] [CrossRef]
- Breiman, L. Manual Sobre Configuração, Uso e Compreensão de Florestas Aleatórias V3.1; Universidade de Berkeley: Berkeley, CA, USA, 2001; p. 33. [Google Scholar]
- Gislason, P.O.; Benediktsson, J.A.; Sveinsson, J.R. Random Forest classification of multisource remote sensing and geographic data. In Proceedings of the IGARSS 2004. 2004 IEEE International Geoscience and Remote Sensing Symposium, Anchorage, AK, USA, 20–24 September 2004; IEEE: Piscataway, NJ, USA, 2004; Volume 2, pp. 1049–1052. [Google Scholar]
- Chinchor, N.; Sundheim, B.M. MUC-5 evaluation metrics. In Proceedings of the Fifth Message Understanding Conference (MUC-5), Baltimore, MD, USA, 25–27 August 1993. [Google Scholar]
- Pérez-Ortiz, M.; Peña, J.M.; Gutiérrez, P.A.; Torres-Sánchez, J.; Hervás-Martínez, C.; López-Granados, F. A semi-supervised system for weed mapping in sunflower crops using unmanned aerial vehicles and a crop row detection method. Appl. Soft Comput. J. 2015, 37, 533–544. [Google Scholar] [CrossRef]
- Whyte, A.; Ferentinos, K.P.; Petropoulos, G.P. A new synergistic approach for monitoring wetlands using Sentinels-1 and 2 data with object-based machine learning algorithms. Environ. Model. Softw. 2018, 104, 40–54. [Google Scholar] [CrossRef]
- Breiman, L. Random Forests. Mach. Learn. 2001, 45, 5–32. [Google Scholar] [CrossRef]
- Mahdianpari, M.; Salehi, B.; Mohammadimanesh, F.; Motagh, M. Classificação aleatória de zonas úmidas florestais usando banda L ALOS-2, banda C RADARSAT-2 e imagens TerraSAR-X. ISPRS J. Fotograma. Sens. Remoto 2017, 130, 13–31. [Google Scholar] [CrossRef]
- De Almeida Furtado, L.F.; Silva, T.S.F.; de Moraes Novo, E.M.L. Avaliação SAR de banda C de dupla estação e polarimétrica total para mapeamento de vegetação nas áreas úmidas de várzea amazônica. Sensoriamento Remoto Meio Ambiente 2016, 174, 212–222. [Google Scholar]
- Almeida, K.E.C.; Souza, T.T.C.; Costa, A.L.; Marcelo, A.S.D.S.; Laia, L. Near-infrared spectroscopy for the evaluation and prediction of injuries associated with the attack of Thaumastocoris peregrinus (Carpintero & Dellapé) in Eucalyptus camaldulensis (Dehnh). Sci. For. 2018, 46, 9–16. [Google Scholar]
- Guijarro, M.; Pajares, G.; Riomoros, I.; Herrera, P.J.; Burgos-Artizzu, X.P.; Ribeiro, A. Automatic segmentation of relevant textures in agricultural images. Comput. Electron. Agric. 2011, 75, 75–83. [Google Scholar] [CrossRef]
- Gameiro, S.; Teixeira, C.P.B.; Silva Neto, T.A.; Lopes, M.F.L.; Duarte, C.R.; Souto, M.V.S.; Zimback, C.R.L. Evaluation of vegetation by means of vegetation index (NDVI, SAVI, and IAF) in the lower jaguaribe hydrographic sub-basin, CE. Terrae 2016, 13, 15–22. [Google Scholar]
- Andreazi, E.; Sera, G.H.; Faria, R.T.D.; Sera, T.; Shigueoka, L.H.; Carvalho, F.G.; Chamlet, D. Performance of f1 hybrids of arabica coffee with simultaneous resistance to leaf rust, bacterial blight and leaf miner. Coffee Sci. 2015, 10, 375–382. [Google Scholar]
- Zhang, X.; Zhang, Z.; Zhang, Y.; Zhang, Q.; Liu, X.; Chen, J.; Wu, L. Influences of fractional vegetation cover on the spatial variability of canopy SIF from unmanned aerial vehicle observations. Int. J. Appl. Earth Obs. Geoinf. 2022, 107, 102712. [Google Scholar] [CrossRef]
- Wu, L.; Wang, L.; Shi, C.; Yin, D. Detecting mangrove photosynthesis with solar-induced chlorophyll fluorescence. Int. J. Remote Sens. 2022, 43, 1037–1053. [Google Scholar] [CrossRef]


| Vegetation Indices | Equation | Source |
|---|---|---|
| Excessive red (EXR) | [23] | |
| Green normalized difference vegetation index (GNDVI) | [24] | |
| Green optimal soil adjusted vegetation index (GOSAVI) | [25] | |
| Green–red ratio index (GRRI) | [26] | |
| Modified photochemical reflectance index (MPRI) | [27] | |
| Normalized different index (NDI) | [28] | |
| Normalized difference red edge (NDRE) | [29] | |
| Normalized difference vegetation index (NDVI) | [30] | |
| Soil-adjusted difference vegetation index (SAVI) | [31] |
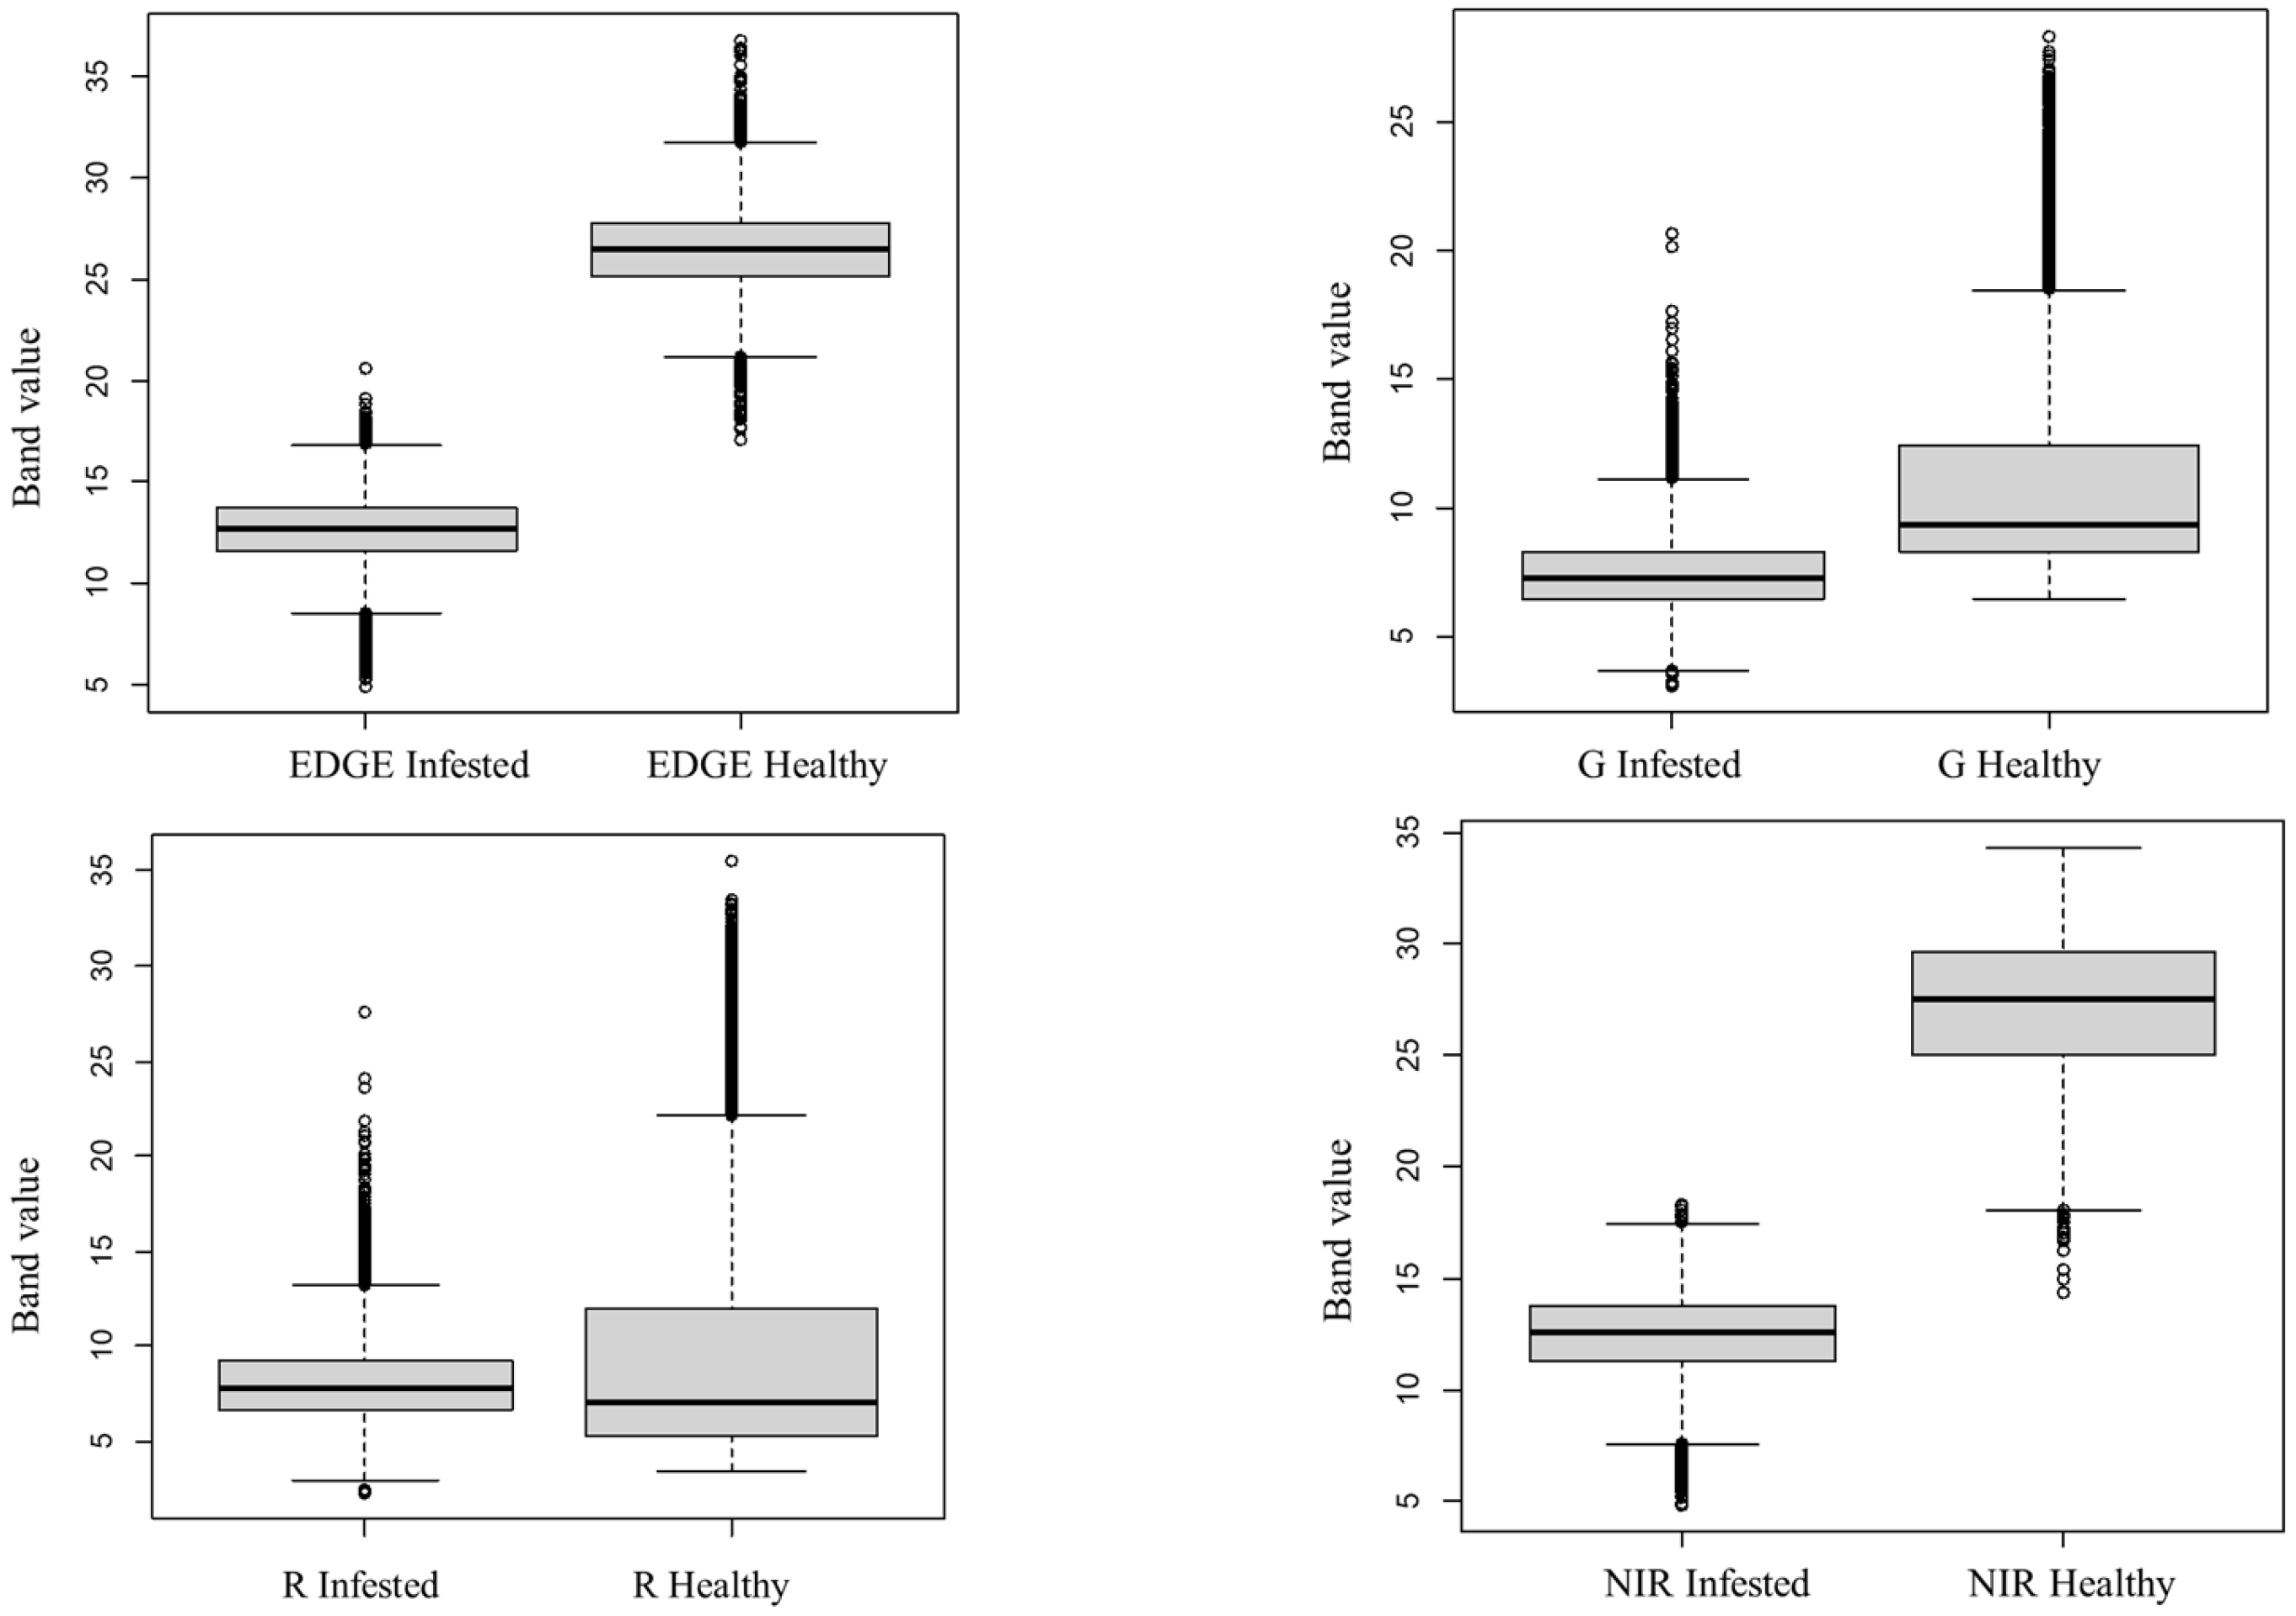
| Band | State of the Plants | Average | SD | Mean | Min | Max |
|---|---|---|---|---|---|---|
| EDGE | Infested | 12.644 | 1.709 | 12.707 | 4.902 | 20.627 |
| Healthy | 26.498 | 2.110 | 26.506 | 17.112 | 36.794 | |
| G | Infested | 7.563 | 1.537 | 7.318 | 3.135 | 20.634 |
| Healthy | 11.083 | 4.005 | 9.376 | 6.480 | 28.293 | |
| NIR | Infested | 12.509 | 1.879 | 12.598 | 4.869 | 18.348 |
| Healthy | 17.209 | 3.080 | 27.507 | 14.377 | 34.277 | |
| R | Infested | 8.149 | 2.225 | 7.778 | 2.315 | 27.524 |
| Healthy | 9.711 | 6.287 | 7.033 | 3.454 | 35.516 |
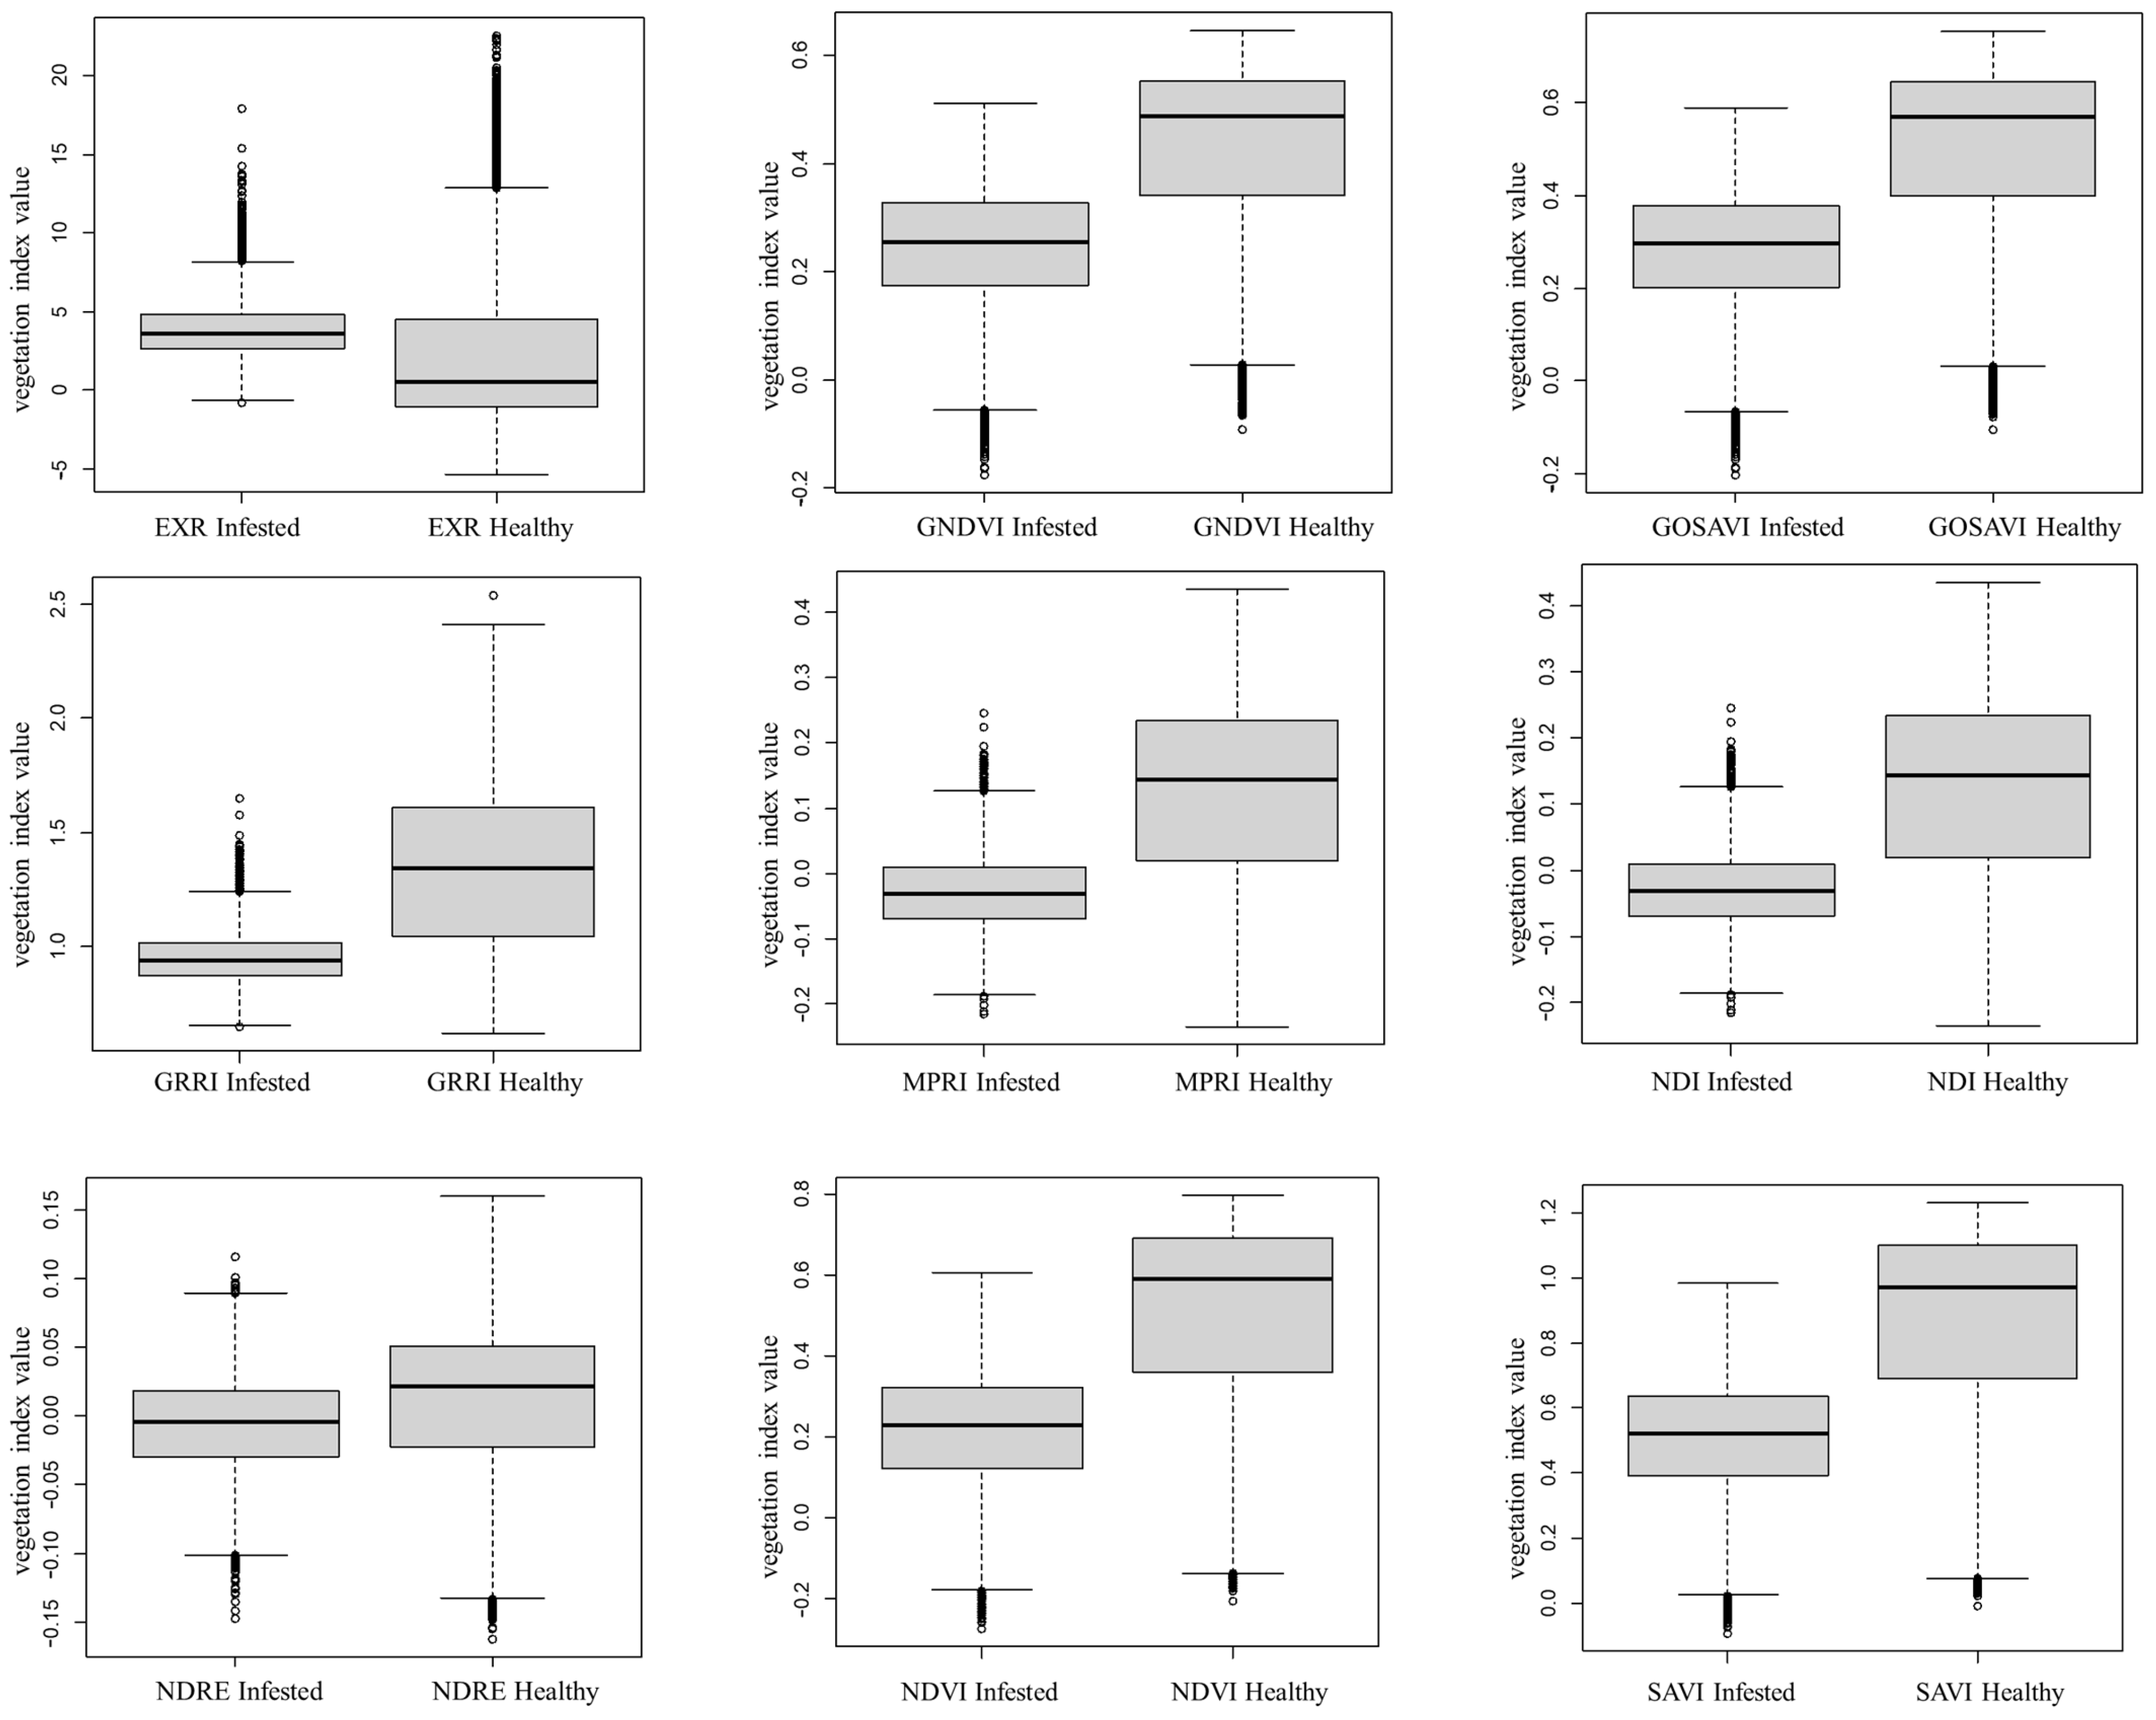
| Band | State of the Plants | Average | SD | Mean | Min | Max |
|---|---|---|---|---|---|---|
| EXR | Infested | 3.845 | 1.797 | 3.591 | −0.771 | 17.899 |
| Healthy | 2.512 | 5.037 | 0.537 | −5.342 | 22.528 | |
| GNDVI | Infested | 0.245 | 0.111 | 0.257 | −0.175 | 0.512 |
| Healthy | 0.429 | 0.162 | 0.488 | −0.090 | 0.647 | |
| GOSAVI | Infested | 0.283 | 0.128 | 0.295 | −0.202 | 0.589 |
| Healthy | 0.499 | 0.188 | 0.569 | −0.105 | 0.753 | |
| GRRI | Infested | 0.951 | 0.111 | 0.939 | 0.646 | 1.650 |
| Healthy | 1.336 | 0.343 | 1.342 | 0.621 | 2.537 | |
| MPRI | Infested | −0.028 | 0.057 | −0.031 | −0.215 | 0.245 |
| Healthy | 0.1223 | 0.1131 | 0.143 | −0.234 | 0.4335 | |
| NDI | Infested | −0.028 | 0.057 | −0.031 | −0.214 | 0.244 |
| Healthy | 0.123 | 0.131 | 0.143 | −0.234 | 0.434 | |
| NDRE | Infested | −0.006 | 0.034 | −0.005 | −0.147 | 0.116 |
| Healthy | 0.011 | 0.054 | 0.022 | −0.162 | 0.160 | |
| NDVI | Infested | 0.217 | 0.145 | 0.228 | −0.275 | 0.608 |
| Healthy | 0.501 | 0.242 | 0.589 | −0.206 | 0.798 | |
| SAVI | Infested | 0.508 | 0.177 | 0.522 | −0.092 | 0.984 |
| Healthy | 0.864 | 0.297 | 0.973 | −0.007 | 1.231 |
| Algorithm | Overall Accuracy | Sensitivity | Specificity | F1 | AUC |
|---|---|---|---|---|---|
| RF | 0.9997 | 0.9997 | 0.997 | 0.9996 | 0.9994 |
| Reference | ||||
|---|---|---|---|---|
| Classes | With | Without | Total | |
| Prediction | With | 3268 | 1 | 3269 |
| Without | 1 | 3268 | 3269 | |
| Total | 3269 | 3269 | 6538 | |
Disclaimer/Publisher’s Note: The statements, opinions and data contained in all publications are solely those of the individual author(s) and contributor(s) and not of MDPI and/or the editor(s). MDPI and/or the editor(s) disclaim responsibility for any injury to people or property resulting from any ideas, methods, instructions or products referred to in the content. |
© 2024 by the authors. Licensee MDPI, Basel, Switzerland. This article is an open access article distributed under the terms and conditions of the Creative Commons Attribution (CC BY) license (https://creativecommons.org/licenses/by/4.0/).
Share and Cite
dos Santos, L.M.; Ferraz, G.A.e.S.; Bento, N.L.; Marin, D.B.; Rossi, G.; Bambi, G.; Conti, L. Use of Images Obtained by Remotely Piloted Aircraft and Random Forest for the Detection of Leaf Miner (Leucoptera coffeella) in Newly Planted Coffee Trees. Remote Sens. 2024, 16, 728. https://doi.org/10.3390/rs16040728
dos Santos LM, Ferraz GAeS, Bento NL, Marin DB, Rossi G, Bambi G, Conti L. Use of Images Obtained by Remotely Piloted Aircraft and Random Forest for the Detection of Leaf Miner (Leucoptera coffeella) in Newly Planted Coffee Trees. Remote Sensing. 2024; 16(4):728. https://doi.org/10.3390/rs16040728
Chicago/Turabian Styledos Santos, Luana Mendes, Gabriel Araújo e Silva Ferraz, Nicole Lopes Bento, Diego Bedin Marin, Giuseppe Rossi, Gianluca Bambi, and Leonardo Conti. 2024. "Use of Images Obtained by Remotely Piloted Aircraft and Random Forest for the Detection of Leaf Miner (Leucoptera coffeella) in Newly Planted Coffee Trees" Remote Sensing 16, no. 4: 728. https://doi.org/10.3390/rs16040728
APA Styledos Santos, L. M., Ferraz, G. A. e. S., Bento, N. L., Marin, D. B., Rossi, G., Bambi, G., & Conti, L. (2024). Use of Images Obtained by Remotely Piloted Aircraft and Random Forest for the Detection of Leaf Miner (Leucoptera coffeella) in Newly Planted Coffee Trees. Remote Sensing, 16(4), 728. https://doi.org/10.3390/rs16040728