
Static High Target-Induced False Alarm Suppression in Circular Synthetic Aperture Radar Moving Target Detection Based on Trajectory Features
 , , ,
, , ,
Abstract
:1. Introduction
2. Materials and Dataset
3. Signal Model of Static High Target’s Rotation Motion
3.1. Defocus Radius of Static High Target
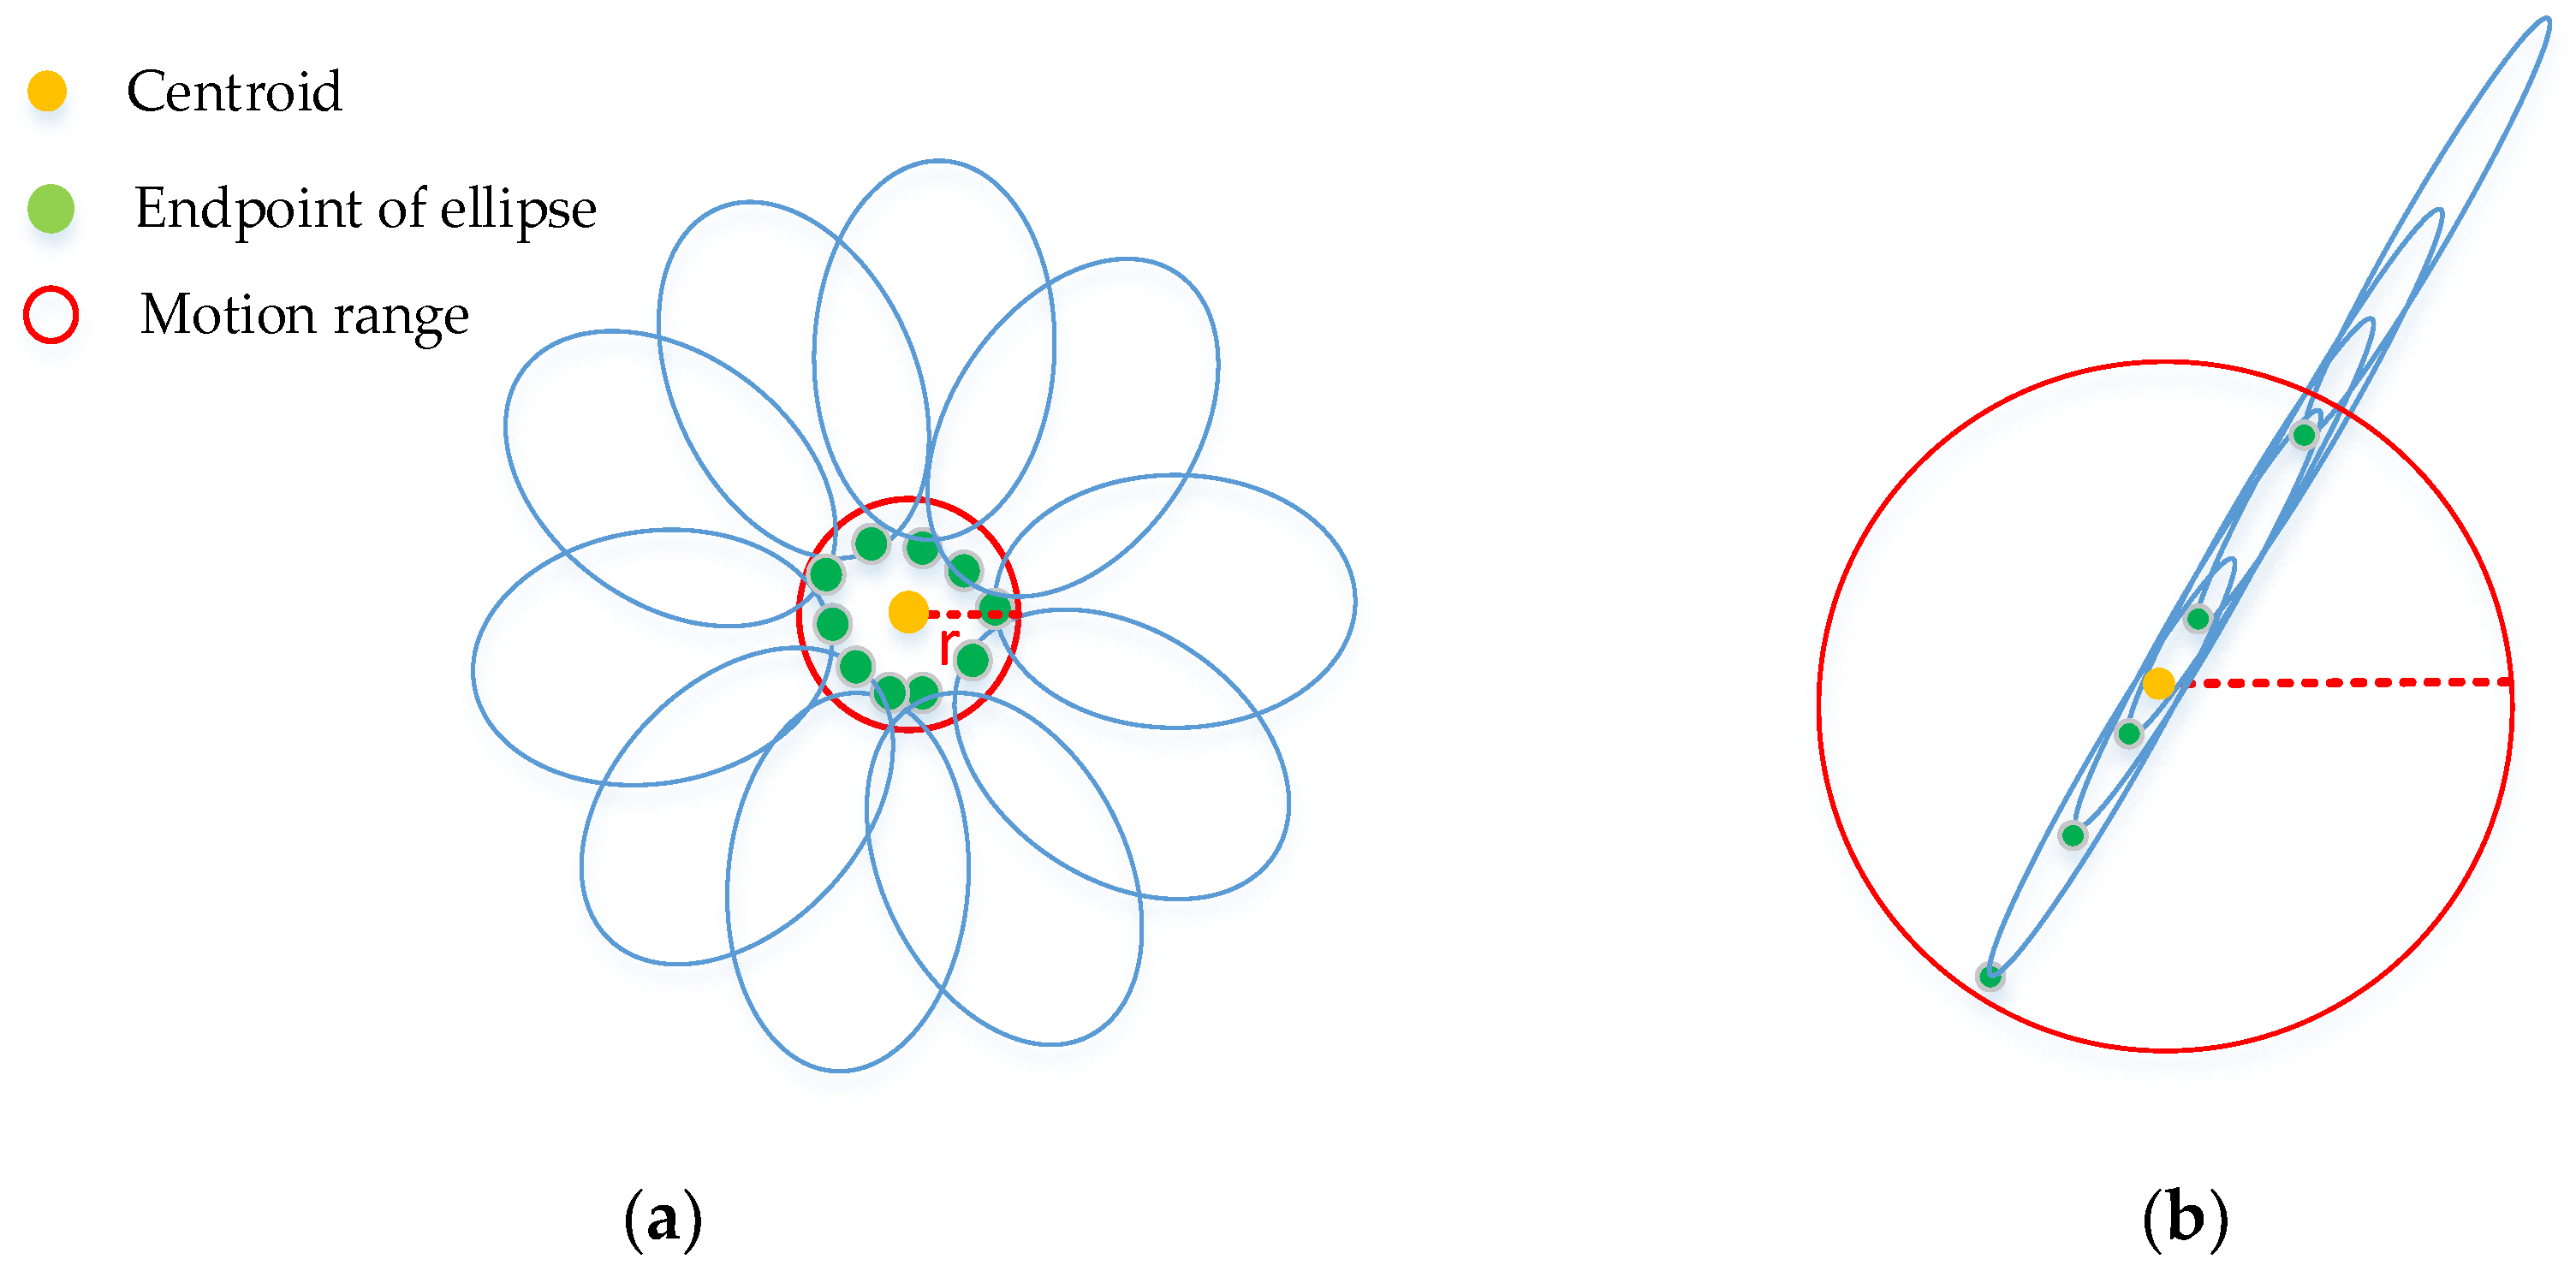
3.2. Trajectory Features of Moving Target and Static High Target
4. False Alarm Suppression Algorithm
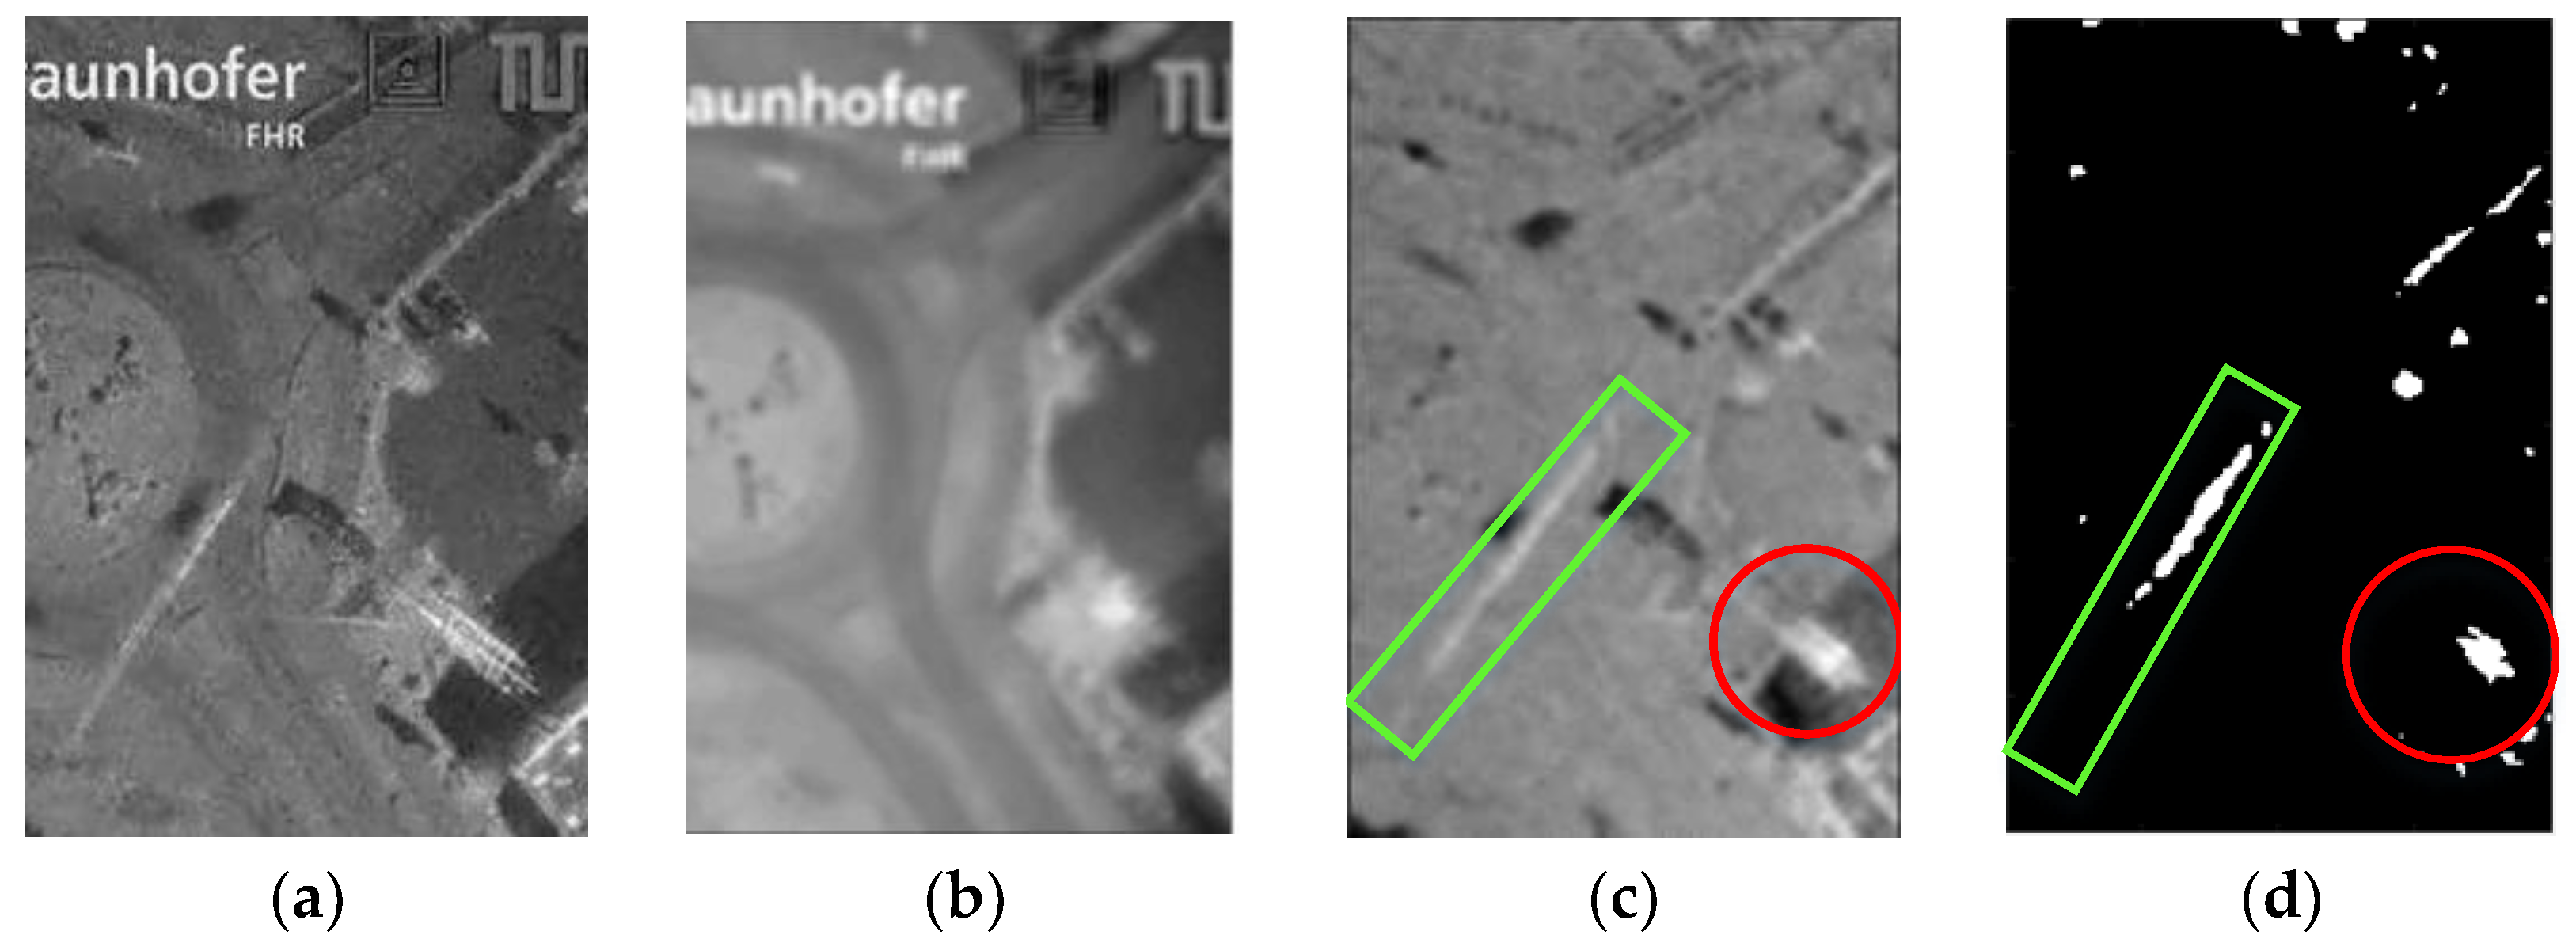
4.1. Logarithm Background Subtraction
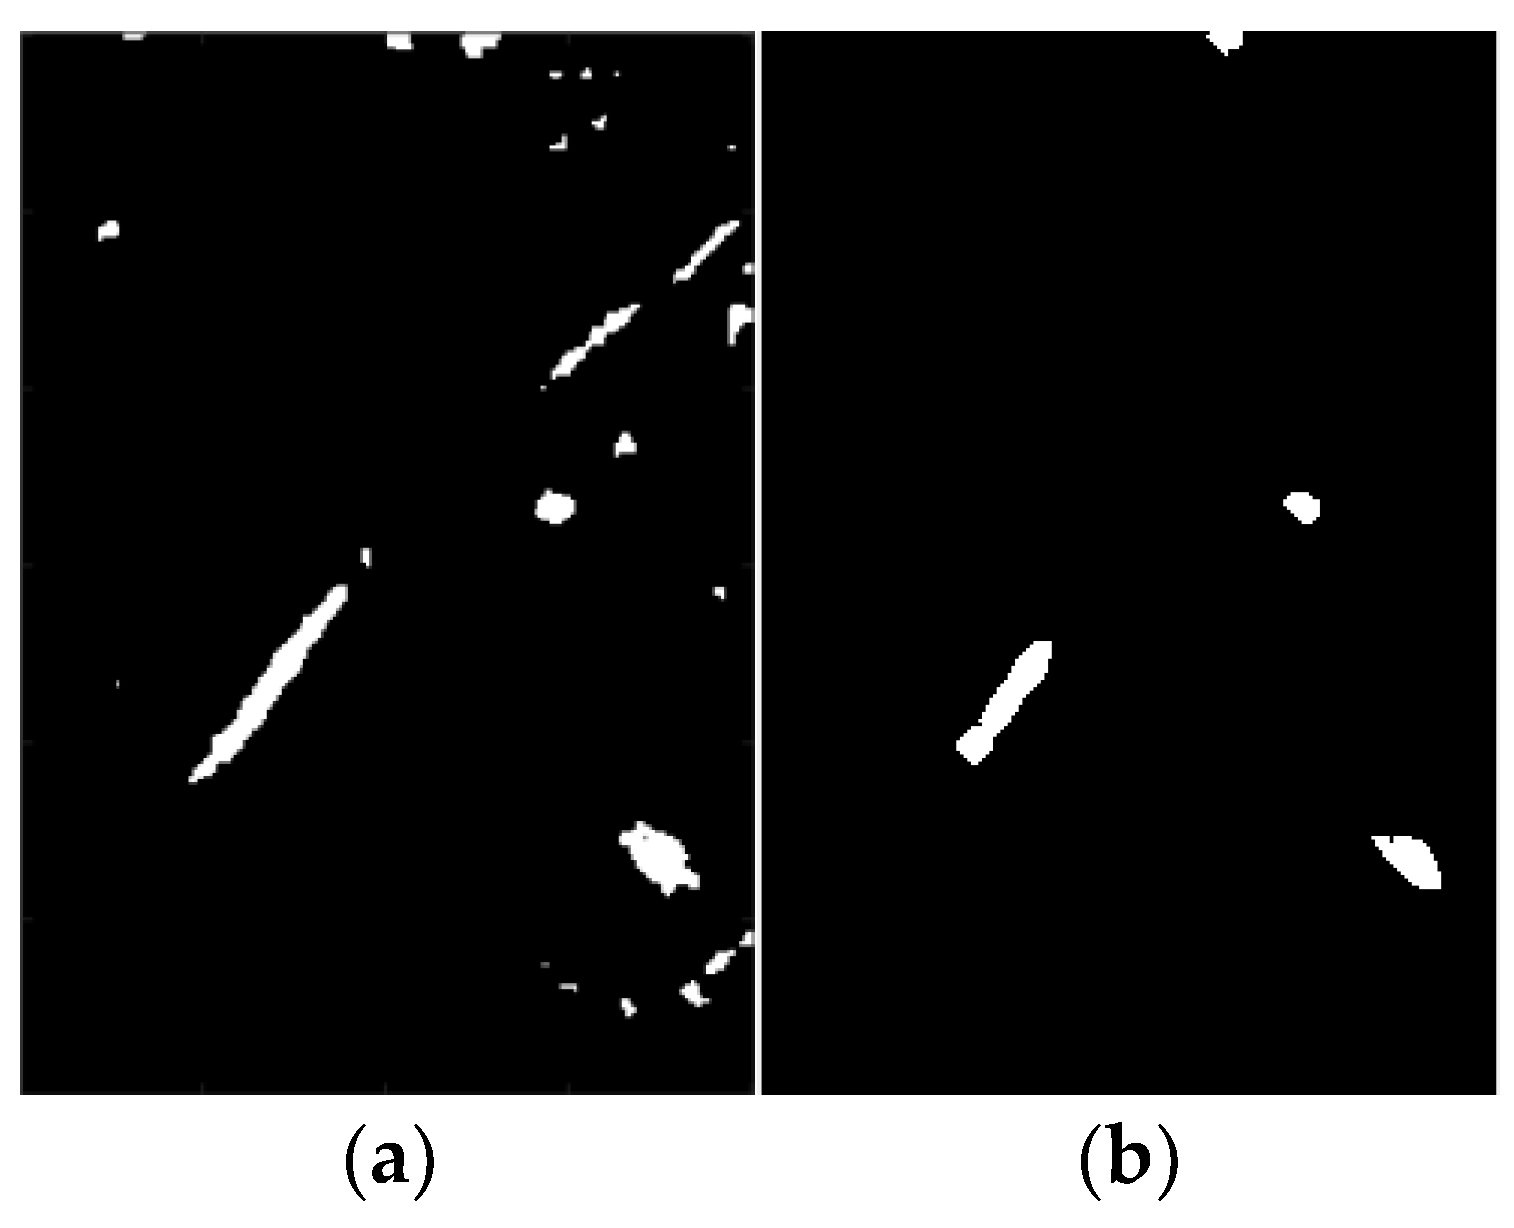
4.2. Morphological Processing
4.3. DBSCAN Clustering
4.4. Target Tracking
4.5. Trajectory Feature Extraction
4.5.1. Basic Features
4.5.2. Trajectory Features
- (1)
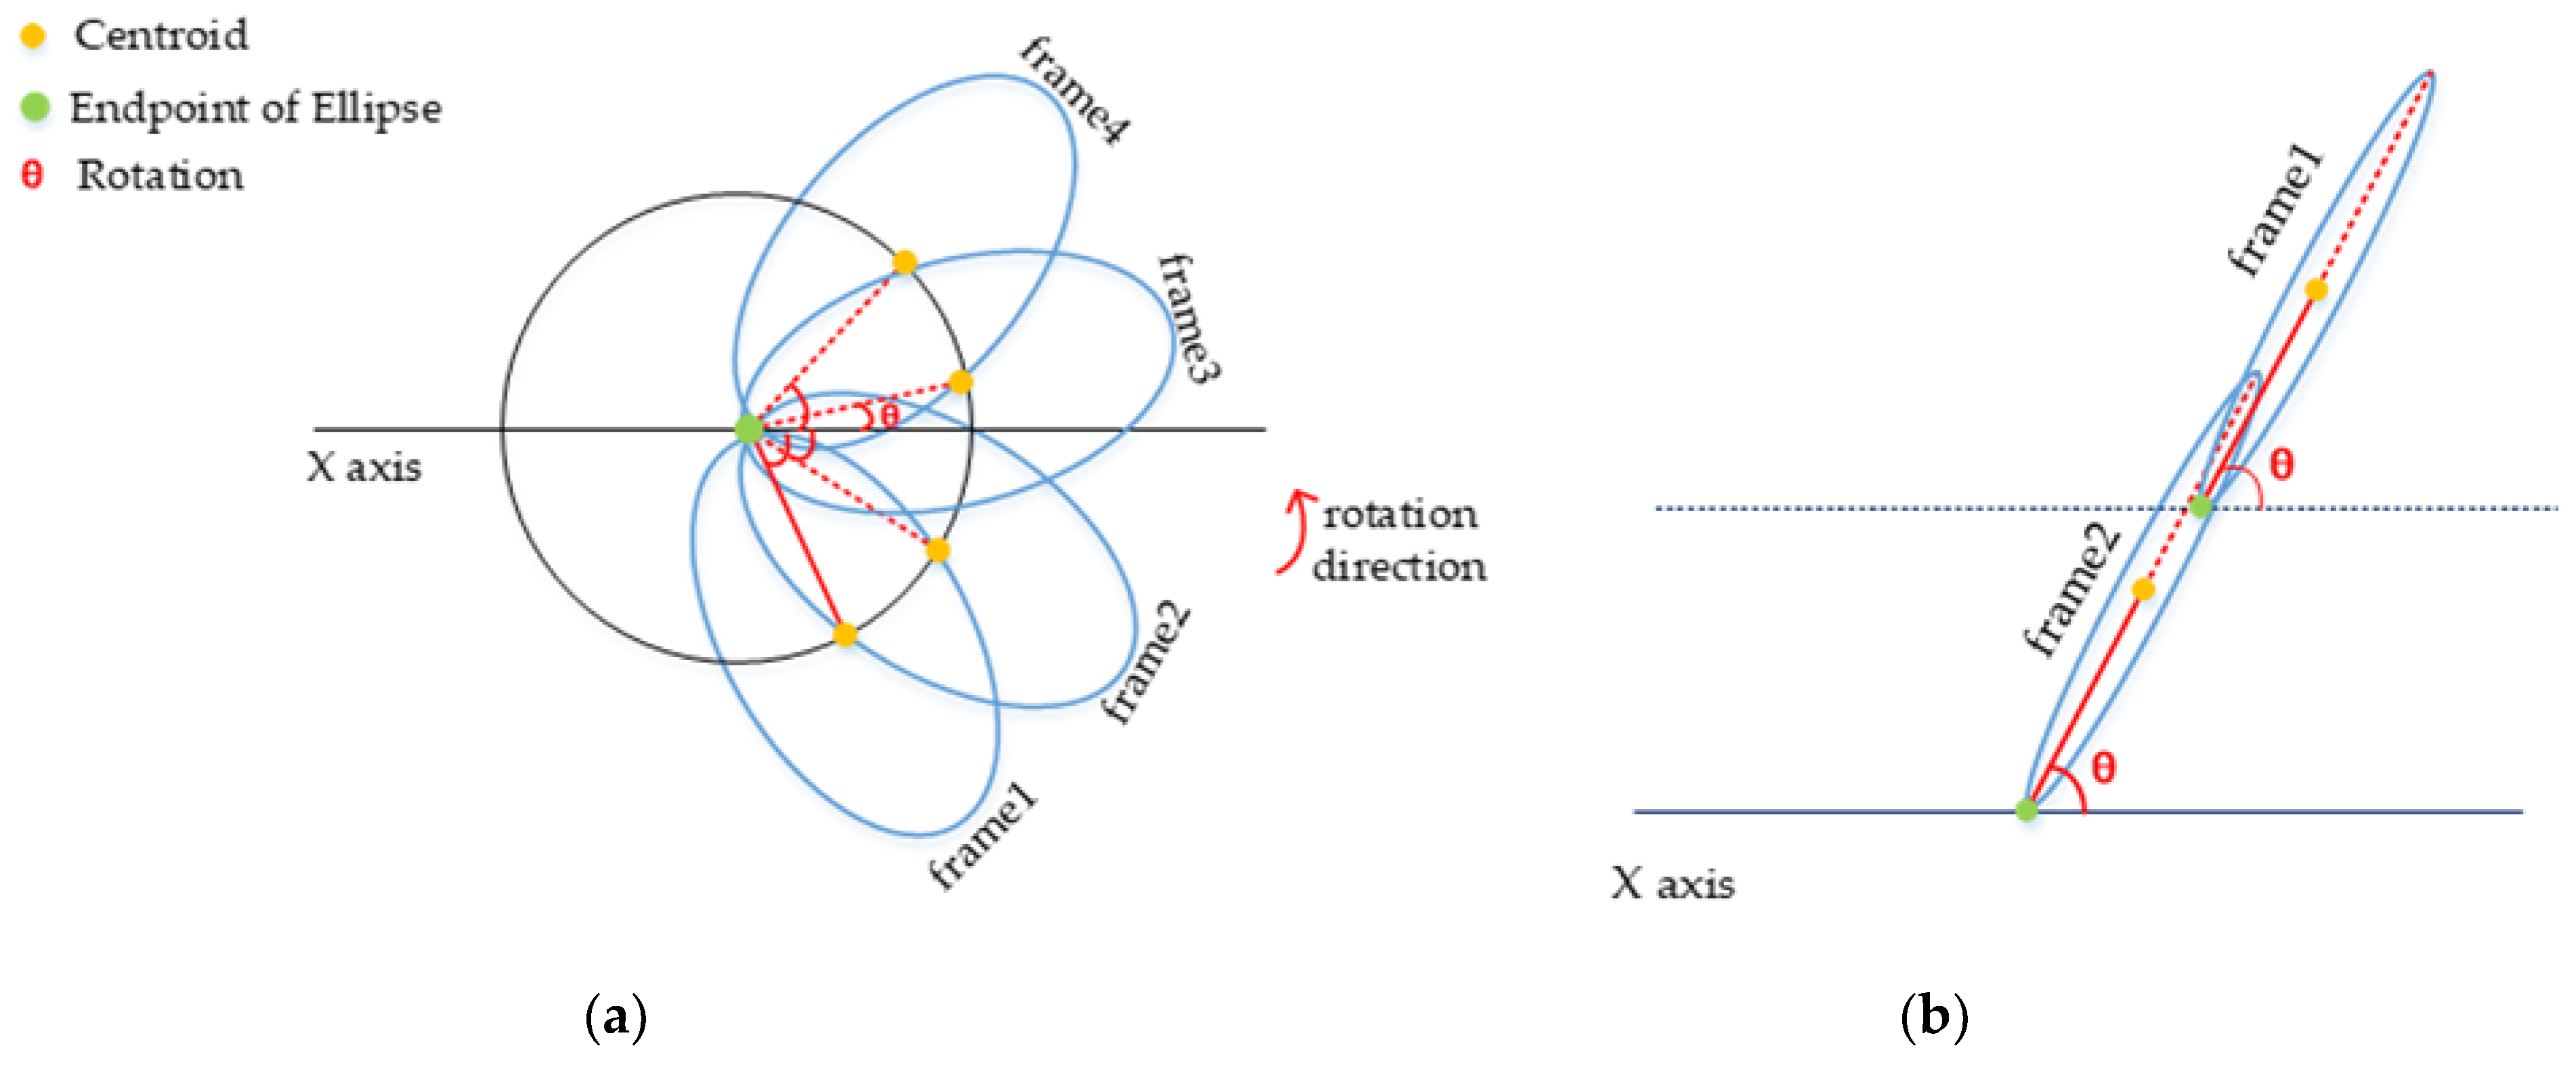
- Rotation angle
- (2)
- Moving distance
4.6. Apply Trajectory Feature for Discrimination
5. Experiment
5.1. Processing Results
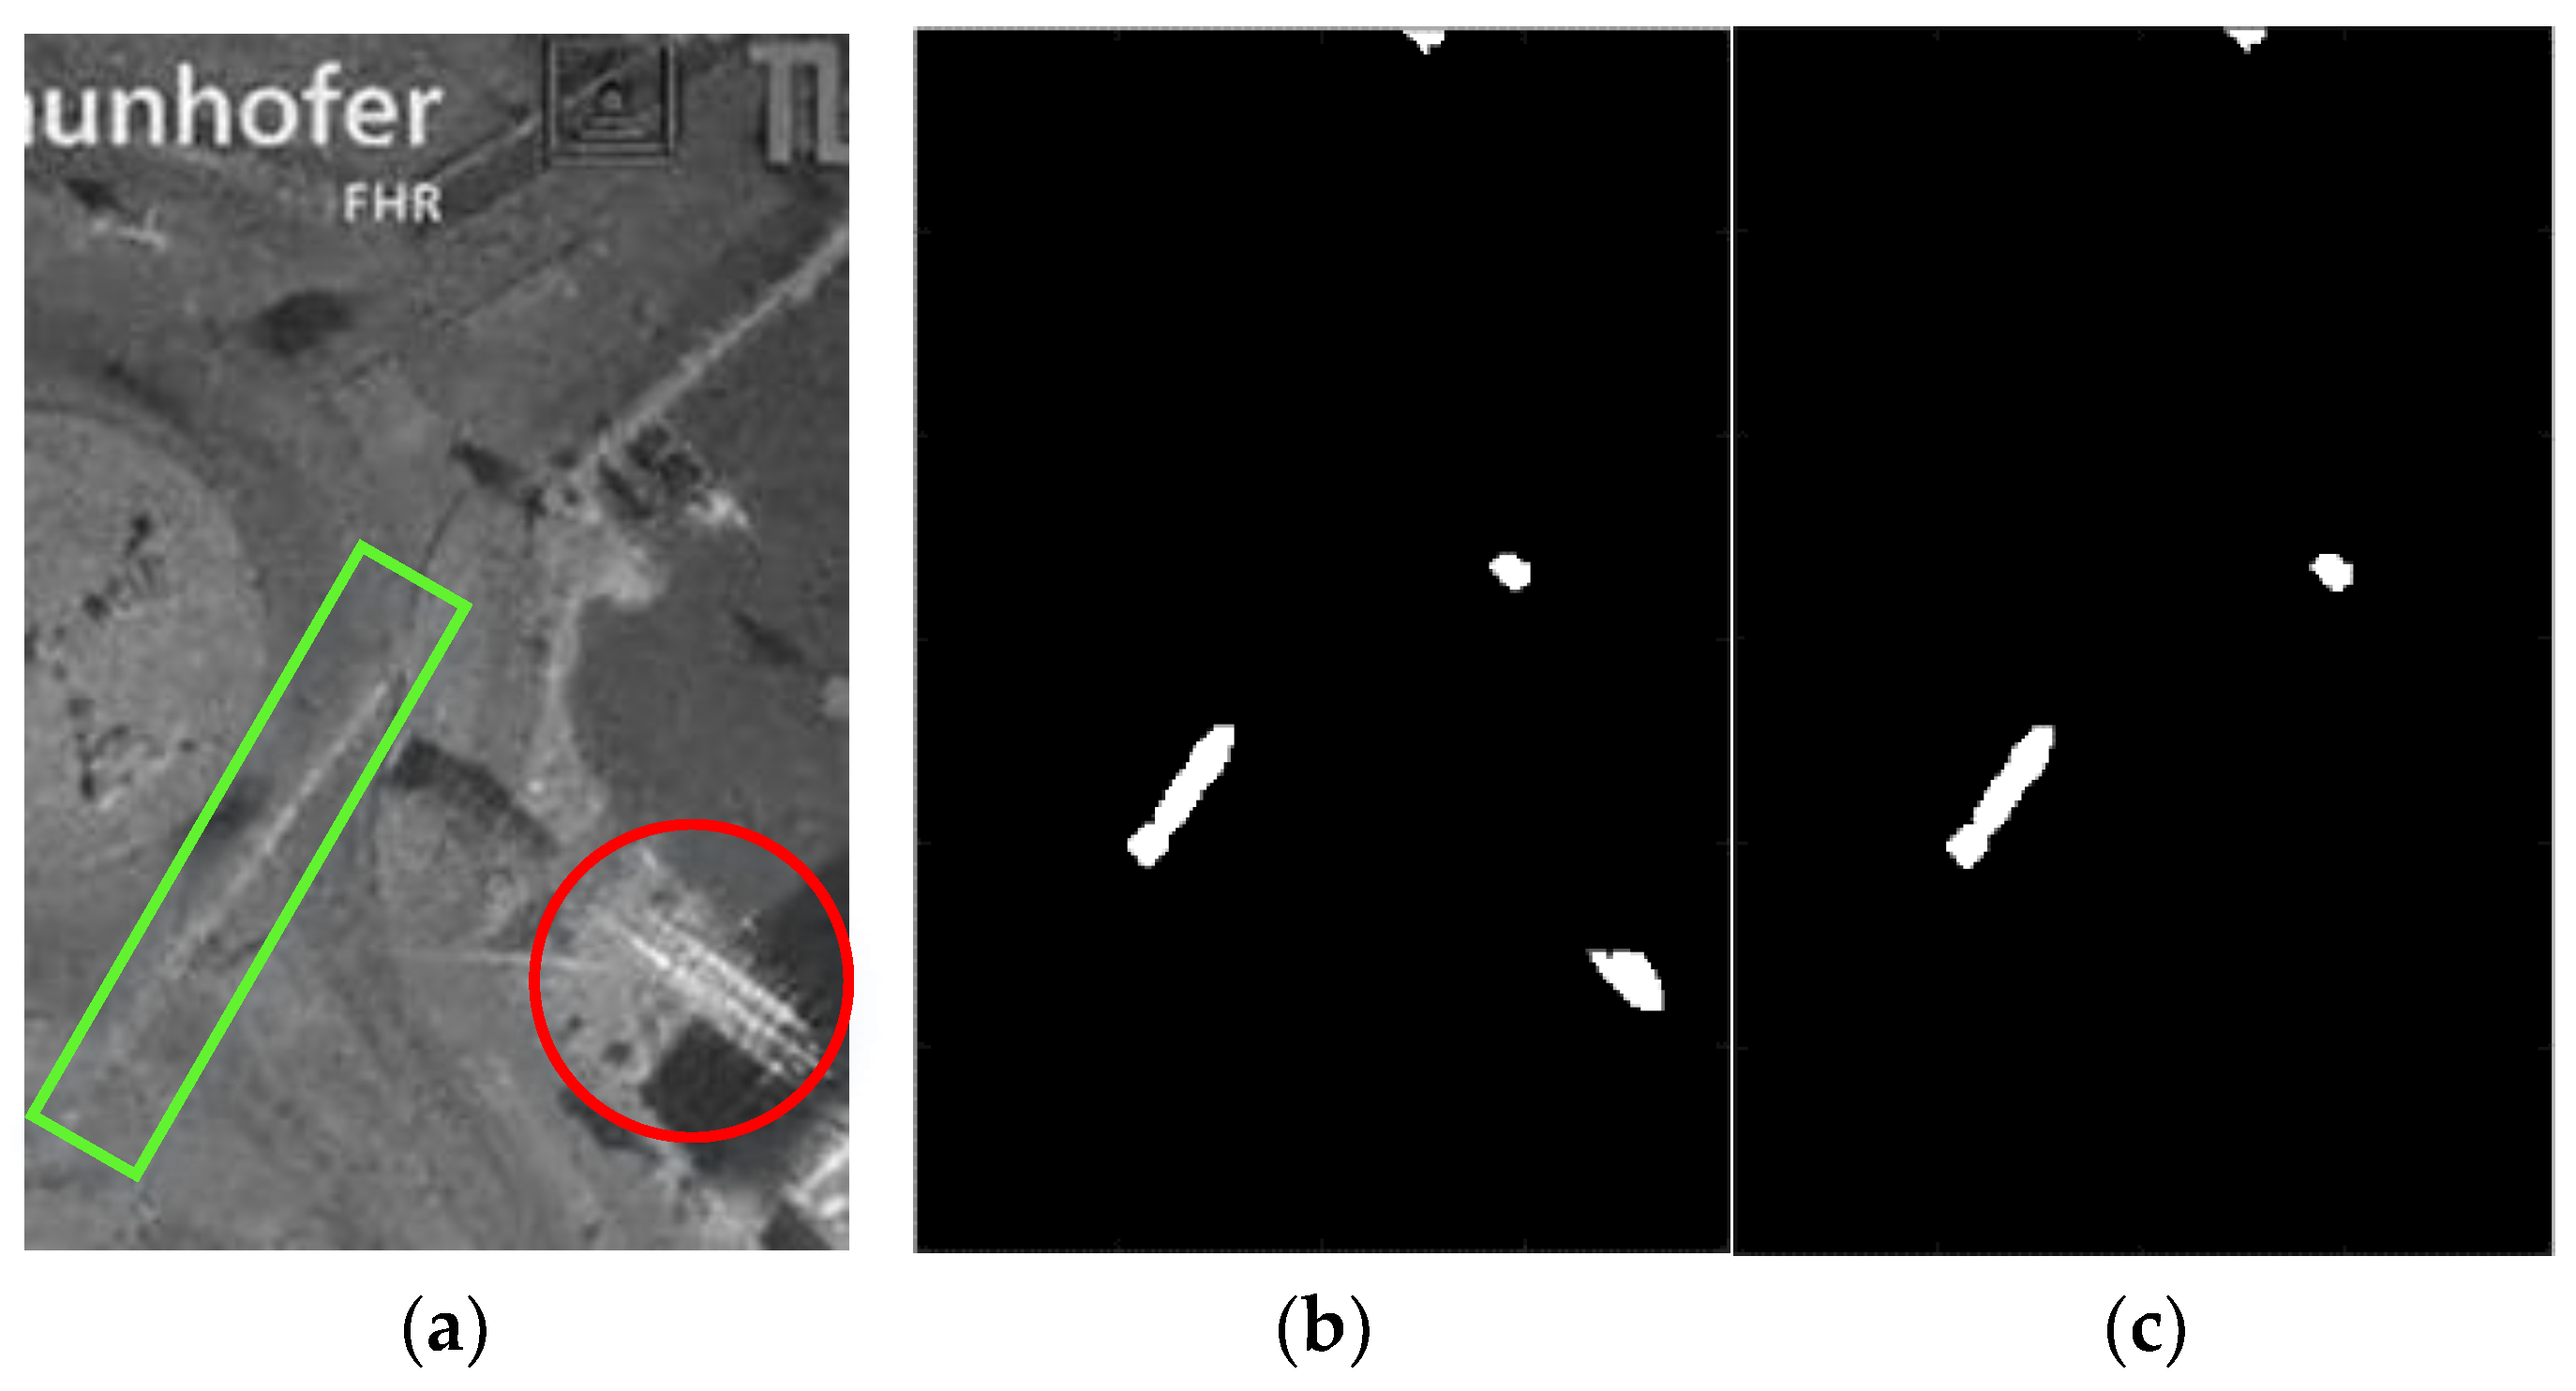
5.1.1. LBS Result
5.1.2. Morphological Processing
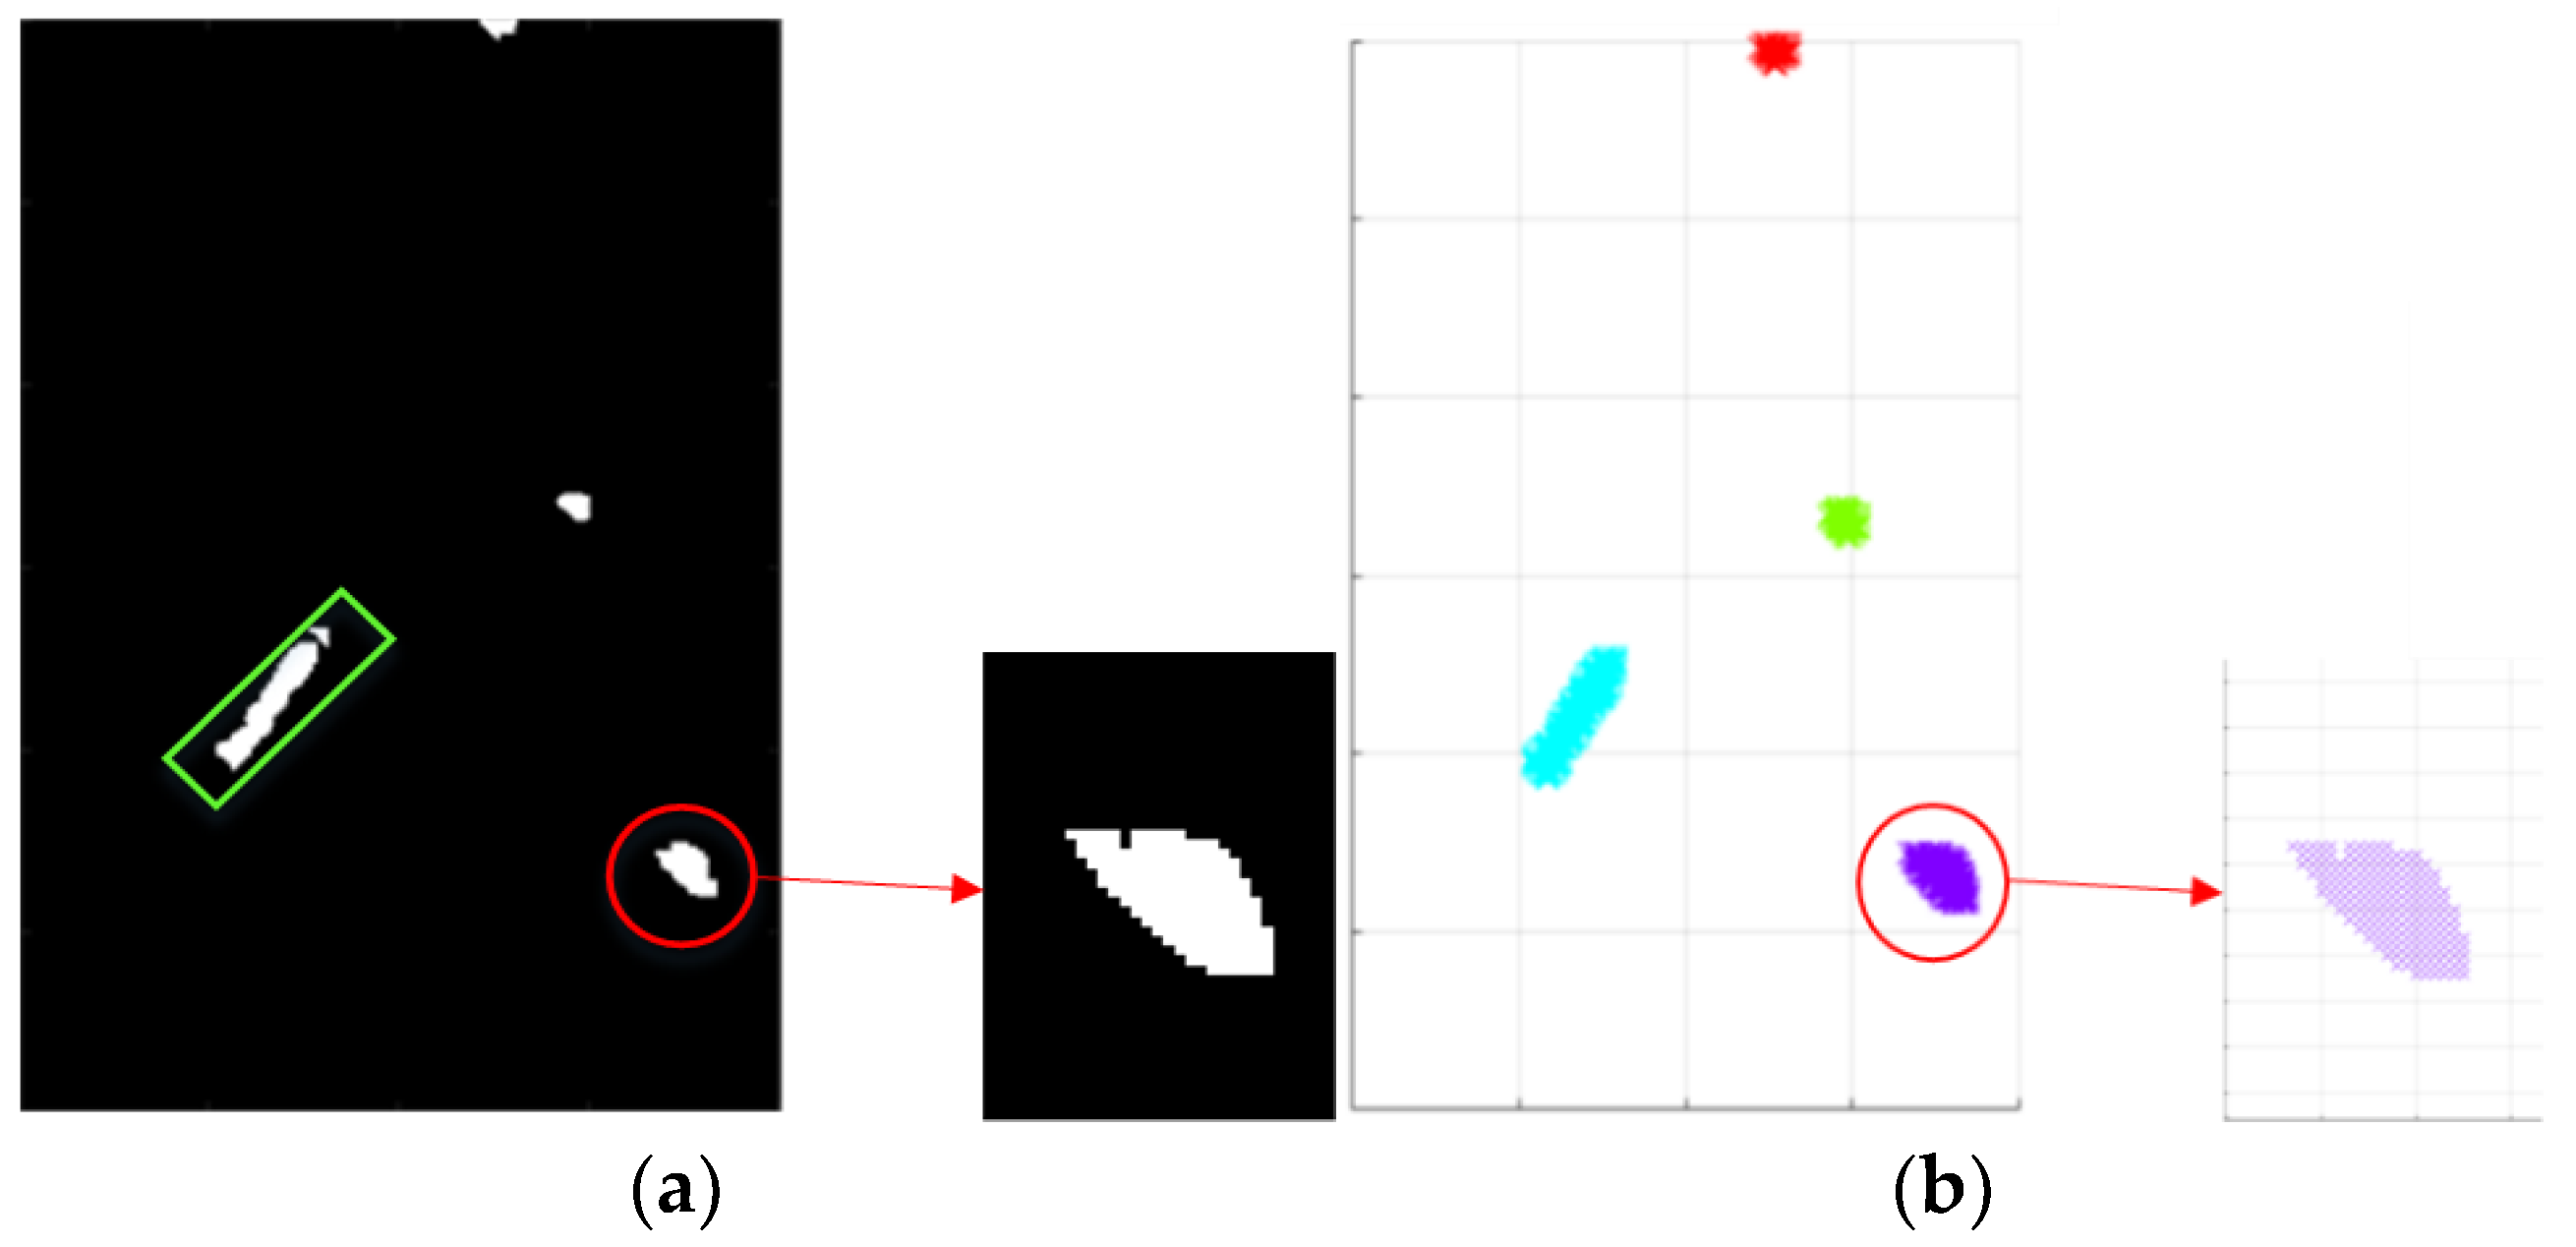
5.1.3. DBSCAN Clustering
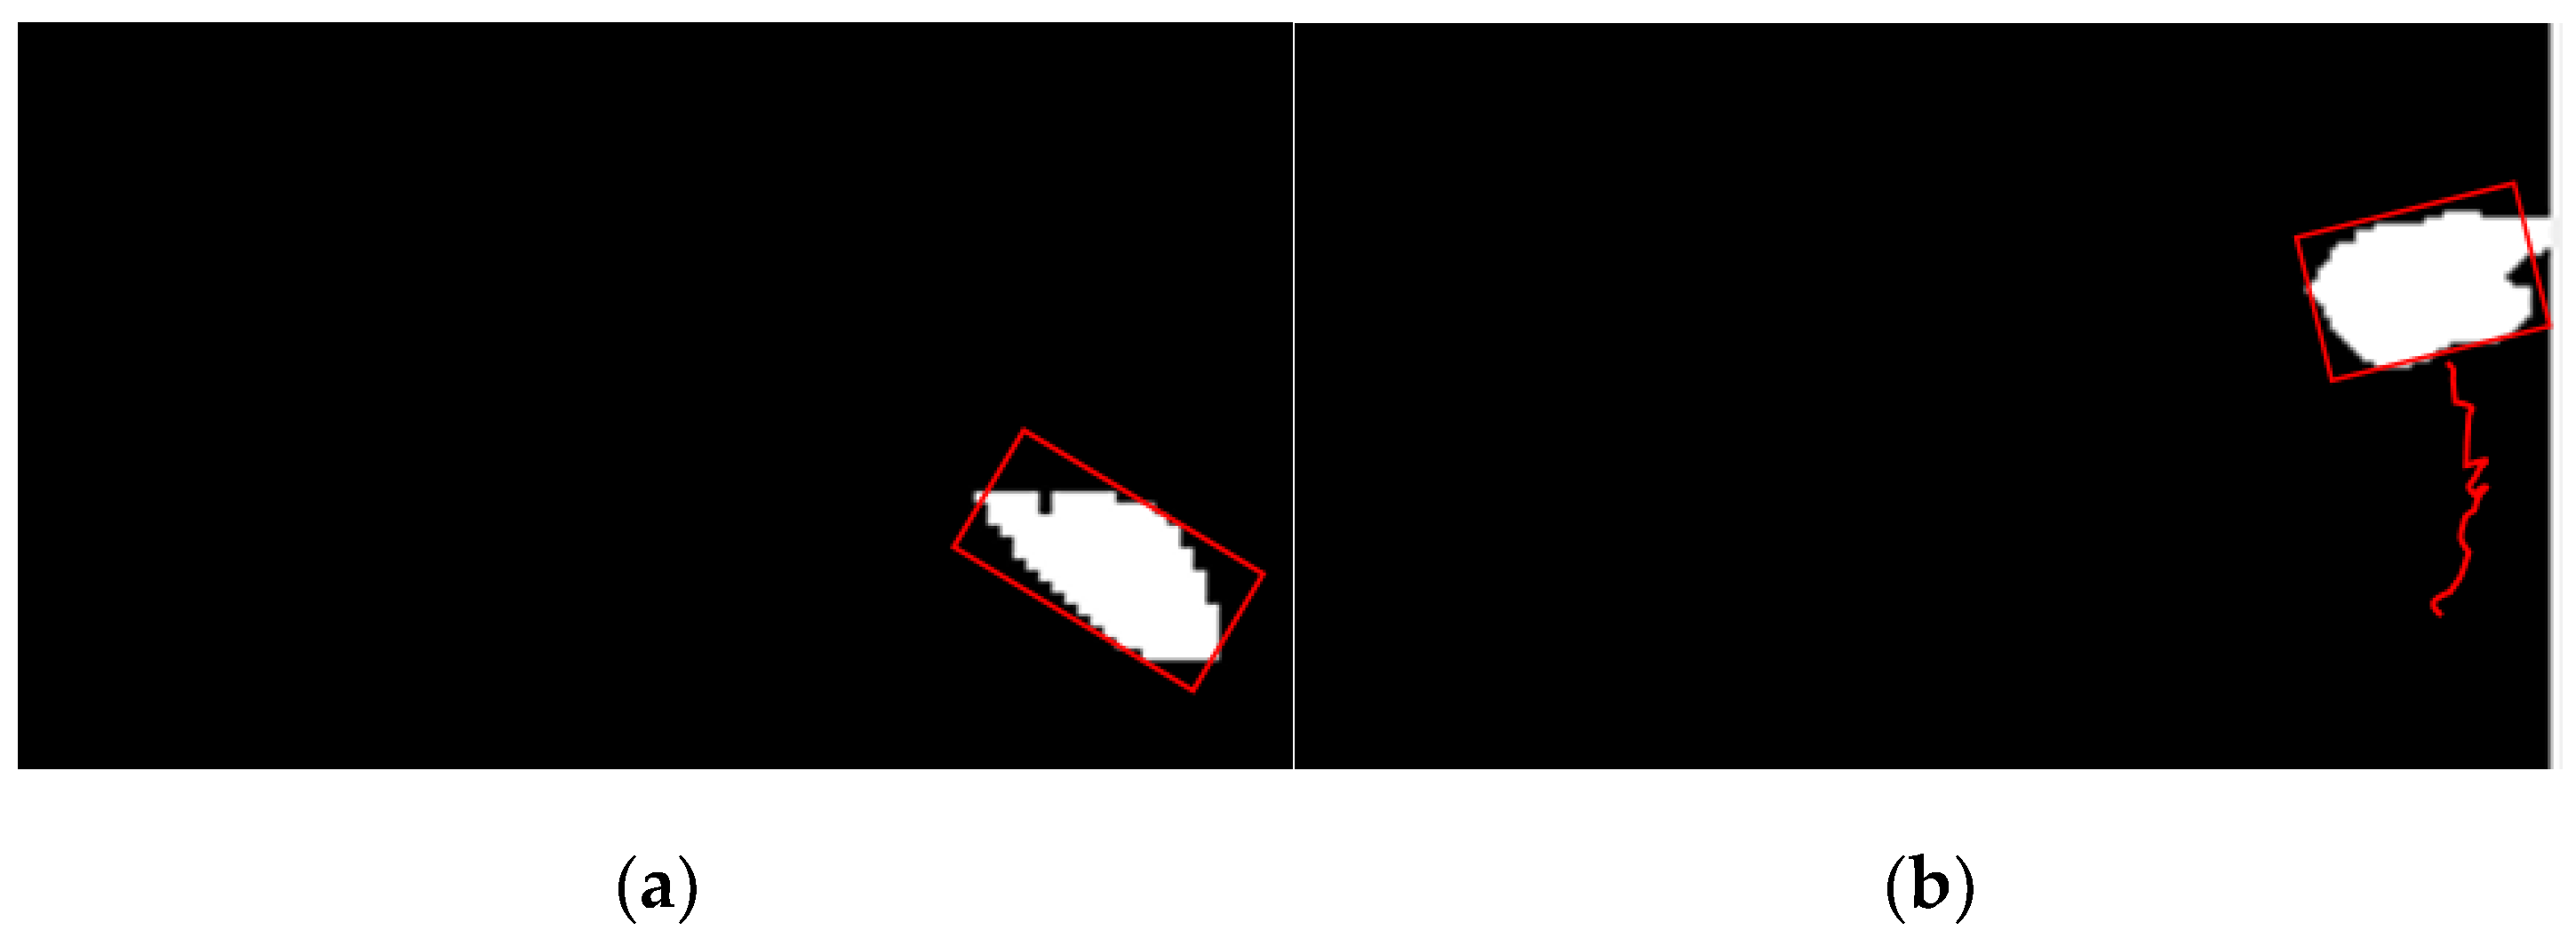
5.1.4. Target Tracking
5.1.5. Trajectory Feature Extraction and Discrimination
5.1.6. False Alarm Suppression
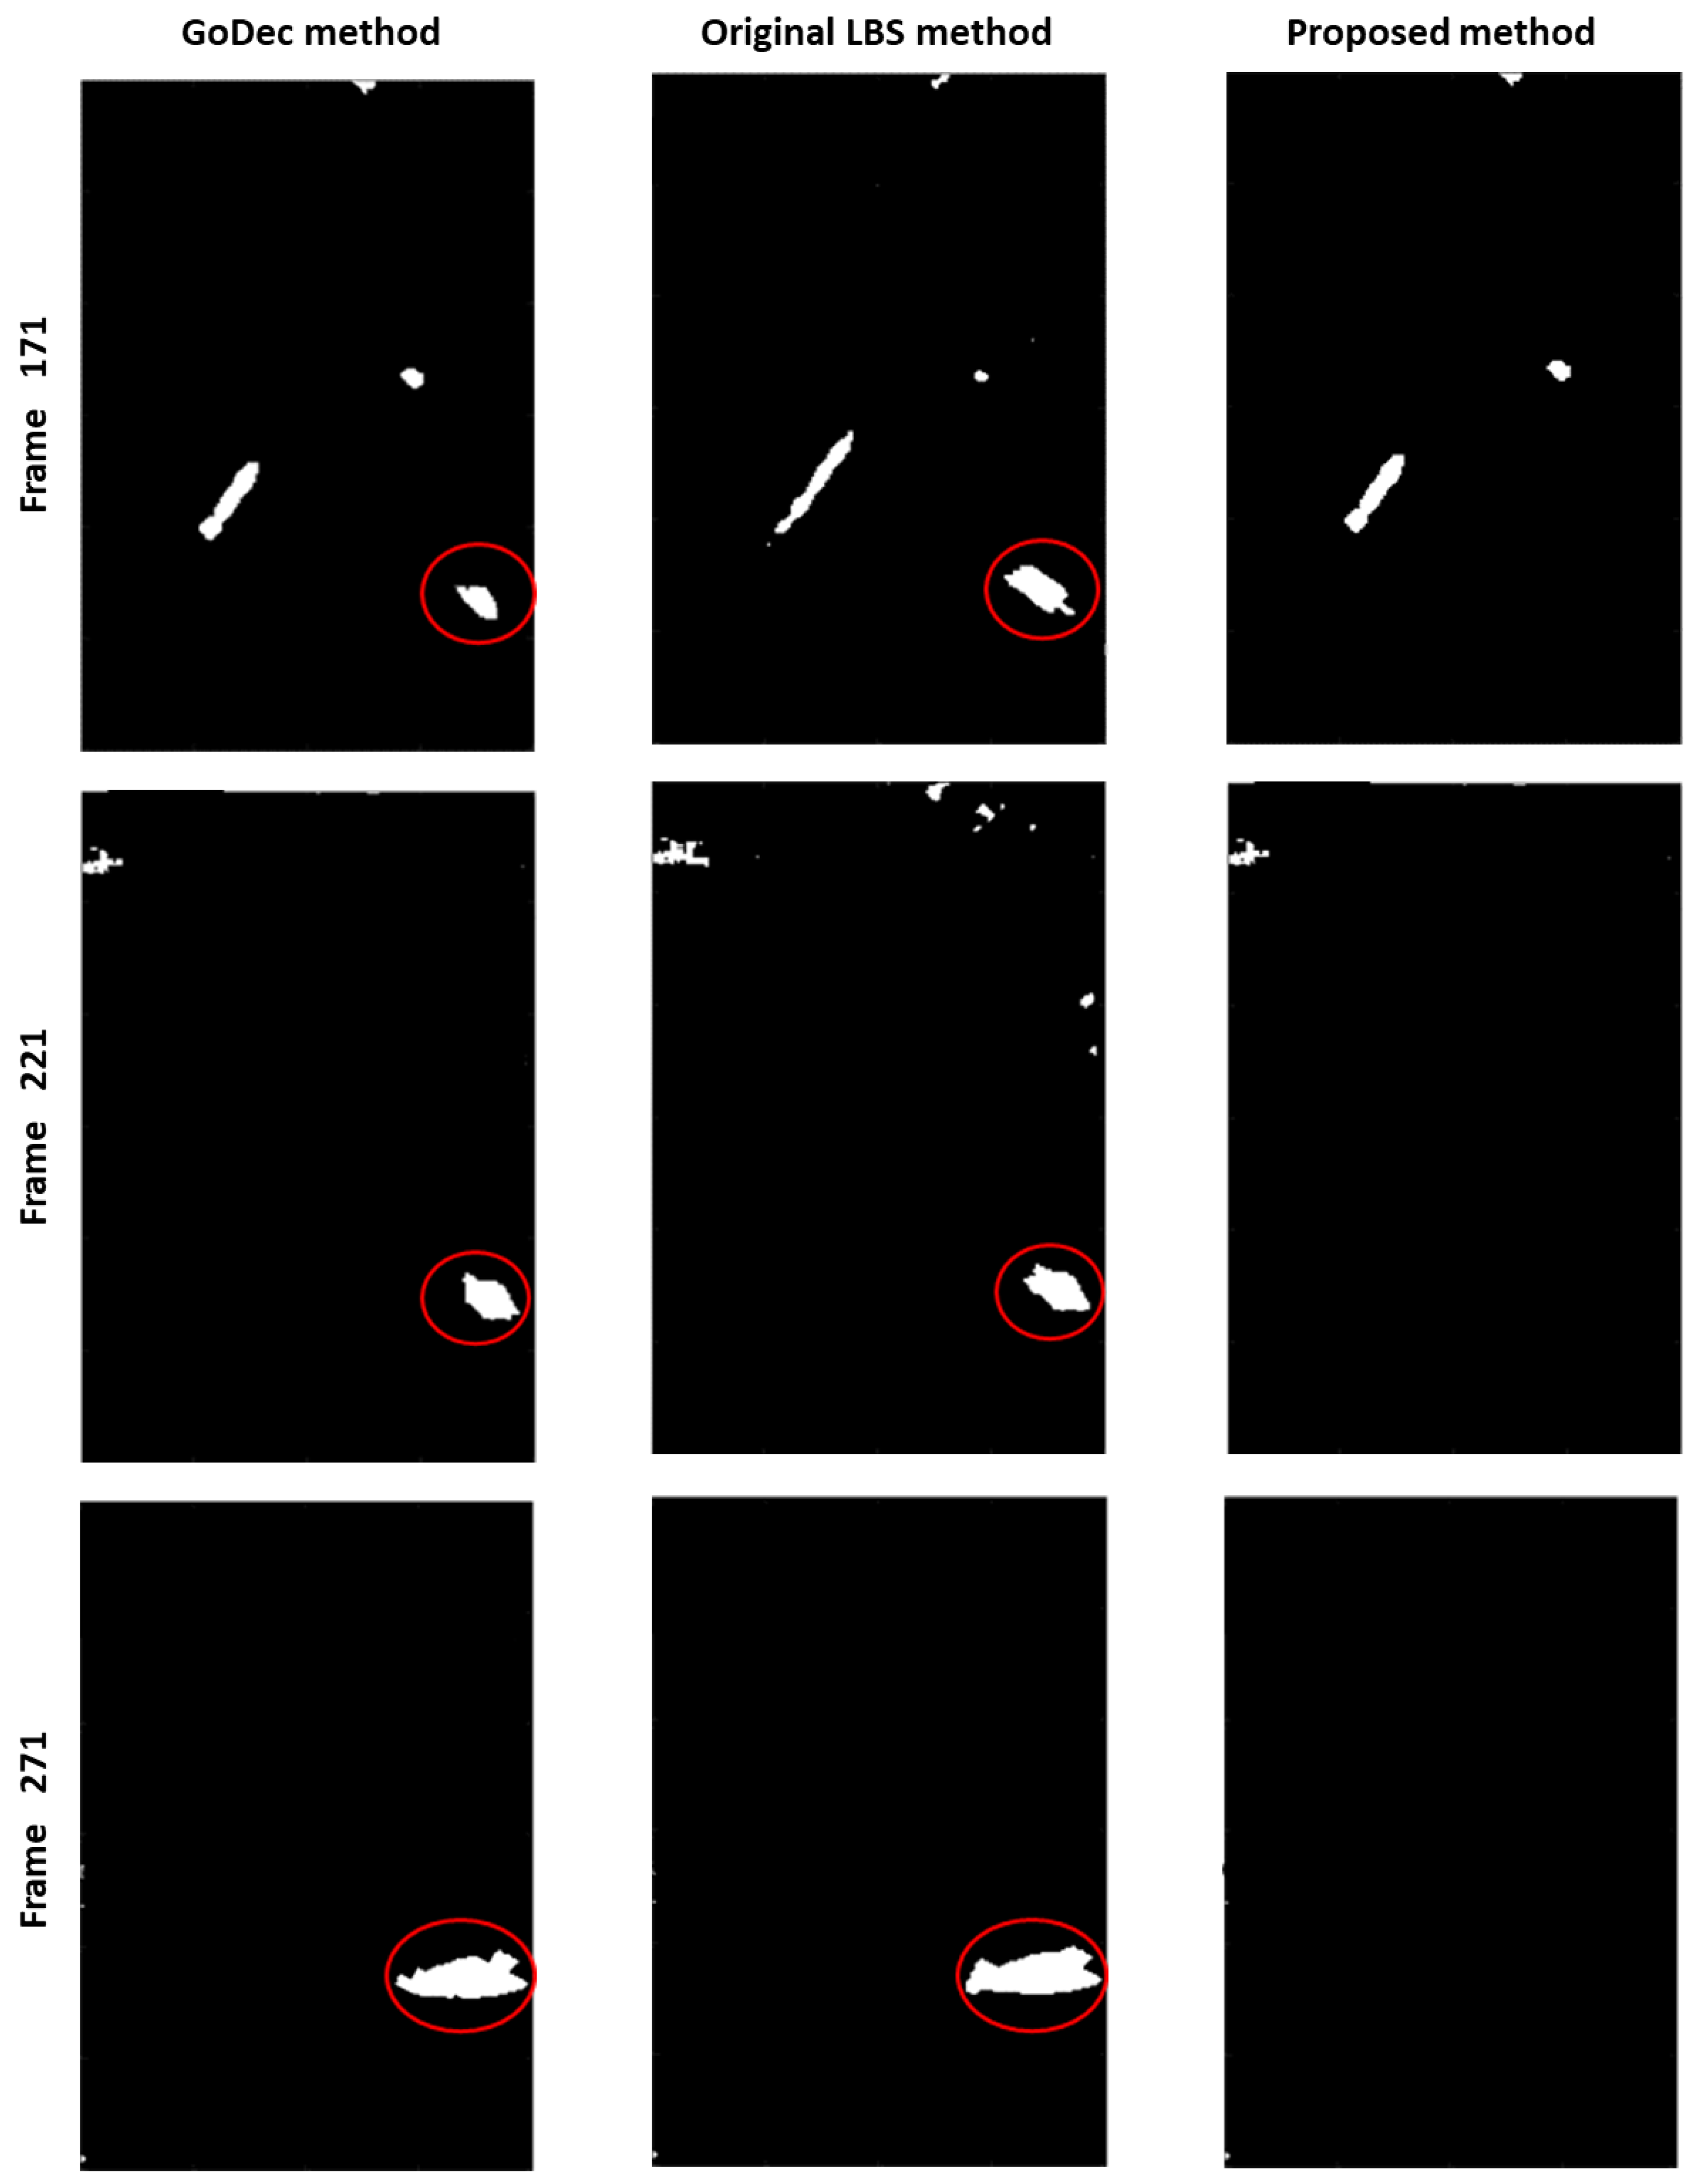
5.1.7. Method Comparison Experiment
6. Conclusions
Author Contributions
Funding
Data Availability Statement
Acknowledgments
Conflicts of Interest
References
- Frolind, P.O.; Ulander, L.M.H.; Gustavsson, A.; Stenstrom, G. VHF/UHF band SAR imaging using circular tracks. In Proceedings of the IEEE International Geoscience and Remote Sensing Symposium, Munich, Germany, 22–27 July 2012; pp. 7409–7411. [Google Scholar]
- Kim, S.; Yu, J.; Jeon, S.Y.; Dewantari, A.; Ka, M.H. Signal Processing for a Multiple-Input, Multiple-Output (MIMO) Video Synthetic Aperture Radar (SAR) with Beat Frequency Division Frequency-Modulated Continuous Wave (FMCW). Remote Sens. 2017, 9, 491. [Google Scholar] [CrossRef] [Green Version]
- Zhang, J.; Suo, Z.; Li, Z.; Zhang, Q. DEM Generation Using Circular SAR Data Based on Low Rank and Sparse Matrix Decomposition. IEEE Geosci. Remote Sens. Lett. 2018, 15, 724–728. [Google Scholar] [CrossRef]
- Cerutti-Maori, D.; Klare, J.; Brenner, A.R.; Ender, J.H.G. Wide-area traffic monitoring with the SAR/GMTI system PAMIR. IEEE Trans. Geosci. Remote Sens. 2008, 46, 3019–3030. [Google Scholar] [CrossRef]
- Damini, A.; Balaji, B.; Parry, C.; Mantle, V. A video SAR mode for the X-band wide band experimental air borne radar. In Proceedings of the Algorithms for Synthetic Aperture Radar Imagery XVII, Orlando, FL, USA, 18 April 2010; p. 76990E. [Google Scholar]
- Bao, J.; Zhang, X.; Zhang, T.; Shi, J.; Wei, S. A Novel Guided Anchor Siamese Network for Arbitrary Target-of-Interest Tracking in Video-SAR. Remote Sens. 2021, 13, 4504. [Google Scholar] [CrossRef]
- Mapelli, D.; Guarnieri, A.M.; Giudici, D. Generation and Calibration of High-Resolution DEM From Single-Baseline Spaceborne Interferometry: The “Split-Swath” Approach. IEEE Trans. Geosci. Remote Sens. 2013, 52, 4858–4867. [Google Scholar] [CrossRef]
- Jao, J.K. Theory of synthetic aperture radar imaging of a moving target. IEEE Trans. Geosci. Remote Sens. 2001, 39, 1984–1992. [Google Scholar]
- Lightstone, L.; Faubert, D.; Rempel, G. Multiple phase centre DPCA for airborne radar. In Proceedings of the 1991 IEEE National Radar Conference, Los Angeles, CA, USA, 12–13 March 1991; pp. 36–40. [Google Scholar]
- Makhoul, E.; Baumgartner, S.V.; Jager, M.; Broquetas, A. Multichannel SAR-GMTI in Mari time Scenarios with F-SAR and Terra SAR-X Sensors. IEEE J. Sel. Top. Appl. Earth Obs. Remote Sens. 2015, 8, 5052–5067. [Google Scholar] [CrossRef]
- Kirscht, M. Detection and imaging of arbitrarily moving targets with single-channel SAR. IEEE Proc. Radar Sonar Navig. 2003, 150, 7–11. [Google Scholar] [CrossRef]
- Ouchi, K. On the multilook images of moving targets by synthetic aperture radars. IEEE Trans. Antennas Propag. 1985, 33, 823–827. [Google Scholar] [CrossRef] [Green Version]
- Gierull, C.H. Statistical analysis of multilook SAR interferograms for CFAR detection of ground moving targets. IEEE Trans. Geosci. Remote Sens. 2004, 42, 691–701. [Google Scholar] [CrossRef]
- Henke, D.; Dominguez, E.M.; Small, D.; Schaepman, M.E.; Meier, E. Moving target tracking in single and multichannel SAR. IEEE Trans. Geosci. Remote Sens. 2015, 53, 3146–3159. [Google Scholar] [CrossRef]
- Perlovsky, L.; Ilin, R.; Deming, R.; Linnehan, R.; Lin, F. Moving target detection and characterization with circular SAR. In Proceedings of the IEEE Radar Conference, Washington, DC, USA, 10–14 May 2010; pp. 661–666. [Google Scholar]
- Henke, D.; Magnard, C.; Frioud, M.; Small, D.; Meier, E.; Schaepman, M.E. Moving-target tracking in single-channel wide-beam SAR. IEEE Trans. Geosci. Remote Sens. 2012, 50, 4735–4747. [Google Scholar] [CrossRef] [Green Version]
- Tian, X.; Liu, J.; Mallick, M. Simultaneous Detection and Tracking of Moving-Target Shadows in ViSAR Imagery. IEEE Trans. Geosci. Remote Sens. 2020, 59, 1182–1199. [Google Scholar] [CrossRef]
- Wang, H.; Chen, Z.; Zheng, S. Preliminary research of low RCS moving target detection based on Ka-band Video-SAR. IEEE Geosci. Remote Sens. Lett. 2017, 14, 811–815. [Google Scholar] [CrossRef]
- Ying, Z.; Daiyin, Z.; Xiang, Y.; Mao, X. Approach to moving targets shadow detection for Video SAR. J. Electron. Inf. Technol. 2017, 39, 2197–2202. [Google Scholar]
- Wang, K.; Qian, J.; Huang, S.; Xing, M.; Yang, X.; Yang, L. Single channel sar slow moving target detection in time-frequency domain. In Proceedings of the 2019 6th Asia-Pacific Conference on Synthetic Aperture Radar (APSAR), Xiamen, China, 26–29 November 2019. [Google Scholar]
- Yi, H.; Fan, C.Y.; Yang, J.G.; Huang, X.T. Imaging and locating multiple ground moving targets based on keystone transform and FrFT for single channel SAR system. In Proceedings of the 2009 2nd Asian-Pacific Conference on Synthetic Aperture Radar, Xian, China, 26–30 October 2009; pp. 771–774. [Google Scholar] [CrossRef]
- Huang, Y.; Liao, G.; Li, J.; Xu, J. Ground moving target indication and parameter estimation with single channel for SAR system. In Proceedings of the 2016 IEEE International Geoscience and Remote Sensing Symposium (IGARSS), Beijing, China, 10–15 July 2016; pp. 6417–6420. [Google Scholar] [CrossRef]
- Palm, S.; Sommer, R.; Janssen, D.; Tessmann, A.; Stilla, U. Airborne Circular W-Band SAR for Multiple Aspect Urban Site Monitoring. IEEE Trans. Geosci. Remote Sens. 2019, 57, 6996–7016. [Google Scholar] [CrossRef]
- Shen, W.; Lin, Y.; Yu, L.; Xue, F.; Hong, W. Single Channel Circular SAR Moving Target Detection Based on Logarithm Background Subtraction Algorithm. Remote Sens. 2018, 10, 742. [Google Scholar] [CrossRef] [Green Version]
- Shen, W.; Hong, W.; Han, B.; Wang, Y.; Lin, Y. Moving Target Detection with Modified Logarithm Background Subtraction and Its Application to the GF-3 Spotlight Mode. Remote Sens. 2019, 11, 1190. [Google Scholar] [CrossRef] [Green Version]
- Zhang, Y.; Zhu, D.; Wang, P.; Zhang, G.; Leung, H. Vision-Based Vehicle Detection for VideoSAR Surveillance Using Low-Rank Plus Sparse Three-Term Decomposition. IEEE Trans. Veh. Technol. 2020, 69, 4711–4726. [Google Scholar] [CrossRef]
- Li, Y.; Li, C.; Yang, W.; Wang, Y.; Li, Y. Moving Vehicle Detection Based on RPCA Using Multisquint Spaceborne SAR Images. IEEE Geosci. Remote Sens. Lett. 2022, 19, 4005005. [Google Scholar] [CrossRef]
- Bouwmans, T.; Sobral, A.; Javed, S.; Jung, S.K.; Zahzah, E.H. Decomposition into low-rank plus additive matrices for background/foreground separation: A review for a comparative evaluation with a large-scale dataset. Comput. Sci. Rev. 2017, 23, 1–71. [Google Scholar] [CrossRef] [Green Version]
- Feng, S.; Lin, Y.; Wang, Y.; Yang, Y.; Shen, W.; Teng, F.; Hong, W. DEM Generation with a Scale Factor Using Multi-Aspect SAR Imagery Applying Radar Grammetry. Remote Sens. 2020, 12, 556–573. [Google Scholar] [CrossRef] [Green Version]
- An, D.; Wang, W.; Zhou, Z. Refocusing of Ground Moving Target in Circular Synthetic Aperture Radar. IEEE Sens. J. 2019, 19, 8668–8674. [Google Scholar] [CrossRef]
- Li, J.; An, D.; Wang, W.; Zhou, Z.; Chen, M. A Novel Method for Single-Channel CSAR Ground Moving Target Imaging. IEEE Sens. J. 2019, 19, 8642–8649. [Google Scholar] [CrossRef]
- Shen, W.; Lin, Y.; Chen, S.; Xue, F.; Yang, Y.; Hong, W. Apparent Trace Analysis of Moving Target with Linear Motion in Circular SAR Imagery. In Proceedings of the EUSAR 2018: 12th European Conference on Synthetic Aperture Radar, Aachen, Germany, 4–7 June 2018; pp. 1–4. [Google Scholar]
- Zhou, T.; Tao, D. GoDec: Randomized Lowrank & Sparse Matrix Decomposition in Noisy Case. In Proceedings of the 28th International Conference on Machine Learning, ICML 2011, Bellevue, WA, USA, 28 June–2 July 2011; pp. 33–40. [Google Scholar]


| Parameters | Description |
|---|---|
| Center Frequency | 94 GHz |
| Flight Height | 300 m |
| Resolution | 15 cm × 12 cm |
| Frame Rate | 20 Hz |
| Total Frames | 607 |
| Subaperture Overlap Rate | 80% |
| Parameters | Value |
|---|---|
| Aircraft height (m) | 7251 |
| Aircraft radius (m) | 467 |
| Target A height (m) | 0 |
| Target B height (m) | 5 |
| Incidence angle (°) | 15 |
| Subaperture degree (°) | 2 |
| Basic Feature Name | Description |
|---|---|
| Equivalent ellipse | Minimum bounding ellipse with equal pixels |
| Centroid | Center of mass |
| Major axis length | The major axis of the ellipse |
| Orientation | The angle between ellipse’s major axis and X-axis |
| False Alarm | Moving Target | |
|---|---|---|
| Moving distance (m) | 3.8093 | 23.2384 |
Disclaimer/Publisher’s Note: The statements, opinions and data contained in all publications are solely those of the individual author(s) and contributor(s) and not of MDPI and/or the editor(s). MDPI and/or the editor(s) disclaim responsibility for any injury to people or property resulting from any ideas, methods, instructions or products referred to in the content. |
© 2023 by the authors. Licensee MDPI, Basel, Switzerland. This article is an open access article distributed under the terms and conditions of the Creative Commons Attribution (CC BY) license (https://creativecommons.org/licenses/by/4.0/).
Share and Cite
Shen, W.; Ding, F.; Wang, Y.; Li, Y.; Sun, J.; Lin, Y.; Jiang, W.; Wang, S. Static High Target-Induced False Alarm Suppression in Circular Synthetic Aperture Radar Moving Target Detection Based on Trajectory Features. Remote Sens. 2023, 15, 3164. https://doi.org/10.3390/rs15123164
Shen W, Ding F, Wang Y, Li Y, Sun J, Lin Y, Jiang W, Wang S. Static High Target-Induced False Alarm Suppression in Circular Synthetic Aperture Radar Moving Target Detection Based on Trajectory Features. Remote Sensing. 2023; 15(12):3164. https://doi.org/10.3390/rs15123164
Chicago/Turabian StyleShen, Wenjie, Fan Ding, Yanping Wang, Yang Li, Jinping Sun, Yun Lin, Wen Jiang, and Shuo Wang. 2023. "Static High Target-Induced False Alarm Suppression in Circular Synthetic Aperture Radar Moving Target Detection Based on Trajectory Features" Remote Sensing 15, no. 12: 3164. https://doi.org/10.3390/rs15123164
APA StyleShen, W., Ding, F., Wang, Y., Li, Y., Sun, J., Lin, Y., Jiang, W., & Wang, S. (2023). Static High Target-Induced False Alarm Suppression in Circular Synthetic Aperture Radar Moving Target Detection Based on Trajectory Features. Remote Sensing, 15(12), 3164. https://doi.org/10.3390/rs15123164