Abstract
Due to significant electromagnetic interference, radar interruptions, and other factors, Azimuth Missing Data (AMD) may occur in Synthetic Aperture Radar (SAR) echo, resulting in severe defocusing and even false targets. An important approach to solving this problem is to utilize Compressed Sensing (CS) methods on AMD echo to reconstruct complete echo, which can be abbreviated as the AMD Imaging Algorithm (AMDIA). However, the State-of-the-Art AMDIA (SOA-AMDIA) do not consider the influence of motion phase errors, resulting in an unacceptable estimation error of the complete echo reconstruction. Therefore, in order to enhance the practical applicability of AMDIA, this article proposes an improved AMDIA using Sparse Representation Autofocusing (SRA-AMDIA). The proposed SRA-AMDIA aims to accurately focus the imaging result, even in the Phase Error AMD (PE-AMD) echo case. Firstly, a Phase-Compensation Function (PCF) based on the phase history of the scene centroid is designed. When the PCF is multiplied with the PE-AMD echo in the range-frequency domain, a coarse-focused sparse representation signal can be obtained in the range-Doppler domain. However, due to the influence of unknown PE, the sparsity of this sparse representation signal is unsatisfying, breaking the sparse constraints requirement of the CS method. Therefore, we introduced a minimum entropy autofocusing algorithm to autofocus this sparse representation signal. Next, the estimated PE is compensated for this sparse representation signal, and a more sparse representation signal is obtained. Hence, the non-PE complete echo can be reconstructed. Finally, the estimated complete echo can be used with classic imaging algorithms to obtain high-resolution imaging results under the PE-AMD condition. Simulation and real measured data have verified the effectiveness of the proposed SRA-AMDIA.
1. Introduction
With the accumulation of Synthetic Aperture Radar (SAR) imaging technology and the development of complex electromagnetic environments, the application background faced by SAR is becoming more practical and the imaging configuration is more complex [1,2,3,4,5,6,7,8]. Therefore, the focus of SAR research has gradually shifted from ideal configurations to complex configurations. Various improved SAR imaging algorithms have emerged [9,10,11,12]. Azimuth Missing Data (AMD) SAR imaging problem, an unavoidable imaging difficulty in practice, has attracted attention for nearly 30 years [13,14,15].
The emergence of AMD is mainly due to the following reasons: (1) Strong electromagnetic interference occurs at certain azimuth positions between the imaging area and the SAR platform; (2) The high-power radar cannot work continuously for a long time and needs to intermittently stop during the data acquisition process; (3) In order to improve its concealment and flexibility, the SAR platform actively shuts down the radar when entering the reconnaissance area. Compared to complete aperture data, AMD will result in missing portions of the Doppler bandwidth. If the classical SAR imaging algorithm is used directly, serious defocusing and even false targets will occur. The accuracy of the final imaging result will be significantly reduced [16].
An early solution to AMD-SAR mainly relied on introducing various parameter estimation algorithms to estimate and reconstruct complete aperture data, such as APES algorithm, MIAA, and the relevant improved algorithms [17,18,19,20,21]. However, their limitations are significant. First of all, the estimation accuracy of these algorithms is limited when the data loss rate is large. In the meantime, the computational complexity of the above-mentioned algorithms is high when facing large imaging scenes. In 2006, the proposed Compressive Sensing (CS) technology discovered that a complete signal with sparsity constraints can be accurately recovered from a small-size signal that does not satisfy the Nyquist–Shannon sampling theorem [22,23]. Therefore, CS methods were quickly introduced into SAR imaging field. A series of sparse SAR imaging algorithms were proposed [24,25,26]. In order to enhance the applicability of sparse SAR imaging algorithms in the presence of motion errors, Ref. [27] once proposed a phase error estimation and compensation method, which can compensate for one-dimensional and two-dimensional phase errors in the observed data. Ref. [28] proposed a method for the joint optimization of sparse target reconstruction and observation position error, which significantly improved the quality of target reconstruction in the presence of unknown phase errors. Ref. [29] further introduced an autoencoder model with a Convolutional Neural Network structure and considered the motion compensation in CS-based SAR imaging, proposing a deep SAR imaging method that can significantly reduce the data sampling rate. However, due to the need to convert SAR’s two-dimensional data into one-dimensional data in sparse SAR imaging, there is a heavy computational burden, making it only suitable for small scene imaging. Although various optimization algorithms have been proposed to solve the problem of large scene sparse SAR imaging [30,31], their effectiveness is still limited. Additionally, since sparse imaging algorithms directly reconstruct strong scattering points in the scene, they are sensitive to the echo Signal-to-Noise Ratio (SNR).
To address the heavy computational burden and sensitivity to echo SNR in sparse SAR imaging, an aperture completion imaging algorithm based on AMD, which is abbreviated as AMD Imaging Algorithm (AMDIA), was proposed in 2018 [32]. Unlike sparse SAR imaging algorithms, the AMDIA does not directly reconstruct strong scattering points in the scene. They found that a Phase Compensation Function (PCF) can be constructed based on the phase history of the scene centroid. After multiplying the echo signal with the PCF in the range-frequency domain, a coarse-focused image can be obtained in the range-Doppler domain when the imaging scene satisfies sparse constraints. Then, by reconstructing the coarse-focused signal, the complete echo is estimated. After obtaining the complete echo, the classical matched filtering methods can be used to focus the accurate imaging results in the case of AMD. In recent years, the development of AMDIA algorithms has been rapid. K. Liu introduced this idea into spaceborne FMCW SAR and significantly improved the imaging performance [33,34]. Ref. [35] improved the AMDIA algorithm so that it can quickly obtain accurate imaging results without prior knowledge of sparsity. An enhanced AMDIA algorithm was proposed by [36], which no longer reconstructs the original complete echo signal, but the complete range migration correction echo, improving the reconstruction accuracy with a low computational burden. Moreover, based on Ref. [36], a sub-echo segmentation and reconstruction AMDIA is proposed to enhance the sparsity of the phase-compensated signal and enlarge the two-dimensional imaging scene [37]. The AMD-SAR imaging performance advantage is theoretically verified. Moreover, Ref. [38] also incorporated the AMDIA concept into distributed along-track swarm SAR imaging, which can obtain high-resolution imaging results in a fast data acquisition time.
In fact, the aforementioned AMDIA and its improved algorithms are derived based on the assumption of an ideal trajectory of SAR. However, the ideal trajectory cannot be strictly guaranteed in practice. An additional unknown phase error will generate and result in defocusing of the final imaging results [7]. Various autofocusing methods have been proposed to address the phase errors problem, including Phase Gradient Autofocusing (PGA) [39,40], Map Drift (MD) [10,41], and non-parametric techniques such as Maximum Contrast Autofocusing (MCA) [42], Minimum Entropy Autofocusing (MEA) [43,44], Sharpness Optimization Autofocusing (SOA) [45], which are based on measurements of global image quality. They are exploited to autofocusing the final imaging results with the phase error, which can be regarded as a post-processing method. However, the autofocusing processing can no longer be simply used as a post-processing in the AMD case. This is because the AMDIA-class algorithms aim to reconstruct Phase-Compensated (PC) sparse representation signal. Due to the presence of unknown phase error, the sparsity of the PC sparse representation significant decreases. Once the sparsity of the signal is no longer satisfied, the CS method fails, resulting in a serious estimation error and obtaining an inaccurate reconstruction of the complete echo. There is no doubt that when there are both phase errors and estimation errors in the estimated complete aperture data, it will be more difficult to obtain an accurate imaging result using post-focusing processing methods.
For this issue, we propose an improved AMDIA via Sparse Representation Autofocusing (SRA-AMDIA). In order to obtain an accurately estimated complete echo, we no longer used autofocusing as a form of post-processing for imaging results. Instead, we first performed autofocusing of the PC AMD signal before estimating the complete echo. Specifically, we still designed the PCF based on the phase history of the scene center under no phase error, named 1st-PCF. Then, we multiplied this 1st-PCF with the AMD signal in the range-frequency domain to obtain a coarse-focused sparse representation in the range-Doppler domain. Obviously, the sparsity of the sparse representation signal was seriously affected. Subsequently, we introduced Image Entropy (IE), which can measure the sparsity and focusing performance of the image, to construct an objective function. Then, the MEA method was adopted to perform autofocusing on this sparse representation signal. When the IE of the sparse representation signal meets the iterative convergence condition, a 2nd-PCF is designed based on the estimated phase error. Then, the residual phase error of the 1st PC sparse representation signal can be compensated. At this moment, the sparsity prerequisite of the sparse representation is satisfied. Thus, the CS method can be used to accurately estimate the complete echo from the Phase Error AMD (PE-AMD) signal. Finally, a high-resolution imaging result can be obtained by applying classical SAR imaging algorithm with the estimated complete echo.
The main innovation of this paper is the introduction of the MEA for PE estimation in AMDIA-class algorithms, along with the design of a more efficient PCF. This PCF enables an accurate reconstruction of the complete echo in the PE-AMD case, leveraging the estimated PE. Concurrently, we cleverly estimate only the PE in the sparse representation signals of the AMD echo, rather than all the PE in the reconstructed complete echo. This brings two distinct advantages. Firstly, there is a significant reduction in the amount of data that the MEA need to process. Secondly, the MEA only needs to estimate the PE within the AMD echo, eliminating the need for estimating the reconstruction PE generated during the echo reconstruction process. Consequently, this advancement has led to substantial enhancements in both the speed and accuracy of the autofocusing. The applicability of AMDIA has been significantly expanded.
The structure of this article is as follows. In Section 2, we modeled the PE-AMD SAR echo. In Section 3, we analyzed the influence of phase errors on the reconstruction of complete echo. Furthermore, in Section 4, we provided a detailed derivation of the proposed SRA-AMDIA. In Section 5, we validated the proposed SRA-AMDIA using both simulation and real measured data, and conducted a detailed analysis of the imaging performance under different imaging algorithms. Finally, the conclusions are given in Section 6.
2. PE-AMD Echo Modeling
Firstly, we assume that the SAR system moves along the nominal trajectory. The ideal echo of an arbitrary target can be expressed as
t and are the fast time and slow time, respectively. is the back-scattered coefficient, which can be neglected, is the frequency modulation slope, c represents the velocity of light, and denotes the central frequency of transmit signal. n is random noise. Moreover, and are the range and azimuth windowing function, respectively. is the instantaneous slant range of target , which can be demonstrated as
where is the shortest slant range of target and the ideal moving velocity of SAR is denoted by v.
In the presence of phase error, the real echo can be viewed as an echo signal that is affected by phase error , which can be expressed as
Then, after the range Fast Fourier Transform (FFT) process of , the real echo at range-frequency domain can be expressed as
To eliminate invalid azimuth data, the basic step is to set these invalid data to zero [46]. Therefore, the zero-padding echo can be obtained by
where is the azimuth missing matrix; that is,
represents the number of complete azimuth samples, and
stands for the position set of the azimuth valid samples. Accordingly, the number of complete range samples is presented by , and assume that the total number of the azimuth valid samples equals ().
If all invalid data of are removed, a small-size PE-AMD echo is acquired as
where stands for a deformed identity matrix, which is
where and ∅ represent the identity matrix and empty set, respectively. Obviously, the two-dimensional size of , , and are equal to , , and , respectively.
3. Analysis of Phase Error Effect on Complete Echo Reconstruction
According to the phase history of scene center point , the 1st-PCF can be designed based on Ref. [32], that is
where represents the instantaneous slant range of . Similarly, an AMD 1st-PCF corresponding to can be calculated using Equations (5) and (8). Thus, 1st PC AMD echo signal is obtained by
Obviously, when there is no phase error in the SAR echo, the above Equation (11) is written as
According to the former research, such as [32,37,46], they are trying to reconstruct the first PC complete signal from using CS method. This process can be demonstrated as follows:
where is a threshold parameter and denotes the AMD sensing matrix, which is obtained based on the azimuth inverse Fourier transform matrix ,
Additionally, the waiting-reconstruction coarse-focused signal can be illustrated as
However, due to the influence of unknown phase errors, the State-Of-the-Art (SOA) AMDIA actually reconstructs instead of . Therefore, compared with Equation (13), the problem we actually face is:
Obviously, phase errors will lead to a serious degradation in the focus performance and sparsity of . Therefore, the reconstruction precision of the complete echo will be significantly reduced using CS method. In order to obtain an accurate reconstruction of the complete aperture, the sparsity of should be enhanced.
4. Proposed Sparse Representation Autofocusing Azimuth Missing Data Imaging Algorithm
The procedures of the proposed SRA-AMDIA can be divided into three steps. They are sparse representation signal autofocusing, complete echo reconstruction, and SAR imaging.
4.1. Sparse Representation Signal Autofocusing
Firstly, in order to clearly demonstrate the focusing performance difference of the first PC AMD signal before and after being affected by phase error, we assume that there are five symmetrical targets in the scene and illustrate the corresponding and , as shown in Figure 1a and Figure 1b, respectively.
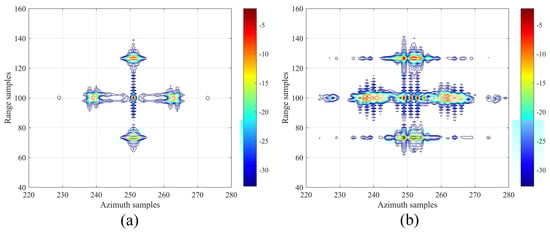
Figure 1.
(a) The sparse representation signal obtained by Non-PE echo. (b) The sparse representation signal obtained by PE echo.
Observing Figure 1a, the central target can be precisely focused in the range-Doppler domain, while other targets can be coarse-focused. The sparsity of is satisfied. However, when residual phase error exists, the focusing performance of is severely affected. Compared to Figure 1a, the sparsity of Figure 1b significantly decreases. Therefore, in order to obtain a high reconstruction accuracy of the complete echo, an MEA-based ISAR autofocusing imaging algorithm is introduced to enhance the focusing performance of [43]. This step can be expressed as
where is an autofocusing 1st PC AMD signal. denotes the -th element of phase error vector . Then, the IE of is set as an objection function, which can be illustrated as
where W stands for the total energy of the image. According to Parseval theorem, W remains unchanged before and after the Fourier transform. Thus, it can be neglected, and Equation (18) is further simplified as
Subsequently, the main purpose is to calculate the phase error corresponding to the minimum IE, namely
The above equation can be solved using the Newton method [43]. Meanwhile, a step-size parameter is utilized to accelerate the iteration process. The l-th update of can be presented as
where the first-order derivative and second-order derivative are expressed as
and
respectively. denotes the number of azimuth frequency samples and * represents the conjugate operation. The l-th iteration of is defined as
Next, the termination condition for an iteration of Equation (21) is set as follows,
where is the threshold of iteration termination. After the autofocusing process is complete, we can take the multiplication of obtained from each iteration to receive an effective estimation of the phase error , which can be presented as
Then, the residual phase error of can be compensated by the 2nd-PCF . The second PC AMD echo signal can be expressed as
In order to demonstrate the focus performance of the proposed sparse representation signal autofocusing method, the contour of is shown in Figure 2a.
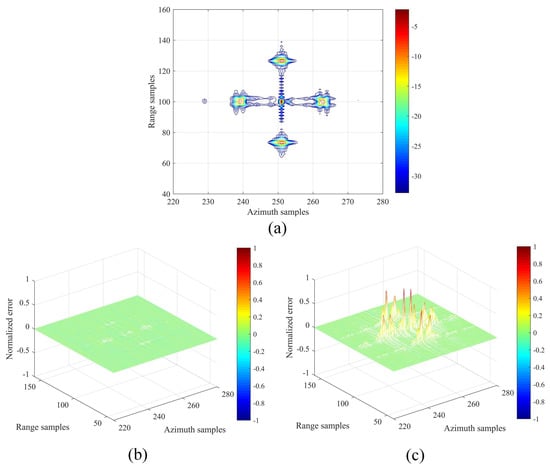
Figure 2.
(a) The sparse representation signal obtained by sparse representation autofocusing with PE echo. (b) Normalized error between and . (c) Normalized error between and .
The focus performance is almost identical to the Figure 1a. Moreover, the normalized errors between the and , and the and are calculated to evaluate the autofocusing performance. The results are illustrated in Figure 2b and Figure 2c, respectively. This implies that the sparse presentation signal autofocusing method can effectively eliminate the residual phase error of , and obtain an identical focus performance of the Non-PE AMD signal . Therefore, the defocusing effect caused by phase error has been eliminated using the sparse representation signal autofocusing. The accuracy of the reconstructed complete echo is reliable.
4.2. Complete Echo Reconstruction and Imaging
The second PC AMD signal is obtained. Thus, compared with Equation (13), the more reliable complete echo reconstruction process is improved as follows:
where denotes the twice phase-compensated complete echo, which is also the waiting-recovered signal. To avoid the influence of reconstruction errors from different CS methods, we utilized the GOMP [47] algorithm used in [32,36,37,46] to reconstruct . Since the GOMP algorithm is a one-dimensional processing algorithm, the reconstruction of should be divided into row vectors and recovered individually. and represent the t-th row vectors of and , respectively, where . The detailed steps of the GOMP algorithm are introduced in Table 1 or [47].

Table 1.
The specific steps for the GOMP algorithm based on .
When the reconstruction of is realized, it is necessary to multiply it with the conjugate of 1st-PCF in the range-frequency domain to remove the effects caused by the previous coarse-focused step. This process can be expressed as
Hence, the accuracy estimated complete echo is obtained. There is no phase error in since the unknown phase error is eliminated before signal reconstruction. Finally, a high-resolution focusing result can be obtained in the PE-AMD echo case using the traditional SAR imaging algorithm with . The flow chart of the proposed SRA-AMDIA is illustrated in Figure 3.

Figure 3.
Flow chart of the proposed SRA-AMDIA.
5. Experiment Results and Analysis
To verify the effectiveness of the proposed SRA-AMDIA, we designed multiple sets of simulation experiments. Firstly, we compared the imaging performance of the proposed SRA-AMDIA with the SOA-AMDIA based on a 50% periodic and a 50% random PE-AMD signal. Secondly, we explored the Azimuth Missing Ratio (AMR) application boundary of the proposed algorithm and investigated its imaging performance under multiple different AMR conditions. Finally, we added a phase error to real measured data based on a sparse scene prior and validated the effectiveness of the proposed algorithm on the basis of the measured data.
5.1. Imaging Performance Analysis of Different Phase Error Models
Considering the frequent start–stop issue of the intermittent SAR system during operation, we designed a periodic PE-AMD signal in the first simulation. The relevant simulation parameters are demonstrated in Table 2.
Table 2.
Key parameters for simulation.
We assume that the SAR system needs to be turned off for a period of time every 50 samples, resulting in 50 missing azimuth samples. Therefore, the SAR system actually acquires a 50% periodic AMD echo. There are five symmetric point targets set in the scene, which are labeled from Target 1 to Target 5, as shown in Figure 4a. The imaging result obtained by classical Range Doppler Algorithm (RDA) for the Non-PE complete echo is shown in Figure 4b. This can be abbreviated as the RDA Non-PE complete echo result for the sake of convenience.
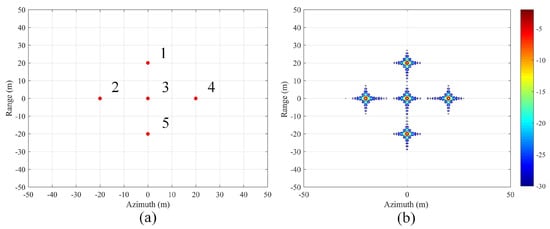
Figure 4.
(a) Geometric arrangement of the simulations. Target 1 to Target 5 are labeled. (b) The imaging result obtained by RDA for the non-PE complete echo.
Then, we designed three different range-invariant phase error models, namely, the Sine function PE (S-PE) model, the Random PE (R-PE) model, and the Linear PE (L-PE) model, as shown in Figure 5a–c. The imaging results obtained by RDA for the S-PE, R-PE, and L-PE complete echo are illustrated in Figure 5d–f. It can be observed that the unknown phase errors lead to significant defocusing of the point targets in the image results.
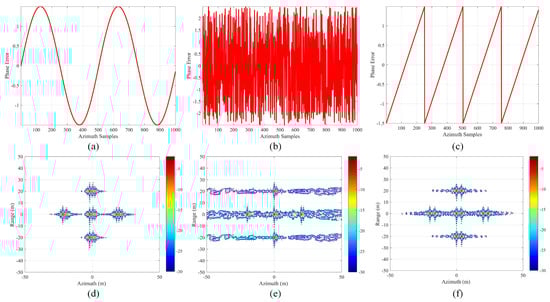
Figure 5.
(a) S-PE model. (b) R-PE model. (c) L-PE model. (d) The imaging results obtained by RDA for the S-PE complete echo. (e) The imaging results obtained by RDA for the R-PE complete echo. (f) The imaging results obtained by RDA for the L-PE complete echo.
To verify the effectiveness of the proposed SRA-AMDIA in the periodic PE-AMD echo case, the following Figure 6 demonstrates the imaging results obtained by four different algorithms for three different PE models’ echo. Specifically, Figure 6a–c show the results obtained by imaging 50% periodic S-PE-AMD, R-PE-AMD, and L-PE-AMD echo directly using RDA, which can be named the RDA S-PE-AMD echo result, RDA R-PE-AMD echo result, and RDA L-PE-AMD echo result, respectively, for the sake of convenience. Figure 6d–f show the results obtained by SOA-AMDIA with the 50% periodic PE-AMD echoes, which are the SOA-AMDIA S-PE-AMD echo result, SOA-AMDIA R-PE-AMD echo result, and SOA-AMDIA L-PE-AMD echo result, respectively. Figure 6g–i illustrate the results obtained after autofocusing based on Figure 6d–f, which can be abbreviated as the SOA-AMDIA+Autofocusing PE-AMD echo results. Figure 6j–l demonstrate the results obtained by proposed SRA-AMDIA with the 50% periodic PE-AMD echoes. These stand for the SRA-AMDIA S-PE-AMD echo result, SRA-AMDIA R-PE-AMD echo result, and SRA-AMDIA L-PE-AMD echo result, respectively.
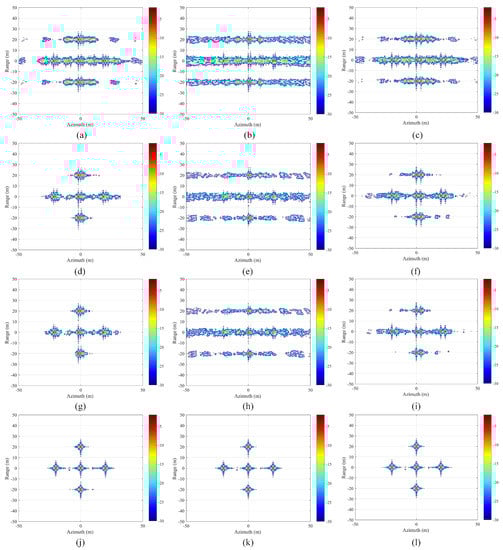
Figure 6.
(a) RDA 50% periodic S-PE-AMD echo result. (b) RDA 50% periodic R-PE-AMD echo result. (c) RDA 50% periodic L-PE-AMD echo result. (d) SOA-AMDIA 50% periodic S-PE-AMD echo result. (e) SOA-AMDIA 50% periodic R-PE-AMD echo result. (f) SOA-AMDIA 50% periodic L-PE-AMD echo result. (g) SOA-AMDIA+Autofocusing 50% periodic S-PE-AMD echo result. (h) SOA-AMDIA+Autofocusing 50% periodic R-PE-AMD echo result. (i) SOA-AMDIA+Autofocusing 50% periodic L-PE-AMD echo result. (j) Proposed SRA-AMDIA 50% periodic S-PE-AMD echo result. (k) Proposed SRA-AMDIA 50% periodic R-PE-AMD echo result. (l) Proposed SRA-AMDIA 50% periodic L-PE-AMD echo result.
Observing Figure 6, it can be seen that different phase error models have little impact on the imaging performance of different algorithms. Firstly due to the presence of PE-AMD in the echo signal, the RDA will significantly degrade the quality of the imaging results, leading to indistinguishable results, as shown in Figure 6a–c. When the SOA-AMDIA is utilized to reconstruct the complete echo signal, since the SOA-AMDIA does not consider the effect of phase errors on the sparse representation signal, a large estimation error is generated in the reconstructed complete echo. Therefore, the imaging results obtained by SOA-AMDIA are still not as ideal as expected, as shown in Figure 6d–f. Moreover, after further autofocusing of the imaging results obtained by SOA-AMDIA, Figure 6g–i can be obtained when the iterative convergence condition is reached. Compared with Figure 6d–f, although the focusing effect of Figure 6g–i is slightly improved, the imaging results still cannot meet the requirements for SAR imaging. On the other hand, the proposed SRA-AMDIA can achieve excellent imaging results under any phase error model, as shown in Figure 6j–l. Its imaging performance is far superior to other imaging algorithms under any phase error condition. Compared with the RDA Non-PE complete echo result shown in Figure 5b, the imaging performances of all SRA-AMDIA PE-AMD echo results are almost the same.
In order to quantitatively evaluate the focusing performance of the imaging results obtained by different imaging algorithms, we calculated the azimuth Impulse Response Width (IRW) and Peak Side Lobe Ratio (PSLR) of Target 3 in the above imaging results, and conducted a comparative analysis. The specific numerical results are summarized in Table 3.
Table 3.
Target imaging performance parameters in the 50% periodic PE-AMD situations.
Observing Table 3, it can be found that regardless of the PE-AMD RDA results, the SOA-AMDIA results, or the SOA-AMDIA+Autofocusing results, the azimuth IRW corresponding to Target 3 is better than the RDA Non-PE complete echo result of 0.95 m. The reason for this is that the lack of azimuth data or incorrect reconstruction causes the energy of the main lobe to spread to the side lobes, resulting in a decrease in the width of the main lobe. Therefore, the optimal corresponding azimuth PSLR is only −6.51 dB, and the worst result will reach −0.57 dB, which is far higher than the −13.08 dB. Obviously, this imaging performance for point targets is completely unacceptable. On the other hand, the proposed SRA-AMDIA can achieve a comparable imaging performance to the RDA Non-PE complete echo result under any phase error model. The azimuth IRW and PSLR of Target 3 are almost the identical to the latter.
Moreover, after evaluating the imaging performance of a single target, we attempted to evaluate the overall imaging performance of the imaging results. The IE and Image Contrast (IC) values were calculated for each imaging result in Figure 5 and Figure 6. They are summarized in Table 4.
Table 4.
IE and IC values of different imaging results in the 50% periodic PE-AMD situations.
Compared with the processing free, the use of SOA-AMDIA can enhance the image focusing performance to some extent. The IE values of SOA-AMDIA S-PE-AMD result, SOA-AMDIA R-PE-AMD result, and SOA-AMDIA L-PE-AMD result are 1.37, 1.96, and 1.49, respectively, which are 0.40, 0.38, and 0.34 larger than the corresponding RDA PE-AMD echo results. Furthermore, the IC values are 21.37, 15.95, and 18.30, respectively, which is still lower than the ideal result of an IC . Autofocusing based on SOA-AMDIA can also improve the image focusing performance to some extent, but this is very limited. The final IE results obtained under different PE models can only reach 1.31, 1.88, and 1.37, which is still larger than the IE of RDA Non-PE complete echo results. On the other hand, using the proposed SRA-AMDIA can significantly enhance the image focusing performance under any phase error model. The IE and IC values of all results are 1.18 and 23.29, respectively, which are identical to the RDA Non-PE complete echo result. Therefore, the effectiveness of the proposed SRA-AMDIA has been significantly verified in the case of periodic PE-AMD.
5.2. Imaging Performance Analysis of Different Azimuth Missing Types
Similarly, as a more general case, we designed a random PE-AMD echo signal for the problem of an SAR system being subjected to strong electromagnetic interference at random positions. Specifically, we assume that the SAR system is randomly subjected to 50 instances of strong electromagnetic interference during data acquisition, each of which will cause 1% azimuth samples to be invalid. Therefore, the SAR system actually acquires a random AMD signal with a total signal loss rate of 50%. Since the previous subsection has analyzed the robustness of the proposed algorithm to different PE models, this section only assumes the PE model to be an S-PE model. With other simulation conditions unchanged, the following Figure 7 is obtained.
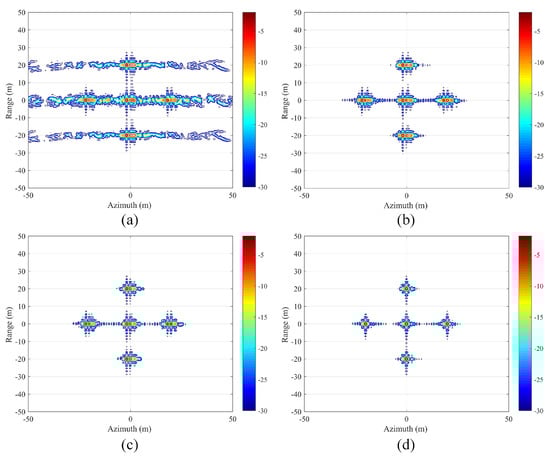
Figure 7.
(a) RDA 50% random PE-AMD echo result. (b) SOA-AMDIA 50% random PE-AMD echo result. (c) SOA-AMDIA+Autofocusing 50% random PE-AMD echo result. (d) Proposed SRA-AMDIA 50% random PE-AMD echo result.
It can be observed that, under the condition of random PE-AMD echo, the proposed SRA-AMDIA can still achieve a comparable imaging result to the RDA Non-PE complete echo result, as illustrated in Figure 7d. Similarly, the SOA-AMDIA and SOA-AMDIA+Autofocusing methods shown in Figure 7b,c cannot obtain an ideal result.
Similarly, we analyzed the imaging performance of Target 3 and obtained its corresponding azimuth IRW and PSLR results under different imaging algorithms, as shown in Table 5.
Table 5.
Target imaging performance parameters in the 50% random PE-AMD situation.
An identical conclusion can be obtained. RDA for the PE-AMD echo, SOA-AMDIA, and SOA-AMDIA+Autofocusing cannot achieve satisfactory point target imaging performance in the case of random missing PE-AMD echo. Their azimuth PSLR results are equal to −3.88 dB, −3.50 dB, and −2.21 dB, respectively. This indicates that there is significant side lobe interference in the imaging results, which is not conducive to the correct discrimination of image information. However, the proposed SRA-AMDIA still has a significant imaging advantage in the case of random missing PE-AMD echo, ensuring that the azimuth IRW and PSLR of Target 3 reach 0.95 m and −11.30 dB. Moreover, in order to evaluate the imaging performance for the entire imaging scene, we calculated and summarized the IE and IC values of Figure 7 into Table 6. In the case of random missing PE-AMD echo, the proposed SRA-AMDIA can still achieve the best imaging focus performance, with IE and IC . Both indicators are identical to the ideal results, far better than the IE and IC corresponding to SOA-AMDIA and the IE and IC corresponding to SOA-AMDIA+Autofocusing. Thus, the effectiveness of the proposed SOA-AMDIA in the more general case of random PE-AMD is also verified.
Table 6.
The IE and IC values of different imaging results in the 50% random PE-AMD situation.
5.3. Imaging Performance Analysis of Different Azimuth Missing Ratios
To further investigate the impact of different AMRs on the imaging performance of the proposed SRA-AMDIA, we set a series of different AMRs to explore the imaging effectiveness of the proposed SRA-AMDIA in the presence of PE-AMD. Specifically, we set the AMR to 55%, 60%, 65%, 70%, 75%, 80%, 85%, 90%, and 95% using the random missing rule mentioned above. The imaging results are demonstrated in the following Figure 8.
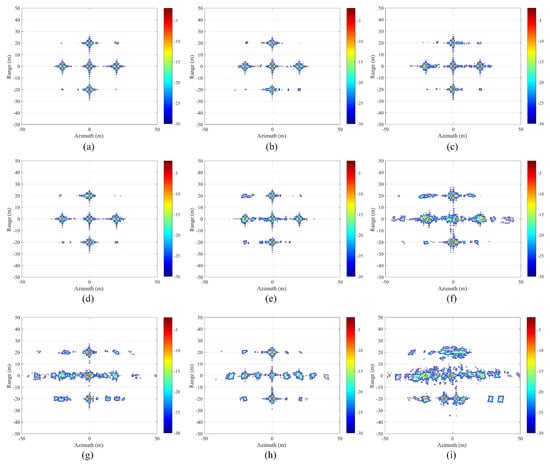
Figure 8.
Proposed SRA-AMDIA PE-AMD results when (a) AMR ; (b) AMR ; (c) AMR ; (d) AMR ; (e) AMR ; (f) AMR ; (g) AMR ; (h) AMR ; (i) AMR .
Observing Figure 8, as the AMR increases, the imaging performance of the proposed SRA-AMDIA gradually decreases. Especially when the AMR , the imaging performance of the proposed SRA-AMDIA is severely degraded. In the final imaging results, whether it is severe azimuth defocusing as shown in Figure 8f,i or false targets as shown in Figure 8g,h, they are all caused by the estimation error between the estimated complete echo and the true complete echo under the influence of phase errors. However, when AMR , the individual point targets in the scene can be well-focused. Although some side-lobes interference may appear in non-target areas, these side-lobes are mostly below -25dB, so they do not have a significant impact on the image discrimination. Therefore, the proposed SRA-AMDIA can achieve an excellent imaging performance when AMR . This AMR threshold can already handle most missing data situations. The impact of different AMRs on the imaging performance of the proposed SRA-AMDIA has been analyzed.
5.4. Real Measured Data Verification
To verify the effectiveness of the proposed SRA-AMDIA in real measured data, a measured 77GHz MilliMeterWave (MMW) SAR experiment is carried out. The relevant experimental parameters are demonstrated in Table 7.
Table 7.
The key parameters for MMW-SAR experiment.
The layout of the equipment and targets is shown in Figure 9a and Figure 9b, respectively. The MMW radar was placed on a pair of tables with a height of 1.4 m, and moved at a constant speed of 2.13 cm/s on a track to form a 1.57 m synthetic aperture and receive two-dimensional echo data. The size of the complete echo equals (Azimuth Samples × Range Samples). The complete number of samples in the range and azimuth directions was 1024 and 1960, respectively. Five triangular reflectors were placed in the scene as sparse targets. Their two-dimensional coordinates were Target 1 (), Target 2 (), Target 3 (), Target 4 (), and Target 5 (). Using RDA imaging directly on the complete echo data, the imaging result shown in Figure 9c can be obtained. We also added a phase error with a sine function model to the measured echo to obtain a PE complete echo. The PE-AMD echo with an AMR of 50% was generated by sampling every 40 azimuth samples. Therefore, the size of the PE-AMD echo is equal to .
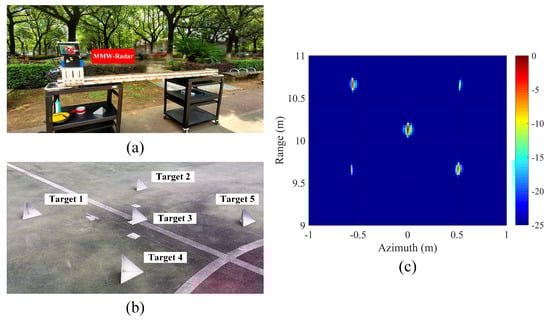
Figure 9.
(a) Layout of the experimental equipment. (b) Layout of the targets. (c) RDA imaging result of the MMW-SAR experiment.
First, the RDA was exploited to image the PE complete echo and to observe the impact of phase errors on classical imaging algorithms. The imaging result is illustrated in Figure 10a. Then, various different algorithms were utilized to image the measured PE-AMD echo, and the imaging results are shown in Figure 10b–d.

Figure 10.
(a) RDA Measured PE Complete Echo Result. (b) RDA Measured PE-AMD Echo Result. (c) SOA-AMDIA Measured PE-AMD Echo Result. (d) Proposed SRA-AMDIA Measured PE-AMD Echo Result.
Observing Figure 10a, we find that an unknown phase error will cause significant defocusing of the imaging result compared to Figure 9c. On this basis, if there is also a lack of azimuth data, the use of classical imaging algorithms will lead to a drastic drop in the final imaging performance, as demonstrated in Figure 10b. The true information of the imaging scene is unable to discern from the imaging results. Furthermore, compared to simulated data, the shortcomings of SOA-AMDIA are more pronounced in measured data. The SOA-AMDIA result not only fails to recover the RDA PE complete result, but also exhibits more obvious defocusing, significantly reducing the authenticity of the image, as shown in Figure 10c. However, using the proposed SRA-AMDIA still achieves the best imaging performance in measured data. The five targets in Figure 10d can be clearly displayed, and its imaging performance improvement under PE-AMD conditions is significant compared to SOA-AMDIA.
The IE results of the above figures are also calculated. The identical conclusion can be obtained by observing Table 8. When using RDA for the direct imaging of the measured PE-AMD echo, the worst imaging performance was obtained, with an IE of only 2.29. Meanwhile, the SOA-AMDIA cannot image the ideal imaging results, and the imaging performance is even worse than the RDA measured PE complete echo result. However, using the proposed SRA-AMDIA, an almot identical focusing performance to the ideal imaging result can be obtained under PE-AMD conditions. The IE value difference is only 0.05, reaching . Therefore, the effectiveness of SRA-AMDIA in measured data has also been verified.
Table 8.
The IE results of different imaging results in the measured PE-AMD situation.
6. Conclusions
In this paper, we proposed an SRA-AMDIA to solve the problems in PE-AMD SAR imaging. Both simulation and experimental data verified the effectiveness of the proposed algorithm. By observing the simulation and experimental results, we found that since the SOA-AMDIA did not consider the influence of unknown phase errors, resulting in a large aperture estimation error in the reconstructed complete echo. Therefore, in the case of PE-AMD echo, the SOA-AMDIA not only cannot obtain accurate imaging results but also cannot obtain an identical focusing performance to the RDA PE complete echo result. The coexistence of aperture estimation errors and unknown phase errors also poses greater difficulties for autofocusing, leading to the SOA-AMDIA+Autofocusing processing method being unable to achieve satisfactory focusing performance. However, the proposed algorithm introduces the MEA to eliminate unknown phase errors before the reconstruction of the complete echo, allowing for it to obtain excellent imaging results in the PE-AMD echo situation. Through a quantitative analysis of the SRA-AMDIA results, it can almost achieve the same focusing performance as the RDA Non-PE complete echo result, with all targets being clearly displayed. Furthermore, by adjusting different AMRs, the SRA-AMDIA can achieve ideal imaging results when AMR . This indicates that the proposed SRA-AMDIA can cope with most adverse echo conditions. The practical applicability of SOA-AMDIA has been significantly expanded.
Author Contributions
Conceptualization: N.J., J.Z., D.F. and J.W.; Methodology: N.J., H.D. and S.G.; Software: N.J., H.D. and S.G.; Validation: N.J. and J.W.; Writing: N.J. and D.F.; Editing and Supervision: J.Z., D.F., J.W. and X.H. All authors have read and agreed to the published version of the manuscript.
Funding
This research was funded by National Natural Science Foundation of China grant number 62101562.
Data Availability Statement
Not applicable.
Conflicts of Interest
The authors declare no conflict of interest.
References
- Brown, W.M. Synthetic aperture radar. IEEE Trans. Aerosp. Electron. Syst. 1967, AES-3, 217–229. [Google Scholar] [CrossRef]
- Perry, R.; Dipietro, R.; Fante, R. SAR imaging of moving targets. IEEE Trans. Aerosp. Electron. Syst. 1999, 35, 188–200. [Google Scholar] [CrossRef]
- Krieger, G. MIMO-SAR: Opportunities and pitfalls. IEEE Trans. Geosci. Remote Sens. 2013, 52, 2628–2645. [Google Scholar] [CrossRef]
- Feng, D.; An, D.; Chen, L.; Huang, X. Holographic SAR tomography 3-D reconstruction based on iterative adaptive approach and generalized likelihood ratio test. IEEE Trans. Geosci. Remote Sens. 2020, 59, 305–315. [Google Scholar] [CrossRef]
- Zhang, X.; Wu, H.; Sun, H.; Ying, W. Multireceiver SAS imagery based on monostatic conversion. IEEE J. Sel. Top. Appl. Earth Obs. Remote Sens. 2021, 14, 10835–10853. [Google Scholar] [CrossRef]
- Zhu, X.X.; Montazeri, S.; Ali, M.; Hua, Y.; Wang, Y.; Mou, L.; Shi, Y.; Xu, F.; Bamler, R. Deep learning meets SAR: Concepts, models, pitfalls, and perspectives. IEEE Geosci. Remote Sens. Mag. 2021, 9, 143–172. [Google Scholar] [CrossRef]
- Chen, J.; Xing, M.; Yu, H.; Liang, B.; Peng, J.; Sun, G.C. Motion compensation/autofocus in airborne synthetic aperture radar: A review. IEEE Geosci. Remote Sens. Mag. 2021, 10, 185–206. [Google Scholar] [CrossRef]
- Xie, Z.; Xu, Z.; Fan, C.; Han, S.; Huang, X. Robust Radar Waveform Optimization Under Target Interpulse Fluctuation and Practical Constraints Via Sequential Lagrange Dual Approximation. IEEE Trans. Aerosp. Electron. Syst. 2023. [Google Scholar] [CrossRef]
- Wu, J.; Li, Y.; Pu, W.; Li, Z.; Yang, J. An effective autofocus method for fast factorized back-projection. IEEE Trans. Geosci. Remote Sens. 2019, 57, 6145–6154. [Google Scholar] [CrossRef]
- Huang, Y.; Liu, F.; Chen, Z.; Li, J.; Hong, W. An improved map-drift algorithm for unmanned aerial vehicle SAR imaging. IEEE Geosci. Remote Sens. Lett. 2020, 18, 1–5. [Google Scholar] [CrossRef]
- Ding, Z.; Zhu, K.; Zhang, T.; Li, L.; Wang, Y.; Wang, G.; Gao, Y.; Wei, Y.; Zeng, T. An autofocus back projection algorithm for GEO SAR based on minimum entropy. IEEE Trans. Geosci. Remote Sens. 2022, 60, 5226114. [Google Scholar] [CrossRef]
- Meng, Z.; Zhang, L.; Li, J.; Lu, J.; Li, Y. Time-Domain Azimuth-Variant MOCO Algorithm for Airborne SAR Imaging. IEEE Geosci. Remote Sens. Lett. 2022, 19, 4508605. [Google Scholar] [CrossRef]
- Adorf, H.M. Interpolation of Irregularly Sampled Data Series—A Survey. Astron. Data Anal. Softw. Syst. 1995, 77, 460. [Google Scholar]
- Salzman, J.; Akamine, D.; Lefevre, R.; Kirk, J.C. Interrupted synthetic aperture radar (SAR). IEEE Aerosp. Electron. Syst. Mag. 2002, 17, 33–39. [Google Scholar] [CrossRef]
- Xu, G.; Zhang, B.; Yu, H.; Chen, J.; Xing, M.; Hong, W. Sparse synthetic aperture radar imaging from compressed sensing and machine learning: Theories, applications, and trends. IEEE Geosci. Remote Sens. Mag. 2022, 10, 32–69. [Google Scholar] [CrossRef]
- Jiang, N.; Feng, D.; Wang, J.; Huang, X. Missing data SAR imaging algorithm based on two dimensional frequency domain recovery. In Proceedings of the IGARSS 2022-2022 IEEE International Geoscience and Remote Sensing Symposium, Kuala Lumpur, Malaysia, 17–22 July 2022; pp. 2490–2493. [Google Scholar]
- Li, J.; Stoica, P. An adaptive filtering approach to spectral estimation and SAR imaging. IEEE Trans. Signal Process. 1996, 44, 1469–1484. [Google Scholar] [CrossRef]
- Stoica, P.; Larsson, E.G.; Li, J. Adaptive filter-bank approach to restoration and spectral analysis of gapped data. Astron. J. 2000, 120, 2163. [Google Scholar] [CrossRef]
- Larsson, E.G.; Stoica, P.; Li, J. Amplitude spectrum estimation for two-dimensional gapped data. IEEE Trans. Signal Process. 2002, 50, 1343–1354. [Google Scholar] [CrossRef]
- Wang, Y.; Stoica, P.; Li, J.; Marzetta, T.L. Nonparametric spectral analysis with missing data via the EM algorithm. Digit. Signal Process. 2005, 15, 191–206. [Google Scholar] [CrossRef]
- Stoica, P.; Li, J.; Ling, J.; Cheng, Y. Missing data recovery via a nonparametric iterative adaptive approach. In Proceedings of the 2009 IEEE International Conference on Acoustics, Speech and Signal Processing, Taipei, Taiwan, 19–24 April 2009; pp. 3369–3372. [Google Scholar]
- Donoho, D.L. Compressed sensing. IEEE Trans. Inf. Theory 2006, 52, 1289–1306. [Google Scholar] [CrossRef]
- Candès, E.J.; Romberg, J.; Tao, T. Robust uncertainty principles: Exact signal reconstruction from highly incomplete frequency information. IEEE Trans. Inf. Theory 2006, 52, 489–509. [Google Scholar] [CrossRef]
- Wei, S.J.; Zhang, X.L.; Shi, J.; Xiang, G. Sparse reconstruction for SAR imaging based on compressed sensing. Prog. Electromagn. Res. 2010, 109, 63–81. [Google Scholar] [CrossRef]
- Yang, J.; Thompson, J.; Huang, X.; Jin, T.; Zhou, Z. Random-frequency SAR imaging based on compressed sensing. IEEE Trans. Geosci. Remote Sens. 2012, 51, 983–994. [Google Scholar] [CrossRef]
- Bi, H.; Bi, G.; Zhang, B.; Hong, W.; Wu, Y. From theory to application: Real-time sparse SAR imaging. IEEE Trans. Geosci. Remote Sens. 2019, 58, 2928–2936. [Google Scholar] [CrossRef]
- Onhon, N.Ö.; Cetin, M. A sparsity-driven approach for joint SAR imaging and phase error correction. IEEE Trans. Image Process. 2011, 21, 2075–2088. [Google Scholar] [CrossRef] [PubMed]
- Yang, J.; Huang, X.; Thompson, J.; Jin, T.; Zhou, Z. Compressed sensing radar imaging with compensation of observation position error. IEEE Trans. Geosci. Remote Sens. 2013, 52, 4608–4620. [Google Scholar] [CrossRef]
- Pu, W. Deep SAR imaging and motion compensation. IEEE Trans. Image Process. 2021, 30, 2232–2247. [Google Scholar] [CrossRef]
- Yang, J.; Thompson, J.; Huang, X.; Jin, T.; Zhou, Z. Segmented reconstruction for compressed sensing SAR imaging. IEEE Trans. Geosci. Remote Sens. 2013, 51, 4214–4225. [Google Scholar] [CrossRef]
- Sun, S.; Zhu, G.; Jin, T. Novel methods to accelerate CS radar imaging by NUFFT. IEEE Trans. Geosci. Remote Sens. 2014, 53, 557–566. [Google Scholar]
- Qian, Y.; Zhu, D. High-resolution SAR imaging from azimuth periodically gapped raw data via generalised orthogonal matching pursuit. Electron. Lett. 2018, 54, 1235–1237. [Google Scholar] [CrossRef]
- Liu, K.; Yu, W.; Lv, J. Azimuth interrupted FMCW SAR for high-resolution imaging. IEEE Geosci. Remote Sens. Lett. 2020, 19, 4001105. [Google Scholar] [CrossRef]
- Liu, K.; Yu, W.; Lv, J.; Tang, Z. Parameter Design and Imaging Method of Spaceborne Azimuth Interrupted FMCW SAR. IEEE Geosci. Remote Sens. Lett. 2021, 19, 4015505. [Google Scholar] [CrossRef]
- Wu, J.; Feng, D.; Wang, J.; Huang, X. SAR Imaging from Azimuth Missing Raw Data via Sparsity Adaptive StOMP. IEEE Geosci. Remote Sens. Lett. 2021, 19, 4501605. [Google Scholar] [CrossRef]
- Jiang, N.; Xin, Q.; Zhu, J.; Feng, D.; Wang, J.; Huang, X. Enhancement synthetic aperture imaging algorithm with azimuth missing data. Electron. Lett. 2023, 59, e12729. [Google Scholar] [CrossRef]
- Jiang, N.; Zhu, J.; Feng, D.; Xie, Z.; Wang, J.; Huang, X. High-Resolution SAR Imaging with Azimuth Missing Data Based on Sub-Echo Segmentation and Reconstruction. Remote Sens. 2023, 15, 2428. [Google Scholar] [CrossRef]
- Jiang, N.; Feng, D.; Wang, J.; Zhu, J.; Huang, X. Along-track Swarm SAR: Echo Modeling and Sub-aperture Collaboration Imaging based on Sparse Constraints. IEEE J. Sel. Top. Appl. Earth Obs. Remote Sens. 2023, 16, 5602–5617. [Google Scholar] [CrossRef]
- Zhu, D.; Jiang, R.; Mao, X.; Zhu, Z. Multi-subaperture PGA for SAR autofocusing. IEEE Trans. Aerosp. Electron. Syst. 2013, 49, 468–488. [Google Scholar] [CrossRef]
- Zeng, H.; Yang, W.; Wang, P.; Chen, J. A modified PGA for spaceborne SAR scintillation compensation based on the weighted maximum likelihood estimator and data division. IEEE J. Sel. Top. Appl. Earth Obs. Remote Sens. 2022, 15, 3938–3947. [Google Scholar] [CrossRef]
- Tang, Y.; Zhang, B.; Xing, M.; Bao, Z.; Guo, L. The space-variant phase-error matching map-drift algorithm for highly squinted SAR. IEEE Geosci. Remote Sens. Lett. 2012, 10, 845–849. [Google Scholar] [CrossRef]
- Berizzi, F.; Corsini, G. Autofocusing of inverse synthetic aperture radar images using contrast optimization. IEEE Trans. Aerosp. Electron. Syst. 1996, 32, 1185–1191. [Google Scholar] [CrossRef]
- Zhang, S.; Liu, Y.; Li, X. Fast entropy minimization based autofocusing technique for ISAR imaging. IEEE Trans. Signal Process. 2015, 63, 3425–3434. [Google Scholar] [CrossRef]
- Zeng, T.; Wang, R.; Li, F. SAR image autofocus utilizing minimum-entropy criterion. IEEE Geosci. Remote Sens. Lett. 2013, 10, 1552–1556. [Google Scholar] [CrossRef]
- Morrison, R.L.; Do, M.N.; Munson, D.C. SAR image autofocus by sharpness optimization: A theoretical study. IEEE Trans. Image Process. 2007, 16, 2309–2321. [Google Scholar] [CrossRef] [PubMed]
- Jiang, N.; Wang, J.; Feng, D.; Kang, N.; Huang, X. SAR imaging method for moving target with azimuth missing data. IEEE J. Sel. Top. Appl. Earth Obs. Remote Sens. 2022, 15, 7100–7113. [Google Scholar] [CrossRef]
- Wang, J.; Kwon, S.; Shim, B. Generalized orthogonal matching pursuit. IEEE Trans. Signal Process. 2012, 60, 6202–6216. [Google Scholar] [CrossRef]
Disclaimer/Publisher’s Note: The statements, opinions and data contained in all publications are solely those of the individual author(s) and contributor(s) and not of MDPI and/or the editor(s). MDPI and/or the editor(s) disclaim responsibility for any injury to people or property resulting from any ideas, methods, instructions or products referred to in the content. |
© 2023 by the authors. Licensee MDPI, Basel, Switzerland. This article is an open access article distributed under the terms and conditions of the Creative Commons Attribution (CC BY) license (https://creativecommons.org/licenses/by/4.0/).