Article

Predicting the Optimum Corn Harvest Time via the Quantity of Dry Matter Determined with Vegetation Indices Obtained from Multispectral Field Imaging

1
Faculty of Electrical Engineering and Communication, Brno University of Technology, 61600 Brno, Czech Republic
2
NutriVet s.r.o., Vídeňská 1023, 69123 Pohořelice, Czech Republic
*
Author to whom correspondence should be addressed.
Remote Sens. 2023, 15(12), 3152; https://doi.org/10.3390/rs15123152
Submission received: 24 April 2023 / Revised: 7 June 2023 / Accepted: 14 June 2023 / Published: 16 June 2023
(This article belongs to the Special Issue Innovative UAV Applications)

Abstract

:
Estimating the optimum harvest time and yield embodies an essential food security factor. Vegetation indices have proven to be an effective tool for widescale in-field plant health mapping. A drone-based multispectral camera then conveniently allows acquiring data on the condition of the plant. This article examines and discusses the relationships between vegetation indices and nutritiolnal values that have been determined via chemical analysis of plant samples collected in the field. In this context, emphasis is placed on the normalized difference red edge index (NDRE), normalized difference vegetation index (NDVI), green normalized difference vegetation index (GNDVI), and nutritional values, such as those of dry matter. The relationships between the variables were correlated and described by means of regression models. This produced equations that are applicable for estimating the quantity of dry matter and thus determining the optimum corn harvest time. The obtained equations were validated on five different types of corn hybrids in fields within the South Moravian Region, Moravia, the Czech Republic.

1. Introduction

1.1. Remote Sensing

The remote sensing of the Earth’s surface has assumed a significant role in precision agriculture, and has maintained this position on a long-term basis. Imaging agricultural areas is enabled through satellites and hyperspectral or multispectral cameras [1]. These are employed not only in remote sensing, but also, for example, in detecting dying trees infested with pests [2], rotten or mechanically damaged fruit and vegetables [3], recognizing fecal pollution [4], establishing cold-induced deterioration of cucumbers [5], measuring fruit ripening [6], classifying wheat kernels infected with fungi [7], and many other applications [8,9]. Recently, the actual approach and associated methodologies have been developing substantially.
The research outlined herein exploits a previously published case study [1], thus building on, verifying, and markedly enhancing an already established correlation between plant nutritional values and vegetation indices. Importantly, our latest conclusions were formulated from data measured over three years, i.e., three harvest seasons, while the referenced article [1] presents and analyzes results obtained during one season only.
The total harvested crop biomass consists of whole corn plants. The basic indicator of plant phenophase is based on specifying the dry matter contents; these increase significantly as the crop matures. In corn, the dry matter characterizes the growth maturity level, and its volume influences the silage quality materially and procedurally [10]. The chemical composition of corn plants changes over the course of the growing period. Before the plant develops ears, its energy is concentrated mainly in the fiber, whose proportion varies between plants, depending on the actual harvest time. To ensure that the final corn silage product comprises not only fiber but also starch, the harvesting has to be performed at the wax maturity stage, namely, when the dry matter proportion values in the whole plant reach between 280 and 330 g/kg. In such cases, the milk line stage attains 2/3 of the corn grain. Another indicator of growth maturity is the ability to be ensiled, or, in other words, to generate fermentation acids that preserve the silage.
The harvesting time and the total amount of biomass have an essential impact on the character of the silage fermentation. The quality of the corn cultivation processes and the subsequent ensiling follows from the weather conditions in a particular year, the choice of a suitable hybrid with an appropriate FAO number to specify the earliness level, treatment, and character of sowing.
Corn samples are routinely collected at diverse locations in the field to allow the assessing of the condition and phenophase. When the milk line stage has been reached, the samples are submitted to a laboratory for chemical analysis to determine the dry matter content in both the grain and the whole plant. Depending on the degree to which the plant and the dry matter have developed, the harvesting time is set preliminarily, varying according to the planned target use for the corn, namely, milk production or methane generation at biogas facilities.
As the dry matter content embodies a major parameter for defining the optimum harvest time, it is important to establish whether more accurate data can be obtained on the average dry matter value within an entire, non-homogeneous field. This article proposes to solve the problem using an effective integration of different methods and technologies, involving a drone with a multispectral camera, image data analysis to acquire vegetation indices, and a chemical analysis of all samples collected in the field.

1.2. Field-Wide Image Data Capturing

Comprehensive data relating to the condition of a field and thus also the average content of dry matter are obtainable via one of two fundamental technologies, namely, satellite imagery or photogrammetry performed by using a multispectral or hyperspectral camera mounted on an aerial vehicle. Both of these approaches can be applied to predict the yield of agricultural crops.
Photogrammetric imaging with unmanned aerial vehicles (UAVs) utilizes different types of multispectral or hyperspectral cameras [11,12,13,14,15,16]. The problem of crop yield prediction from photogrammetric data acquired by UAVs has been addressed in the literature [11]. Our article expands on the previous research, presenting novel findings regarding the correlation between dry matter yield and vegetation indices.
The other of the two imaging options relies on satellites. Satellite imagery differs from the UAV-based method in the distance of the sensor from the area of interest. Satellites move at a constant altitude of no less than 400 km along orbits—either geostationary ones, which circle the Earth above the equator, or others. Importantly, the satellites with the latter type revolve around the Earth progressively over its entire surface, in a north–south direction.
Artificial satellites ensure regular imaging with long stability and repeatability over time, and these aspects embody the most significant advantage of the technique. By contrast, the main drawback rests in a lower image resolution, an issue that substantiates the use of drones in compiling high resolution maps. The satellites allow us to easily determine their time of passage over the area being monitored; such time, however, cannot be adjusted according to need or to suit the position of the area of interest, as the orbiting speed remains constant. Furthermore, obtaining high quality images depends on favorable weather incomparably more than in UAV reconnaissance; the process is vulnerable to constraining effects that include, for instance, cloud bands.
Satellites carry key sensors, such as multispectral and hyperspectral sensors, lidars, and RGB cameras. Access to the images is nevertheless often limited, requiring pre-paid services that provide an image database.
The largest number of satellites are operated by the US-based company Planet Labs within the PlanetScope, a system comprising 175 satellites that supply multispectral images with a spatial resolution of up to 3 m; the imaging is performed daily and covers the entire surface of the Earth. The processing utilizes raw data, applying atmospheric corrections and other relevant procedures, such as single-pixel classification [17,18].

1.3. Predicting Crop Yield

The prediction of crop yield via satellite imagery has been discussed in multiple research articles. In this context, for instance, the authors of study [19] focus on the optimum time to apply nitrogen chemicals to crops at a very early growth stage, investigating the actual timing together with measurement of the vegetation index NDVI and plant height as an indicator of dry matter output; however, despite this comprehensive approach, only relative values over two years are provided.
Article [20] examines regression models for crop yield estimation via the NDVI index and measurement of the relative crop output (paddy rice, winter wheat, and corn). The authors identify the best period for estimating the crop yield reliably, characterizing the model that showed a root mean square error of 206.59 kg/ha in corn as the best fit. The models perform reasonably well in small regions, especially in areas where the crop types are not exactly known.
In study [21], the NDVI was found to deliver an excellent rate of correlation with yield values, albeit with a delay of 4–6 weeks, in grass used for biomass. In corn, the yield value correlates with the NDVI with a delay of two weeks.
Measurements that rely on spectroradiometric equipment, where the active radiation source for an NDVI measurement is active, show strong correlations between the NDVI and durum wheat genotypes. A related article [22] nevertheless also suggests that the measuring procedures may markedly depend on the spectrometer used, mainly as regards their overall suitability for the purpose and the operating time required. Through the outcomes of other research projects [23,24,25], the Moderate Resolved Imaging Spectroradiometer (MODIS) appears to produce good results when predicting harvest volumes. Corn yield prediction and uncertainty analysis based on remotely sensed variables using a Bayesian neural network is addressed in study [26]. Other artificial intelligence methods for estimating crop yield quantitatively are presented within sources [27,28,29,30,31,32,33].
Interestingly, a significant correlation has been revealed between stress-exposed corn plants and water stress in relation to the amount of usable pixels having an informative value [34]. By extension, some experts have [35] argued that using (NDVI) data acquired with an NOAA–Advanced Very High Resolution Radiometer (AVHRR) enables corn production to be predictable at least 2 months before the actual harvest and at an accuracy multiple times higher than that of the water stress procedure. The referenced article [36] also emphasizes that combining climatological NDVI data embodies a beneficial step to increase the accuracy of the models; this assumption is confirmed within study [36]. A combination of meteorological data and satellite images to predict aboveground biomass and dry matter contents in Brachiaria pastures is outlined in [37].
The accuracy of NDVI-derived corn yield predictions apparently depends on the scan time [38] and the volume of water in the plant during various periods of the day, regardless of the sensor used [39,40].
A predicting approach that utilizes the Leaf area index (LAI) and estimates the dry matter via field reflectance measurements executed with multispectral systems (Landsat 8, RapidEye) is described in study [41].
Furthermore, regarding the problems relevant to the topic in general, several research reports, articles, and papers discuss the relationship between the vegetation indices and nutritional values, [42,43]; the latter source examines data correlation between vegetation indices and the nitrogen nutrition index (NNI), the investigation being focused solely on pepper plants. The vegetation indices and the agronomic performance of corn varieties under different nitrogen rates are compared in article [44]. Our efforts conceptually relate especially to those outlined in report [45], which proposes an insight into the correlation between canopy vegetation and the growth indices of corn varieties with different nitrogen efficiencies; the authors of [45], however, do not show concrete mathematical expressions to inspect the vegetation-to-nutritional index relationships that allow for the establishing of the optimum corn harvest time.
Our article broadly expands on the knowledge, research, and applications available to date. The actual novelty lies in the design of a new and more accurate methodology (compared to, for instance, the solution adopted in [1]) for determining the optimum harvest time by exploiting the correlation between diverse vegetation indices and the dry matter content in various corn phenophases. With such an innovative approach, the farmer is not required to sample the crop directly in the field and have it analyzed chemically, thus saving a substantial amount of time and work. The definition of the appropriate harvest time leads to a scenario where the entire procedural chain is optimized, starting from the seed planting and proceeding through the ideal silage nutritional values to eventually secure the maximum achievable yield in cow milk or biogas.

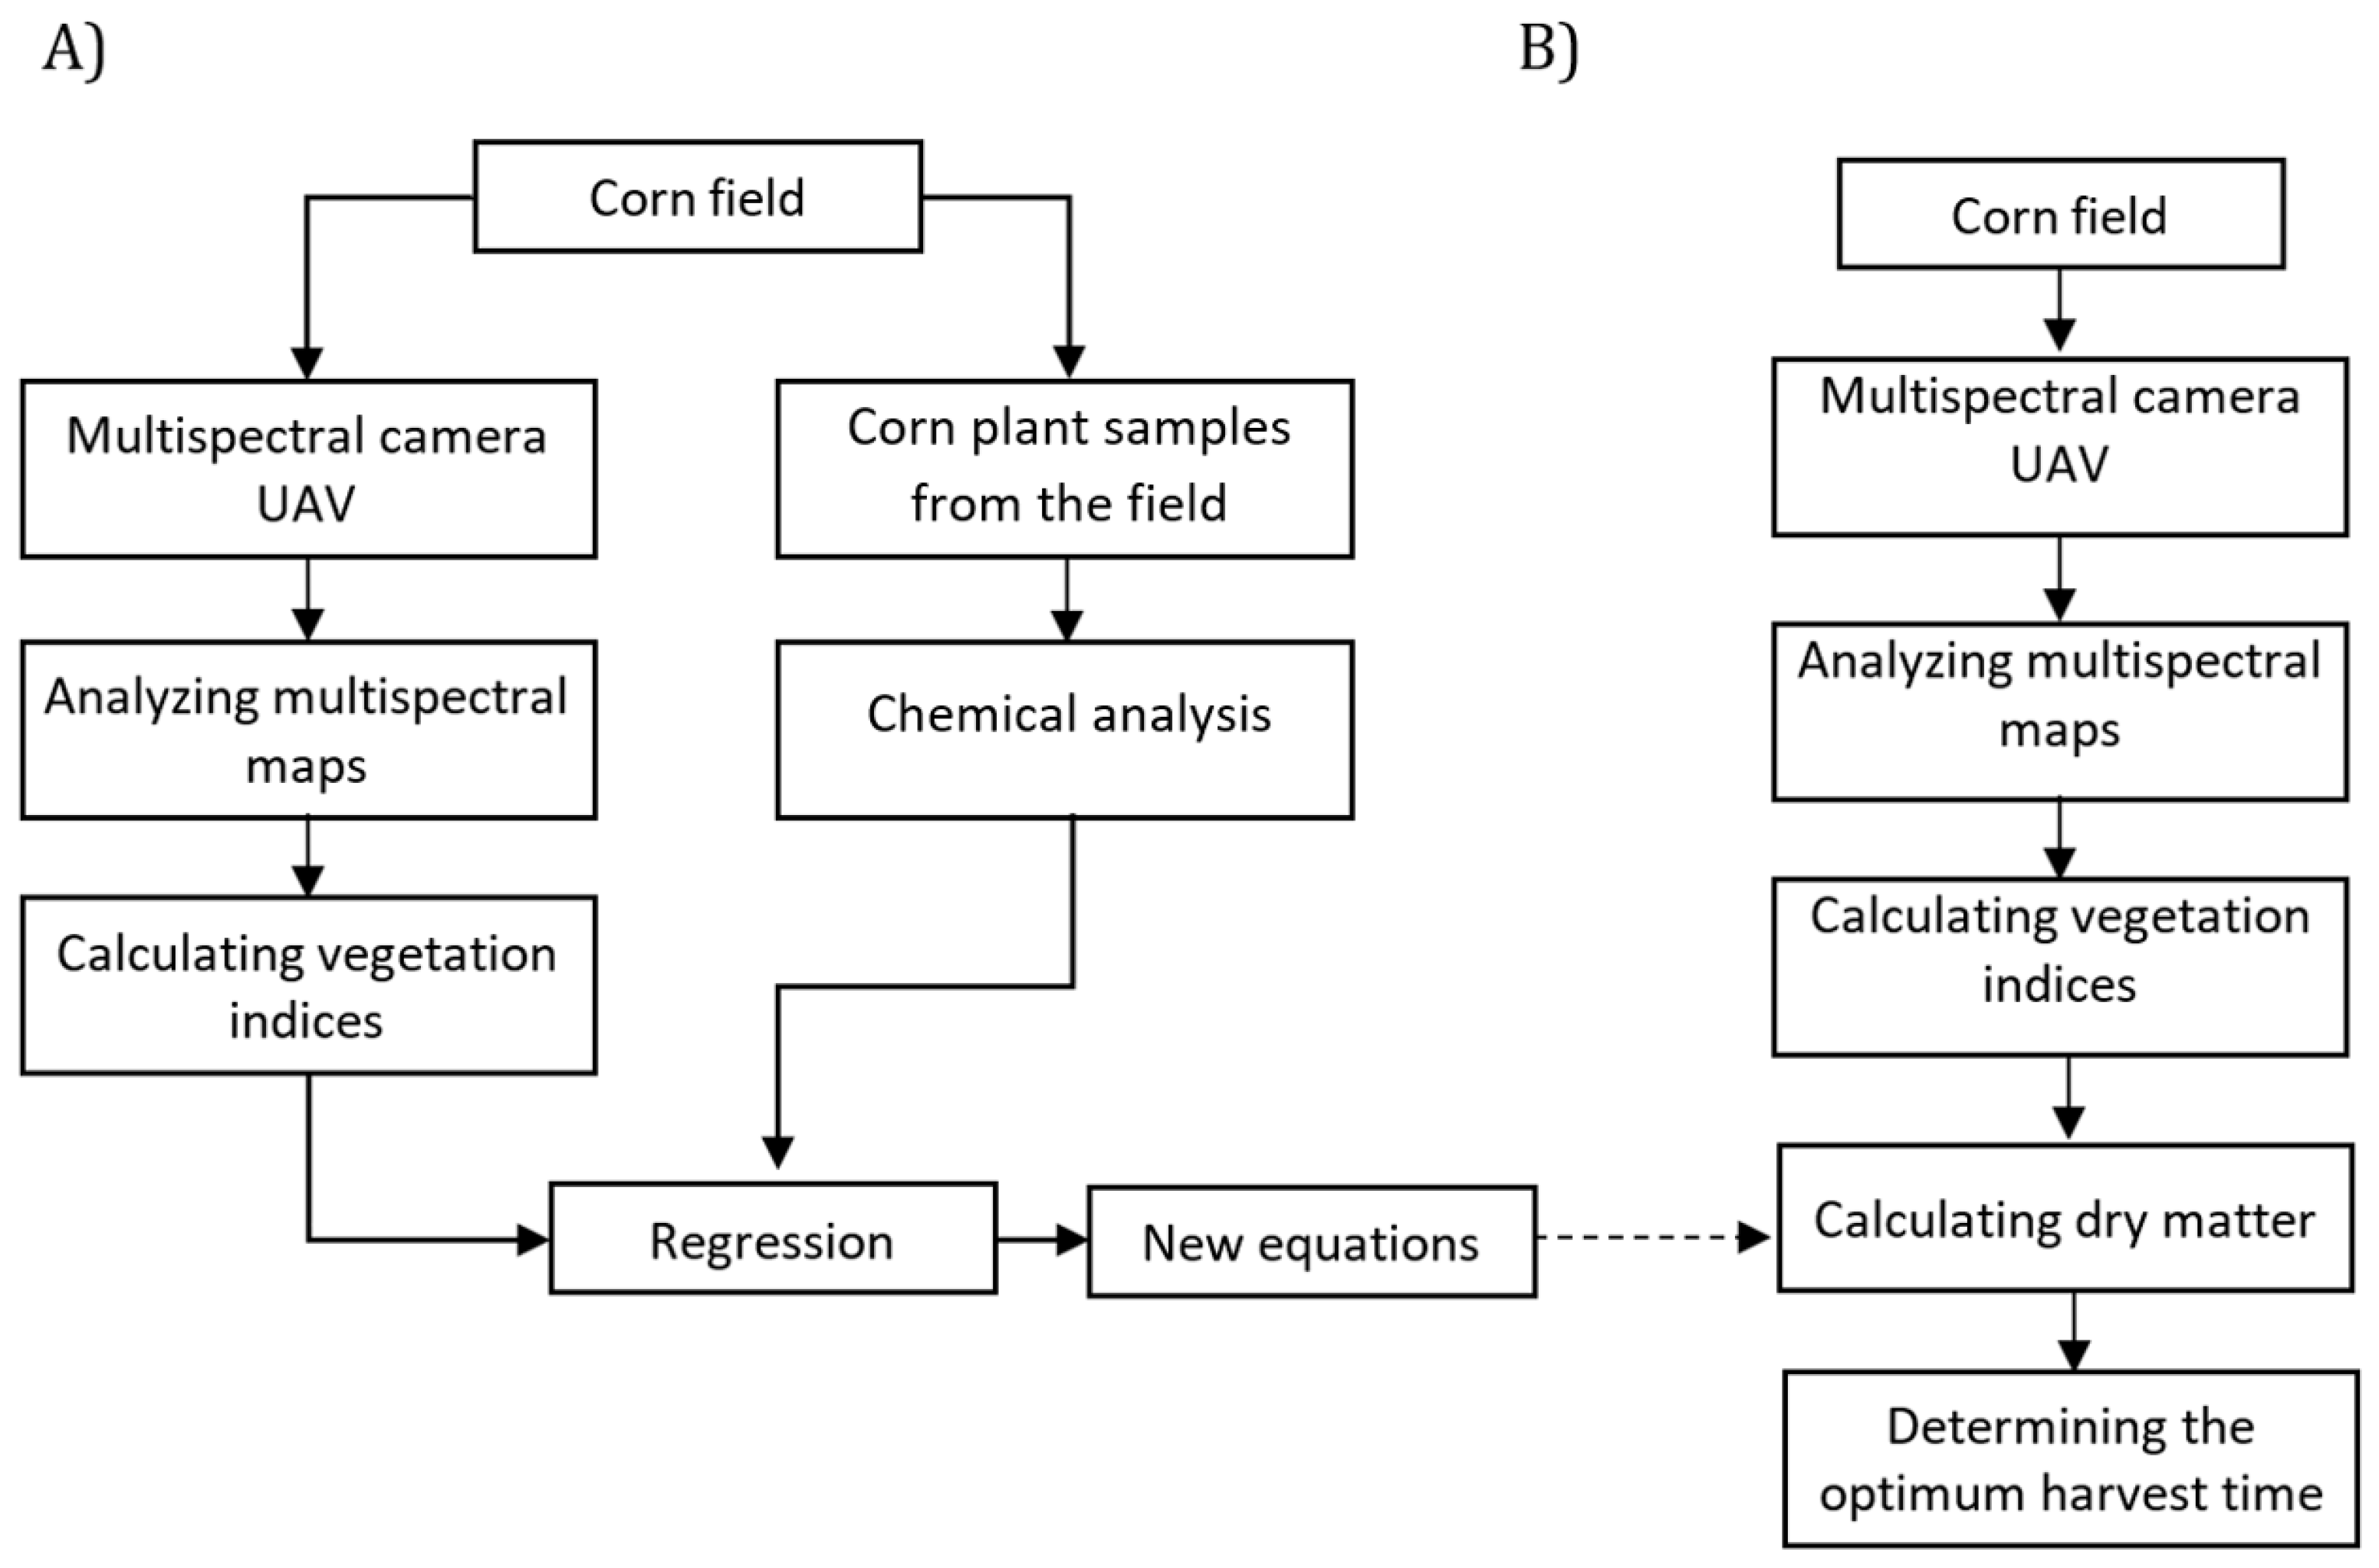
2. Materials and Methods

The data collection and the relevant mathematical processing are characterized through the block diagram and presentation below. The left-hand portion of Figure 1A exposes how a new equation is acquired via utilizing a regression model of the vegetation indices and a chemical analysis of the corn plants; the right-hand segment (Figure 1B), by contrast, displays the use of an experimentally generated equation for computing the dry matter without having to perform a chemical analysis. The dry matter value then enables us to establish the optimum harvest time in the crop being investigated.

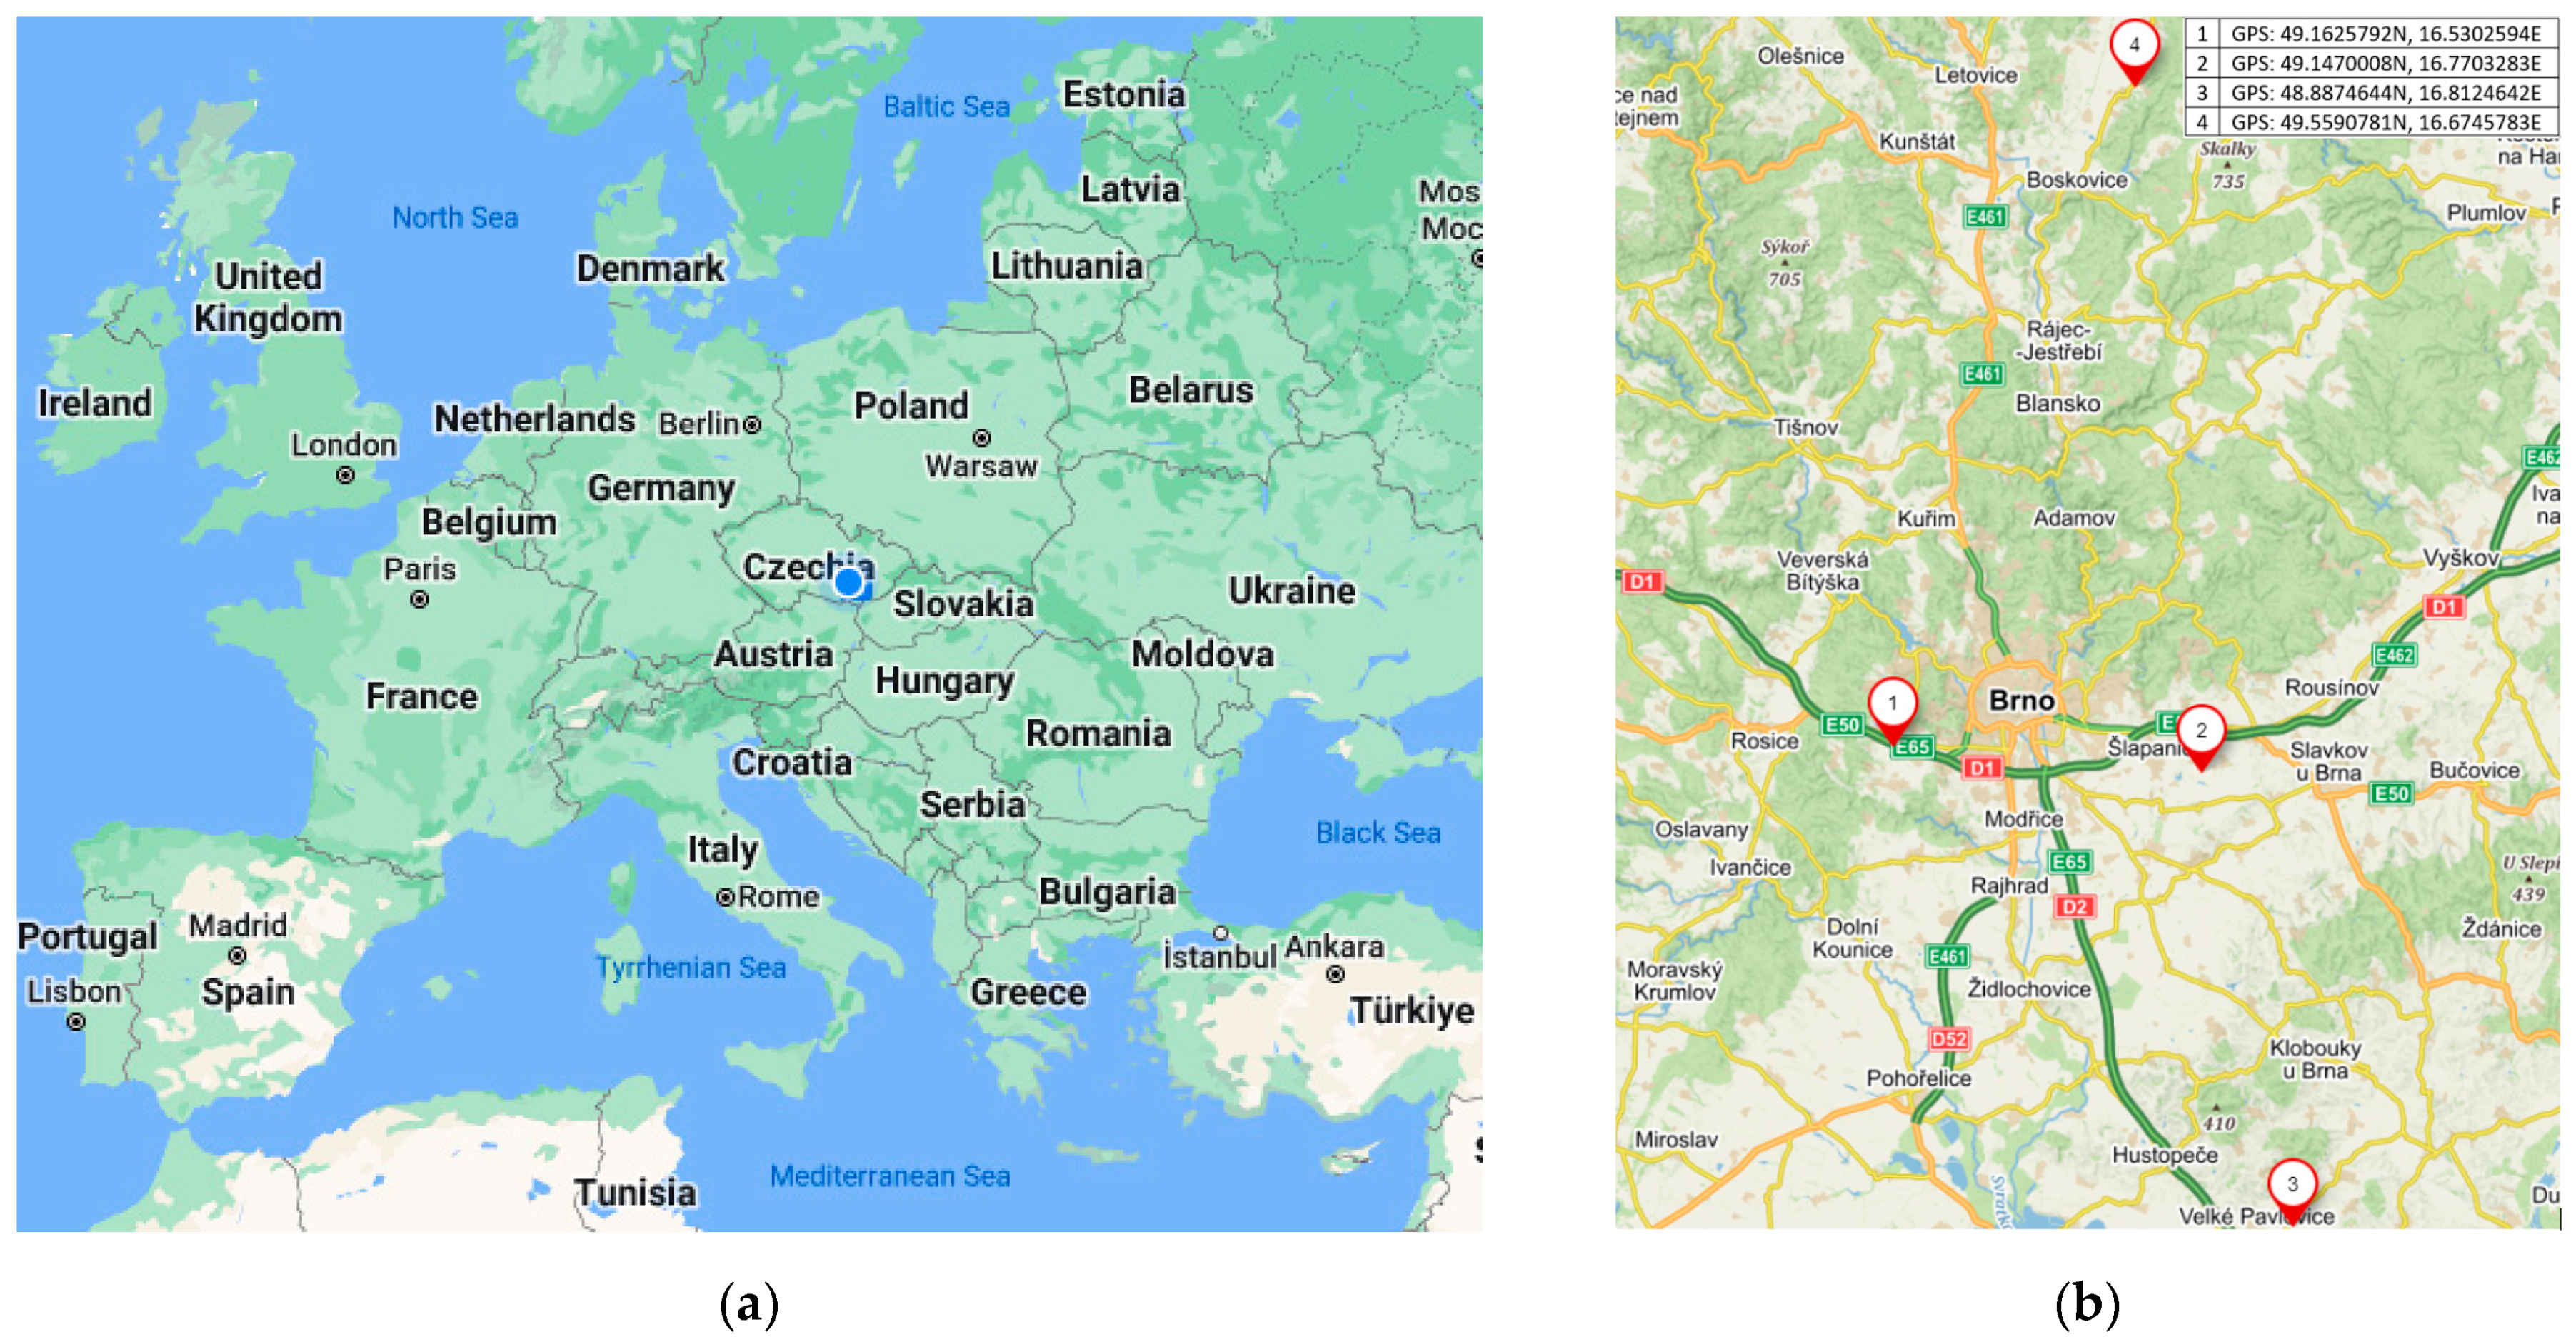
2.1. Sensing Periods and Localities

The multispectral camera photogrammetric imaging and the manual sampling were executed in corn fields at various spots of the South Moravian Region, Moravia, the Czech Republic. The sampling operations were coordinated, even though the intervals separating the individual steps differed. The locations where samples were collected for chemical analysis were recorded in multispectral images (Figure 2), and the preset locality selection criteria had included factors such as sufficient vegetation heterogeneity, soil composition, and climatic conditions [1]. In research year 1, the sampling was carried out near the village of Troubsko from 23 July 2019 to 4 September 2019, at four and five diverse time intervals of plant phenophase in the silage and the grain hybrids, respectively.
In the period from 12 August 2020 to 7 October 2020, the sampling was carried out between the municipalities of Šlapanice and Prace (both in the Brno country district). To optimize and compare the samples from the first research year, we chose a higher sampling frequency, collecting the items on 8 different days. The same amount of sampling was allocated to the next year, when the experiments took place in a field near the town of Velké Pavlovice (Břeclav district). The samples comprised two corn hybrids and were gathered from 2 August 2021 to 21 September 2021.
To test the validity of the correlative relationships and to confirm the hypothesis that changes in the computed vegetation indices are proportional to variations in the nutritional analysis, we conducted a separate experiment near the village of Knínice (Blansko district), involving 5 corn hybrids on the day of their actual harvest.

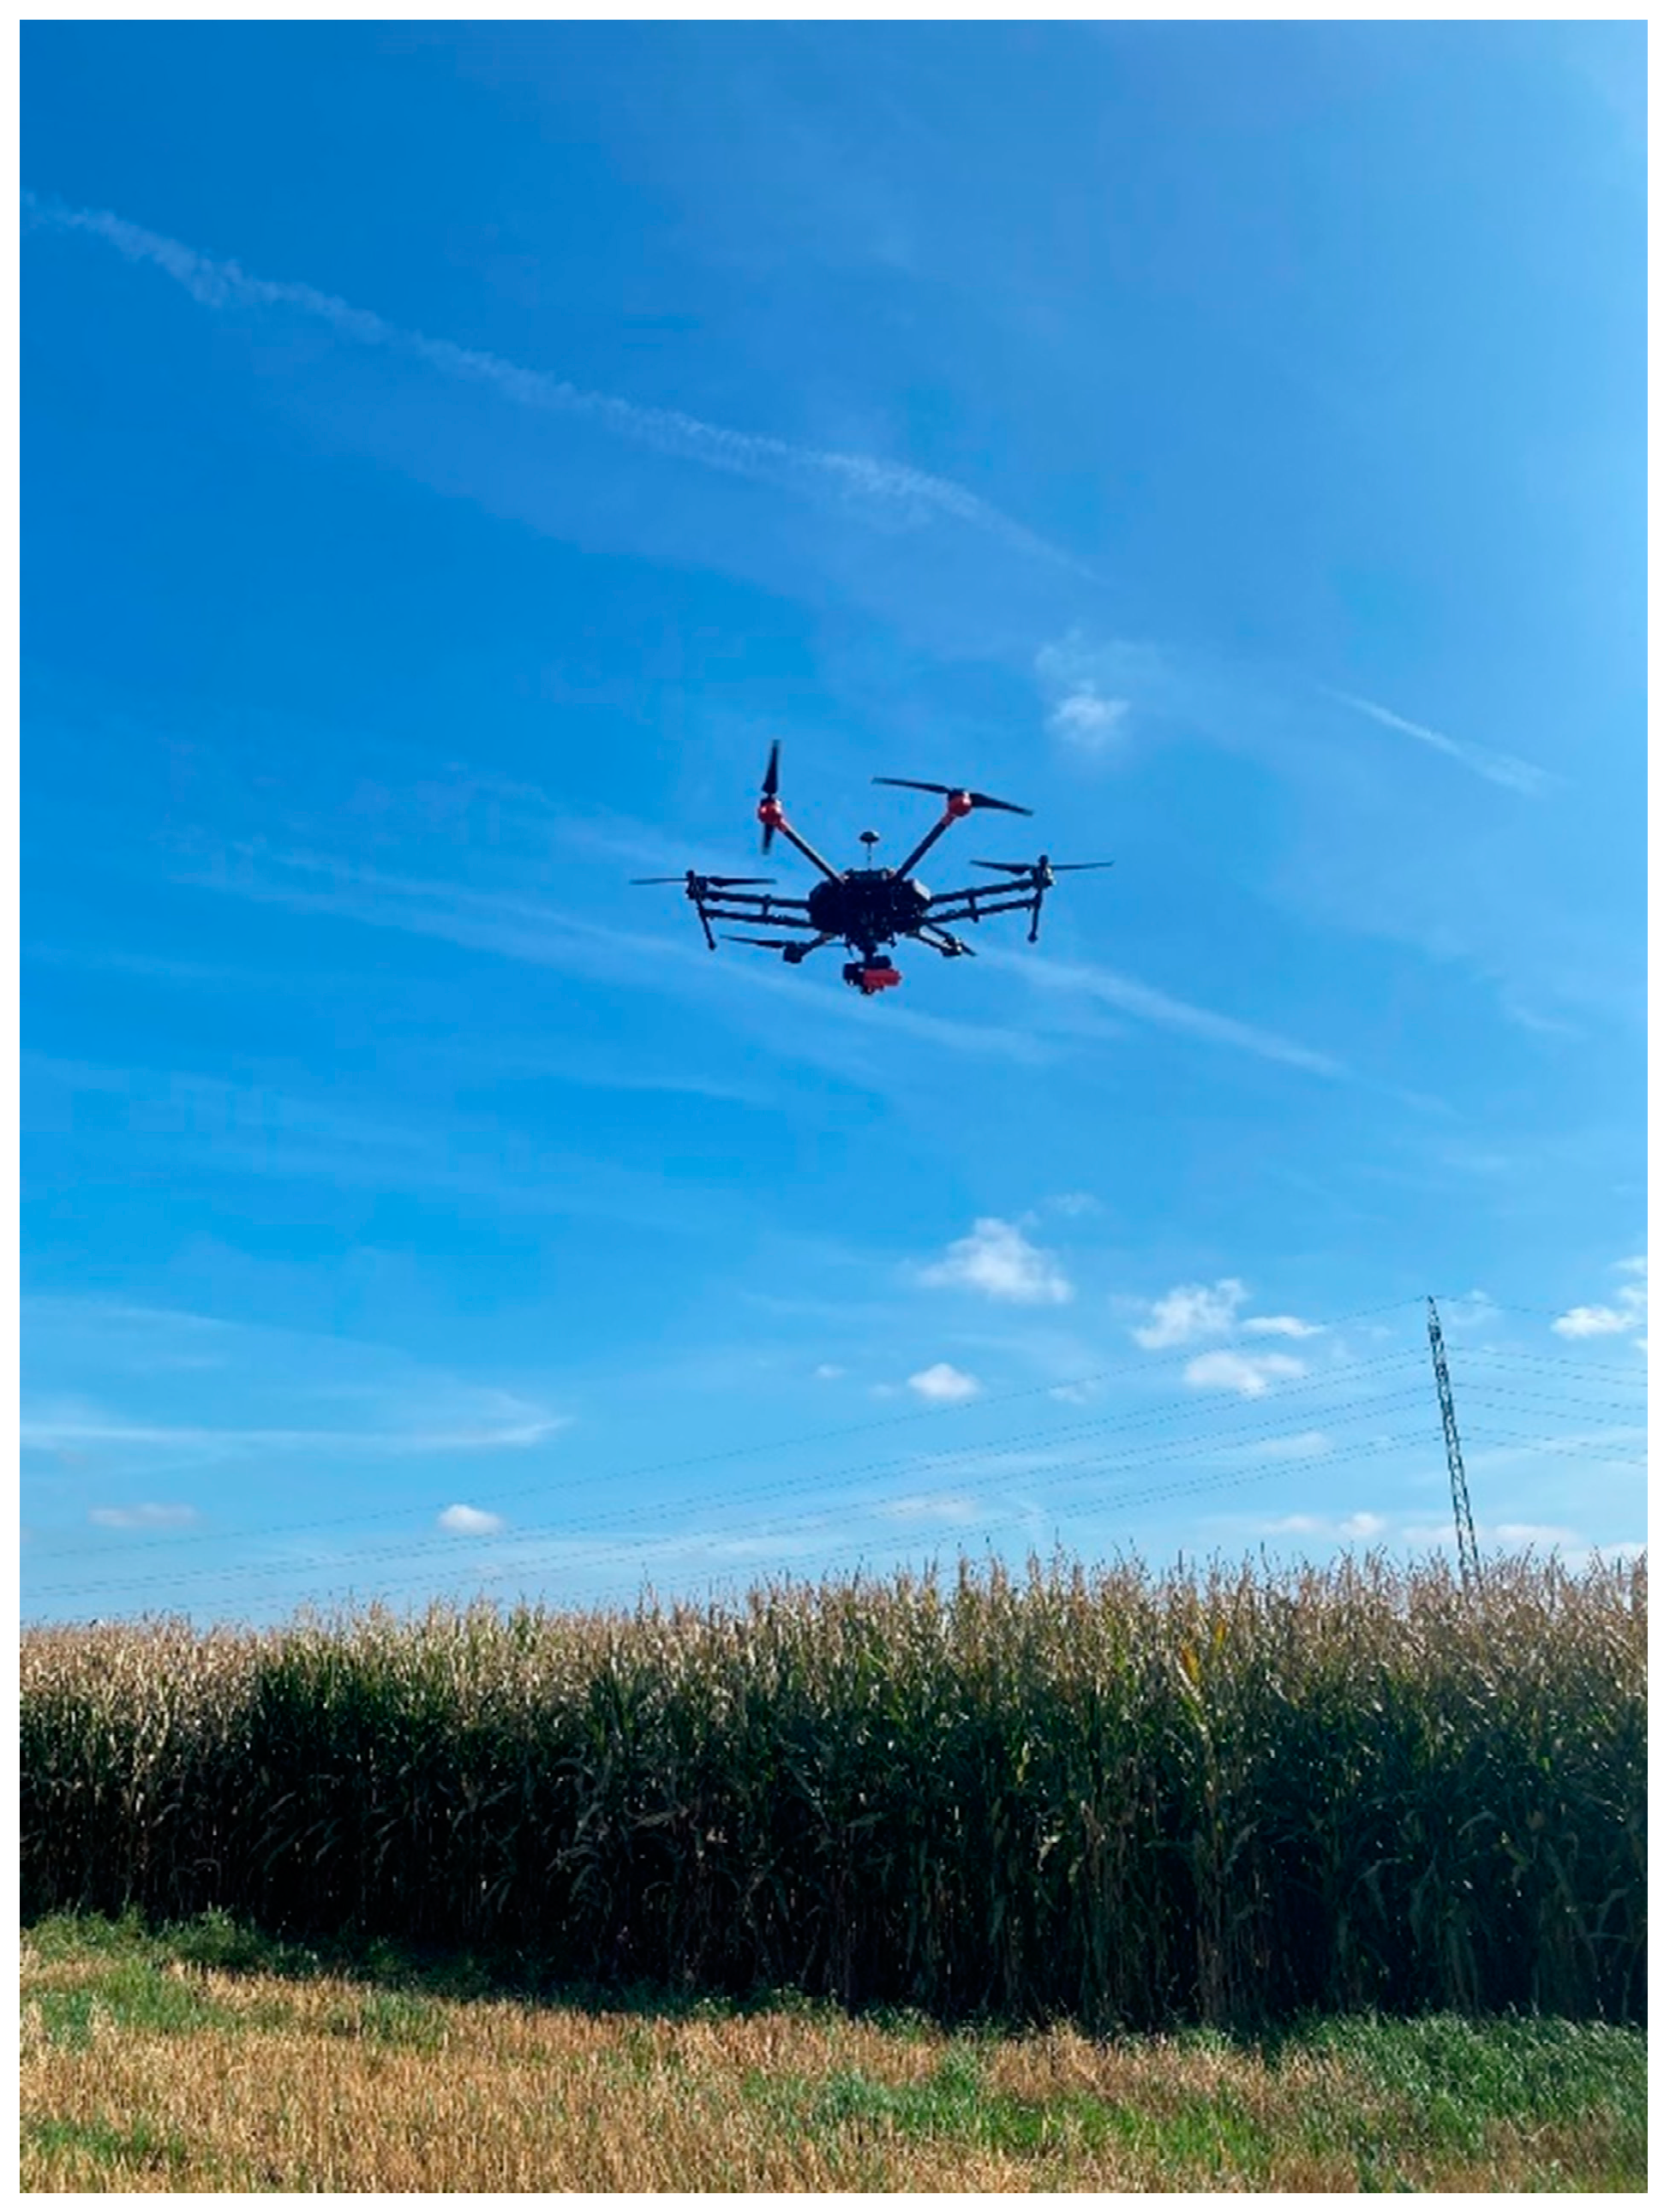
2.2. UAV Data Collection and Analysis

The photogrammetric data originated from a Micasence RedEdge-3 multispectral camera mounted on a DJI Matrice 600 Pro unmanned aerial vehicle (Figure 3). The RedEdge device captures 5 different bands (Table 1) and is fitted with a 3DR GPS module, a downwelling light sensor, Ethernet, and other interfaces.
Before evaluating the images, a sufficient volume of heterogeneous data has to be obtained to allow methods to be compared that are suitable for achieving the best possible correlation with the nutritional values of the plant samples.
The imaging was performed along pre-programmed automatic flight paths, each path having a precisely defined, polygon-shaped scanning area within the region of interest. In the experiment, we used the DJI autopilot and the Pix4D capture software to plane the path. The image processing relied on Structure-from-Motion (SFM), a key photogrammetric technique used to handle multispectral images obtained from UAVs.
The area covered for the testing was small, meaning that we assumed a fixed height; this height then also constituted the basis for the image computation. In all of the three research years, the mapping covered a rectangular zone of 361 m × 362 m, i.e., an area of approximately 13.1 ha. The total flight path length reached 4.477 m. To scan the full range of the investigated sector, a flight lasted 31 min, with an overlap of 70% between the images. The UAV flew at a speed of 8.6 km/h and an altitude of 40 m above the ground. In each of the spectral bands, we took invariably more than 330 images with a resolution of 2.78 cm/pixel. The measured data were processed with the Pix4D mapper at the user level; we did not test the image resolution changes or processing via various other methods.
The multispectral imaging delivers vegetation indices, which contain information on different reflectance values of the electromagnetic spectrum relating to the biological properties of plants. The most widely used vegetation indices are those where quantitative indicators, such as the volume of biomass within an area, can be determined. A large amount of algorithms to calculate vegetation indices are available, arising from computation from at least two spectral images; the images are selected in such a manner as to expose vegetation reflectance changes, and in most cases they are functionally equivalent. More than 150 vegetation indices have been published in the literature, but only a small subset have a strong biophysical basis or have been systematically tested [46,47,48].
Each vegetation index tracks specific vegetation characteristics and is convenient for particular applications. Indices that do not utilize the near-infrared spectral band exhibit limited (and limiting) properties and are therefore unsuitable in practical monitoring of vegetation changes. To facilitate the analysis, we chose the ratio indices NDVI, NDRE, and GNDVI, all of which are computed similarly; these tools, however, also contain different spectral bands, and thus they collectively offer a cross-section through important wavelengths. Combining the indices then yields applicable modifications, whose data are dissimilar to those delivered by the originally selected basic versions [49].
Vegetation indices are not constant, but depend on short-term weather changes and the overall amount of sunlight. To refine the results of the multispectral sensing, we need to run calibration; this step is executed in various growing seasons, under diverse weather conditions, and at the same phase of the day. Importantly, a database had to be formed containing the outcomes of several measurements, allowing us to choose the values that are achievable in optimum circumstances. Calibrating the camera eliminates the inaccuracies which stem from the use of one-off, single samples of the crops, and creating additional images will facilitate comparison of the indices.

2.2.1. NDVI (Normalized Difference Vegetation Index)

The NDVI is a numerical indicator of plant health that supplies data on vegetation changes and, in a more detailed sense, the amounts of water stress and chlorophyll contained in a plant. The index evaluates the monitored vegetation surface by using the ratio of the reflectance of the red and near-infrared parts of the spectrum [50].
The NDVI utilizes the red visible band, which is strongly absorbed by the upper portion of a plant’s surface, meaning that the lower levels do not significantly contribute to the NDVI measurement. The correlation between the index and the plant’s volumetric properties thus deteriorates; this is more prominent in taller plants with multiple leaf layers (such as corn at later growth stages) [51,52].
The reflectance of the near-infrared spectrum enables the index to easily distinguish subtle differences in vegetation. In the actual sensing, the factors of major importance include shadows and the atmosphere, whose impact leads to reflectance changes within the different bands; the atmospheric effect is eliminable via correction based on comparing images taken at various times [49]. We have
N D V I = ρ N I R ρ R e d ρ N I R + ρ R e d
where ρNIR and ρRed denote the reflectivities of the near-infrared and the red wavelength bands, respectively.

2.2.2. NDRE (Normalized Difference Red Edge Index)

Similar to the above-characterized tool, the NDRE exploits the near-infrared spectrum and the frequency band that lies in the transition region separating the visible and the infrared spectra, i.e., the red edge; we have
N D R E = ρ N I R ρ R e d E d g e ρ N I R + ρ R e d E d g e .

2.2.3. GNDVI (Green Normalized Difference Vegetation Index)

This method employs the green spectrum wavelengths rather than the red ones; these are ρNIR and ρGreen, denoting the reflectance values in the near-infrared and the green bands, respectively [53,54]. We have
G N D V I = ρ N I R ρ G r e e n ρ N I R + ρ G r e e n .

2.3. Chemical Analysis of the Samples Obtained from Field-Gathered Corn Plants

To obtain the nutritional parameters of the field samples of corn, we carried out a dedicated laboratory chemical analysis. The vegetation indices and the outcomes of the analysis were then correlated at various phenological growth stages of the monitored crops to establish the ideal harvest time as regards the corn yield for silage making and animal feed on the one hand, and methane production in biogas plants on the other.
The sampling was invariably performed at identical time intervals, together with the multispectral imaging. To survey the quality of the corn hybrid, we opted for sampling according to the methodology recommended by the Central Institute for Supervising and Testing in Agriculture, Brno, Moravia, the Czech Republic [55]. The samples were acquired from three different sectors to expose the local field growth homogeneity; in each of the cases, we took a row of 10 whole corn plants and marked their positions on the multispectral maps acquired over the areas specified in Figure 2.
Subsequently, we modified and analyzed the plants to determine the major quantities, namely, the FM—Fresh matter (fresh weight)—and EW—Ear weight. In general terms, the analysis also enables the following nutritional values to be established: the DM–dry matter, meaning the dry matter volume–from which we then define the values of CP–crude protein (nitrogenous compounds); CF—crude fiber (crude fiber); starch (starch content); ash (ash presence); NDF—neutral detergent fiber (neutral detergent fiber); DNDF—digestibility NDF (neutral detergent fiber digestibility rate); and DOM—digestibility organic matter (organic matter digestibility rate). The analyzed data eventually allow us to calculate the yield per hectare, comprising the YFM—yield of fresh matter (fresh matter share indicator) and YDM—yield of dry matter (dry matter share indicator); in total, a hectare is assumed to produce 80,000 corn plants.

2.4. Data Correlation

To define the relationships between the results acquired with the nutritional analysis on the one hand (Nut) and the values of the vegetation indices (Veg) on the other, we calculated the vegetation index values r N u t , V e g according to Pearson’s correlation coefficient. The degree of correlation is specified by the computed correlation coefficient, which can take values from −1 to +1. The terminal values of the coefficient +1 represent a completely direct relationship, and the first variable tends to increase; by contrast, the values of the coefficient −1 represent a fully inverse relationship, and the first variable tends to decrease. If the correlation coefficient equals zero, there is no linear relationship between the parameter being monitored and the reflectance or vegetation index. We have
r N u t , V e g = 1 n i = 1 n N u t i V e g ¯ V e g i N u t ¯ S N u t · S V e g
S N u t = 1 n i = 1 n N u t i 2 N u t 2 ¯ ,
S V e g = 1 n i = 1 n V e g i 2 V e g 2 ¯ ,
where N u t represents the nutrition analysis value, V e g denotes the vegetation index value, V e g ¯ and N u t ¯ stand for the sample means, and S V e g  and S N u t are the standard deviations.
The quantity R 2 indicates the coefficient of determination. It takes values from 0 to 1, was computed to express the joint variability of the variables, and specifies the quality of the regression model. A value of 1 means perfect prediction of the values of the dependent variable, while a value of 0 signifies minimum information relating to the knowledge of the dependent variable. The coefficient was computed by using the relationships below.
A dataset has n values marked as y1,…,yn (collectively known as yi or a vector y = [y1,…,y]nT), each associated with a fitted (or modeled, predicted) value f1,…,fn (denoted by fi).
If y ¯ is the mean of the observed data,
y ¯ = 1 n i = 1 n y i ,
then the dataset variability can be measured with two sums-of-squares formulas. First, let us note the sum of the squares of residuals, also called the residual sum of squares:
S S r e s = i y i f i 2 .
The latter equation embodies the total sum of squares (proportional to the data variance), reading
S S t o t = i y i y ¯ 2 .
The most general definition of the coefficient of determination is
R 2 = 1 S S r e s S S t o t .
In the best case, the modeled values exactly match the observed ones, resulting in S S r e s = 0 and R 2 = 1 . A baseline model, which always predicts y ¯ , will have R 2 = 0 ; models that deliver predictions worse than the baseline will assume a negative R 2 [56].
To obtain another parameter for determining whether the correlation coefficients take a value that effectively implies an inter-coefficient relationship, we computed their statistical significance.
The statistically significant rate was established by using a continuous probability distribution based on Student’s concept (t-distribution); we have
t s c o r e = ( r N u t , V e g · n 2 ) 1 r N u t , V e g 2 ) ,
where n is the amount of the observed correlation phases.
When seeking a statistically relevant value, we selected a significance level of 2%, corresponding to a quartile of 99%. The t-distribution values for seven, four, and three degrees of freedom equal 2.998, 3.747, and 4.541, respectively. If the correlation coefficient exceeds the critical value, the correlation can be considered statistically relevant.

2.5. Method to Verify the Resulting Equations: A Separate Corn Field

The equations defining the linear relationship of the dry matter values to the correlated vegetation indices NDVI, NDRE, and GNDVI were validated against the outcomes of a single-shot experiment for 5 hybrids (the ES Joker, ES Wellington, KTG Karlaxx, Absolutissimo, and Rudolfinio) on the day of their actual harvest. The dry matter content predictions covered hybrids grown for grain, with the ideal harvest window shifted to values between 380 g/kg and 420 g/kg.
In each of these hybrids, the interaction of the acquired relationships (14)–(16) was set down and verified. Using nutritional analysis, we determined the dry matter volume in the whole plants, and this quantity was denoted as the dry matter conventional true value, D M C T V . Subsequently, we applied the vegetation indices to compute the predicted dry matter value, D M P V ,  and established the absolute and relative deviations, Δ DM and δ DM , respectively, of the dry matter conventional true value from the predicted one. The equations read
Δ DM   g / kg = D M P V D M C T V .
δ DM   % = Δ DM   g / kg D M C T V · 100 = D M P V D M C T V D M C T V .

3. Results

3.1. Chemical Analysis

Table 2, Table 3, Table 4, Table 5 and Table 6 below contain the values that followed from the chemical analysis. In 2020, the harvest plan enabled us to expand the pre-defined experiment within the harvest window to cover a longer period, and thus we eventually included a total of eight sampling dates; this step then enabled us to determine a larger number of corn plant nutritional parameters through the chemical analysis and computing the yield characteristics (Table 4).
In 2021, we repeated the procedure of 2020, the only difference being that, to achieve a higher variability, we experimented with two different corn hybrids, the DKC 3568 and the DKC 4279, at the same site; each of these hybrids has a specific maturation period. The resulting parameters are presented in Table 5 (the DKC 3568) and Table 6 (the DKC 4279).

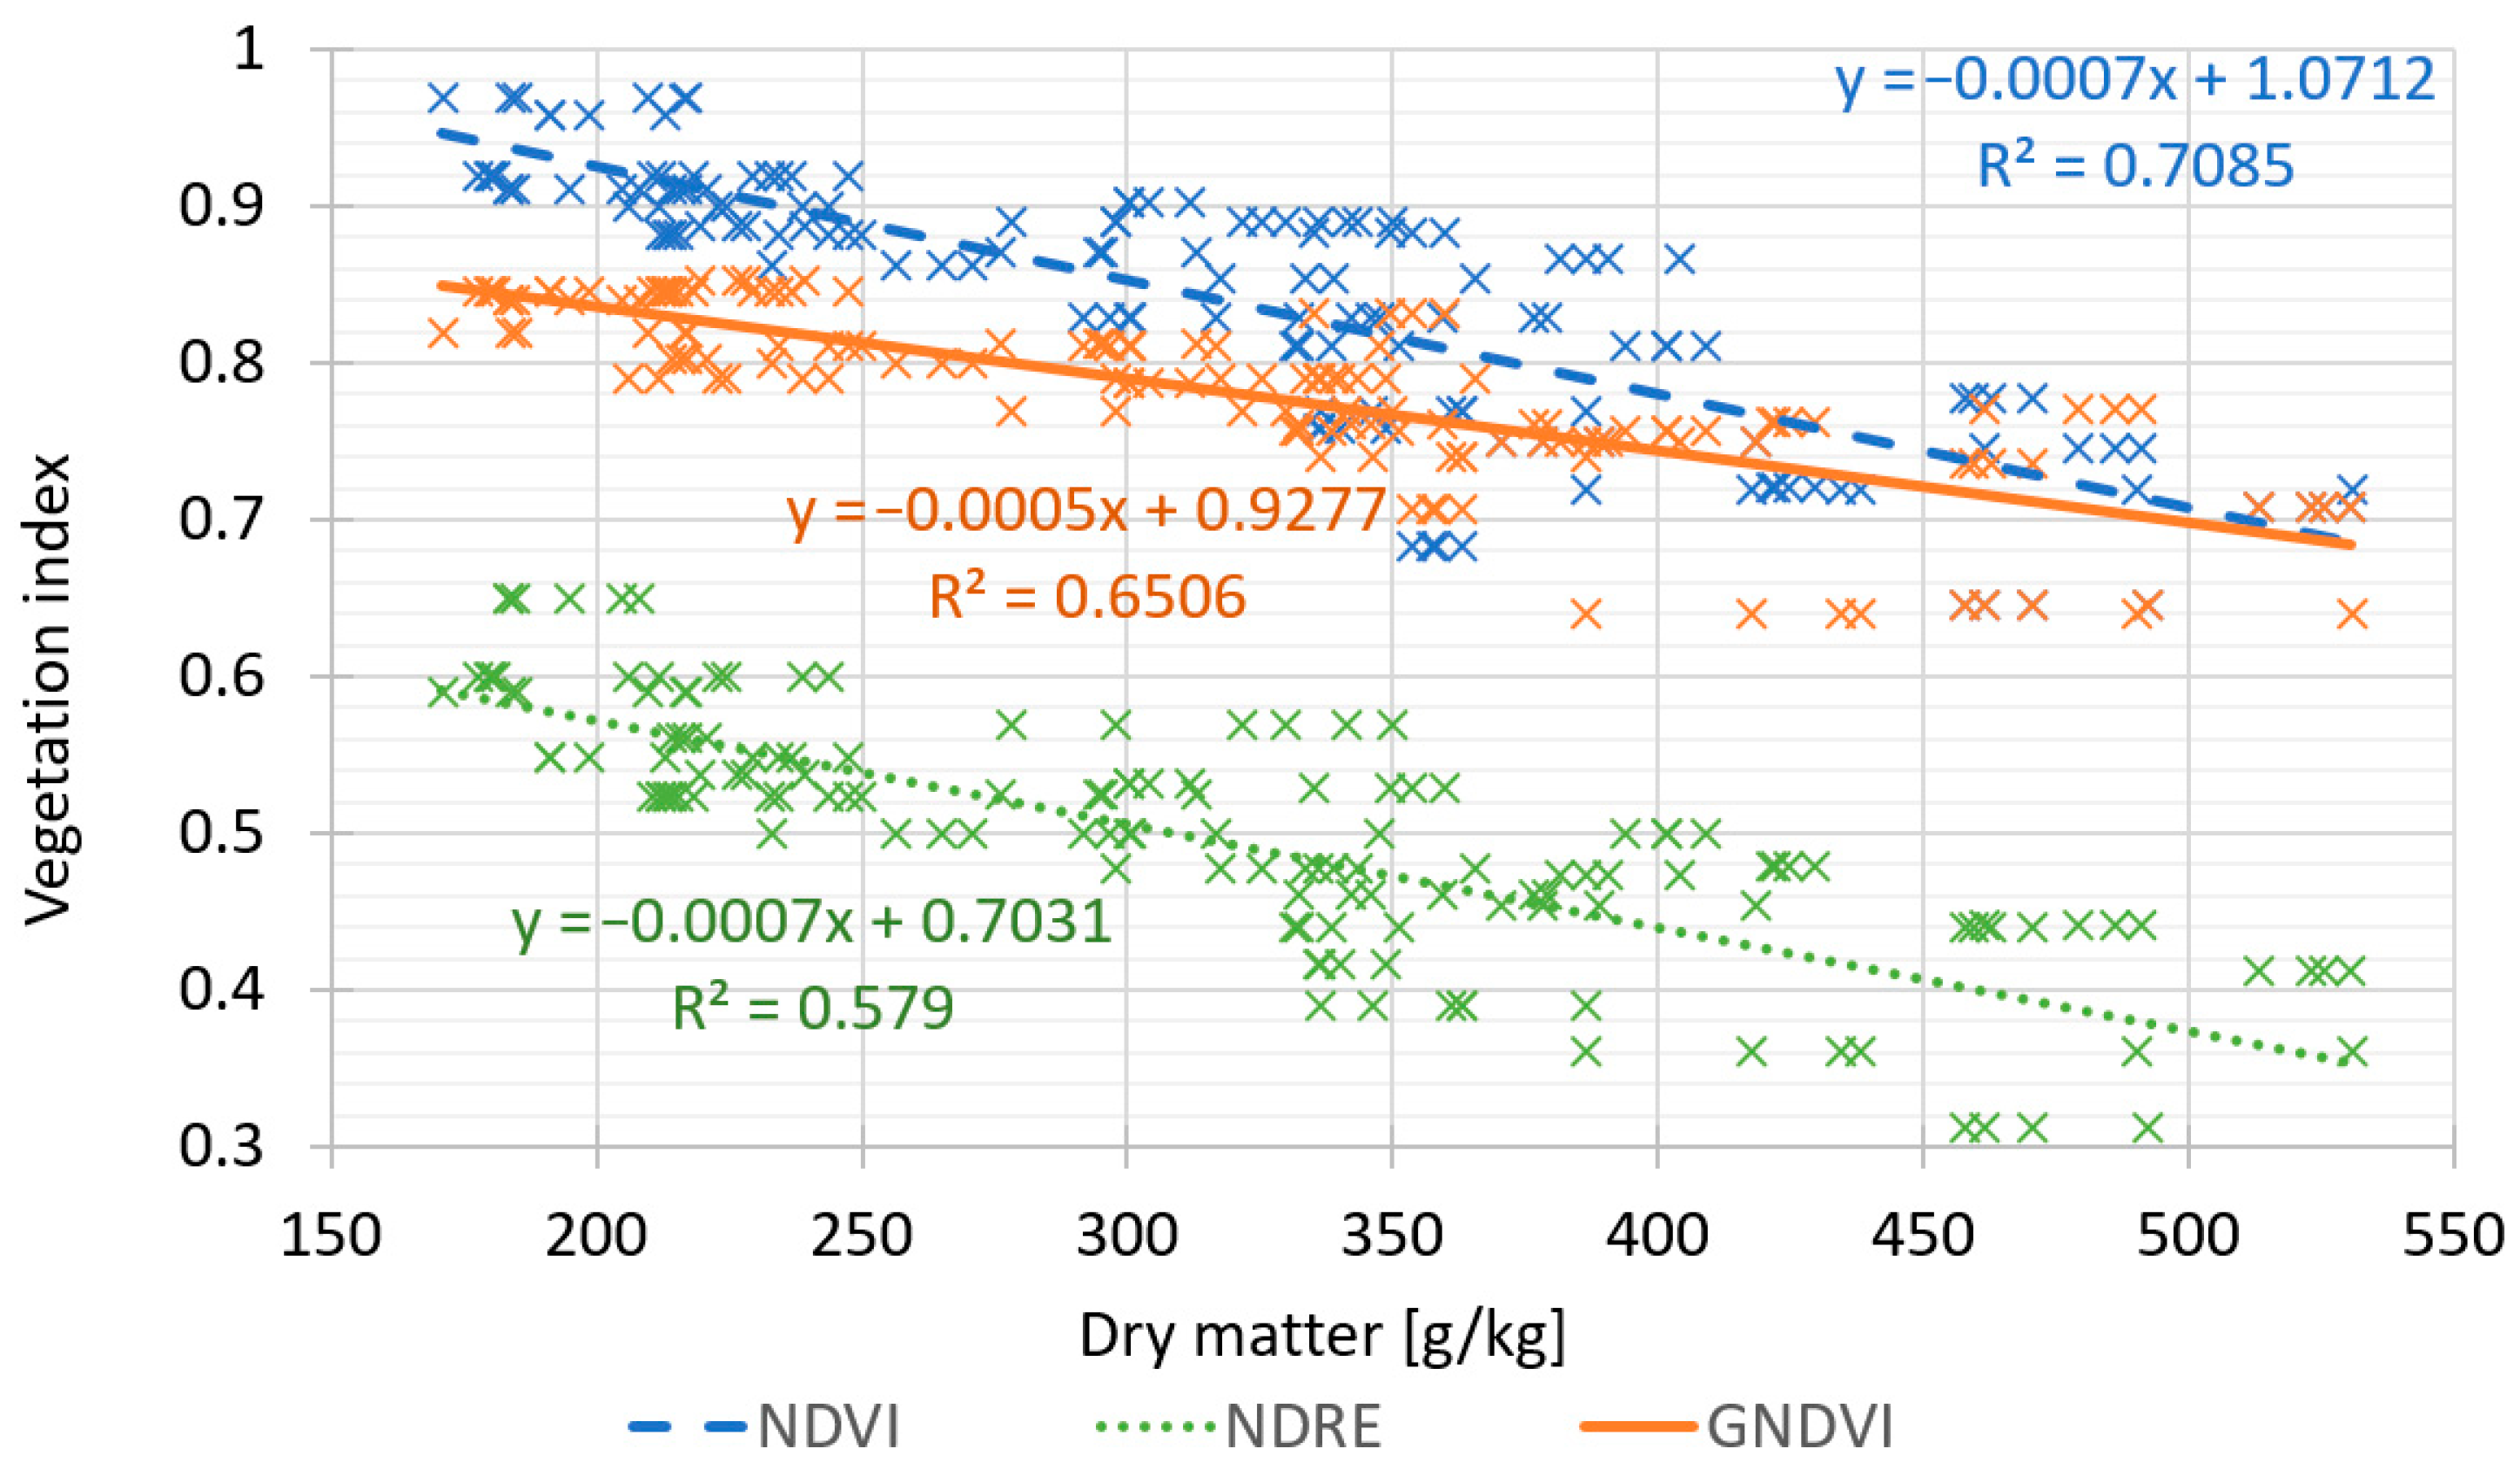
3.2. Data Correlation Results

In Table 7 below, we present the statistically relevant values computed according to reference [8] from the data correlated between the vegetation indices and the nutritional values of the corn hybrids examined over the three-year project. The statistically significant values are in bold.

3.3. Regression Model Results

The details of the relationships between the analyzed vegetation indices and the dry matter values are plotted in Figure 4. Using a linear regression model, we found the following proportions:
N D V I = 0.0007 · D M + 1.0712 ,
N D R E = 0.0007 · D M + 0.7031 ,
G N D V I = 0.0005 · D M + 0.9277 .
These formulas facilitated establishing the graphical relationships between the vegetation indices and the dry matter values, Figure 5.

3.4. Validating the Regression Models

To determine the predicted dry weight value from the above Equations (14)–(16), we analyzed the previously acquired multispectral images, establishing the values of the spectral reflectance and the vegetation indices (Table 8).
In Table 9 below, we show the outcomes of analyzing the relationships between the conventionally true dry matter value determined through the chemical analysis of the corn samples and the predicted dry matter value established via the vegetation indices according to Equations (14)–(16).

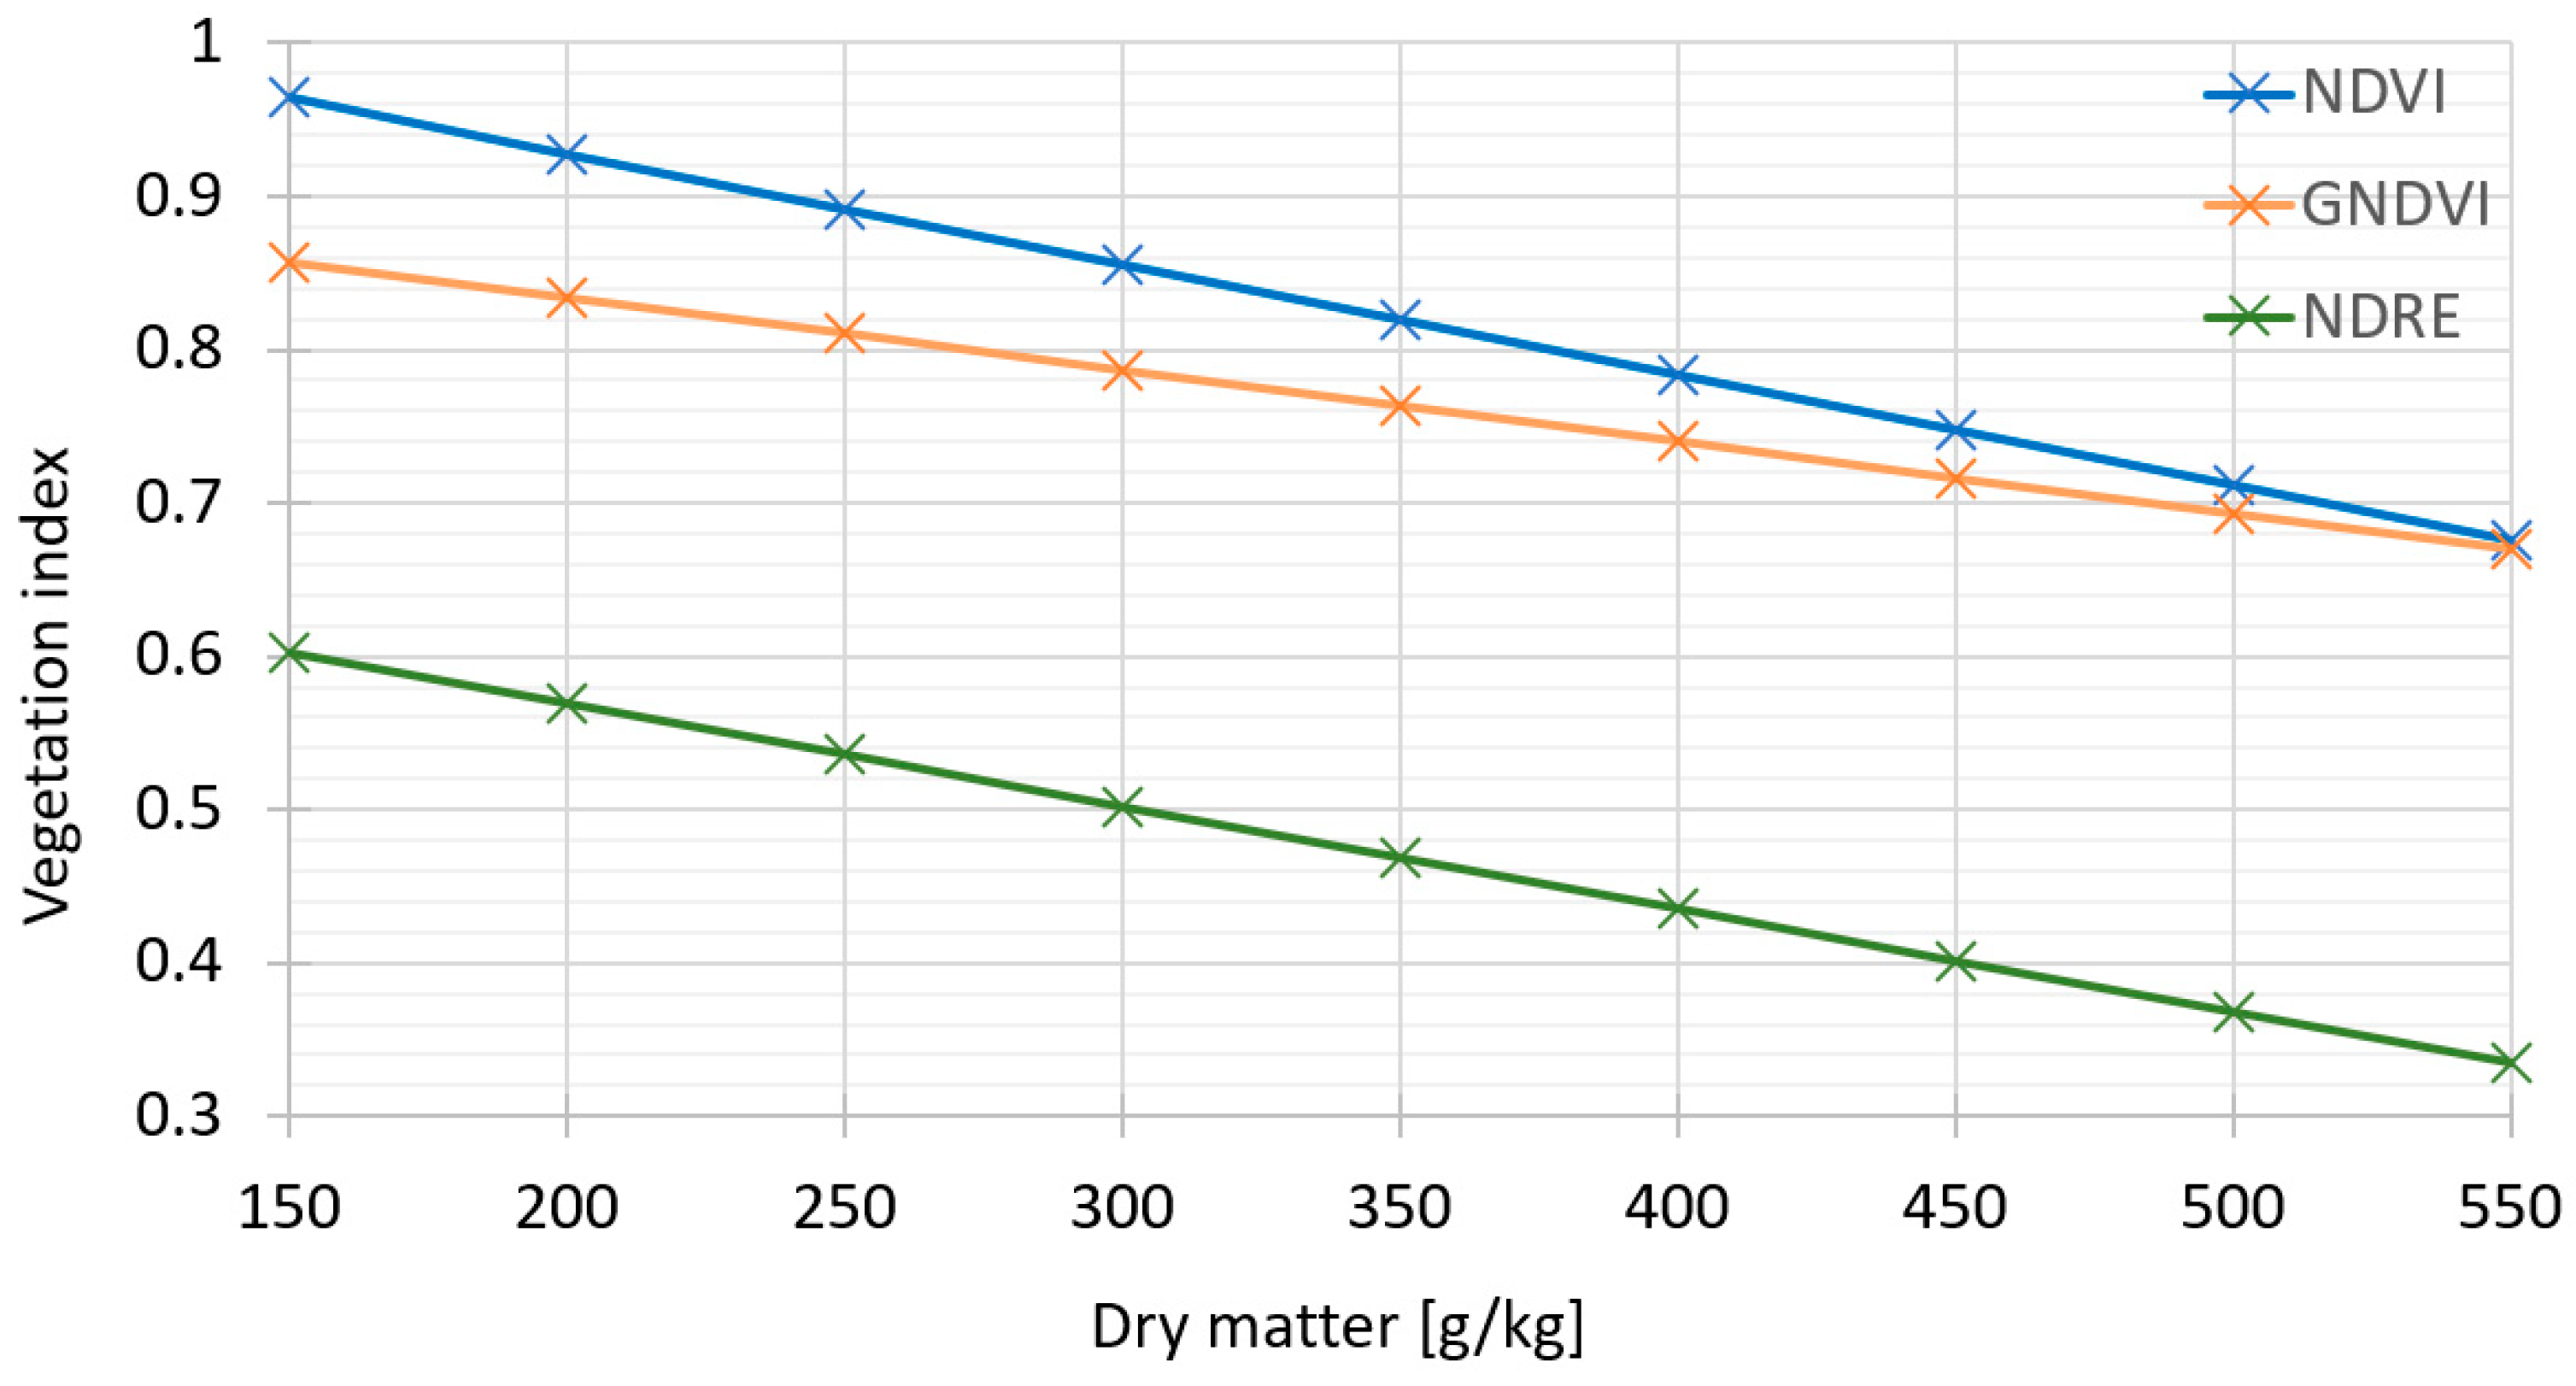
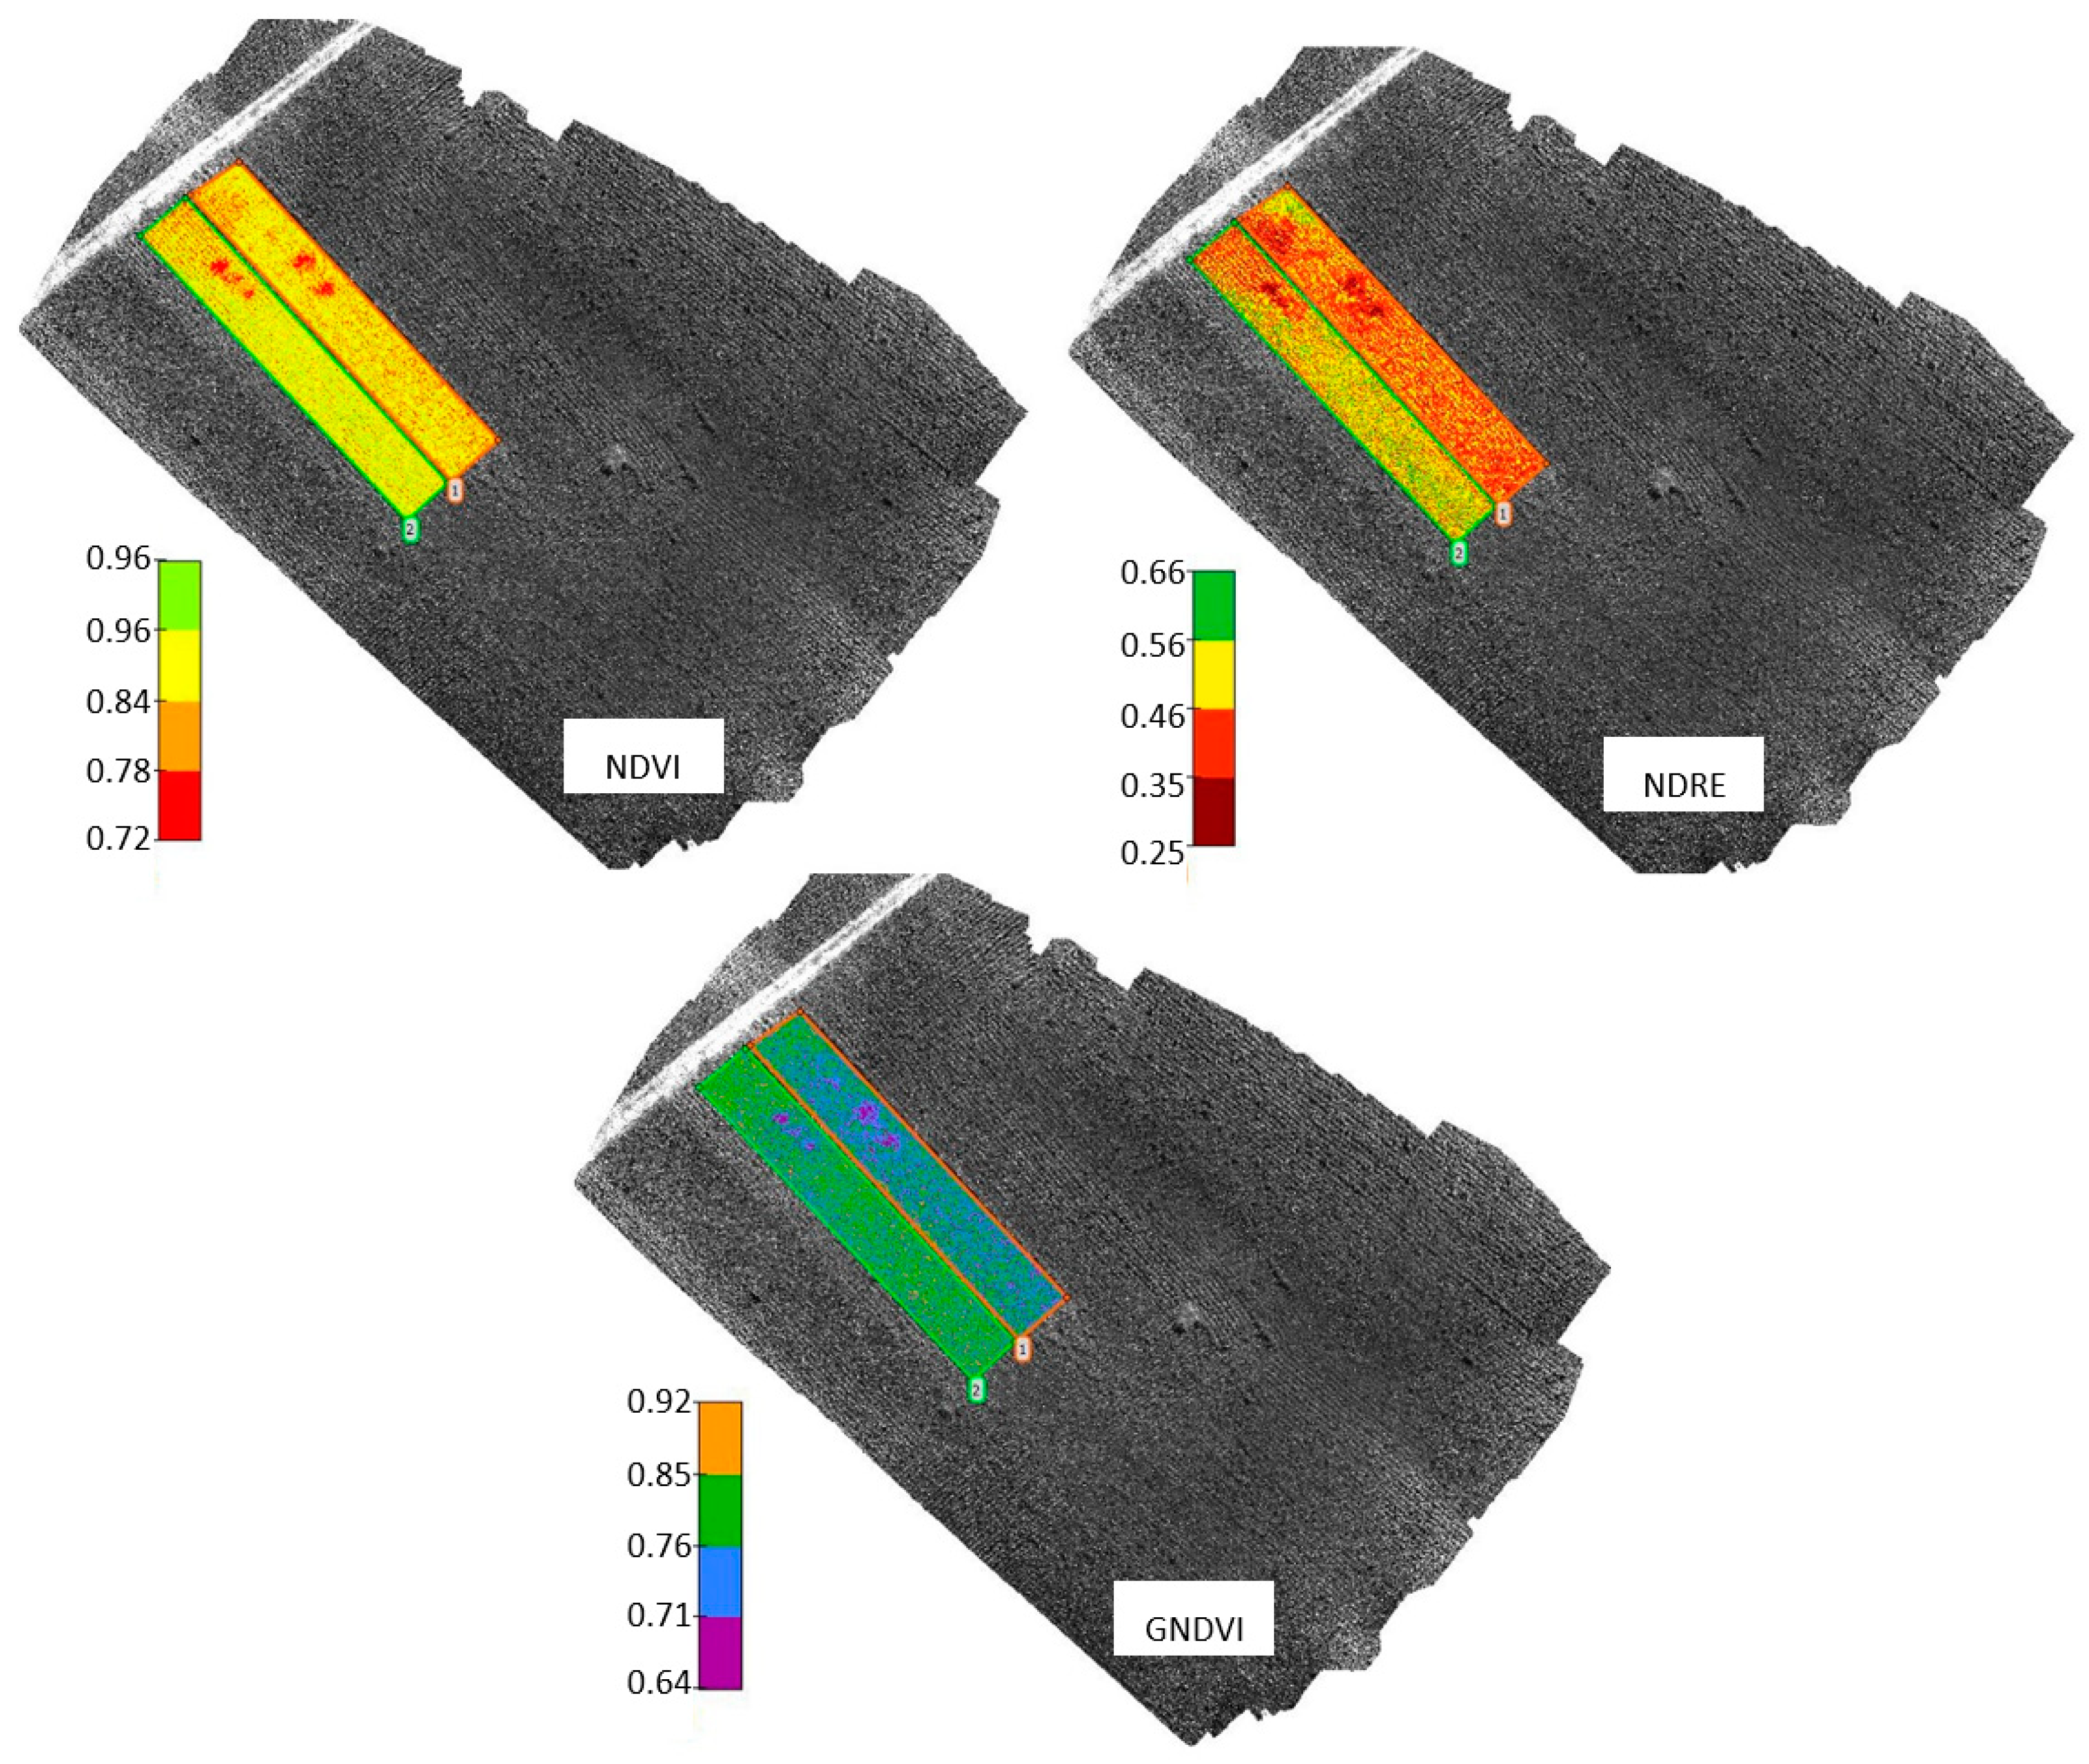
3.5. Mapping the Vegetation Indices

Selected vegetation index maps are shown in Figure 6; all of the items, and others in their set, were acquired with the RedEdge camera carried by the UAV.

4. Discussion

4.1. Discussing the Results of the Chemical Analysis

The evaluated nutritional parameters indicate that the volume of dry matter (DM) in corn increases with progressing phenophase. The rising share of corn grain is then accompanied by a gradually increasing presence of starch in the entire plant; the starch is the plant’s main source of energy. In other parts of the plant, the amount of nitrogenous matter (CP) progressively decreases, and the fiber digestibility rate (NDF) drops markedly due to overall lignification. The ideal harvest window for the monitored plants was identified at the penultimate stage of the field experiments. This optimum time corresponds with the dry matter values between 280 and 330 g/kg and an average starch content of 270 g/kg (DM) to 320 g/kg (DM), and the ideal value at 300 g/kg (DM) corresponds to ⅔ of the milk line stage of the grain. During the observed period, we also traced changes in nutritional indicators such as the digestibility of organic matter (DOM), which exhibited a tendency to grow owing to a rising share of ears that contain high digestibility starch. Simultaneously, the remaining fiber (NDF) lignified gradually, and its digestibility declined accordingly. A rise was also evident in the fresh matter yield (YFM) and the dry matter yield (YDM), which generally behave in an uneven manner and depend markedly on the phenophase and maturation stage of the crop.

4.2. Discussing the Outcomes of the Chemical Analysis

This section outlines the statistical relevance of the correlation coefficients. All correlations between the dry matter volume and a vegetation index were strong, with all of the field experiments in each of the years having been classified as very significant. An exception lies in a hybrid harvested for the NDVI index in the first year; this hybrid cannot be considered statistically relevant. A major statistical significance is assigned also to the correlations of the starch with the vegetation indices; here, we also identified exceptions in some years when the correlation appeared statistically irrelevant. The starch content notably influences the resulting quality of the harvested corn, among other aspects. The values of the NDVI, NDRE, and GNDVI correlate with the computed YDM values; in selected cases, the correlations are strong or even very strong. Thus, it follows that the heavy correlations in the NDVI and GNDVI can be employed to not only determine the appropriate harvest time but also predict the amount of organic matter within the yield of the crop being harvested, a factor of major importance for determining the organic matter yield.

4.3. Discussing the Results Obtained through Verifying Equations

The relationships characterized in Figure 4 have produced three equations to relate the dry matter and the vegetation indices. In the NDVI, we acquired Equation (14) and the highest value of the coefficient of determination, R2 = 0.7085; the NDRE to dry matter, by contrast, showed the lowest value of the coefficient of determination, R2 = 0.579. Regarding the GNDVI, the coefficient R2 took the value of 0.6506.

4.4. Discussing the Results Obtained through Verifying the Equations

The absolute differences between the predicted, D M P V , and the conventionally true, D M C T V , dry matter content values ranged from −0.01 to −26.98 g/kg. The largest differences separating the predicted and the true contents were identified in the NDRE.
The average relative deviations, δ DM , for the dry matter values computed from the NDVI and the NDRE equaled 2.154% and 3.078%, respectively; the smallest relative error in the dry matter of the five hybrids was achieved with the GNDVI, the value being 0.645%.
The very strong correlation between the GNDVI and the dry matter values allow us to claim that the GNDVI also provides the best prediction performance within the linear model. In most of the hybrids studied, the dry matter estimation was below 1%, namely, 0.51% in the ES Joker, −0.01% in the ES Wellington, 0.33% in the KTG Karlaxx, and 0.86% in the Absolutissimo. The Rudolphino also showed a small relative deviation, at −1.52%. The advantage of the GNDVI lies in its high correlation with the biophysical parameters of the plants and low sensitivity to the other areas observed. The reflectance at the green wavelengths responds better to variations in the leaf chlorophyll content and the plant health. With the green band, the probability of capturing nutrient deficiency differences, which correlate with the eventual plant production, is higher.
Using the dry matter values established as shown above facilitates predicting the optimum harvest in any corn hybrid.

4.5. Comparing the Results

This article develops the outcomes of study [1], connecting them with novel research and outlining a more comprehensive approach to the problem. While the referenced source [1] evaluates one corn hybrid in one season, the present article discusses the relationship between the dry matter and the vegetation indices over data collected during three years, confirming that the results are valid for not merely a single hybrid, but generally. In contrast, no statistically significant relationship to the CF has been shown, and the starch value appeared to be relevant only in the NDVI.
Article [20] examines regression models for estimating crop yield via the NDVI and measurements of relative crop yields (paddy rice, winter wheat, and corn); the authors recommend using the models especially in areas where the crop types are not exactly known.
In report [41], the dry matter value was confirmed via field reflectance measurements executed with multispectral systems (Landsat 8, RapidEye). By comparison, our approach, when confronted with the satellite image-based data acquisition, offers the advantage of a higher resolution in the imaging and map forming, and this capability then ensures better data accuracy.
The results of the experiment herein confirm the vegetation-to-nutritional index data correlation detailed elsewhere, especially in the referenced source [45]. The central asset of our article nevertheless lies in the specified mathematical relationships between the vegetation and the nutritional indices; these instruments, importantly, facilitate determining the dry matter value from an entire field and thus optimizing the harvest time.

4.6. Limitations of the Approach

The proposed method of UAV multispectral camera field scanning and vegetation-index-based dry matter computation includes uncertainties; these uncertainties rest in the quality of the multispectral sensor and also its calibration to suit the season and environment.
The repeatability of the procedure depends on the weather conditions, as the operation of an unmanned aerial vehicle is affected by rain, wind, and location of the crops to be monitored (for example, in a drone flight restriction zone). A major disadvantage is the limited range of an UAV: Over areas larger than 200 ha, imaging with this method becomes challenging due to the battery capacity. Alternatively, fixed-wing UAVs may be employed because they provide a longer range per battery (~50 min); the eBee X, however, delivers up to 90 min. Using a drone is effective only for large vegetation units.

5. Conclusions

Analyzing multispectral images by using precise knowledge of crop health is one of the processes that supports the transition from traditional farming to precision agriculture. Increasing the quality of harvested corn and reducing the feed crop consumption by determining the correct harvest time will produce an innovative approach, namely, non-contact analysis of the plant at different stages of growth; this technique will offer a potential for automated and rapidly scalable application in most types of cultivated vegetation. In corn, the appropriate harvest time is established from the amount of dry matter, depending on whether the chopped plants are to be ensiled for fodder or used as methane production material in a biogas plant. Thus, up-to-date, accurate knowledge of the nutritional values, ideally collected across the crop field, embodies an essential factor in selecting the right time window.
Such goals and tasks can be effectively performed by means of remote sensing with a UAV-mounted multispectral camera and via the equations set out in Figure 4. The discussed method eliminates the need for chemical analysis of samples collected from only a few locations in a large field that supports heterogeneous vegetation. Specifying the optimum harvest period is assigned considerable ecological and economic importance, especially if related to the entire processing chain; The authors proceed from optimum corn harvesting based on the pre-determined volume of dry matter to methane production in biogas plants, respecting also the links between feed crop and cow milk.
The vegetation relationship graphs in Figure 4 lead to equations that find use in predicting the optimum harvest time via dry matter values. Evaluating the information from the above chapters, we can conclude that the greatest prediction relevance is embedded in Equation (16), which defines the relationship between the GNDVI and dry matter. Results characterizable as very good but somewhat inferior to those obtained for the GNDVI were found in the NDVI–dry matter relationship (15). The GNDVI and NDVI values also allow for estimating the yield characteristics, such as the YFM and YDM.
In view of the very strong correlation between the GNDVI and dry matter content values, the GNDVI can be described as having the best prediction results in the linear model.
The main benefits of the method include the general validity of the relationships between the vegetation indices and the dry matter for different corn hybrids. Conversely, a central disadvantage lies in the sensitivity to climatic conditions; The sensing is not feasible during rain or heavy winds.

Author Contributions

Conceptualization, J.J. and V.J.; methodology, J.J. V.J. and P.M.; data curation, J.J., V.J. and H.S.; writing—original draft preparation, J.J., V.J., P.M., H.S. and P.D.; funding acquisition, P.R. All authors have read and agreed to the published version of the manuscript.

Funding

This paper was funded from the general student development project at Brno University of Technology.

Data Availability Statement

The data presented in this study are available on request from the corresponding author.

Conflicts of Interest

The authors declare no conflict of interest.

References

  1. Janoušek, J.; Jambor, V.; Marcoň, P.; Dohnal, P.; Synková, H.; Fiala, P. Using UAV-Based Photogrammetry to Obtain Correlation between the Vegetation Indices and Chemical Analysis of Agricultural Crops. Remote Sens. 2021, 13, 1878. [Google Scholar] [CrossRef]
  2. Minařík, R.; Langhammer, J.; Lendzioch, T. Detection of Bark Beetle Disturbance at Tree Level Using UAS Multispectral Imagery and Deep Learning. Remote Sens. 2021, 13, 4768. [Google Scholar] [CrossRef]
  3. Vetrekar, N.T.; Gad, R.S.; Fernandes, I.; Parab, J.S.; Desai, A.R.; Pawar, J.D.; Naik, G.M.; Umapathy, S. Non-invasive hyperspectral imaging approach for fruit quality control application and classification: Case study of apple, chikoo, guava fruits. J. Food Sci. Technol. 2015, 52, 6978–6989. [Google Scholar] [CrossRef]
  4. Park, B.; Lawrence, K.C.; Windham, W.R.; Smith, D.P. Multispectral imaging system for fecal and igesta detection on poultry carcasses. J. Food Process Eng. 2004, 27, 311–327. [Google Scholar] [CrossRef]
  5. Cen, H.; Lu, R.; Zhu, Q.; Mendoza, F. Nondestructive detection of chilling injury in cucumber fruit using hyperspectral imaging with feature selection and supervised classification. Postharvest Biol. Technol. 2016, 111, 352–361. [Google Scholar] [CrossRef]
  6. Lleó, L.; Barreiro, P.; Ruiz-Altisent, M.; Herrero, A. Multispectral images of peach related to firmness and maturity at harvest. J. Food Eng. 2009, 93, 229–235. [Google Scholar] [CrossRef] [Green Version]
  7. Zhang, H.; Paliwal, J.; Jayas, D.S.; White, N.D.G. Classification of Fungal Infected Wheat Kernels Using Near-Infrared Reflectance Hyperspectral Imaging and Support Vector Machine. Trans. ASABE Am. Soc. Agric. Biol. Eng. 2007, 50, 1779–1785. [Google Scholar] [CrossRef]
  8. Lukas, V.; Huňady, I.; Kintl, A.; Mezera, J.; Hammerschmiedt, T.; Sobotková, J.; Brtnický, M.; Elbl, J. Using UAV to Identify the Optimal Vegetation Index for Yield Prediction of Oil Seed Rape (Brassica napus L.) at the Flowering Stage. Remote Sens. 2022, 14, 4953. [Google Scholar] [CrossRef]
  9. Duffková, R.; Poláková, L.; Lukas, V.; Fučík, P. The Effect of Controlled Tile Drainage on Growth and Grain Yield of Spring Barley as Detected by UAV Images, Yield Map and Soil Moisture Content. Remote Sens. 2022, 14, 4959. [Google Scholar] [CrossRef]
  10. Gracia-Romero, A.; Vergara-Díaz, O.; Thierfelder, C.; Cairns, J.E.; Kefauver, S.C.; Araus, J.L. Phenotyping Conservation Agriculture Management Effects on Ground and Aerial Remote Sensing Assessments of Maize Hybrid Performance in Zimbabwe. Proceedings 2018, 2, 7. [Google Scholar] [CrossRef] [Green Version]
  11. Yang, B.; Zhu, W.; Rezaei, E.E.; Li, J.; Sun, Z.; Zhang, J. The Optimal Phenological Phase of Maize for Yield Prediction with High-Frequency UAV Remote Sensing. Remote Sens. 2022, 14, 1559. [Google Scholar] [CrossRef]
  12. Matese, A.; Toscano, P.; Gennaro, S.F.; Genesio, L.; Vaccari, F.P.; Primicerio, J.; Belli, C.; Zaldei, A.; Bianconi, R.; Gioli, B. Intercomparison of UAV, aircraft and satellite remote sensing platforms for precision viticulture. Remote Sens. 2015, 7, 2971–2990. [Google Scholar] [CrossRef] [Green Version]
  13. Kumar, A.; Desai, S.V.; Balasubramanian, V.N.; Rajalakshmi, P.; Guo, W.; Naik, B.B.; Balram, M.; Desai, U.B. Efficient Maize Tassel-Detection Method using UAV based remote sensing. Remote Sens. Appl. Soc. Environ. 2021, 23, 100549. [Google Scholar] [CrossRef]
  14. Yao, H.; Qin, R.; Chen, X. Unmanned Aerial Vehicle for Remote Sensing Applications—A Review. Remote Sens. 2019, 11, 1443. [Google Scholar] [CrossRef] [Green Version]
  15. Su, W.; Zhang, M.; Bian, D.; Liu, Z.; Huang, J.; Wang, W.; Wu, J.; Guo, H. Phenotyping of Corn Plants Using Unmanned Aerial Vehicle (UAV) Images. Remote Sens. 2019, 11, 2021. [Google Scholar] [CrossRef] [Green Version]
  16. Lei, L.; Qiu, C.; Li, Z.; Han, D.; Han, L.; Zhu, Y.; Wu, J.; Xu, B.; Feng, H.; Yang, H.; et al. Effect of Leaf Occlusion on Leaf Area Index Inversion of Maize Using UAV–LiDAR Data. Remote Sens. 2019, 11, 1067. [Google Scholar] [CrossRef] [Green Version]
  17. Louis, J.; Pflug, B.; Main-Knorn, M.; Debaecker, V.; Mueller-Wilm, U.; Iannone, R.Q.; Cadau, E.G.; Boccia, V.; Gascon, F. Sentinel-2 Global Surface Reflectance Level-2a Product Generated with Sen2Cor. In Proceedings of the IGARSS 2019—2019 IEEE International Geoscience and Remote Sensing Symposium, Yokohama, Japan, 28 July–2 August 2019; pp. 8522–8525. [Google Scholar] [CrossRef] [Green Version]
  18. Drusch, M.; Del Bello, U.; Carlier, S.; Colin, O.; Fernandez, V.; Gascon, F.; Hoersch, B.; Isola, C.; Laberinti, P.; Martimort, P.; et al. Sentinel-2: ESA’s Optical High-Resolution Mission for GMES Operational Services. Remote Sens. Environ. 2012, 120, 25–36. [Google Scholar] [CrossRef]
  19. Islam, M.R.; Garcia, S.C. Prediction of Dry Matter Yield of Hybrid Forage Corn Grown for Silage. Crop Sci. 2014, 54, 2362–2372. [Google Scholar] [CrossRef]
  20. Huang, J.; Wang, H.; Dai, Q.; Han, D. Analysis of NDVI Data for Crop Identification and Yield Estimation. IEEE J. Sel. Top. Appl. Earth Obs. Remote Sens. 2014, 7, 4374–4384. [Google Scholar] [CrossRef]
  21. Wang, J.; Rich, P.M.; Price, K.P.; Kettle, W.D. Relationships between NDVI, Grassland Production, and Crop Yield in the Central Great Plains. Geocarto Int. 2005, 20, 5–11. [Google Scholar] [CrossRef]
  22. Cabrera-Bosquet, L.; Molero, G.; Stellacci, A.; Bort, J.; Nogués, S.; Araus, J. NDVI as a potential tool for predicting biomass, plant nitrogen content and growth in wheat genotypes subjected to different water and nitrogen conditions. Cereal Res. Commun. 2011, 39, 147–159. [Google Scholar] [CrossRef]
  23. Sakamoto, T.; Gitelson, A.A.; Arkebauer, T.J. Near real-time prediction of U.S. corn yields based on time-series MODIS data. Remote Sens. Environ. 2014, 147, 219–231. [Google Scholar] [CrossRef]
  24. Ines, A.V.; Das, N.N.; Hansen, J.W.; Njoku, E.G. Assimilation of remotely sensed soil moisture and vegetation with a crop simulation model for maize yield prediction. Remote Sens. Environ. 2013, 138, 149–164. [Google Scholar] [CrossRef] [Green Version]
  25. Johnson, D.M. An assessment of pre- and in-season remotely sensed variables for forecasting corn and soybean yields in the United States. Remote Sens. Environ. 2014, 141, 116–128. [Google Scholar] [CrossRef]
  26. Ma, Y.; Zhang, Z.; Kang, Y.; Özdoğan, M. Corn yield prediction and uncertainty analysis based on remotely sensed variables using a Bayesian neural network approach. Remote Sens. Environ. 2021, 259, 112408. [Google Scholar] [CrossRef]
  27. de Oliveira, M.F.; Ortiz, B.V.; Morata, G.T.; Jiménez, A.-F.; Rolim, G.D.S.; da Silva, R.P. Training Machine Learning Algorithms Using Remote Sensing and Topographic Indices for Corn Yield Prediction. Remote Sens. 2022, 14, 6171. [Google Scholar] [CrossRef]
  28. Tang, Z.; Guo, J.; Xiang, Y.; Lu, X.; Wang, Q.; Wang, H.; Cheng, M.; Wang, H.; Wang, X.; An, J.; et al. Estimation of Leaf Area Index and Above-Ground Biomass of Winter Wheat Based on Optimal Spectral Index. Agronomy 2022, 12, 1729. [Google Scholar] [CrossRef]
  29. Muruganantham, P.; Wibowo, S.; Grandhi, S.; Samrat, N.H.; Islam, N. A Systematic Literature Review on Crop Yield Prediction with Deep Learning and Remote Sensing. Remote Sens. 2022, 14, 1990. [Google Scholar] [CrossRef]
  30. van Klompenburg, T.; Kassahun, A.; Catal, C. Crop Yield Prediction Using Machine Learning: A Systematic Literature Review. Comput. Electron. Agric. 2020, 177, 105709. [Google Scholar] [CrossRef]
  31. Khalil, Z.H.; Abdullaev, S.M. Neural Network for Grain Yield Predicting Based Multispectral Satellite Imagery: Comparative Study. Procedia Comput. Sci. 2021, 186, 269–278. [Google Scholar] [CrossRef]
  32. Pant, J.; Pant, R.P.; Kumar Singh, M.; Pratap Singh, D.; Pant, H. Analysis of Agricultural Crop Yield Prediction Using Statistical Techniques of Machine Learning. Mater. Today Proc. 2021, 46, 10922–10926. [Google Scholar] [CrossRef]
  33. Ilyas, Q.; Ahmad, M.; Mehmood, A. Automated Estimation of Crop Yield Using Artificial Intelligence and Remote Sensing Technologies. Bioengineering 2023, 10, 125. [Google Scholar] [CrossRef]
  34. Wang, R.; Cherkauer, K.; Bowling, L. Corn Response to Climate Stress Detected with Satellite-Based NDVI Time Series. Remote Sens. 2016, 8, 269. [Google Scholar] [CrossRef] [Green Version]
  35. Mkhabela, M.S.; Mkhabela, M.S.; Mashinini, N.N. Early maize yield forecasting in the four agro-ecological regions of Swaziland using NDVI data derived from NOAA’s-AVHRR. Agric. For. Meteorol. 2005, 129, 1–9. [Google Scholar] [CrossRef]
  36. Coelho, A.P.; Rosalen, D.L.; Faria, R.T. Vegetation indices in the prediction of biomass and grain yield of white oat under irrigation levels. Trop. Agric. Res. 2018, 48, 109–117. [Google Scholar] [CrossRef] [Green Version]
  37. Bretas, I.L.; Valente, D.S.; Silva, F.F.; Chizzotti, M.L.; Paulino, M.F.; D’áurea, A.P.; Paciullo, D.S.; Pedreira, B.C.; Chizzotti, F.H. Prediction of aboveground biomass and dry-matter content in Brachiaria pastures by combining meteorological data and satellite imagery. Grass Forage Sci. 2021, 76, 340–352. [Google Scholar] [CrossRef]
  38. Svotwa, E.; Masuka, J.A.; Maasdorp, B.; Murwira, A. Spectral Indices: In-Season Dry Mass and Yield Relationship of Flue-Cured Tobacco under Different Planting Dates and Fertiliser Levels. Int. Sch. Res. Not. 2013, 2013, 816767. [Google Scholar] [CrossRef] [Green Version]
  39. Maresma, A.; Chamberlain, L.; Tagarakis, A.; Kharel, T.; Godwin, G.; Czymmek, K.J.; Shields, E.; Ketterings, Q.M. Accuracy of NDVI-derived corn yield predictions is impacted by time of sensing. Comput. Electron. Agric. 2020, 169, 105236. [Google Scholar] [CrossRef]
  40. Rahetlah, B.V.; Salgado, P.; Andrianarisoa, B.; Tillard, E.; Razafindrazaka, H.; Le Mezo, L.; Ramalanjaona, V.L. Relationship between normalized difference vegetation index (NDVI) and forage biomass yield in the Vakinankaratra region, Madagascar. Livest. Res. Rural. Dev. 2014, 26, 1–11. [Google Scholar]
  41. Gerighausen, H.; Lilienthal, H.; Jarmer, T.; Siegmann, B. Evaluation of leaf area index and dry matter predictions for crop growth modelling and yield estimation based on field reflectance measurements. eARSeL eProceedings 2016, 14, 71–90. [Google Scholar]
  42. Junior, A.S.D.A.; Melo, F.D.B.; Bastos, E.A.; Cardoso, M.J. Evaluation of The Nutritional Status of Corn by Vegetation Indices Via Aerial Images. Ciência Rural 2021, 51, 1–13. [Google Scholar] [CrossRef]
  43. de Souza, R.; Peña-Fleitas, M.T.; Thompson, R.B.; Gallardo, M.; Padilla, F.M. Assessing Performance of Vegetation Indices to Estimate Nitrogen Nutrition Index in Pepper. Remote Sens. 2020, 12, 763. [Google Scholar] [CrossRef] [Green Version]
  44. Flores, M.D.S.; Paschoalete, W.M.; Baio, F.H.R.; Campos, C.N.S.; Pantaleão, A.D.A.; Teodoro, L.P.R.; Júnior, C.A.D.S.; Teodoro, P.E. Relationship between Vegetation Indices and Agronomic Performance of Maize Varieties under Different Nitrogen Rates. Biosci. J. 2020, 36, 1638–1644. [Google Scholar] [CrossRef]
  45. Zhao, X.; Wang, S.L.; Wen, T.; Xu, J.; Huang, B.; Yan, S.; Gao, G.; Zhao, Y.; Li, H.; Qiao, J.; et al. On Correlation between Canopy Vegetation and Growth Indexes of Maize Varieties with Different Nitrogen Efficiencies. Open Life Sci. 2023, 18, 1–12. [Google Scholar] [CrossRef] [PubMed]
  46. Janse, P.V.; Deshmukh, R.R.; Randive, P.U. Vegetation Indices for Crop Management: A Review. Int. J. Res. Anal. Rev. IJRAR 2019, 6, 1–4. [Google Scholar]
  47. Price, J. Leaf area index estimation from visible and near-infrared reflectance data. Remote Sens. Environ. 1995, 52, 55–65. [Google Scholar] [CrossRef]
  48. Panda, S.S.; Ames, D.P.; Panigrahi, S. Application of Vegetation Indices for Agricultural Crop Yield Prediction Using Neural Network Techniques. Remote Sens. 2010, 2, 673–696. [Google Scholar] [CrossRef] [Green Version]
  49. Xue, J.; Su, B. Significant Remote Sensing Vegetation Indices: A Review of Developments and Applications. J. Sens. 2017, 2017, 1353691. [Google Scholar] [CrossRef] [Green Version]
  50. Buma, W.G.; Lee, S.-I. Multispectral Image-Based Estimation of Drought Patterns and Intensity around Lake Chad, Africa. Remote Sens. 2019, 11, 21. [Google Scholar] [CrossRef] [Green Version]
  51. Corrigan, F. Multispectral Imaging Camera Drones in Farming Yield Big Benefits. DroneZon, 2020. Available online: https://www.dronezon.com/learn-about-drones-quadcopters/multispectral-sensor-drones-in-farming-yield-big-benefits/(accessed on 22 March 2020).
  52. Cammarano, D.; Fitzgerald, G.; Basso, B.; O’Leary, G.; Chen, D.; Grace, P.; Fiorentino, C. Use of the Canopy Chlorophyll Content Index (CCCI) for Remote Estimation of Wheat Nitrogen Content in Rainfed Environments. Agron. J. 2011, 103, 1597–1603. [Google Scholar] [CrossRef]
  53. Bausch, W.C.; Halvorson, A.D.; Cipra, J. Quickbird satellite and ground-based multispectral data correlations with agronomic parameters of irrigated maize grown in small plots. Biosyst. Eng. 2008, 101, 306–315. [Google Scholar] [CrossRef]
  54. Gitelson, A.A.; Merzlyak, M.N. Remote sensing of chlorophyll concentration in higher plant leaves. Adv. Space Res. 1998, 22, 689–692. [Google Scholar] [CrossRef]
  55. ÚKZÚZ. Methods of Plant Variety State Tests CISTA, Pursuant to the Valid Wording from the Year 1999; ÚKZÚZ: Brno, Czech Republic, 1999. [Google Scholar]
  56. Achen, C.H. What Does “Explained Variance” Explain? A Reply. Political Anal. 1990, 2, 173–184. [Google Scholar] [CrossRef]
Figure 1. A block diagram outlining the actual specification, (A), and verification, (B), of the relationships between the vegetation indices and nutritional values in various types of corn hybrids.
Remotesensing 15 03152 g001
Figure 2. (a) Visualizing the overall area of the experiment; (b) positioning the corn fields that were subjected to the photogrammetric imaging in the relevant subsector of the South Moravian Region, Moravia, Czech Republic.
Remotesensing 15 03152 g002
Figure 3. Capturing the image data with a drone-mounted RedEdge camera.
Remotesensing 15 03152 g003
Figure 4. The relationships between the dry matter and the vegetation indices NDVI, NDRE, GNDVI.
Remotesensing 15 03152 g004
Figure 5. The vegetation indices vs. dry matter, considering the above Formulas (14)–(16).
Remotesensing 15 03152 g005
Figure 6. The selected photogrammetric maps.
Remotesensing 15 03152 g006
Table 1. The parameters of the RedEdge Micasense camera bands.
Band NumberBand ColorWavelength
[nm]
Bandwidth
[nm]
Calibration Panel Reflectance
1Blue (B)475200.56
2Green (G)560200.56
3Red (R)668100.55
4Near infrared (NIR)840400.54
5Red Edge (RE)717100.50
Table 2. The laboratory nutritional data relating to the individual silage corn sampling instances in 2019.
2019 Silage HybridSampling Cases
1.2.3.4.
Nutritional Analysis
DM [g/kg]179.7216.9303.8340.3
CP [g/kg DM]117.093.481.4094.2
CF [g/kg DM]343.3317.6224.7194.1
Starch [g/kg DM]10.813.617.229.8
Ash [g/kg DM]56.249.733.532.6
NDF [g/kg]624.7638.2473.1345.2
Table 3. The laboratory nutritional data relating to the individual grain corn sampling instances in 2019.
2019 Grain HybridSampling Cases
1.2.3.4.5.
Nutritional Analysis
DM [g/kg]198.4237.0338.6390.8462.5
CP [g/kg DM]118.5104.6100.499.491.6
CF [g/kg DM]312.6304.9226.1329.6320.2
Starch [g/kg DM]2.731.181.7303.7393.2
Ash [g/kg DM]57.048.144.660.363.9
NDF [g/kg]613.4603.7370.5343.8338.4
Table 4. The laboratory nutritional data relating to the individual silage corn sampling instances in 2020.
2020 Silage HybridSample Number
1.2.3.4.5.6.7.8.
Nutritional Analysis
DM [g/kg]197.2193.2224.4319.7308.8355.7359.4449.5
CP [g/kg DM]114.6102.698.191.188.078.479.076.6
CF [g/kg DM]364.0335.0306.8238.0250.1198.8223.3225.7
Starch [g/kg DM]6.021.8153.9273.2319.8344.5349.6398.8
Ash [g/kg DM]68.456.555.848.445.739.044.041.4
NDF [g/kg]684.1639.6598.6403.0452.4410.0432.3448.1
DNDF [%]43.651.655.650.352.758.950.256.4
DOM [%]52.360.558.773.376.276.977.178.8
Yield Characteristics
FM [kg/10 plants]8.79.210.610.69.99.89.87.3
EW [kg/10 plants]NANANA0.0NA3.43.62.9
YFM [kg/ha]69,36073,94784,56084,66778,96078,69378,34758,320
YDM [kg/ha]13,73714,31718,97927,08024,45628,01328,17326,186
Table 5. The laboratory nutritional data relating to the individual instances of sampling the corn hybrid DKC 3568 in 2021.
2021 DKC 3568Sample Number
1.2.3.4.5.6.7.8.
Nutrition Analysis
DM [g/kg]218.30243.53325.60349.53401.43424.37479.33522.87
CP [g/kg DM]105.093.0072.1072.8070.068.065.065.0
CF [g/kg DM]300.0275.5246.2250.2406.3433.6412.7428.5
Starch [g/kg DM]15.027.581.2208.8250.0300.0350.0380.0
Ash [g/kg DM]50.042.338.026.233.031.232.830.9
NDF [g/kg]630.0604.5531.2552.9656.7661.3657.2662.8
DNDF [%]55.058.751.448.725.724.022.426.9
DOM [%]70.072.374.367.441.541.441.244.1
Yield Characteristics
FM [kg/10 plants]7.06.736.995.995.505.405.104.80
EW [kg/10 plants]NANANANANANANANA
YFM [kg/ha]56,00053,84055,92047,92044,00043,20040,80038,400
YDM [kg/ha]12,22513,11218,20816,75017,66318,33319,55720,078
Table 6. The laboratory nutritional data relating to the individual instances of sampling the corn hybrid DKC 4279 in 2021.
2021 DKC 4279Sample Number
1.2.3.4.5.6.7.8.
Nutrition Analysis
DM [g/kg]213.60228.43256.30294.77338.23357.90389.00470.33
CP [g/kg DM]105.079.2101.873.370.068.065.065.0
CF [g/kg DM]300.0288.7271.3248.8330.7378.3385.8430.0
Starch [g/kg DM]15.02.660.3141.7250.0300.0350.0380.0
Ash [g/kg DM]50.053.053.741.331.032.437.035.1
NDF [g/kg]630.0572.0578.1487.4545.7597.0616.4687.8
DNDF [%]55.046.551.034.925.323.825.426.5
DOM [%]70.065.668.367.751.145.737.942.3
Yield Characteristics
FM [kg/10 plants]7.07.536.296.875.505.405.104.80
EW [kg/10 plants]NANANANANANANANA
YFM [kg/ha]56,00060,24050,32054,96044,00043,20040,80038,400
YDM [kg/ha]11,96213,76112,89716,20014,88215,46115,87118,061
Table 7. The statistical relevance of the correlated data acquired through the multispectral scanning and the chemical analysis.
SamplingVegetation
Index
Nutritional AnalysisYield Characteristics
DM
[g/kg]
CF
[g/kg DM]
Starch [g/kg DM]DNDF
[%]
DOM
[%]
FM
[kg/10 plants]
YFM
[kg/ha]
YDM [kg/ha]
2019 silage hybridNDVI2.992.8710.49NANANANANA
NDRE5.164.7436.40NANANANANA
GNDVI4.053.652.18NANANANANA
2019 grain hybridNDVI8.510.134.04NANANANANA
NDRE11.930.144.54NANANANANA
GNDVI12.970.367.40NANANANANA
2020 silage hybridNDVI5.743.244.621.674.190.990.992.87
NDRE5.903.034.261.013.301.131.132.95
GNDVI5.082.122.791.262.101.531.532.07
2021 DKC 3568NDVI5.425.515.515.455.215.695.693.00
NDRE4.032.222.802.382.012.452.453.41
GNDVI4.253.133.143.212.983.183.183.31
2021 DKC 4279NDVI5.636.365.233.004.604.704.702.76
NDRE3.323.843.342.552.943.443.442.00
GNDVI7.494.395.593.123.795.905.903.15
Table 8. The vegetation indices computed from the spectral reflectance values.
Corn Hybrid NameSpectral ReflectanceVegetation Indices
B [%]G [%]R [%]RE [%]NIR [%]NDVINDREGNDVI
EC Joker410825560.7500.3830.697
EC Wellington410824550.7460.3920.692
KTG Karlaxx59724590.7880.4220.735
Absolutissimo69723540.7700.4030.714
Rudolfinio69723580.7850.4320.731
Table 9. The conventionally true and the predicted dry matter values for the individual hybrids.
Corn HybridEC JokerEC WellingtonKTG KarlaxxAbsolutissimoRudolfinio
Nutritional analysis
D M C T V [g/kg]
459.11470.83383.53423.17398.67
NDVI D M P V [g/kg]458.86464.53404.74429.58409.41
Δ DM   g / kg −0.26−6.31−21.21−6.41−10.74
δ DM   % −0.03−1.36−5.24−1.49−2.62
NDRE D M P V [g/kg]457.69443.85402.02429.29387.14
Δ DM   g / kg −1.42−26.9818.496.12−11.52
δ DM   % −0.31−6.084.601.43−2.98
GNDVI D M P V [g/kg]461.46470.78384.81426.83392.71
Δ DM   g / kg 2.35−0.051.283.66−5.95
δ DM   % 0.51−0.010.330.86−1.52
Disclaimer/Publisher’s Note: The statements, opinions and data contained in all publications are solely those of the individual author(s) and contributor(s) and not of MDPI and/or the editor(s). MDPI and/or the editor(s) disclaim responsibility for any injury to people or property resulting from any ideas, methods, instructions or products referred to in the content.

