Abstract
The Cook Glacier drains a significant portion of the Wilkes Subglacial Basin, the largest subglacial basin in East Antarctica—which feeds the Cook Ice Shelf. The ice velocity of the Cook Ice Shelf needs to be monitored precisely and accurately, as it plays a critical role in determining the ice discharge from the Wilkes Subglacial Basin. In this study, we measured the annual ice velocities of the Cook Ice Shelf using the offset tracking technique on Sentinel-1 synthetic aperture radar images obtained from 2017 to 2022. Time-series offsets in the range and azimuth directions were determined from the offset tracking pairs with a temporal baseline of 36 days obtained from January to December of each year. Statistical evaluations of the spatiotemporal variations of the time-series offsets effectively eliminated the erroneous offsets in the original offset fields; the remaining offsets were then used to produce two-dimensional annual ice velocities. The direction of the ice flow of the Cook Ice Shelf was almost constant during the period 2017–2022, and the variations in the magnitude of annual ice velocities were investigated. The annual ice velocities of the Cook East Ice Shelf (CEIS) stayed constant and showed a gradual increase from the grounding line to the ice front, except in the western part. Ice velocities of the western part of the CEIS have not changed much at the grounding line during the 6-year period, while in the dynamic shelf ice zone, ice velocities accelerated by up to 22% because of the development of numerous crevasses and fractures. The ice velocities of the Cook West Ice Shelf (CWIS) were about two times higher than those of the CEIS and tended to increase rapidly from the grounding line to the ice front. The annual ice velocities at the grounding line of CWIS increased rapidly from 1330 to 1450 m/a over 6 years, with 70% of this acceleration observed after 2021. This was attributed to a reduction in the ice shelf volume because of the evolution of surface crevasses and rifts, leading to a decrease in the ice shelf’s buttressing potential. In particular, the loss of a portion of the dynamic shelf ice zone due to a series of ice front collapses in February 2022 likely caused the rapid speed-up of the ice shelf. The results of this study indicate that the buttressing potential of the CWIS and the western part of the CEIS has been significantly reduced, which could mean serious instability of the marine ice sheet in this region.
1. Introduction
An ice shelf is a floating extension of an ice sheet that is grounded on land. Ice shelves function as a barrier against seaward ice discharge from inland, thus helping to maintain the mass balance of the ice sheets [1,2]. However, the instability of the ice shelf as a result of flow acceleration and collapse at the ice front could weaken the buttressing effect of the ice shelf and increase ice discharge from marine ice sheets, which could potentially contribute to the rise in sea levels [3,4,5,6]. Therefore, it is essential to monitor the changes in ice velocities and collapse events on the ice shelves.
Most of the Antarctic ice shelves that show rapid flow acceleration and frequent large-scale collapses are found in West Antarctica [7,8,9]. Among them, the ice shelves in the Amundsen Sea Embayment have been reported to contribute substantially to the rise in sea levels [10,11]. The ice velocity of the Pine Island Glacier Ice Shelf, one of the fastest-flowing ice shelves in the Amundsen Sea Embayment, increased by ~1.5 km/a between 2000 and 2010 due to ice thinning caused by ocean-induced basal melting [12,13]. Between 2017 and 2020, about 20% of the total area of the Pine Island Glacier Ice Shelf collapsed at the ice front, which resulted in an increase in ice flow of more than 12% [14]. Ice velocities of the Thwaites Glacier Tongue, another representative ice shelf of the Amundsen Sea Embayment, increased by 33% between 2006 and 2013, reaching a maximum velocity higher than 4 km/a [13,15,16,17]. The ice flow accelerations of both these ice shelves have led to increased ice flux from the West Antarctic Ice Sheet, which is responsible for approximately 50% of the Antarctic-induced sea level rise over the past several decades [18]. On the other hand, most of the East Antarctic Ice Sheet is known to be in a state of stable mass balance [19,20]. However, some areas of East Antarctica have shown continuous mass loss. One of the basins with the largest mass loss in the East Antarctic Ice Sheet, the Wilkes Subglacial Basin, has a basin area of 840,000 km2 and contains an ice mass capable of raising the global mean sea level by 3–4 m [18,21,22,23]. Much of the ice mass in this basin drains into the ocean through the Cook Glacier, which feeds into the Cook Ice Shelf [18,21,24]. Since 1947, several large collapses at the ice front of the Cook Ice Shelf have caused dramatic fluctuations in ice velocities [25]. Variations in ice velocities and ice mass of the Cook Ice Shelf need to be monitored continuously because they are the result of changes in its buttressing potential and cause the mass imbalance of the Wilkes Subglacial Basin. However, to the best of our knowledge, the ice dynamics of the Cook Ice Shelf, including ice velocity variations and ice collapses, have not been studied since 2017.
Satellite remote sensing is an effective tool for making periodic observations of areas that are relatively inaccessible, such as Antarctica. In particular, synthetic aperture radar (SAR) is useful for observing Antarctic ice shelves because it can provide high resolution images regardless of weather conditions and sun altitudes [26,27,28,29,30,31,32]. Ice velocity can be measured by applying interferometric SAR (InSAR) or offset tracking techniques to SAR images [33,34,35,36]. InSAR is a technique for measuring surface displacement and topography by calculating the phase difference between two or more SAR images acquired at different times on the same area. InSAR can measure surface displacement with a precision of a few millimeters in the absence of interferometric phase errors and noise. However, the InSAR technique has some disadvantages that it is difficult to apply in fast-flowing glaciers because of low coherence, and that it can only measure displacement in the radar look direction. Offset tracking is a technique for measuring two-dimensional (range and azimuth direction) displacement by calculating the cross-correlation between image patches of two SAR images. The precision of displacement measurements using offset tracking is several meters to tens of meters, which is inferior compared to InSAR. Nevertheless, since offset tracking can measure large displacement, it is effectively used to monitor the ice velocities of fast-flowing glaciers and ice shelves [37,38,39,40,41]. However, erroneous results can be obtained using offset tracking when misregistration of SAR images occurs due to a few surface features, such as crevasses, or when inaccurate topographic information is used as ancillary data for image registration [42]. To measure ice velocities accurately, these erroneous offsets should be removed. However, identifying and removing such erroneous offsets caused by image misregistration is still difficult.
To accurately measure ice velocity, many studies have been performed to come up with methods for removing erroneous offsets from the offset tracking results of satellite images. In most of the suggested methods, erroneous offsets were identified and eliminated by setting thresholds for signal-to-noise ratio and the correlation of the offsets [43,44,45,46] or by statistical evaluations of the offset fields, assuming that the ice velocity of glaciers and ice shelves does not spatially vary significantly [12,47,48]. However, these methods are not applicable when the local variation in ice velocity is too significant, or when the erroneous offsets are spatially widely distributed. A better way to remove these erroneous offsets is needed to accurately measure ice velocity through offset tracking of SAR images.
In this study, the annual ice velocities from 2017 to 2022 of the Cook Ice Shelf were determined using the Senitnel-1 time-series SAR images, and the mechanisms and implications of the changes in ice velocity were investigated. An offset tracking technique was applied to the Sentinel-1 time-series SAR images to determine the annual ice velocities. We proposed a method to remove erroneous offsets from time-series offset maps and evaluated the method’s performance. The effects of the development of crevasses, fractures, rifts, and the resulting collapse events on the changes in the ice velocity were also studied. Moreover, changes in the buttressing potential of the Cook Ice Shelf in terms of the ice velocity change were estimated.
2. Study Area and Data
2.1. Cook Ice Shelf
The Cook Ice Shelf (68°39′S, 152°29′E) has an area of ~3500 km2 located between Cape Hudson and Cape Freshfield in the George V Coast, in East Antarctica (Figure 1). It is one of the major ice shelves that drain most of the ice in the Wilkes Subglacial Basin, which contains the most marine ice in East Antarctica [21,24]. The Cook Ice Shelf consists of the Cook East Ice Shelf (CEIS) and the Cook West Ice Shelf (CWIS). In December 2022, CEIS was measured to be ~60 km long and ~65 km wide, while CWIS was ~2.5 km long and ~15 km wide. The western part of CEIS has numerous crevasses and fractures (Figure 1), and collapses are common due to their development.
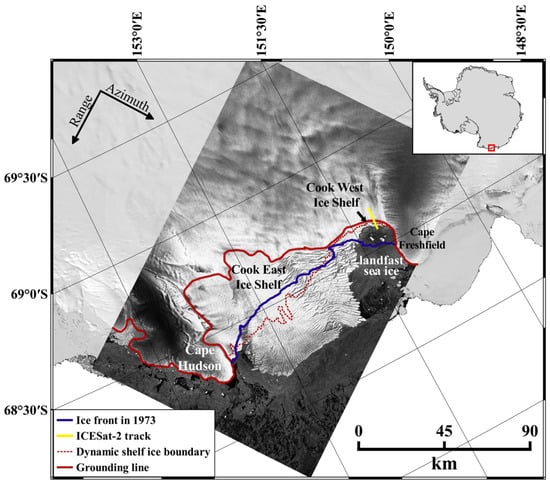
Figure 1.
Sentinel-1 SAR image of the Cook Ice Shelf on 23 December 2022. The red and blue solid lines represent the grounding line [49] and the ice front position in 1973 determined from the Landsat-1 images on 1 and 4 November 1973. The red dotted line represents the boundary between the dynamic shelf ice zone and the passive shelf ice zone. The yellow solid line indicates the ICESat-2 ground track used to analyze crevasse advance. The background is the Landsat Image Mosaic of Antarctica.
The ice front of CEIS retreated about 20 km because of large-scale calving events that occurred between 1963 and 1973. It continued to advance without significant collapse until 2017 [25,50]. From 2001 to 2016, the ice velocity of the CEIS remained nearly constant at about 490 m/a, except in the period 2006–2007 [25], when the ice velocity increased by about 12% compared to that in 2001–2016 due to the enhanced lubrication at the bed of the Cook Glacier caused by the drainage of the CookE2 subglacial lake (5.2 ± 1.5 km3) located ~450 km upstream [25,51]. The CWIS experienced massive calving events between 1947–1963 and 1973–1989, and the ice front retreated by ~34 km. The current area of the CWIS is only approximately ~60 km2. An embayment formed by the retreat of the CWIS, hereafter referred to as the Cook West Embayment, is covered by landfast sea ice during the winter.
2.2. Sentinel-1 SAR
Sentinel-1 SAR images have been used to measure the ice velocity of the Cook Ice Shelf. Sentinel-1, which is operated by the European Space Agency (ESA), is a constellation of two satellites (Sentinel-1A and -1B) equipped with a C-band SAR with a center frequency of 5.405 GHz [52]. The two satellites have the same orbit and have a revisit time of 12 days. If both satellites continuously observe the same area, it is possible to obtain images every 6 days. In this study, we used HH-polarized SAR images (10 m ground resolution), which were acquired in Interferometric Wide swath mode at the ascending node of Sentinel-1A and -1B (Path 10, Frame 944) from 4 February 2017 to 27 April 2022, and distributed in the Ground Range Detected High Resolution format with a spatial resolution of 10 m (Table 1). No observations were made on the Cook Ice Shelf through the Sentinel-1 satellites from 6 June 2018 to 17 July 2019 and from 4 November 2019 to 12 February 2020.

Table 1.
Sentinel-1 SAR images used to determine the annual ice velocity of the Cook Ice Shelf based on offset tracking.
2.3. ICESat-2 Surface Elevation Data
Crevassing and rifting of the ice shelf can make it vulnerable to collapse and weaken its buttressing potential [53]. Over the past few decades, the ice velocity of the CWIS has changed because of the development of fractures such as crevasses and rifts [25]. Large-scale calving events of CWIS attributed to the development of rifts occurred between 1973 and 1989, which caused the ice front to retreat by 13 km and increased the ice velocity from 692 ± 450 to 1438 ± 51 m/a [25]. In this study, surface elevation profiles from the Ice, Cloud, and land Elevation Satelite-2 (ICESat-2), equipped with the Advanced Topographic Laser Altimeter System (ATLAS) and operated by the National Aeronautics and Space Administration, were used to investigate the evolution and migration of surface crevasses on the CWIS. The repeat cycle of ICESat-2 is 91 days. The ATLAS creates three pairs of beams with a track spacing of ~3.3 km [54]. Each beam consists of a strong and a weak beam separated 90 m apart. A total of five ICESat-2 Land Ice Along-Track Height Products (ATL06, track number 108) obtained along a ground track that is approximately parallel to the main flow line of the CWIS from 4 January 2019 to 29 September 2021 were used. All ICESat-2 data used were obtained from the strong beam of the ground track pair number 2. The ICESat-2 ATL06 product provides the surface elevation measurements on the ice sheet with a precision of ~9 cm and an accuracy of ~3 cm, respectively [55].
2.4. Auxiliary Data
The Global Earth Topography and Sea Surface Elevation 30 (GETASSE30) Digital Elevation Model (DEM) was employed for the coregistration of the SAR images and for the orthorectification of the offset maps. The GETASSE30 DEM has a grid size of 1 km, but it has been effectively used for precise coregistration and accurate orthorectification of SAR images [56,57,58,59].
The Making Earth System Data Records for Use in Research Environments (MEaSUREs) multisensor-based [60] and the Inter-mission Time Series Land Ice Velocity and Elevation (ITS_LIVE) project-derived annual Antarctic ice velocity maps [61,62] were utilized to validate the ice velocities of the Cook Ice Shelf determined by the Sentinel-1 offset tracking conducted in this study. The MEaSUREs annual ice velocity maps were generated by a weighted average of the ice velocities obtained from the feature tracking of optical images and the SAR interferometry with a grid spacing of 1 × 1 km and temporal coverage from 2000 to 2001 and from 2005 to 2020 [60]. The ITS_LIVE annual ice velocities were estimated by a weighted average of the ice velocities derived from Landsat image pairs and are provided with a grid spacing of 240 × 240 m from 1985 to 2018 [61,62].
3. Methods
3.1. Sentinel-1 SAR Time-Series Offset Tracking
The SAR offset tracking is a technique that measures two-dimensional displacements in the range and azimuth directions by determining the cross-correlation of subimage patches between consecutive images acquired at different times over the same area [37,63]. In this study, an offset tracking based on normalized cross-correlation [37,64] was applied to the Sentinel-1 time-series SAR images to obtain the annual ice velocities of the Cook Ice Shelf. The offset tracking procedure was conducted through the Sentinel Application Platform (SNAP) software. The overall flowchart of the offset tracking is presented in Figure 2. First, the orbital information of the SAR image was updated using the Sentinel-1 precise orbit state vectors. The reference and secondary SAR images were coregistered using the GETASSE30 DEM, and the images were then subset into the region including the whole Cook Ice Shelf (Figure 1). To measure the ice velocity using offset tracking, it is important to select image pairs that have a suitable temporal baseline. In fast-flowing regions, image pairs with a short temporal baseline of several days are needed for offset tracking, while in regions with slow motion and little surface features such as crevasses, image pairs with a longer temporal baseline are acceptable. The Sentinel-1 SAR images of the study area include not only fast-flowing ice shelf regions but also slow-moving regions with few surface features. We tested Sentinel-1 SAR offset tracking with temporal baselines of 12, 24, and 36 days. In regions of Cook Ice Shelf with high ice velocities, the offset tracking results from all three temporal baselines produced dense and reliable ice velocities. However, in regions of ice sheet and ice shelf with slow motions, the offset tracking with the temporal baseline of 36 days produce more reliable ice velocities than the offset tracking with 12- and 24-day baselines. Therefore, offset tracking was performed using image pairs with a temporal baseline of 36 days to obtain as many accurate offsets as possible for the region of interest. Offset tracking was performed in a reference window of 40 × 40 pixels (400 × 400 m) and a search window of 256 × 256 pixels (2560 × 2560 m); offsets with a correlation coefficient lower than 0.05 was empirically determined to be unreliable and thus removed. Offset maps with a grid spacing of 400 × 400 m were generated for the range and azimuth directions, which were then used to create the maps of ice velocity in the x and y directions ( and ) on the polar stereographic coordinate. The and for the period between January and December of each year are used to produce the annual ice velocity maps for that year.
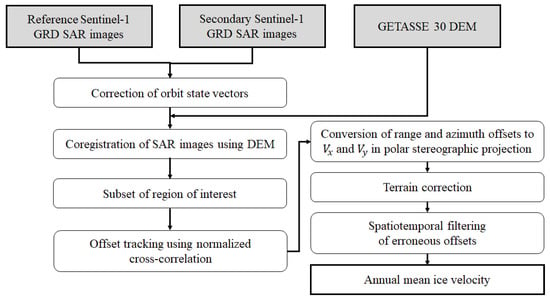
Figure 2.
Flowchart of data processing for the generation of annual ice velocity.
3.2. Erroneous Offset Filtering
Erroneous offsets can result from offset tracking due to misregistration of image pairs when large changes occur on the ice surface or if there are few surface features [42]. To generate a reliable map of ice shelf velocity, the erroneous offsets should be determined and removed. Although offsets with a cross-correlation coefficient of less than 0.05 were removed through the previous process, it is likely that incorrect offsets remain. Focusing on the advantage of the Sentinel-1 observation that offset tracking of a 36-day temporal baseline is possible every 12 days, we proposed a spatiotemporal filtering method for the determination and removal of erroneous offsets (Figure 3).
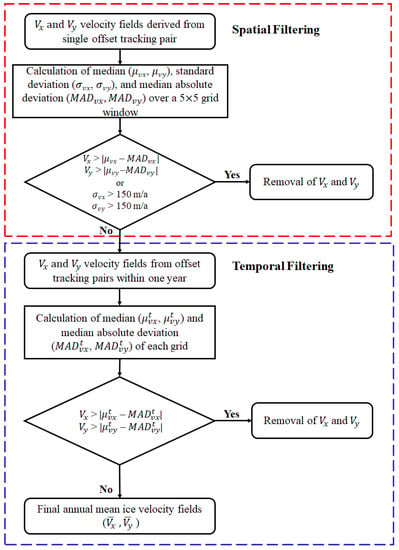
Figure 3.
Flowchart of the spatiotemporal filtering of time-series offsets for the determination and removal of erroneous offsets.
The filtering method for the erroneous offsets proposed in this study proceeds in two steps: (1) spatial filtering and (2) temporal filtering for the and fields, respectively. First, spatial filtering is conducted to remove erroneous and fields, assuming that the ice velocity of the ice shelf does not spatially vary significantly. Setting a 5 × 5 moving grid window (2 × 2 km) for the and fields, the standard deviation , median , and median absolute deviation () are calculated for the window. Two criteria are used to check if the value of or that corresponds to the center grid of the moving window is erroneous. First, for each of the and fields, if the value of the center grid differs from the and within the moving window by more than and , it is regarded as an outlier and removed. Second, if the and within the moving window are greater than 150 m/a, the velocity values ( and corresponding to the center grid are deemed to be erroneous and removed. The threshold of 150 m/a was chosen based on the investigation of the MEaSUREs ice velocities, which showed that ice velocities of the Cook Ice Shelf vary spatially by up to 100 m/a within a 2 × 2 km region. This spatial filtering process is applied to the and fields generated from all offset maps with a 36-day temporal baseline.
If erroneous velocity fields are distributed over a large area, some of them could remain even after the spatial filtering. To overcome this limitation, we propose a temporal filtering method operated in the time-series offset tracking results. Ice velocities can show temporal variations, such as seasonal fluctuations [65,66,67]. With the exception of ice shelves in the Antarctic Peninsula and the Amundsen Sea Embayment, the interannual variations in ice velocities would be insignificant relative to the time series mean velocity, provided there are no factors that cause a rapid variation in the velocity in a short period of time. There were no massive changes in the Cook Ice Shelf during our observation period. After the spatial filtering, the and maps generated from the offset tracking pairs between January and December of each year were compiled, and then the median () and median absolute deviation () were calculated for the compiled and fields. The ice velocity values ( and ) that deviates more than and from and , respectively, are deemed to be erroneous and removed. This temporal filtering process is conducted annually on the and velocities, after which the remaining and velocities are averaged and used to determine the annual ice velocities of the Cook Ice Shelf.
4. Results
4.1. Evaluation of the Performance of the Sentinel-1 Time-Series Offset Tracking
To evaluate the precision of the annual ice velocity of the Cook Ice Shelf derived from the Sentinel-1 time-series offset tracking, we investigated the magnitude of the annual mean velocity and its SD determined from the original offset fields, the offset fields with spatial filtering only, and the offset fields with spatial and temporal filtering. Figure 4a,b shows the annual ice velocity and its SD calculated from the original offset fields of the 36-day temporal baseline image pairs from January to December 2022. The annual velocity over the ice sheet varied significantly between 20 and 300 m/a, with SDs ranging from 100 to 1100 m/a. In the ice shelf region, especially at the ice front of the CEIS, very high annual velocities exceeding 1500 m/a and SDs larger than 900 m/a were locally calculated. These velocities were attributed to erroneous offsets. The annual ice velocity and its SD calculated from the spatially filtered offset fields are presented in Figure 4c,d. The number of velocity vectors decreased by 40% from 118,811 before the spatial filtering to 71,457 after filtering. We validated that the extremely high velocities in the CEIS were removed using the spatial filtering process. In the ice sheet region, however, there are still annual ice velocities with a large SD of 50–250 m/a, which is largely deviated from the surroundings. This means that it is difficult to adequately remove the erroneous offsets in the time-series offset fields using spatial filtering alone.
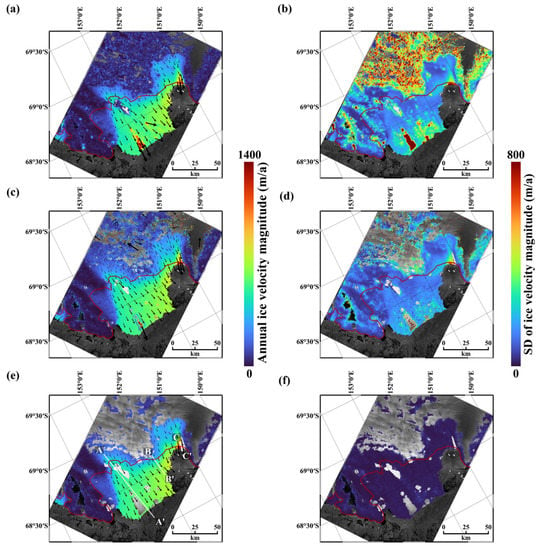
Figure 4.
Annual (2022) mean ice velocity in the flow direction and its standard variation of the Cook Ice Shelf calculated from (a,b) the original time-series offsets, (c,d) the time-series offsets with the spatial filtering alone, and (e,f) the time-series offsets with the spatiotemporal filtering. The black arrows in (a,c,e) represent the ice flow directions.
In the 2022 annual ice velocity calculated from the time-series offsets remaining after performing the spatiotemporal filtering proposed in this study (Figure 4e), there were almost no velocities that could be considered as erroneous, and the SDs of the annual ice velocities were also very small (<15 m/a) in most areas (Figure 4f). The annual ice velocity for some regions of the ice sheet was not derived after the spatiotemporal filtering because of the elimination of all offsets in the regions. Nevertheless, precise annual ice velocities were obtained for most regions within the Cook Ice Shelf, which is the region of interest in this study.
4.2. Validation of the Sentinel-1 Time-Series Offset Tracking
The precision of the annual ice velocity generated by averaging the velocity vectors determined from the offset tracking pairs within one year was evaluated through its magnitude and the standard deviation (SD) of the velocity vectors used to estimate the annual velocity. The SD of the annual ice velocity can represent the temporal variability of the ice flow. The accuracy of the annual ice velocity obtained from the time-series offset tracking was analyzed by comparing it with the MEaSUREs and ITS_LIVE annual ice velocity data. The MEaSUREs data were obtained from multisensor images acquired from July to June of the following year. Therefore, to reliably assess the accuracy of the annual ice velocity, Sentinel-1 SAR images should be acquired from July to June of the following year with no data void periods. The only period that meets this requirement was from July 2017 to June 2018. Therefore, the time-series offset tracking was applied to the Sentinel-1 SAR images acquired from 10 July 2017 to 5 June 2018, and spatiotemporal filtering was conducted on the original offsets to remove the erroneous ones. We then determined the annual ice velocity of the Cook Ice Shelf for July 2017 to June 2018, and compared it to the MEaSUREs annual ice velocity for 2017–2018. The annual coverage of the ITS_LIVE ice data is nearly complete for the years. The 2017 annual mean ice velocity determined from the Sentinel-1 time-series offset tracking was compared to the ITS_LIVE annual ice velocity for 2017. Our ice velocity maps have a grid spacing of 400 m, whereas the MEaSUREs and ITS_LIVE data has a grid spacing of 1 km and 240 m, respectively. To match the grid sizes of the two datasets, the MEaSUREs and ITS_LIVE ice velocity maps were resampled to a 400 m grid spacing using the nearest neighbor method.
The 2017–2018 annual ice velocity of the Cook Ice Shelf was obtained by applying offset tracking to the Sentinel-1 time-series SAR images obtained from July 2017 to June 2018 and the spatiotemporal filtering on the retrieved time-series offsets, which was compared with the 2017–2018 MEaSUREs annual ice velocity (Figure 5a–c). The differences (Sentinel-1 time-series offset tracking velocity—MEaSUREs velocity) in the image x-direction (Figure 5a), the image y-direction (Figure 5b), and the velocity magnitude (Figure 5c) between the two annual ice velocity data were smaller than ±45 m/a in most areas. However, on the Cape Hudson and Cape Freshfield, the relative differences in the velocities between the two data were significant, ranging from 50% to 120%. This is because the magnitude of the ice velocity is very small in these regions, and the differences in the velocity magnitude were only ~20 m/a. The difference in between the two data was larger than that in . Nevertheless, the velocity differences were smaller than 50 m/a in most of the ice shelf regions.
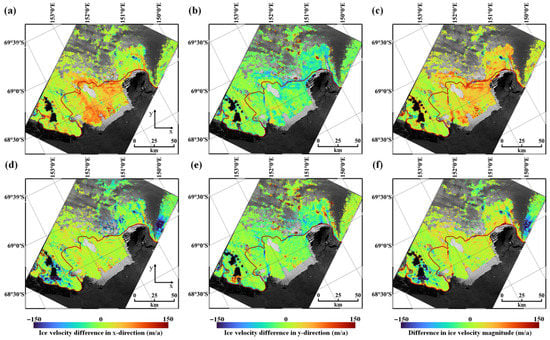
Figure 5.
Differences between the 2017–2018 annual mean ice velocity of the MEaSUREs data and that from the Sentinel-1 time-series SAR offset tracking, and between the 2017 annual mean ice velocity of the ITS_LIVE data and that from the Sentinel-1 time-series SAR offset tracking for (a,d) the image x-direction, (b,e) the image y-direction, and (c,f) flow direction, respectively.
The differences in the 2017 annual ice velocity fields between the ITS_LIVE data and that from the Sentinel-1 time-series SAR offset tracking (Sentinel-1 time-series offset tracking velocity—ITS_LIVE velocity) are shown in Figure 5d–f. Our annual ice velocities showed smaller differences (~±15 m/a in most of the ice shelf regions) from the ITS_LIVE velocities than the MEaSUREs velocities. The difference in (Figure 5d) was slightly larger than that in (Figure 5e), but only ~±20 m/a in the ice shelf regions.
The comparison of the annual ice velocity determined from the Sentinel-1 time-series SAR offset tracking with that from the reference data (the MEaSUREs and ITS_LIVE velocities) showed that the velocity difference in was larger than that in . This is because the image x-direction is more parallel to the Sentinel-1 SAR azimuth direction, where the sensitivity of displacement measurement by the offset tracking is lower than that in the SAR range direction. The annual ice velocity determined from the Sentinle-1 time-series SAR offset tracking deviated significantly from the MEaSUREs velocity near the grounding line and the ice front of the CWIS. This was possibly caused by the inaccuracy of the MEaSUREs data.
The evaluation results of the precision and accuracy of the ice velocity derived from the Sentinel-1 SAR images confirmed that the reliable annual ice velocities of the Cook Ice Shelf can be determined by the time-series offset tracking algorithm, implementing the spatiotemporal filtering method proposed in this study.
4.3. Variations in the Annual Ice Velocity of the Cook Ice Shelf
The annual ice velocities of the Cook Ice Shelf from 2017 to 2022 were determined by the time-series offset tracking of Sentinel-1 SAR images (Figure 6). Figure 6 demonstrates that the CEIS has had nearly constant ice velocity over the past 6 years, while the ice velocity in the CWIS has varied both spatially and temporally. The changes in the annual flow direction of the ice shelf were smaller than ± 3°, and its streamline remained nearly constant. Therefore, we focused on the variations in the velocity magnitude instead of the variations in annual and . The variations in velocity magnitude were investigated along the main flow lines of the CEIS (the profile A–A′ in Figure 4e) and the CWIS (the profile C–C′ in Figure 4e). Additionally, the velocity variations were studied for the western CEIS (the profile B–B′ in Figure 4e), where crevasses and fractures are common.
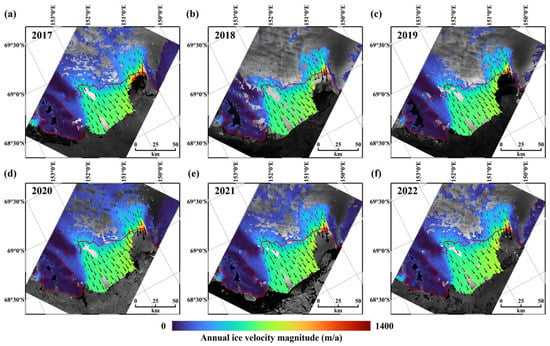
Figure 6.
The annual ice velocity maps of the Cook Ice Shelf in (a) 2017, (b) 2018, (c) 2019, (d) 2020, (e) 2021, and (f) 2022 determined from the Sentienl-1 time-series SAR offset tracking. The black arrows represent the ice flow directions.
5. Discussion
5.1. Ice Velocity Variations of the Cook East Ice Shelf
Figure 7 presents the annual ice velocity magnitudes from 2017 to 2022 determined along profile A–A′ marked in Figure 4e, a straight extension of the main streamline of the Cook East Glacier to the ice front of the CEIS. The black vertical dotted line denotes the location of the grounding line, and the vertical error bars in each velocity profile represent the SD of the annual ice velocity. The red vertical dotted line indicates the boundary between the dynamic shelf ice zone and the passive shelf ice zone defined by Fürst et al. [2]. The Bedmap2 bed elevation [68] along the profile A–A′ (the black solid line in Figure 7) indicates that the bed of the ice sheet is below sea level. The annual ice velocity was not measured in the 19–23 km section of the profile A–A′ because all offsets in the section were filtered out. From 2017 to 2022, the annual ice velocity of the CEIS was almost constant, with the SD of the annual velocity less than 10 m/a. The annual ice velocity from 7 km upstream of the grounding line to the grounding line itself increases significantly from ~350 m/a to ~550 m/a every year, which is attributed to the rapid decrease in bed elevation. The ice velocity along the profile A–A′ increases by ~200 m/a, while the ice flows over a distance of 50 km from the grounding line to the ice front, and the variations in velocity along the flow direction are very small compared to upstream of the grounding line.
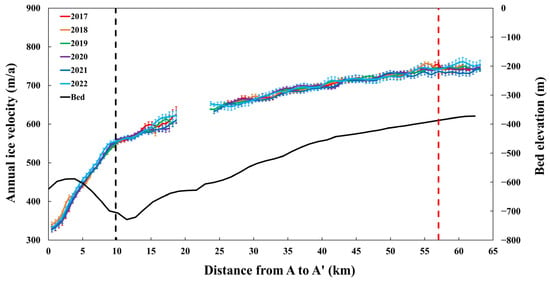
Figure 7.
Annual ice velocities of CEIS from 2017 to 2022 and bed elevation (black solid line) along the profile marked as A–A′ in Figure 4e. The vertical black and red dotted lines represent the location of the grounding line and the boundary between the dynamic shelf ice zone and the passive shelf ice zone.
Fürst et al. [2] studied the buttressing effect of ice shelves using the Elmer/Ice flow model [69], surface and bed elevations from the Bedmap2 [68], ice velocities, and the location of grounding lines from MEaSUREs projects [51]. Additionally, they distinguished between dynamic shelf ice zones that are well buttressed and passive shelf ice zones that have little influence on the buttressing potential of the ice shelves. The dynamic shelf ice zones play a critical role in the overall dynamic state of the ice shelves. Ice mass loss in the dynamic shelf ice zones as a result of calving and ice acceleration has a significant negative impact on the buttressing potential [2]. Within the dynamic shelf ice zone, the variation in annual ice velocity along the main streamline of the CEIS over the past 6 years has been ~25 m/a, which is only 4% of the time series mean velocity, suggesting that there has been little change in the buttressing potential of the ice shelf.
The annual ice velocities from 2017 to 2022 along the profile B–B′ in Figure 4e, which is along the flow line of the western part of the CEIS where numerous crevasses and fractures have formed, are shown in Figure 8. The ice velocities measured on the profile B–B′ showed large spatiotemporal variability and an irregular trend. At the grounding line, the annual ice velocities were similar over the last 6 years, around 480 m/a. The ice velocity from the grounding line to 8 km downstream, which is the section that includes the dynamic shelf ice zone, increased by a maximum of ~100 m/a from 2017 to 2019, which stayed constant until 2020. In 2021, it increased slightly by ~20 m/a and stayed constant through 2022. In the passive shelf ice zone, the annual ice velocity fluctuated. This was attributed to the irregular movement of the ice shelf caused by crevasses and fractures. Figure 9 shows the time-series SAR images with a time interval of about 1 year for the area containing the section that showed large velocity variations in Figure 8 (the section indicated by a gray box in Figure 8). We could confirm from Figure 9 that ice in the section has moved irregularly with time.
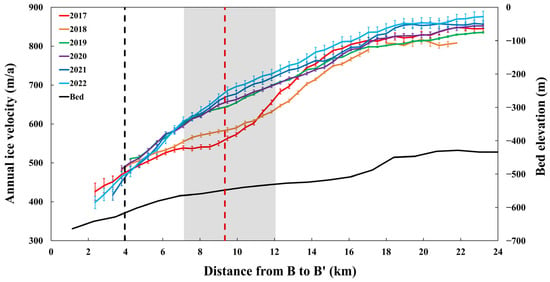
Figure 8.
Annual ice velocities of western CEIS from 2017 to 2022 and bed elevation (black solid line) along the profile marked as B–B′ in Figure 4e. The vertical black and red dotted lines indicate the location of the grounding line and the boundary between the dynamic shelf ice zone and the passive shelf ice zone, respectively.
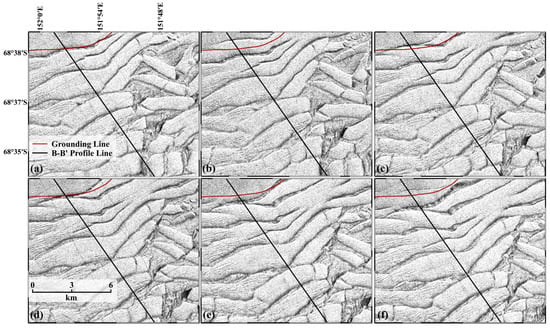
Figure 9.
Sentinel-1 time-series SAR images of the western CEIS. The red and black lines indicate the grounding line and the profile B–B′, respectively. (a) 4 June 2017, (b) 5 June 2018, (c) 18 July 2019, (d) 12 June 2020, (e) 7 June 2021, (f) 2 June 2022.
The annual ice velocity of the western CEIS increased downstream and stayed nearly constant from 14 km downstream of the grounding line to the ice front. The boundary between the dynamic shelf ice zone and the passive shelf ice zone, defined by Fürst et al. [2], is located 5.3 km downstream of the grounding line. Ice velocities in the dynamic shelf ice zone have accelerated by up to 22% during the 6 years (from 562 m/a in 2017 to 686 m/a in 2022 at the boundary between the dynamic shelf ice zone and the passive shelf ice zone).
5.2. Ice Velocity Variations of the Cook West Ice Shelf
Figure 10 shows the annual ice velocity measured along the profile C–C in Figure 4e, which is parallel to the main flow line of the CWIS. The ice front position of CWIS was more variable from year to year compared to that of CEIS because of frequent collapse at the ice front. The SDs of the annual ice velocities increased toward the ice front. This was because the ice velocity changed due to the development of crevasses and rifts that trigger collapses near the ice front. The dynamic shelf ice zone is located within 1.8 km downstream of the grounding line. The annual ice velocity of the CWIS has been about twice as fast as the CEIS (Figure 7 and Figure 8) and has fluctuated over the past 6 years, with a sharp increase from the grounding line to the ice front. From 4 km upstream of the grounding line to the grounding line itself, the ice velocity accelerated from 2017 (1160 m/a at 4 km upstream to 1330 m/a at the grounding line) to 2019 (1210 m/a at 4 km upstream to 1390 m/a at the grounding line) and decreased in 2020 (1160 m/a at 4 km upstream to 1360 m/a at the grounding line). Then, the ice velocity in the grounded ice stayed constant until 2021 and increased again in 2022 (1180 m/a at 4 km upstream). In particular, the ice velocity at the grounding line in 2022 was 1450 m/a, which was 80 m/a faster than in 2021. This increase in velocity is more than twice as large as that in 2017 to 2021. The variations in ice velocity at the grounding line can be related to changes in the buttressing effect of the ice shelf possibly caused by collapse at the ice front [2,3,70,71].
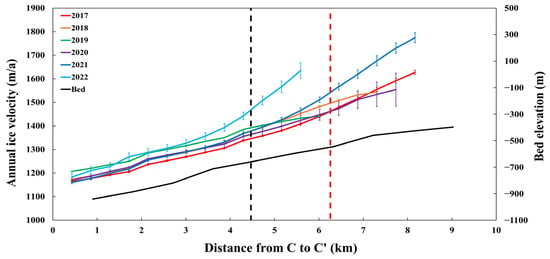
Figure 10.
Annual ice velocities of CWIS from 2017 to 2022 and bed elevation (black solid line) along the profile marked as C–C′ in Figure 4e. The vertical black and red dotted lines, respectively, indicate the location of the grounding line and the boundary between the dynamic shelf ice zone and the passive shelf ice zone.
Figure 11 shows time-series Senitnel-1 SAR images of the CWIS from 2017 to 2022, from which we can confirm the changes in the ice front position as a result of various calving events. Crevasse A observed in February 2017 at 5.7 km on the profile C–C′ was completely developed in January 2018, leading to the collapse of the ice front (Figure 11a–c). Figure 11c,d shows that the ice front collapsed between June 2018 and July 2019 as a result of the development of rift B and other fractures, but the exact timing of the collapse could not be determined for lack of images. Successive ice front collapse can reduce the volume of the ice shelf, which weakens its buttressing potential and could contribute to flow acceleration of the grounded ice [14,72]. From 2019 to 2021, the ice front continued to advance (Figure 11d–f), and the annual ice velocity of the grounded ice decreased and stayed constant through 2021 (Figure 10). However, several fractures, including crevasses and rifts, caused successive collapses of the ice front in February 2022 (Figure 11g), resulting in a retreat of the ice front by about 2.5 km. It is noteworthy that part of the dynamic shelf ice zone, which plays a critical role in buttressing, was lost as a result of the collapse in February 2022 (Figure 10 and Figure 11g). This could be a result of the faster acceleration of ice velocity between 2021 and 2022 rather than the acceleration between 2017 and 2021. Since March 2022, the ice front has continued to advance (Figure 11h); however, multiple fractures have been observed on the ice shelf surface, which indicates the potential for further collapse.
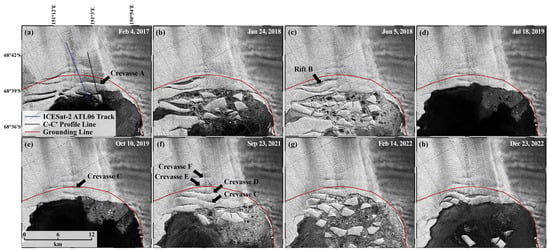
Figure 11.
Time-series of Sentinel-1 SAR images of the Cook West Ice Shelf. (a) 4 February 2017, (b) 24 January 2018, (c) 5 June 2018, (d) 18 July 2019, (e) 10 October 2019, (f) 9 September 2021, (g) 14 February 2022, and (h) 23 December 2022. The red line represents the grounding line. The black and blue lines represent the profile C–C′ for ice velocity measurements (Figure 10) and the ground track of ICESat-2 for ice surface elevation measurements, respectively.
The annual ice velocities of the CWIS showed distinct acceleration after 2020, with the magnitude of the acceleration increasing toward the ice front. The acceleration of ice flow at the grounding line between 2020 and 2021 was only 1.5% (1350 to 1370 m/a), while it increased dramatically downstream, reaching 11.9% at the ice front (1550 to 1735 m/a at the location of the ice front in 2020) (Figure 12). This was due to the development of a number of crevasses formed by the increased ice velocity in the grounded part from 2019 onwards as they migrated downstream (Figure 11d–f). The development of crevasses and the resulting fracturing can accelerate the ice velocity of the ice shelf [6,73].
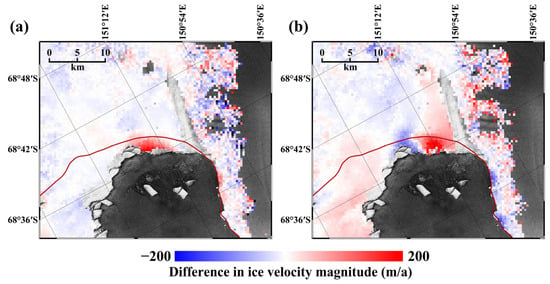
Figure 12.
Difference in the annual ice velocity magnitude of the Cook West Ice Shelf (a) between 2020 and 2021 (2021 ice velocity–2020 ice velocity) and (b) between 2021 and 2022 (2022 ice velocity–2021 ice velocity).
Crevasses on the CWIS were observed from the ICESat-2 ATL06 products and their development characteristics were studied. When crevasses form perpendicular to the ground track of an altimeter, they can be detected as “V” features in the altimeter-observed elevation profile [74,75]. The crevasses on the CWIS were longitudinal crevasses that formed perpendicular to the flow direction of the ice shelf. The ground track of the ICESat-2 observations investigated in this study is nearly parallel to the flow direction of the CWIS. This made it possible to detect crevasses on the ice shelf from the “V” feature of the ICESat-2 ATL06 elevation profiles. In the elevation profiles, we defined the section where the elevation shows a “V” shape as the width of the crevasse, and the lowest elevation within the section as the depth of the crevasse [74]. Variations in the width and depth of the crevasse were analyzed from the elevation profiles from 2019 to 2021. The reliability of the crevasse detection from the ICESat-2 ATL06 data was evaluated using the location of crevasses observed in Sentinel-1 SAR images acquired within a few days of the altimeter observations. Figure 13 shows the ice surface elevation measured along the ICESat-2 ground track, as indicated in the blue line in Figure 11a. The crevasse that appears as a “V” feature between 6 and 6.5 km of the elevation profile on 4 October 2019 (Figure 13a) corresponds to crevasse C indicated in Figure 10e. Figure 11b–d shows that crevasse C advanced with increasing depth over time, and new crevasses (crevasses D, E, and F in Figure 11e) formed at the grounded region and continued to develop. Notably, the crevasses deepened substantially after 2020, which could contribute to the large acceleration of ice velocity between 2020 and 2021 (Figure 12). The depth of the crevasses would be deeper than analyzed in Figure 13 because the ICESat-2 ground track was not parallel to the advance direction of crevasses and may not have passed over the deepest point of the crevasses.
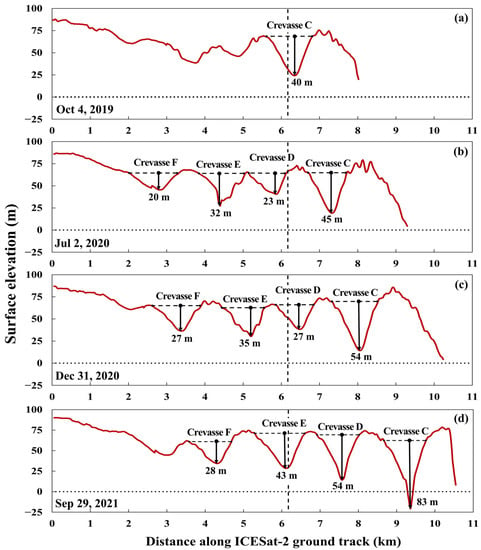
Figure 13.
Ice surface elevation of the Cook West Ice Shelf measured along the ground track of ICESat-2 indicated as the blue solid line Figure 11e. (a) 4 October 2019, (b) 2 July 2020, (c) 31 December 2020, and (d) 29 September 2021. The vertical black dotted line indicates the location of the grounding line.
6. Conclusions
The annual ice velocity of the Cook Ice Shelf in East Antarctica from 2017 to 2022 was measured by applying the offset tracking method to the Sentinel-1 time-series SAR images, and the spatiotemporal variations in the velocity and its mechanisms were studied. To reduce the influence of mismatches in the time-series offset fields on the measurement of the annual ice velocity, we proposed an erroneous offset filtering method based on the statistical evaluation of the spatiotemporal characteristics of the offsets. The proposed filtering method effectively removed the erroneous offsets in the original offset fields, allowing for precise and accurate measurements of the annual ice velocity. Our annual ice velocity estimations were in better agreement with the ITS_LIVE velocities than with the MEaSUREs velocities. Since the MEaSUREs data is spatially smoothed with a 1 km grid size and the ITS_LIVE data accurately represents the spatial variation of ice velocity with a 240 m grid size, we believe that our annual ice velocities determined from the Sentinel-1 time-series SAR offset tracking are reliable.
The CEIS has shown almost constant ice velocity during the past 6 years, except in the western part. The western CEIS, characterized by numerous fractures and frequent collapses, showed large spatiotemporal variations in the annual ice velocities, with up to 22% acceleration in the dynamic shelf ice zone. The CWIS flowed more than twice as fast as the CEIS, with 10% acceleration over the past 6 years at the grounding line. The flow acceleration of the CWIS could be the result of the reduction in ice volume because of the development of crevasses and ice front collapses. On the CWIS, the flow acceleration between 2021 and 2022 was more than twice that of the preceding 5 years, which was possibly due to a series of ice front collapses in February 2022 that wiped out some areas of the dynamic shelf ice zone. These results suggest that the buttressing potential of the western CEIS and CWIS has decreased and that the marine ice sheet in these regions can become more unstable. Given the evolution of crevasses and fractures on the western CEIS and CWIS, which have resulted in a series of ice shelf calving events, the buttressing potential could be further reduced in the near future. The buttressing effect of ice shelves is strongly influenced not only by changes in ice velocity and collapse events but also by changes in ice thickness as a result of ocean-induced basal and surface melting [76,77]. Therefore, the buttressing potential of the Cook Ice Shelf should be further analyzed by assessing the mass balance of the ice shelf.
The time-series offset tracking proposed in this study could not be used for glaciers and ice shelves with rapidly changing flow velocities over short time periods and dramatic seasonal fluctuations in ice velocities. In addition, a sufficient number of offset tracking pairs in time-series should be obtained to effectively eliminate erroneous offset fields and gather precise and accurate ice velocity information. Nevertheless, the time-series offset tracking proposed in this study is expected to be highly applicable to ice shelf flow monitoring. This is because most Antarctic ice shelves typically show little variations in the velocity during short time periods, and the systematic observation missions of Sentinel-1 continue. The combination of the systematic observations of the Sentinel-1 and the time-series offset tracking can contribute to the monitoring of the stability of Antarctic marine ice sheets and ice shelves as well as to the prediction of tipping points of ice shelf buttressing.
Author Contributions
Conceptualization, H.H.; Methodology, H.H.; Software, H.H.; Validation, S.L.; Formal Analysis, S.L., S.K., H.A. and H.H.; Investigation, S.L. and H.H.; Resources, H.H.; Data Curation, S.L., S.K. and H.A.; Visualization, S.L.; Writing—Original Draft Preparation, S.L. and H.H.; Writing—Review and Editing, S.L. and H.H. All authors have read and agreed to the published version of the manuscript.
Funding
This study was funded by the National Research Foundation of Korea (NRF-2021R1C1C1009621 and No. 2019R1A6A1A03033167) and the Korea Polar Research Institute (PE23070).
Data Availability Statement
The Sentinel-1 SAR data can be downloaded from the Alaska Satellite Facility’s data search website (Vertex) at https://search.asf.alaska.edu/#/ (accessed on 10 April 2023). The ICESat-2 data can be downloaded from the National Snow and Ice Data Center at https://nsidc.org/data/icesat-2 (accessed on 10 April 2023). The BEDMAP2 data can be downloaded from the British Antarctic Survey website at https://www.bas.ac.uk/project/bedmap-2/ (accessed on 10 April 2023).
Acknowledgments
This study was supported by the National Research Foundation of Korea (NRF-2021R1C1C1009621 and No. 2019R1A6A1A03033167) and the Korea Polar Research Institute (PE23070). The authors would like to thank the ESA and ASF for providing Sentinel-1 SAR data.
Conflicts of Interest
The authors declare no conflict of interest.
References
- Gagliardini, O.; Durand, G.; Zwinger, T.; Hindmarsh, R.C.A.; Le Meur, E. Coupling of Ice-shelf Melting and Buttressing is a Key Process in Ice-sheets Dynamics. Geophys. Res. Lett. 2010, 37, L14501. [Google Scholar] [CrossRef]
- Fürst, J.J.; Durand, G.; Gillet-Chaulet, F.; Tavard, L.; Rankl, M.; Braun, M.; Gagliardini, O. The Safety Band of Antarctic Ice Shelves. Nat. Clim. Chang. 2016, 6, 479–482. [Google Scholar] [CrossRef]
- Dupont, T.K.; Alley, R.B. Assessment of the Importance of Ice-shelf Buttressing to Ice-sheet Flow. Geophys. Res. Lett. 2005, 32, L04503. [Google Scholar] [CrossRef]
- Khazendar, A.; Rignot, E.; Larour, E. Acceleration and Spatial Rheology of Larsen C Ice Shelf, Antarctic Peninsula. Geophys. Res. Lett. 2011, 38, L09502. [Google Scholar] [CrossRef]
- Greene, C.A.; Young, D.A.; Gwyther, D.E.; Galton-Fenzi, B.K.; Blankenship, D.D. Seasonal Dynamics of Totten Ice Shelf Controlled by Sea Ice Buttressing. Cryosphere 2018, 12, 2869–2882. [Google Scholar] [CrossRef]
- Cheng, Y.; Xia, M.; Qiao, G.; Li, Y.; Hai, G.; Lv, D. Calving Cycle of Ninnis Glacier Over the Last 60 Years. Int. J. Appl. Earth Obs. Geoinf. 2021, 105, 102612. [Google Scholar] [CrossRef]
- Liu, Y.; Moore, J.C.; Cheng, X.; Gladstone, R.M.; Bassis, J.N.; Liu, H.; Wen, J.; Hui, F. Ocean-Driven Thinning Enhances Iceberg Calving and Retreat of Antarctic Ice Shelves. Proc. Natl. Acad. Sci. USA 2015, 112, 3263–3268. [Google Scholar] [CrossRef]
- Han, H.; Lee, S.; Kim, J.; Kim, S.H.; Kim, H. Changes in a Giant Iceberg Created from the Collapse of the Larsen C Ice Shelf, Antarctic Peninsula, Derived from Sentinel-1 and CryoSat-2 Data. Remote Sens. 2019, 11, 404. [Google Scholar] [CrossRef]
- Singh, S.; Kumar, S.; Kumar, N. Evolution of Iceberg A68 since Its Inception from the Collapse of Antarctica’s Larsen C Ice Shelf Using Sentinel-1 SAR Data. Sustainability 2023, 15, 3757. [Google Scholar] [CrossRef]
- Lhermitte, S.; Sun, S.; Shuman, C.; Wouters, B.; Pattyn, F.; Wuite, J.; Berthier, E.; Nagler, T. Damage Accelerates Ice Shelf Instability and Mass Loss in Amundsen Sea Embayment. Proc. Natl. Acad. Sci. USA 2020, 117, 24735–24741. [Google Scholar] [CrossRef] [PubMed]
- The IMBIE team. Mass Balance of the Antarctic Ice Sheet from 1992 to 2017. Nature 2018, 558, 219–222. [Google Scholar] [CrossRef] [PubMed]
- Han, H.; Im, J.; Kim, H. Variations in Ice Velocities of Pine Island Glacier Ice Shelf Evaluated Using Multispectral Image Matching of Landsat Time Series Data. Remote Sens. Environ. 2016, 186, 358–371. [Google Scholar] [CrossRef]
- Mouginot, J.; Rignot, E.; Scheuchl, B. Sustained Increase in Ice Discharge from the Amundsen Sea Embayment, West Antarctica, from 1973 to 2013. Geophys. Res. Lett. 2014, 41, 1576–1584. [Google Scholar] [CrossRef]
- Joughin, I.; Shapero, D.; Smith, B.; Dutrieux, P.; Barham, M. Ice-shelf Retreat Drives Recent Pine Island Glacier Speedup. Sci. Adv. 2021, 7, eabg3080. [Google Scholar] [CrossRef] [PubMed]
- Sutterley, T.C.; Velicogna, I.; Rignot, E.; Mouginot, J.; Flament, T.; van den Broeke, M.R.; van Wessem, J.M.; Reijmer, C.H. Mass Loss of the Amundsen Sea Embayment of West Antarctica from Four Independent Techniques. Geophys. Res. Lett. 2014, 41, 8421–8428. [Google Scholar] [CrossRef]
- McMillan, M.; Shepherd, A.; Sundal, A.; Briggs, K.; Muir, A.; Ridout, A.; Hogg, A.; Wingham, D. Increased Ice Losses from Antarctica Detected by CryoSat-2. Geophys. Res. Lett. 2014, 41, 3899–3905. [Google Scholar] [CrossRef]
- Graham, A.G.C.; Wåhlin, A.; Hogan, K.A.; Nitsche, F.O.; Heywood, K.J.; Totten, R.L.; Smith, J.A.; Hillenbrand, C.; Simkins, L.M.; Anderson, J.B.; et al. Rapid Retreat of Thwaites Glacier in the Pre-Satellite Era. Nat. Geosci. 2022, 15, 706–713. [Google Scholar] [CrossRef]
- Rignot, E.; Mouginot, J.; Scheuchl, B.; van den Broeke, M.; van Wessem, M.J.; Morlighem, M. Four Decades of Antarctic Ice Sheet Mass Balance from 1979–2017. Proc. Natl. Acad. Sci. USA 2019, 116, 1095–1103. [Google Scholar] [CrossRef]
- Wingham, D.J.; Shepherd, A.; Muir, A.; Marshall, G.J. Mass Balance of the Antarctic Ice Sheet. Phil. Trans. Royal Soc. A 2006, 364, 1627–1635. [Google Scholar] [CrossRef]
- Shepherd, A.; Ivins, E.R.; Geruo, A.; Barletta, V.R.; Bentley, M.J.; Bettadpur, S.; Briggs, K.H.; Bromwich, D.H.; Forsberg, R.; Galin, N.; et al. A Reconciled Estimate of Ice-Sheet Mass Balance. Science 2012, 338, 1183–1189. [Google Scholar] [CrossRef]
- Mengel, M.; Levermann, A. Ice Plug Prevents Irreversible Discharge from East Antarctica. Nat. Clim. Chang. 2014, 4, 451–455. [Google Scholar] [CrossRef]
- Shen, Q.; Wang, H.; Shum, C.K.; Jiang, L.; Hsu, H.T.; Dong, J. Recent High-Resolution Antarctic Ice Velocity Maps Reveal Increased Mass Loss in Wilkes Land, East Antarctica. Sci. Rep. 2018, 8, 4477. [Google Scholar] [CrossRef] [PubMed]
- Drewry, D.J. Antarctica: Glaciological and Geophysical Folio; University of Cambridge, Scott Polar Research Institute Cambridge: Cambridge, UK, 1983. [Google Scholar]
- Rignot, E.; Jacobs, S.; Mouginot, J.; Scheuchl, B. Ice-Shelf Melting Around Antarctica. Science 2013, 341, 266–270. [Google Scholar] [CrossRef]
- Miles, B.W.J.; Stokes, C.R.; Jamieson, S.S.R. Velocity Increases at Cook Glacier, East Antarctica, Linked to Ice Shelf Loss and a Subglacial Flood Event. Cryosphere 2018, 12, 3123–3136. [Google Scholar] [CrossRef]
- Han, H.; Lee, H. Surface Strain Rates and Crevassing of Campbell Glacier Tongue in East Antarctica Analysed by Tide-Corrected DInSAR. Remote Sens. Lett. 2017, 8, 330–339. [Google Scholar] [CrossRef]
- Lee, H.; Seo, H.; Han, H.; Ju, H.; Lee, J. Velocity Anomaly of Campbell Glacier, East Antarctica, Observed by Double-Differential Interferometric SAR and Ice Penetrating Radar. Remote Sens. 2021, 13, 2691. [Google Scholar] [CrossRef]
- Jawak, S.D.; Kumar, S.; Luis, A.J.; Pandit, P.H.; Wankhede, S.F.; Anirudh, T.S. Seasonal Comparison of Velocity of the Eastern Tributary Glaciers, Amery Ice Shelf, Antarctica, using SAR Offset Tracking. ISPRS Ann. Photogramm. Remote Sens. Spat. Inf. Sci 2019, 4, 595–600. [Google Scholar] [CrossRef]
- Zahriban Hesari, M.; Nunziata, F.; Aulicino, G.; Buono, A.; Migliaccio, M. Analysis of Fine-Scale Dynamics of the Drygalski Ice Tongue in Antarctica Using Satellite SAR Data. Int. J. Remote Sens. 2022, 43, 2581–2598. [Google Scholar] [CrossRef]
- Baumhoer, C.A.; Dietz, A.J.; Dech, S.; Kuenzer, C. Remote Sensing of Antarctic Glacier and Ice-Shelf Front Dynamics—A Review. Remote Sens. 2018, 10, 1445. [Google Scholar] [CrossRef]
- Wuite, J.; Nagler, T.; Gourmelen, N.; Escorihuela, M.J.; Hogg, A.E.; Drinkwater, M.R. Sub-Annual Calving Front Migration, Area Change and Calving Rates from Swath Mode CryoSat-2 Altimetry, on Filchner-Ronne Ice Shelf, Antarctica. Remote Sens. 2019, 11, 2761. [Google Scholar] [CrossRef]
- Kim, S.H.; Kim, D.; Kim, H. Progressive Degradation of an Ice Rumple in the Thwaites Ice Shelf, Antarctica, as Observed from High-Resolution Digital Elevation Models. Remote Sens. 2018, 10, 1236. [Google Scholar] [CrossRef]
- Mohr, J.J.; Reeh, N.; Madsen, S.N. Three-Dimensional Glacial Flow and Surface Elevation Measured with Radar Interferometry. Nature 1998, 391, 273–276. [Google Scholar] [CrossRef]
- Rignot, E.; Mouginot, J.; Morlighem, M.; Seroussi, H.; Scheuchl, B. Widespread, Rapid Grounding Line Retreat of Pine Island, Thwaites, Smith, and Kohler Glaciers, West Antarctica, from 1992 to 2011. Geophys. Res. Lett. 2014, 41, 3502–3509. [Google Scholar] [CrossRef]
- Tong, X.; Liu, S.; Li, R.; Xie, H.; Liu, S.; Qiao, G.; Feng, T.; Tian, Y.; Ye, Z. Multi-Track Extraction of Two-Dimensional Surface Velocity by the Combined Use of Differential and Multiple-Aperture InSAR in the Amery Ice Shelf, East Antarctica. Remote Sens. Environ. 2018, 204, 122–137. [Google Scholar] [CrossRef]
- Chen, Y.; Zhou, C.; Ai, S.; Liang, Q.; Zheng, L.; Liu, R.; Lei, H. Dynamics of Dalk Glacier in East Antarctica Derived from Multisource Satellite Observations Since 2000. Remote Sens. 2020, 12, 1809. [Google Scholar] [CrossRef]
- Strozzi, T.; Luckman, A.; Murray, T.; Wegmuller, U.; Werner, C.L. Glacier Motion Estimation Using SAR Offset-Tracking Procedures. IEEE Trans. Geosci. Remote Sens. 2002, 40, 2384–2391. [Google Scholar] [CrossRef]
- Han, H.; Ji, Y.; Lee, H. Estimation of Annual Variation of Ice Extent and Flow Velocity of Campbell Glacier in East Antarctica Using COSMO-SkyMed SAR Images. Korean J. Remote Sens. 2013, 29, 45–55. [Google Scholar] [CrossRef]
- Chae, S.; Lee, W.; Jung, H.; Zhang, L. Ionospheric Correction of L-Band SAR Offset Measurements for the Precise Observation of Glacier Velocity Variations on Novaya Zemlya. IEEE J. Sel. Top. Appl. Earth Obs. 2017, 10, 3591–3603. [Google Scholar] [CrossRef]
- Moon, J.; Cho, Y.; Lee, H. Flow Velocity Change of David Glacier, East Antarctica, from 2016 to 2020 Observed by Sentinel-1A SAR Offset Tracking Method. Korean J. Remote Sens. 2021, 37, 1–11. [Google Scholar] [CrossRef]
- Tomar, K.S.; Kumari, S.; Luis, A.J. Seasonal Ice Flow Velocity Variations of Polar Record Glacier, East Antarctica during 2016–2019 Using Sentinel-1 Data. Geocarto Int. 2022, 37, 4671–4686. [Google Scholar] [CrossRef]
- Nagler, T.; Rott, H.; Hetzenecker, M.; Wuite, J.; Potin, P. The Sentinel-1 Mission: New Opportunities for Ice Sheet Observations. Remote Sens. 2015, 7, 9371–9389. [Google Scholar] [CrossRef]
- Meng, Q.; Chen, X.; Huang, X.; Huang, Y.; Peng, Y.; Zhang, Y.; Zhen, J. Monitoring Glacier Terminus and Surface Velocity Changes Over Different Time Scales Using Massive Imagery Analysis and Offset Tracking at the Hoh Xil World Heritage Site, Qinghai-Tibet Plateau. Int. J. Appl. Earth Obs. Geoinf. 2022, 112, 102913. [Google Scholar] [CrossRef]
- Li, S.; Leinss, S.; Hajnsek, I. Cross-Correlation Stacking for Robust Offset Tracking Using SAR Image Time-Series. IEEE J. Select. Top. App. Earth Obs. Rem. Sens. 2021, 14, 4765–4778. [Google Scholar] [CrossRef]
- Sánchez-Gámez, P.; Navarro, F.J. Glacier Surface Velocity Retrieval Using D-InSAR and Offset Tracking Techniques Applied to Ascending and Descending Passes of Sentinel-1 Data for Southern Ellesmere Ice Caps, Canadian Arctic. Remote Sens. 2017, 9, 442. [Google Scholar] [CrossRef]
- Gómez, D.; Salvador, P.; Sanz, J.; Urbazaev, M.; Casanova, J.L. Analyzing Ice Dynamics Using Sentinel-1 Data at the Solheimajoküll Glacier, Iceland. GIsci. Remote Sens. 2020, 57, 813–829. [Google Scholar] [CrossRef]
- Leinss, S.; Li, S.; Frey, O. Measuring Glacier Velocity by Autofocusing Temporally Multilooked SAR Time Series. In Proceedings of the 2021 IEEE International Geoscience and Remote Sensing Symposium, Brussels, Belgium, 11–16 July 2021; pp. 5493–5496. [Google Scholar] [CrossRef]
- Li, Z.; Wu, Q. Capturing the Crack Process of the Antarctic A74 Iceberg with Sentinel-1 Based Offset Tracking and Radar Interferometry Techniques. Int. J. Digit. Earth 2022, 15, 397–415. [Google Scholar] [CrossRef]
- Rignot, E.; Mouginot, J.; Scheuchl, B. Antarctic Grounding Line Mapping from Differential Satellite Radar Interferometry. Geophys. Res. Lett. 2011, 38, L10504. [Google Scholar] [CrossRef]
- Frezzotti, M.; Cimbelli, A.; Ferrigno, J.G. Ice-Front Change and Iceberg Behaviour Along Oates and George V Coasts, Antarctica, 1912–1996. Ann. Glaciol. 1998, 27, 643–650. [Google Scholar] [CrossRef]
- Flament, T.; Berthier, E.; Rémy, F. Cascading Water Underneath Wilkes Land, East Antarctic Ice Sheet, Observed Using Altimetry and Digital Elevation Models. Cryosphere 2014, 8, 673–687. [Google Scholar] [CrossRef]
- Geudtner, D.; Torres, R.; Snoeij, P.; Davidson, M.; Rommen, B. Sentinel-1 System Capabilities and Applications. In Proceedings of the 2014 IEEE Geoscience and Remote Sensing Symposium, Quebec City, QC, Canada, 13–18 July 2014; pp. 1457–1460. [Google Scholar] [CrossRef]
- Cathles, L.M.; Abbot, D.S.; Bassis, J.N.; MacAyeal, D.R. Modeling Surface-Roughness/Solar-Ablation Feedback: Application to Small-Scale Surface Channels and Crevasses of the Greenland Ice Sheet. Ann. Glaciol. 2011, 52, 99–108. [Google Scholar] [CrossRef]
- Markus, T.; Neumann, T.; Martino, A.; Abdalati, W.; Brunt, K.; Csatho, B.; Farrell, S.; Fricker, H.; Gardner, A.; Harding, D.; et al. The Ice, Cloud, and Land Elevation Satellite-2 (ICESat-2): Science Requirements, Concept, and Implementation. Remote Sens. Environ. 2017, 190, 260–273. [Google Scholar] [CrossRef]
- Brunt, K.M.; Neumann, T.A.; Smith, B.E. Assessment of ICESat-2 Ice Sheet Surface Heights, Based on Comparisons Over the Interior of the Antarctic Ice Sheet. Geophys. Res. Lett. 2019, 46, 13072–13078. [Google Scholar] [CrossRef]
- Han, S.; Han, H.; Lee, H. Analysis of Tidal Deflection and Ice Properties of Ross Ice Shelf, Antarctica, by Using DDInSAR Imagery. Korean J. Remote Sens. 2019, 35, 933–944. [Google Scholar] [CrossRef]
- Bartsch, A.; Pointner, G.; Ingeman-Nielsen, T.; Lu, W. Towards Circumpolar Mapping of Arctic Settlements and Infrastructure Based on Sentinel-1 and Sentinel-2. Remote Sens. 2020, 12, 2368. [Google Scholar] [CrossRef]
- Dabiri, Z.; Hölbling, D.; Abad, L.; Helgason, J.K.; Sæmundsson, Þ.; Tiede, D. Assessment of Landslide-Induced Geomorphological Changes in Hítardalur Valley, Iceland, Using Sentinel-1 and Sentinel-2 Data. Appl Sci. 2020, 10, 5848. [Google Scholar] [CrossRef]
- Dabiri, Z.; Hölbling, D.; Abad, L.; Guðmundsson, S. Comparing the Applicability of Sentinel-1 and Sentinel-2 for Mapping the Evolution of Ice-Marginal Lakes in Southeast Iceland. GI_Forum 2021, 9, 46–52. [Google Scholar] [CrossRef]
- Mouginot, J.; Rignot, E.; Scheuchl, B.; Millan, R. Comprehensive Annual Ice Sheet Velocity Mapping Using Landsat-8, Sentinel-1, and RADARSAT-2 Data. Remote Sens. 2017, 9, 364. [Google Scholar] [CrossRef]
- Gardner, A.S.; Fahnstock, M.; Scambos, T. Update to Time of Data Download: ITS_LIVE Regional Glacier and Ice Sheet Surface Velocities; National Snow and Ice Data Center: Boulder, CO, USA, 2019. [Google Scholar] [CrossRef]
- Gardner, A.S.; Moholdt, G.; Scambos, T.; Fahnstock, M.; Ligtenberg, S.; van den Broeke, M.; Nilsson, J. Increased West Antarctic and Unchanged East Antarctic Ice Discharge over the Last 7 Years. Cryosphere 2018, 12, 521–547. [Google Scholar] [CrossRef]
- Rott, H.; Stuefer, M.; Siegel, A.; Skvarca, P.; Eckstaller, A. Mass Fluxes and Dynamics of Moreno Glacier, Southern Patagonia Icefield. Geophys. Res. Lett. 1998, 25, 1407–1410. [Google Scholar] [CrossRef]
- Scambos, T.A.; Dutkiewicz, M.J.; Wilson, J.C.; Bindschadler, R.A. Application of Image Cross-Correlation to the Measurement of Glacier Velocity Using Satellite Image Data. Remote Sens. Environ. 1992, 42, 177–186. [Google Scholar] [CrossRef]
- Greene, C.A.; Gardner, A.S.; Andrews, L.C. Detecting Seasonal Ice Dynamics in Satellite Images. Cryosphere 2020, 14, 4365–4378. [Google Scholar] [CrossRef]
- Boxall, K.; Chrisite, F.D.W.; Willis, I.C.; Wuite, J.; Nagler, T. Seasonal Land-ice-flow Variability in the Antarctic Peninsula. Cryosphere 2022, 16, 3907–3932. [Google Scholar] [CrossRef]
- Wallis, B.J.; Hogg, A.E.; van Wessem, J.M.; Davison, B.J.; van den Broeke, M.R. Widespread Seasonal Speed-up of West Antarctic Peninsula Glaciers from 2014 to 2021. Nature Geosci. 2023, 16, 231–237. [Google Scholar] [CrossRef]
- Fretwell, P.; Pritchard, H.D.; Vaughan, D.G.; Bamber, J.L.; Barrand, N.E.; Bell, R.; Bianchi, C.; Bingham, R.G.; Blankenship, D.D.; Casassa, G.; et al. Bedmap2: Improved Ice Bed, Surface and Thickness Datasets for Antarctica. Cryosphere 2013, 7, 375–393. [Google Scholar] [CrossRef]
- Gagliardini, O.; Zwinger, T.; Gillet-Chaulet, F.; Durand, G.; Favier, L.; de Fleurian, B.; Greve, R.; Malinen, M.; Martín, C.; Råback, P.; et al. Capabilities and Performance of Elmer/Ice, a New-Generation Ice Sheet Model. Geosci. Model Dev. 2013, 6, 1299–1318. [Google Scholar] [CrossRef]
- Rignot, E.; Casassa, G.; Gogineni, P.; Krabill, W.; Rivera, A.U.; Thomas, R. Accelerated Ice Discharge from the Antarctic Peninsula Following the Collapse of Larsen B Ice Shelf. Geophys. Res. Lett. 2004, 31, L18401. [Google Scholar] [CrossRef]
- Royston, S.; Gudmundsson, G.H. Changes in Ice-Shelf Buttressing Following the Collapse of Larsen A Ice Shelf, Antarctica, and the Resulting Impact on Tributaries. J. Glaciol. 2016, 62, 905–911. [Google Scholar] [CrossRef]
- Scambos, T.A.; Bohlander, J.A.; Shuman, C.A.; Skvarca, P. Glacier Acceleration and Thinning After Ice Shelf Collapse in the Larsen B Embayment, Antarctica. Geophys. Res. Lett. 2004, 31, L18402. [Google Scholar] [CrossRef]
- Jeong, S.; Howat, I.M.; Bassis, J.N. Accelerated Ice Shelf Rifting and Retreat at Pine Island Glacier, West Antarctica. Geophys. Res. Lett. 2016, 43, 11720–11725. [Google Scholar] [CrossRef]
- Li, G.; Guo, J.; Pei, L.; Zhang, S.; Tang, X.; Yao, J. Extraction and Analysis of the Three-Dimensional Features of Crevasses in the Amery Ice Shelf Based on ICESat-2 ATL06 Data. IEEE J. Sel. Top. Appl. Earth Obs. Remote Sens. 2021, 14, 5796–5806. [Google Scholar] [CrossRef]
- Colgan, W.; Rajaram, H.; Abdalati, W.; McCutchan, C.; Mottram, R.; Moussavi, M.S.; Grigsby, S. Glacier Crevasses: Observations, Models, and Mass Balance Implications. Rev. Geophys. 2016, 54, 119–161. [Google Scholar] [CrossRef]
- Pritchard, H.D.; Ligtenberg, S.R.M.; Fricker, H.A.; Vaughan, D.G.; van den Broeke, M.R.; Padman, L. Antarctic Ice-Sheet Loss Driven by Basal Melting of Ice Shelves. Nature 2012, 484, 502–505. [Google Scholar] [CrossRef] [PubMed]
- Gudmundsson, G.H.; Paolo, F.S.; Adusumilli, S.; Fricker, H.A. Instantaneous Antarctic Ice Sheet Mass Loss Driven by Thinning Ice Shelves. Geophys. Res. Lett. 2019, 46, 13903–13909. [Google Scholar] [CrossRef]
Disclaimer/Publisher’s Note: The statements, opinions and data contained in all publications are solely those of the individual author(s) and contributor(s) and not of MDPI and/or the editor(s). MDPI and/or the editor(s) disclaim responsibility for any injury to people or property resulting from any ideas, methods, instructions or products referred to in the content. |
© 2023 by the authors. Licensee MDPI, Basel, Switzerland. This article is an open access article distributed under the terms and conditions of the Creative Commons Attribution (CC BY) license (https://creativecommons.org/licenses/by/4.0/).