Article

Do Ecological Restoration Projects Undermine Economic Performance? A Spatially Explicit Empirical Study in Loess Plateau, China

1
Department of Land Resource Management, School of Public Administration, China University of Geosciences, Wuhan 430074, China
2
Key Laboratory of Land Surface Pattern and Simulation, Institute of Geographic Sciences and Natural Resources Research, Chinese Academy of Sciences, Beijing 100101, China
3
Nepal Geographical Society, Kathmandu 44600, Nepal
4
Geo Planet Research Centre, Kathmandu 44619, Nepal
5
Institute of Fundamental Research and Studies, Kathmandu 44600, Nepal
*
Author to whom correspondence should be addressed.
Remote Sens. 2023, 15(12), 3035; https://doi.org/10.3390/rs15123035
Submission received: 17 April 2023 / Revised: 5 June 2023 / Accepted: 6 June 2023 / Published: 9 June 2023

Abstract

:
Exploring the complex relationship between ecological restoration and economic development is valuable for decision makers to formulate policy for sustainable development. The large-scale environmental restoration program—Grain for Green—was mainly implemented in the Loess Plateau of China to improve the soil retention service. However, whether this world-famous program affects local economic development has not been fully explored. In this study, using the Integrated Valuation of Ecosystem Services and Tradeoffs (InVEST) model and spatializing the gross domestic product (GDP) based on the remotely sensed nightlight data, we explored the tradeoff between environment (i.e., soil retention service) and economy (i.e., GDP) for the Loess Plateau in a spatially explicit way. We found that the soil retention service increased prominently over the past 40 years, especially after implementing the Grain for Green project. Meanwhile, the GDP increased about nine-fold over the past four decades from 4.52 to 40.29 × 10⁷ USD. A win–win situation of soil retention and economic development was achieved in the Loess Plateau of China, particularly in the loess gully and loess hilly gully regions of the Loess Plateau. The win–win situation of soil retention and economic development was as a result of the Grain for Green program, the optimization of industrial structure, and the increase in non-agriculture employment. Compared with previous studies, more spatial information was available for the Loess Plateau in this study, which is more valuable to policymakers.

Graphical Abstract

1. Introduction

Ecosystem service (ES) refers to the benefits that humans derive from natural ecosystems [1,2]. Over the past millennia, human activities have triggered the severe reduction in biodiversity and the decline in ecosystem services [3,4,5,6]. The Millennium Ecosystem Assessment reported that nearly 60% of ecosystem services have shown a trend of degradation [7]. Intergovernmental Science-Policy Platform on Biodiversity and Ecosystem Services suggested that nature across most of the globe has been significantly altered by multiple human drivers, with most indicators of ecosystems and biodiversity showing rapid decline [8]. Humans have to take many ecological restoration measures to deal with these environmental problems. Specifically, the United Nations [9] adopted the Sustainable Development Goals to develop a green economy, reverse soil and land degradation [10], and restore biodiversity and ecosystem services [11]. The United Nations recently declared 2021 to 2030 the Decade of Ecosystem Restoration [12]. The United Nations has also recognized ten ground-breaking efforts from around the globe for their role in restoring the natural world (https://www.unep.org/news-and-stories/press-release/un-recognizes-10-pioneering-initiatives-are-restoring-natural-world, accessed on 10 May 2023). In addition, some countries also developed local policies for environmental restoration [13,14], including the Great Green Wall of Africa [15] and the ecological restoration program, Chinese Grain for Green [16,17,18]. However, environmental managers and scholars are concerned about whether these environmental restoration projects undermine or enhance economic performance [19,20,21,22,23].
An increasing number of scholars have devoted themselves to exploring the relationship between environmental restoration and economic development [20,24,25]. The most representative study is the Environmental Kuznets Curve hypothesis. It postulates an inverted U-shaped relationship between different pollutants and per capita income, i.e., environmental pressure increases to a certain level as income increases; after that, it decreases [26,27,28,29]. Additionally, some scholars have directly explored the interactions between economic development and the environment. For example, Venter et al. [30] found that some wealthy countries have been undergoing rapid economic growth while simultaneously reducing their pressures on the environment. Most encouragingly, these countries are net exporters of agricultural and forestry products. Konan [31] believed that innovating economic development patterns could reduce environmental pressure, such as the growth of the tourism economy, which had a protective effect on the environment. Hatfield-Dodds et al. [32] found that Australia could simultaneously raise its economic level and relieve ecological pressure. Stable sediment retention and rapid economic growth occurred in the Three Gorges Reservoir area of China [33]. Hartmann and Preisendörfer [34] investigated the relationship between public concern about the environment and changing economic conditions, finding that public concern about the environment increased under favorable economic circumstances. The value of restoring the ecosystem services of rivers for economic development was measured [35].
Some scholars have also revealed the human–environment interaction mechanism by studying the coupling system between the natural environment and human activities [36,37]. For instance, Folke [38] analyzed the socio-ecological system dynamics process from the perspective of resilience. Ostrom [39] proposed a framework for social-ecological systems, and Liu et al. [40] proposed a “coupled human and natural framework” to analyze the interaction mechanism between urbanization and the environment.
The Loess Plateau of China is one typical region of the world with a dense population and rare resources. To feed the dense population, large-scale deforestation for cropland occurred in this region over the past millennium, especially during the Ming and Qing dynasties (from the second half of the 14th century to the first half of the 20th century) [41], which caused serious soil erosion. More than 90% of the sediment content of the Yellow River comes from the Loess Plateau [42]. Soil erosion has caused severe flooding, seriously affecting the sustainable economic development of the middle-lower reaches of the Yellow River. As a result, besides the Western Development Strategy, many ecological engineering methods, e.g., terracing and the construction of check dams and reservoirs, were also implemented here to reduce severe soil erosion. Particularly, the ecological restoration program—Grain for Green (also known as the Conversion of Cropland to Forest and Grassland Program)—has been implemented here since 1999. Will this program affect food security and residents’ income? Then, how is the relationship between soil conservation and economic development reconciled? Most existing studies have adopted various vegetation indexes to detect the land use/cover change [18,43,44] and analyzed the variation in major ecosystem services and ecological values in the Loess Plateau [45]. In addition, a number of studies analyzed the coupling relationship of the ecosystem and economy for this region, focusing on the variation in the social ecosystem [46,47,48]. However, insufficient attention has been paid to the questions mentioned above, especially in a spatially explicit way, which is not informative for policymakers.
To fulfill these research gaps, in this study, we aim to (1) evaluate the soil retention service of the Loess Plateau using the Integrated Valuation of Ecosystem Services and Tradeoffs (InVEST) model and analyze its spatiotemporal changing characteristics for 1980–2018, (2) detect the spatial and temporal pattern of economic evolution using a spatialization model of gross domestic production (GDP), and (3) reveal the relationship between the soil retention service and GDP for the Loess Plateau in a spatially explicit way.

2. Study Area

Loess is an earthy deposit formed during the Quaternary period. It is loose and porous. Therefore, it is easy to suffer erosion and collapse after being soaked in running water. As the largest loess distribution area in the world, the Loess Plateau is located in the north of central China (Figure 1), with a total area of about 0.64 million km2.
Its elevation descends from northwest to southeast, and it has a typical semi-arid continental monsoon climate, with annual precipitation of 150–750 mm. The dominant ecosystem service of this region is the soil retention service [45,48]. The maximum soil erosion area of the Loess Plateau used to reach about 390,000 km2 because of large-scale deforestation from the second half of the 14th century to the first half of the 20th century, which has seriously threatened the ecological security of the mid-lower reaches of the Yellow River [42]. The Loess Plateau covers 7 provincial-level regions, with a total population of 114 million up to 2018. The region is a dry farming production area in China [48]. This region is also one of the areas where the Western Development Strategy is implemented. Based on the outline of the comprehensive management plan of the Loess Plateau, combined with the geographic profile of each province, the Loess Plateau was divided into six comprehensive management zones, including the valley plain region, the loess hilly gully region, the sand and desert region, the earth-rock mountain region, the agricultural irrigation region, and the loess gully region [18].

3. Materials and Methods

3.1. Data Sources

In this study, we used the InVEST model to calculate the soil conservation service. The input data of this model include the digital elevation model (DEM), the rainfall erosivity index R, the soil erodibility factor K, land use/land cover (LULC), watershed boundaries, cover-management factor C, and support practice factor P. The sources and descriptions of these data are shown in Table 1. In addition, all the above high-resolution raster format data, e.g., R and K, are resampled to 1 km resolution.
In addition, we used gross domestic product (GDP) data to characterize the level of economic development. In order to analyze the relationship between soil conservation service and economic development at the 1 km grid scale, we also used the night-time light data to spatialize the GDP (Table 1).

3.2. Estimation of Soil Retention Service

The sediment delivery ratio (SDR) module of the InVEST model is used to assess the soil retention service. It is based on the Revised Universal Soil Loss Equation (RUSLE), which measures the soil retention amount by calculating the potential soil loss, actual soil erosion, and sediment interception in the upstream area with the following equations [54].
SEDRET = (   RKLS USLE   ) + sed _ export
RKLS = R × K × L S
USLE = R × K × L S × C × P
where SEDRET is the amount of soil retention; RKLS is the potential soil loss; USLE is the actual soil erosion; sed_export is the sediment interception in the upstream area; R is the rainfall erosivity index; K is the soil erodibility factor; LS is the topography factor; C is the vegetation cover-management factor; and P is the support practice factor P. The data sources or specific calculation methods are available in Table 1 and Appendix A.
The calibration parameters that determine the spatial association of hydrological processes and sediment transport rations in the sub-basin, using the model default value, are Kb = 2 and IC0 = 0.5 because of the unavailability of more information [54]. The maximum sediment transport ratio of the raster, also using the model default value, is SDRmax = 0.8 [54].

3.3. The Spatialization of Gross Domestic Product

GDP is one of the best indicators to measure the level of economic development of a country or region. However, the GDP statistics of prefecture-level cities cannot reflect the spatial differences in economic development within a prefecture. It also cannot be matched with the 1 km soil retention service layer. Therefore, we built a model which allocates the GDP statistics of prefecture-level cities to the grid with a resolution of 1 km × 1 km based on the remotely sensed nightlight data. For a large area with obvious spatial heterogeneity, such as the Loess Plateau, for simplicity, we assume that the GDP and remotely sensed nightlight have the same spatial pattern, which is widely used in similar studies [53,55].
First, we aggregated the 1 km night-time light data within each prefecture-level city as the unit and drew the scatter diagram with GDP data to conduct a correlation analysis. Then, we conducted a series of regression analyses on the total night-time light (TNL) and the actual GDP statistic at the prefecture level and found that the linear regression fitted the observed values well (R2 > 0.8), so we chose the linear regression equation as the GDP spatial model.
GDP s i m ( n ,   t ) = a × TNL ( n ,   t ) + b
where GDPsim(n, t) denotes the GDP analog value of the prefecture-level city n in year t, and the least squares method solves the regression model parameters a and b. TNL(n, t) is the sum of DN values of all pixels of the night-time light data layer in city n in year t of the Loess Plateau.
Subsequently, we used the relative error (Equation (5)) to analyze the regression precision of the GDP.
Er ( n ,   t ) = GDP s i m ( n ,   t ) GDP s i m ( n ,   t ) GDP s t a ( n ,   t )
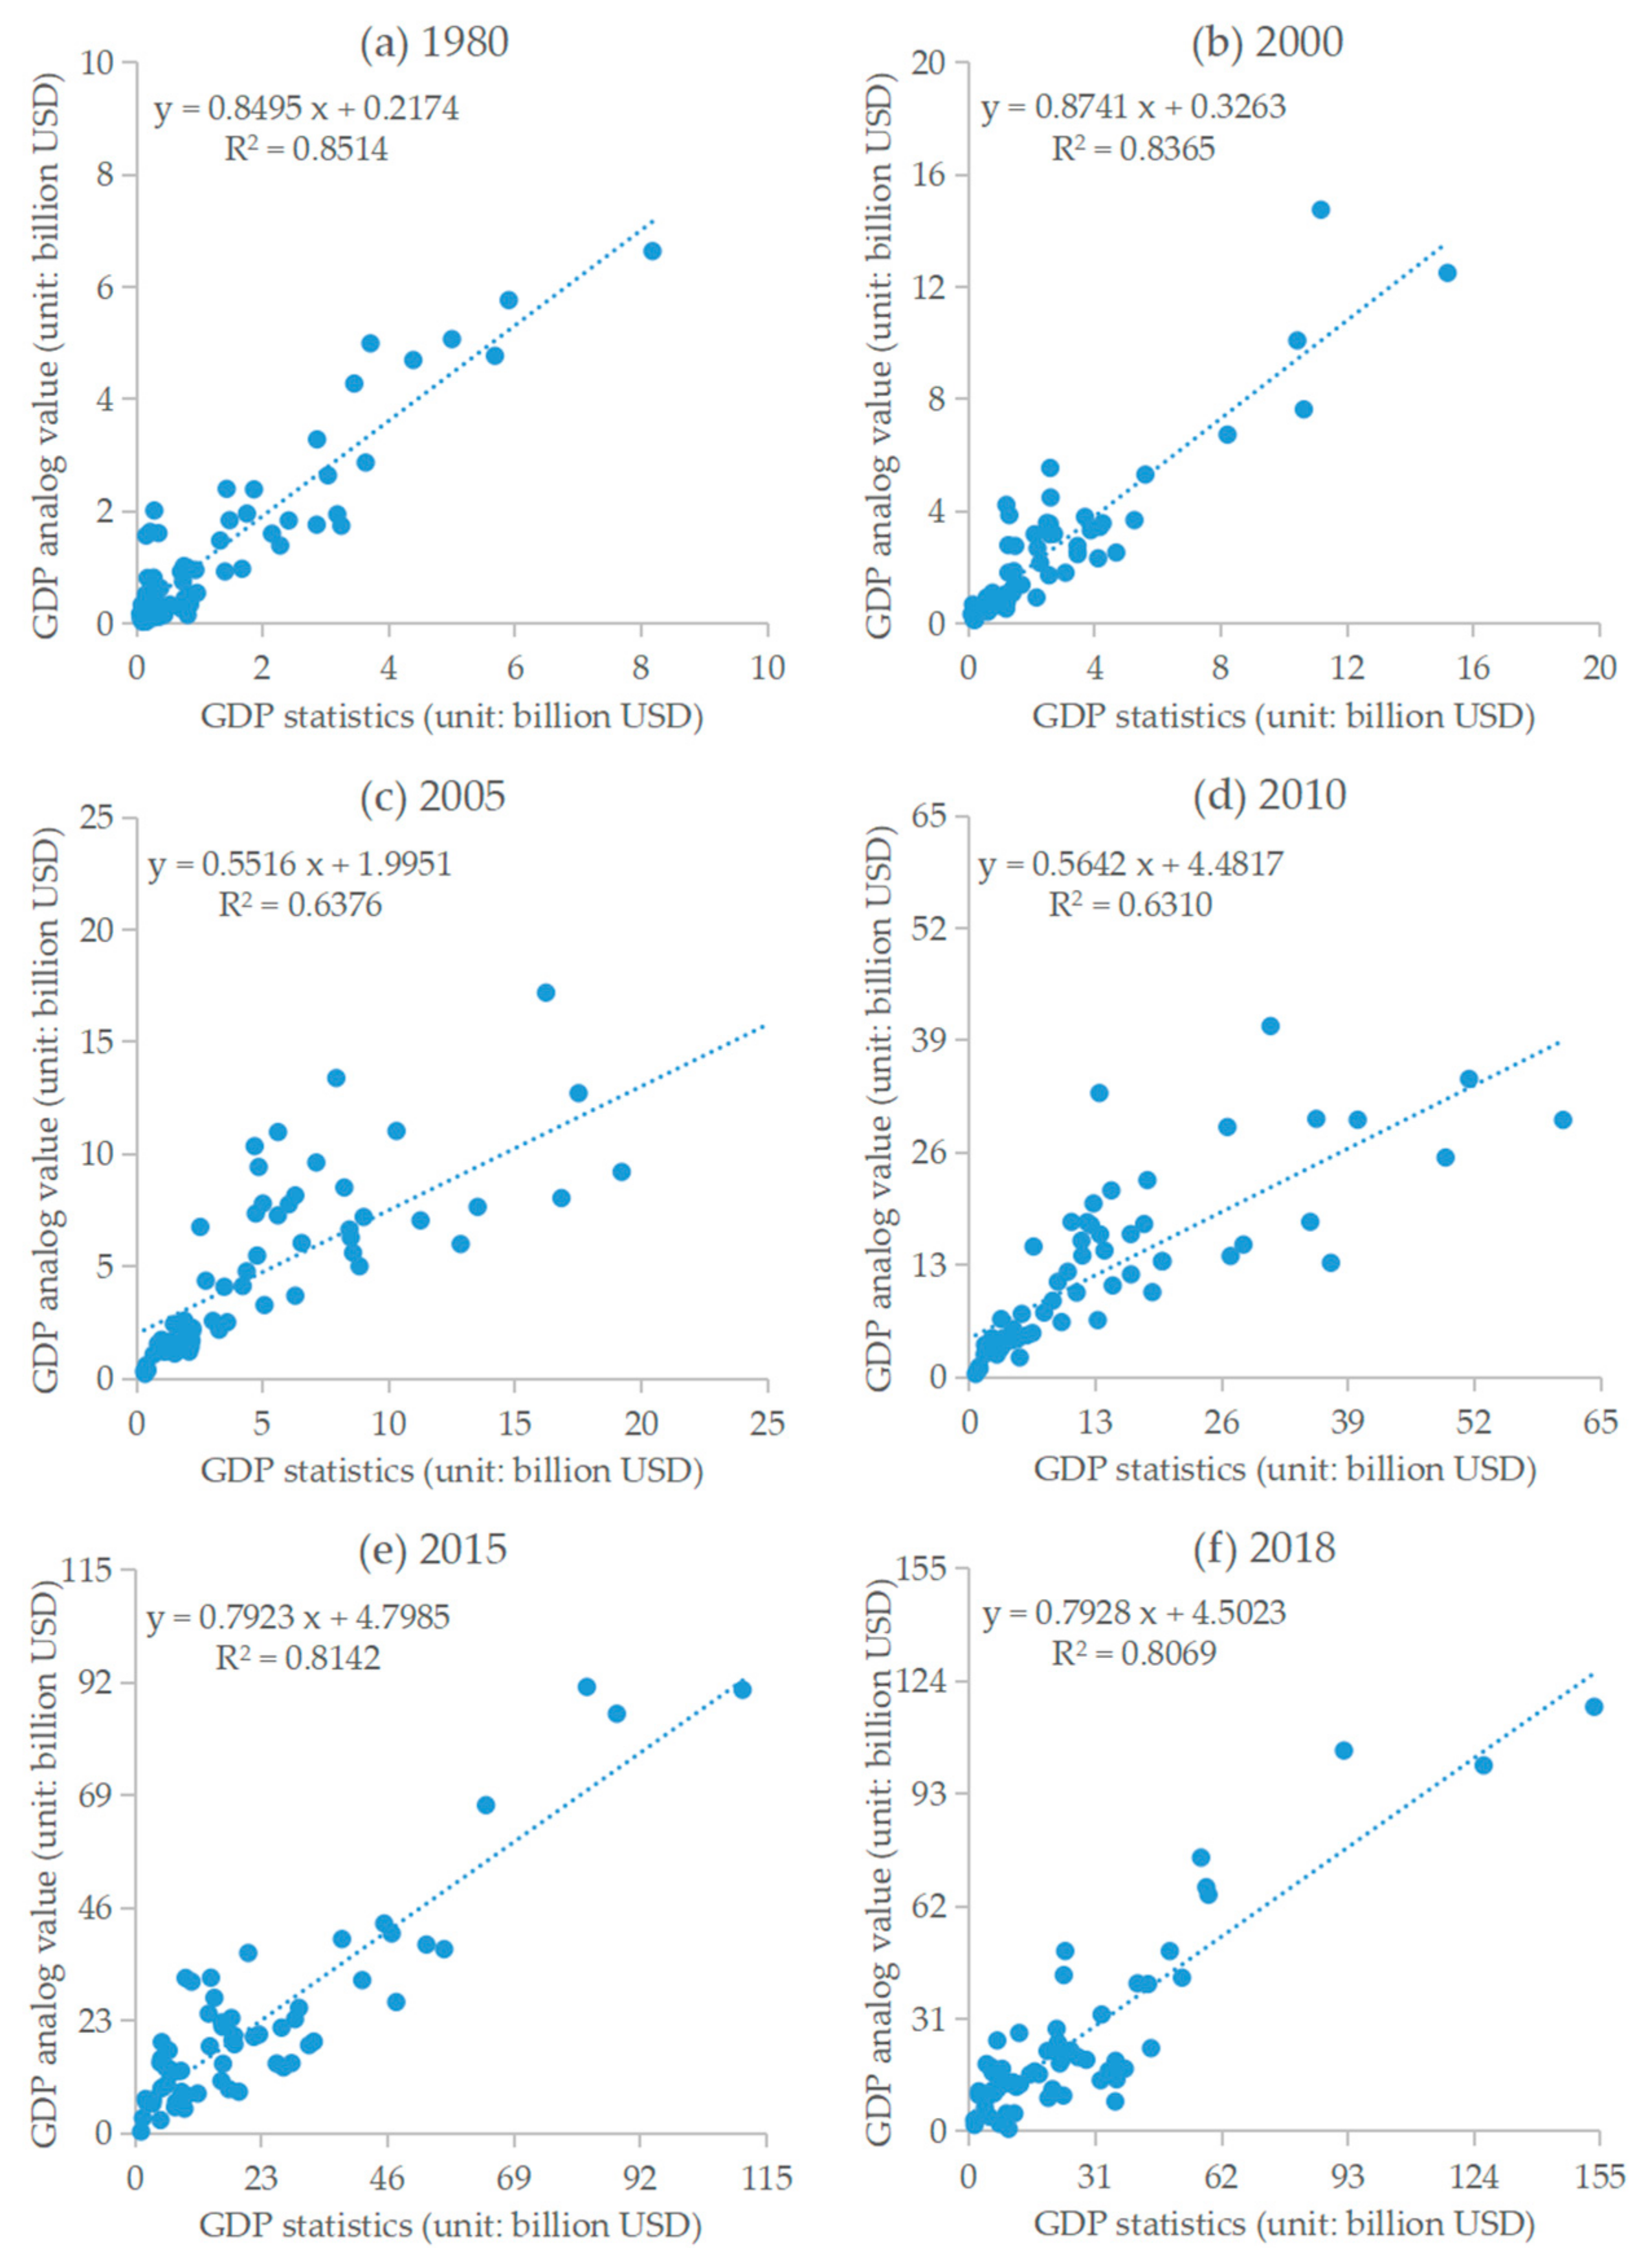
where Er(n, t) denotes the relative error of the regression. The closer it is to 0, the higher the regression precision of the GDP. GDPsta(n, t) is the GDP statistic for all industries of prefecture-level city n in year t, and GDPsim(n, t) denotes the GDP analog value of prefecture-level city n in year t. In addition, we gave scatterplots of GDP statistics and analog values on the prefecture-level city scale to compare their differences.
Second, according to the regression equation, we allocated the municipal-level GDP(n, t) to the grid of 1 km × 1 km, and we obtained the grid-level GDPsim(i, t). Finally, it was corrected using the following equation [56].
GDP s i m _ r e v i s e ( i ,   t ) = GDP s i m ( i ,   t ) × GDP s t a ( n ,   t ) GDP s i m ( n ,   t )
where GDPsim_revise(i, t) is the corrected value of GDPsim(i, t) for grid i in year t.

3.4. Exploration of the Relationship between Soil Retention Service and Gross Domestic Product

We obtained the slopes of their changing trend based on a one-dimensional least squares linear regression equation with soil retention service and GDP as dependent variables. The equation is as follows.
k = n × t = 1 n ( t × S ( i ,   t ) ) t = 1 n t t = 1 n S ( i ,   t ) n × t = 1 n t 2 ( t = 1 n t ) 2
where k is the trend slope; n is the number of years; t is the year; when t equals to 1, 2, 3, 4, 5, 6, the corresponding years are 1980, 2000, 2005, 2010, 2015, 2018; S(i, t) is the statistic (soil retention service or GDP) of grid i in year t. k > 0 denotes growth, and k < 0 indicates decline. We take the k mean value of all k < 0 pixels (denoted as k1), k = 0 (denoted as 0), and the k mean value of all k > 0 pixels (denoted as k2) as the threshold values. If 0 < k < k2 (or k1 < k < 0), the soil retention service or GDP is in a slow increasing (or decreasing) zone; if the mean value of k2 < k < 2k2 (or 2k1 < k < k1), the soil retention service or GDP is in an increasing (or decreasing) zone; if k > 2k2 (or k < 2k1), the soil retention service or GDP is in a rapid increasing (or decreasing) zone. We then analyzed the spatiotemporal variations in the soil retention service and GDP of the Loess Plateau for 1980–2018 at a grid scale. Additionally, to explore the relationship between the soil retention service and GDP, we overlapped their change tendency spatially to identify areas where both increase and decrease synchronously.

4. Results

4.1. Spatial and Temporal Variation Characteristics of Soil Retention Service

The soil retention amount of the Loess Plateau and six comprehensive management zones showed a decreasing trend followed by an increasing trend from 1980 to 2018 (Table 2). The total soil retention amount increased by 27.69 million tons. Between 1980 and 2018, it increased by 12.51 million tons for 1980–2000 and increased by 15.17 million tons after the large-scale implementation of the Grain for Green program. In 2018, the soil retention per unit area of the Loess Plateau was 3506.09 t/km2, and the total soil retention amount reached above 2194 million tons.
The most significant improvement period of the soil retention service was 2000–2005, in which the soil retention amount increased by 11.70 million tons, and the annual growth per unit area was 18.69 t/km2. However, the soil retention amount did not always show a steady upward trend during 1980–2018, which dropped by 2.62 million tons from 2005 to 2010.
The loess gully region had the maximum amount of soil retention, which increased by 12.37 million tons for 1980–2018 (Table 2). On the contrary, the sandy and desert region had the minimum amount of soil retention and did not change much during the study period. In addition, the soil retention amount in the earth-rock mountain and valley plain regions increased faster than in the other regions. However, the growth rate of soil retention in the hilly gully and agricultural irrigation regions was relatively slow (Table 2).
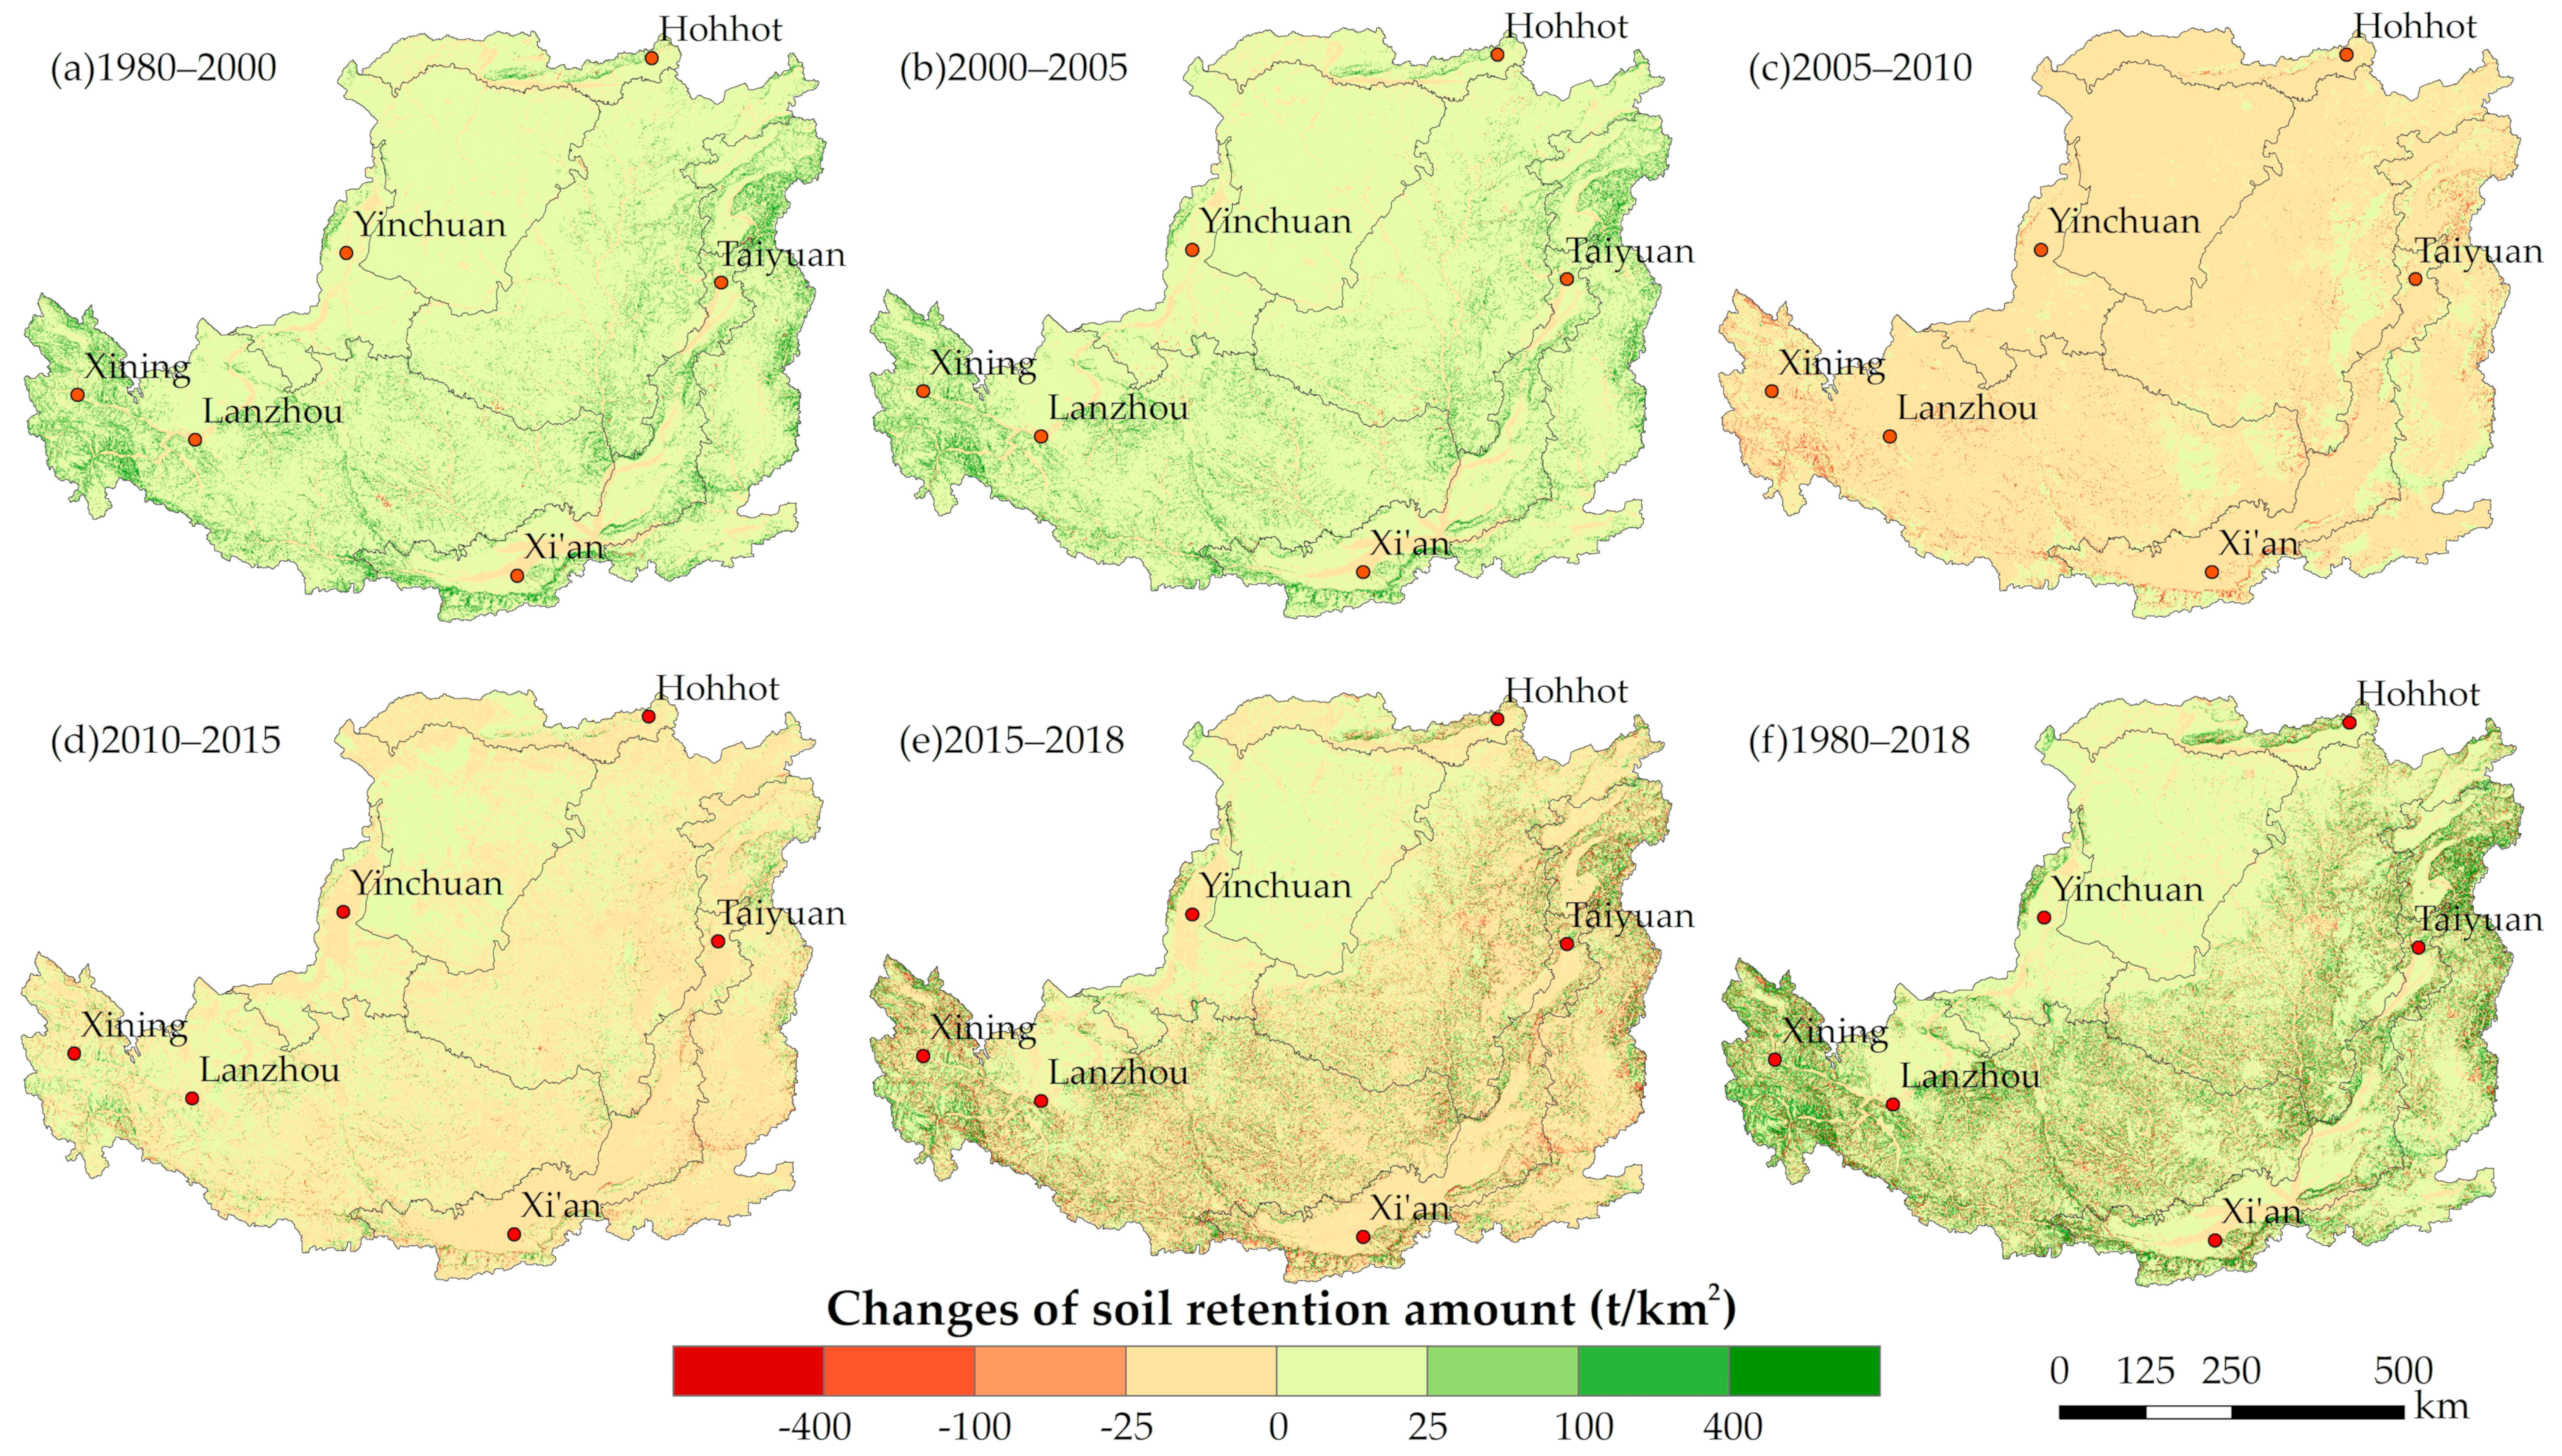
In terms of the spatial distribution of the soil retention service changes on the Loess Plateau (Figure 2), it increased from 3641.86 t/km2 to 3481.85 t/km2 for 1980–2000, and the area with a considerable reduction is predominately assembled in the earth-rock mountain, the loess gully, and the south of the valley plain regions (Figure 2a). After implementing the Grain for Green program, the soil retention amount per unit area increased observably, especially in the loess gully region, and it increased by 26.54 t/km2 for 2000–2005 (Figure 2b). However, soil conservation in the Loess Plateau has slightly declined (−25~0 t/km2) in a wide range since 2005 (Figure 2c). By 2010, soil retention had resumed rising (Figure 2d,e). On the whole, the soil retention service of the Loess Plateau experienced a process of fluctuation, rising from 1980 to 2018 (Figure 2f).

4.2. Spatial and Temporal Characteristics of Economic Development

As shown in Table 3, the relative errors of the GDP analog value estimated by the GDP spatial regression model for the whole study area ranged from 0.0025 to 0.1096 during 1980–2018, with an average relative error value of 0.08. The relative errors for 1980 and 2000 were 0.0025 and 0.0082, respectively. Furthermore, it can be seen from the scatterplot of the GDP statistics and analog values on the prefecture-level city scale (Appendix B) that there is little difference between the two. These indicate that the accuracy of our GDP regression results is high.
According to Equation (6), the GDP was allocated to the 1 km grid to attain the GDP spatial distribution and its variation maps (Figure 3). The average GDP density for the six years was 51,518 USD/km2, 105,009 USD/km2, 274,465 USD/km2, 697,128 USD/km2, 1,112,725 USD/km2, and 1,380,885 USD/km2, respectively.
It can be seen that GDP growth was spatially uneven, with a general downward trend from southeast to northwest (Figure 3). During the whole study period (Figure 3f), the central city of each comprehensive management zone developed rapidly, expanding the scope of urbanization outward and driving the continued economic growth of the peripheral areas. Before 2000 (Figure 3a), the GDP of each comprehensive management zone was generally low, and the speed of economic development was relatively slow. For 2000–2018 (Figure 3b–e), driven by rapid urbanization development, the GDP of sectional regions began to show a spatially patchy distribution pattern radiating from the high-value central cities to the surrounding areas. For example, Xi’an and Taiyuan are the capital cities of Shaanxi and Shanxi provinces, respectively, and their rapid development has driven the fast economic growth of the surrounding areas. In addition, it can also be seen that the GDP of the loess gully and loess hilly gully regions showed rapid growth along rivers.
We also extracted and summarized the GDP of each integrated management zone for all years (Table 4). For 1980–2000, economic development was relatively at a slow growth stage, and the annual growth rate of the GDP was only 5.19%, with most regions of the GDP value below 15,000 USD/km2. From 2000 onwards, the level of economic development entered a rapid growth phase. During 2000–2018, the annual growth rate of the GDP increased by 67.50%, indicating that the economic development level had improved observably.

4.3. The Relationship between Soil Retention Service and Economic Development

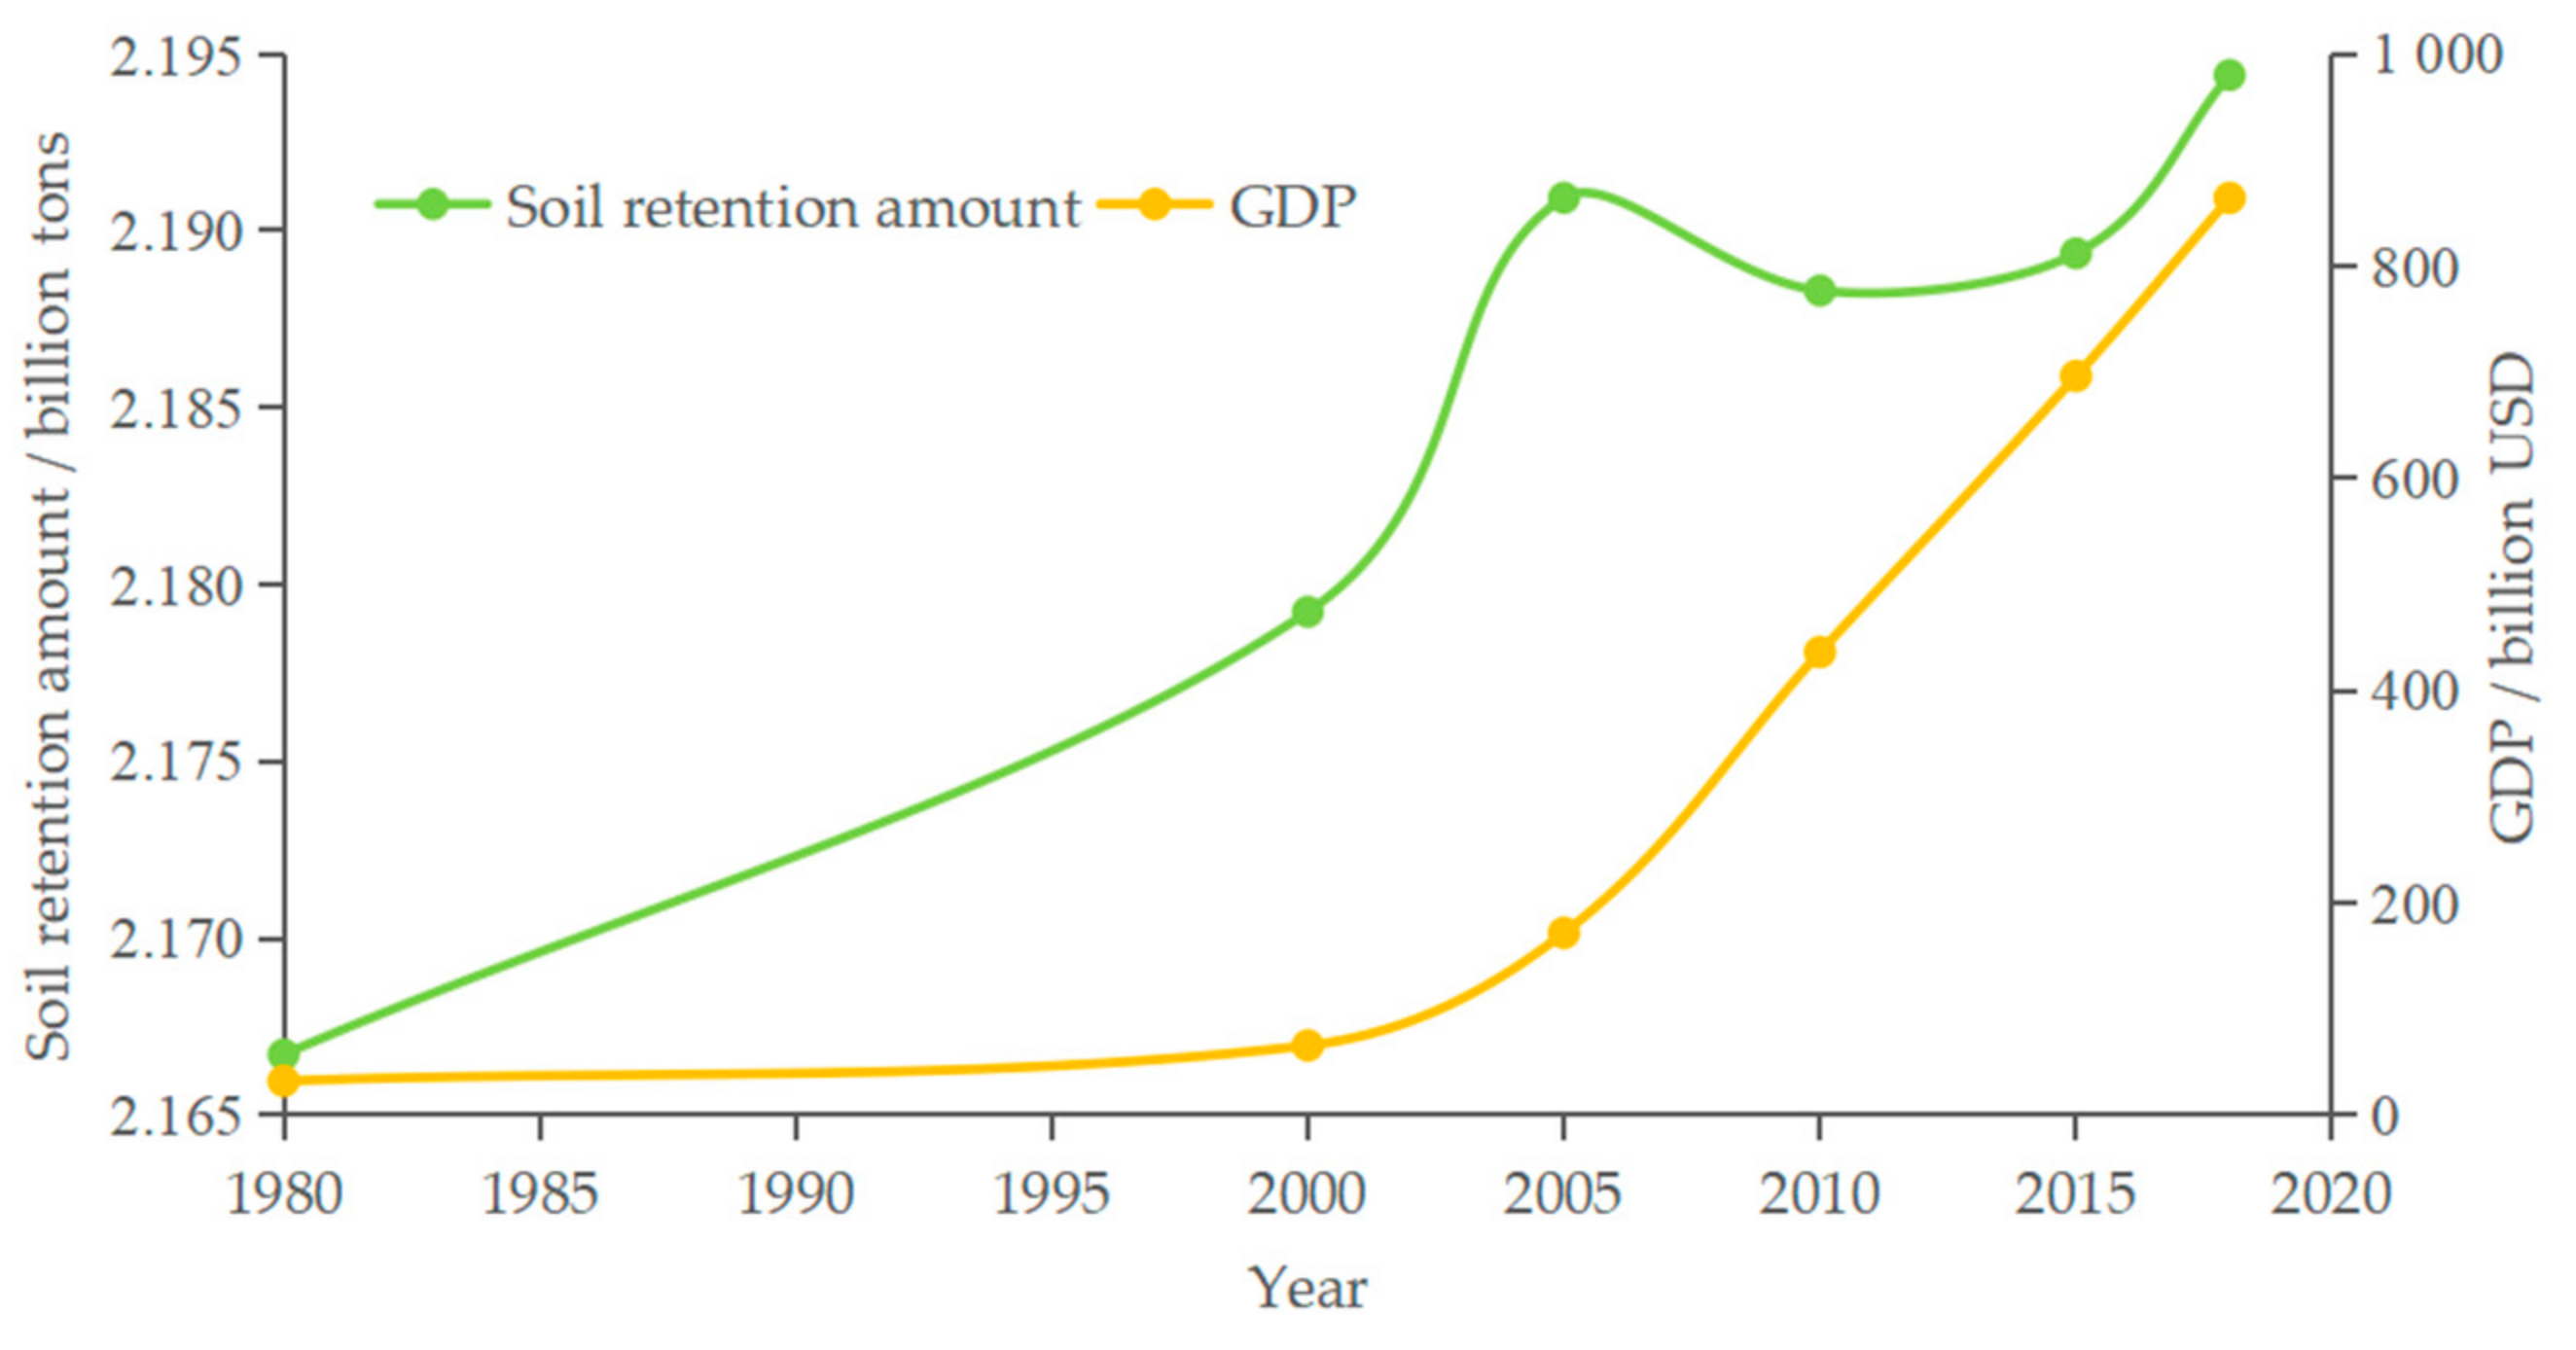
Economic development of the Loess Plateau demonstrated a continuous growth trend for 1980–2018, but the soil retention service showed a fluctuant increase, which appeared to be a slight decline for 2005–2010 (Figure 4). For 1980–2000, the soil retention growth amount was about 20.00 t/km2, and the GDP growth speed was relatively slow. For 2000–2018, the soil retention amount increased to 24.24 t/km2, and the average annual growth rate of the GDP came up to 67.50%. A win–win situation of soil retention and economic development was achieved in the Loess Plateau of China during this period.
Spatially, for 1980–2018, the soil retention service showed an elevated trend over 70% of areas on the Loess Plateau (Figure 5a). First, the distribution of slow-growth areas was the most wide, accounting for 59.03%. Secondly, the soil retention service declined in 16.05% of the areas, predominantly distributed in the loess gully and loess hilly gully regions. In addition, 17.95% of the fast-growing regions were mainly distributed in the valley plain, loess gully, and earth-rock mountain regions.
During the study period, the economic development conditions also showed an increasing trend beyond 80% of the areas (Figure 5b), where the slow-growth regions are the most widely distributed, accounting for 67.31%. The regions with rapid GDP growth were mainly concentrated in the southern valley plain, the agricultural irrigation region, and the southwest loess hilly gully region.
As seen in Figure 5c, the soil retention service and GDP increased jointly in 61.62% of the study area, which was mainly distributed in the loess gully and loess hilly gully regions. The regions where soil retention services were rising while the GDP remained stable, accounting for 14.82%, were mainly located in the sandy and desert region. The percentage of regions where the GDP continued to grow while soil retention declined was 12.82%, with the maximum distribution in the loess gully, loess hilly gully, and earth-rock mountain regions. Overall, the simultaneous improvement in the soil retention service and economic status was the dominant trend in the Loess Plateau.
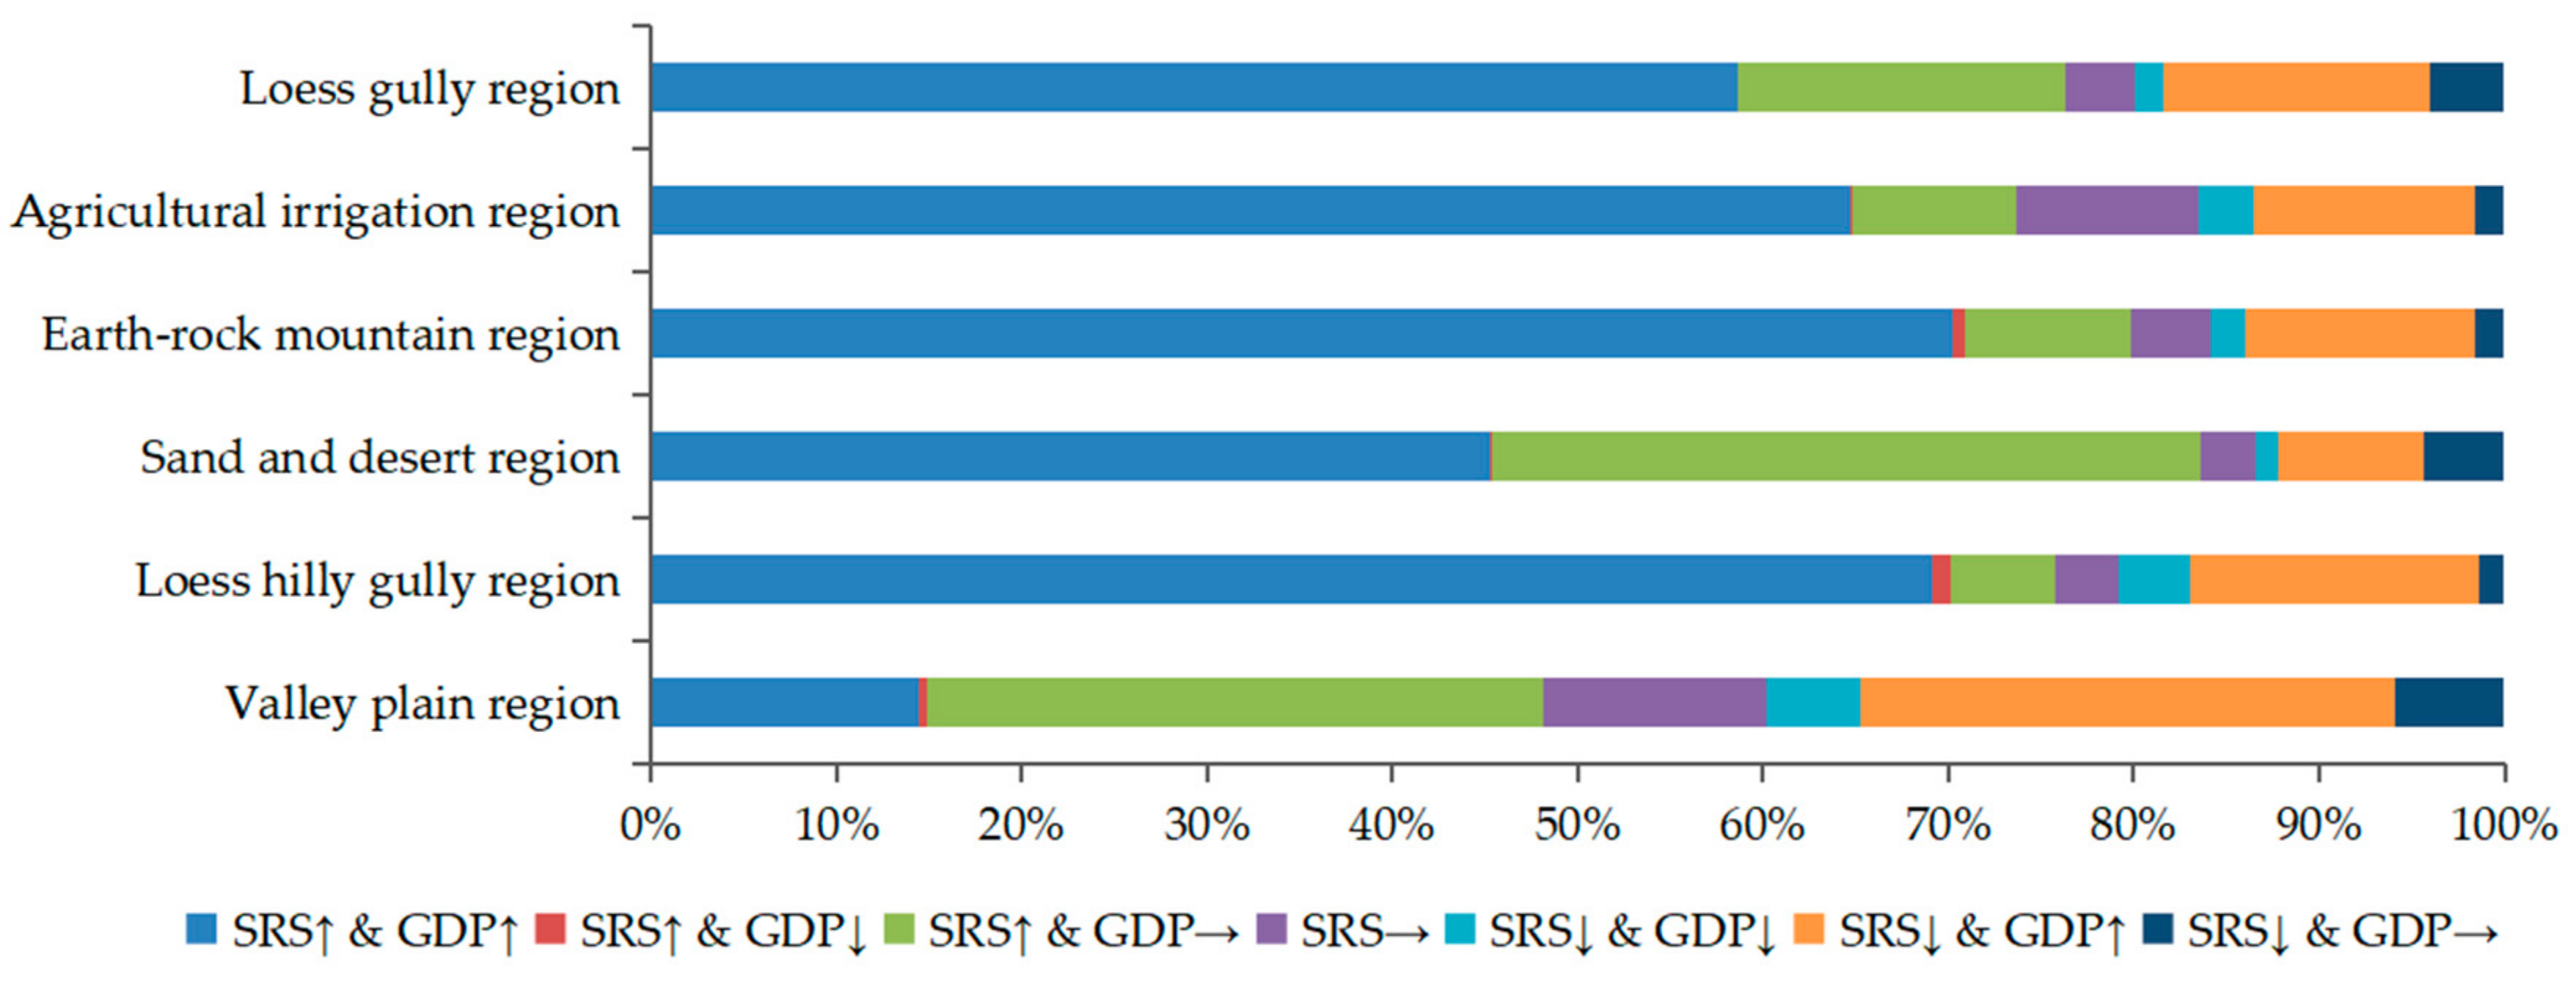
As revealed by Figure 6, the synchronous growth of the soil retention service and GDP dominated in each integrated management zone, especially in the loess hilly gully and earth-rock mountain regions, reaching nearly 70%. Compared to other integrated management zones, the valley plain and sand desert region had a large proportion of areas where the soil retention service was boosted and the GDP remained stable, accounting for 33.31% and 38.24%, respectively. The smallest proportion was the simultaneous decline in the soil retention service and GDP. In addition, it can also be found that the valley plain has a large proportion of soil retention service decreasing and GDP increasing.

5. Discussion

We first compared our findings with previous studies. After the Grain for Green program, our modeling results show that the soil retention service has been increasing, which is consistent with the findings of previous studies that the sediment content of the Yellow River and soil loss on the Loess Plateau are decreasing [42,57,58]. Specifically, Fu et al. [59] found that revegetation of the Loess Plateau has led to controlled soil loss effectively since 2000, as the average soil retention rate was up to 63.3% for 2000–2018. Wang et al. [42] found that the sediment load of the Yellow River has decreased by 90% over the past 60 years. In addition, we presented the soil retention service maps of the Loess Plateau for 1980–2018, which were unavailable in previous studies. These maps covering a long period are more valuable for local-scale decision makers than previous findings. In terms of economic growth, we also mapped the GDP at a grid cell of 1 × 1 km using the remotely sensed night-time light data in our study, which is also more informative than prefecture-scale statistics and beneficial to many fine-grained analyses. For example, a 1 km scale GDP map can be used to calculate the GDP value of a physical geographic region or ecoregion. Additionally, we explored the relationship between soil retention service and GDP in a spatially explicit way and at large scales, which is also beneficial to land use spatial planning in terms of soil conservation and economic development.
Next, we analyzed the potential reasons for the simultaneous growth of soil retention service and economic development. The climate conditions of the Loess Plateau have been stable since 2000 [60]. At the same time, the Chinese government implemented the Grain for Green program. As a result, the vegetation on the Loess Plateau has been extensively restored. Although the program has a negative impact on cropland areas [61], the positive impact of advances in agricultural technology is much more and increases the sustainability of the grain production system [57]. The program also makes agricultural cultivation more intensive, resulting in increasing grain yield per unit area [46]. Moreover, the program is also conducive to effectively transferring surplus rural labor to the secondary and tertiary industries [62] (Figure 7).
In addition, the implementation of the Western Development Strategy in 2000 also promoted the optimization and upgrading of industries in the Loess Plateau [63]. At the same time, the government has expanded tax incentives and relaxed conditions for resource development, resulting in a gradual improvement in economic conditions (Figure 7).
The environmental problems faced by each integrated management zone are different, so the restoration measures adopted are also different [64]. The loess gully and loess hilly gully regions are the main vegetation restoration areas, which have obtained considerable ecological and economic benefits by developing forestry and fruit industries. The agriculture irrigation, valley plain, and earth-rock mountain regions have a large amount of space for agricultural production, with good vegetation conditions and sufficient irrigation. Under the influence of Grain for Green, agricultural production has shifted to intensive farming, which has greatly increased the yield of cash crops and farmers’ income. It also propels the increase in non-farm employment, adjusts the economic structure of urban and rural areas, and enhances economic development [65].
In the Loess Plateau, the effective implementation of the Grain for Green program and a series of economic policies not only received great achievements in ecological protection but also contributed to obvious economic effects. The government’s rational spatial planning combined with the characteristics of different management zones is also the key reason why the Loess Plateau has achieved high-quality development.
Subsequently, we discussed the policy implications of our findings. The relationship between soil retention service and economic development can directly reflect the advantages of sustainable development, the trend of regional industrial restructuring, and the importance of national policy orientation [40,64]. By analyzing the interaction between soil retention capacity and economic conditions in each integrated management zone, it is found that adopting a site-specific approach can provide a reference for exploring how to ensure steady improvement in ecosystem services in the urbanization process in the Loess Plateau.
Not only in China but also in other countries where ecological conservation projects have been implemented, large areas of vegetation cover have been restored through planting and natural regeneration. For example, in Africa, where the “The Great Green Wall” ecological project was led, and in Pakistan, where the “Billion Tree Tsunami” project was launched [15]. The experience of the Loess Plateau on the relationship between ecological conservation and economic development may enable to apply to these regions where ecological conservation and restoration efforts have yielded substantial achievements in order to help them promote sustainable ecological and economic development.
There are limitations in this study. First of all, we directly apply the relationship between GDP and night lights at the prefecture-level city scale to the grid scale, which may cause some uncertainty [66]. In addition, we briefly explored the relationship between soil retention service and economic development using a one-dimensional least squares linear regression equation because the amount of data is relatively large. The explicit consideration of a spatial panel approach in the future would make this section more convincing for readers. We also discussed the potential reasons for their simultaneous growth, but did not explore the internal mechanism of their simultaneous growth, which should be considered in the future using an elaborated model. Finally, we replaced the 1980 vegetation data with 1982 vegetation data, which will lead to slight uncertainties in the calculation of soil retention service.

6. Conclusions

Exploring the spatial relationship between ecosystem services and economic development at large scales is crucial for decision makers to formulate sustainable development policy. We evaluated the soil retention service of the Loess Plateau in China for 1980–2018 by utilizing the InVEST model. Next, we spatialized the GDP statistics based on the remotely sensed nightlight data. Then, we explored the spatial and temporal change characteristics of the soil retention service and economic development on the Loess Plateau and their spatial relationships. As a result, the soil retention amount of the Loess Plateau increased from 2.167 billion tons in 1980 to 2.194 billion tons in 2018. At the same time, the GDP of the study area increased from 32.2 billion USD to 864.3 billion USD. We found a win–win situation of soil conservation and economic development was achieved in the Loess Plateau for 1980–2018 because of the Grain for Green program, the optimization of industrial structure, and the increase in non-agriculture employment. We explored the spatial relationship between soil retention service and GDP in a spatially explicit way and at large scales, which is more informative than previous studies for policymakers, e.g., environmental managers.

Author Contributions

Conceptualization, S.L. and J.X.; methodology, S.L. and J.X.; software, J.X.; validation, S.L. and J.X.; formal analysis, S.L. and J.X.; investigation, S.L. and J.X.; resources, S.L. and J.X.; data curation, J.X.; writing—original draft preparation, S.L. and J.X.; writing—review and editing, S.L., J.X. and B.P.; visualization, J.X. and S.L.; supervision, S.L.; project administration, S.L.; funding acquisition, S.L. and B.P. All authors have read and agreed to the published version of the manuscript.

Funding

This research was funded by the National Natural Science Foundation of China, grant numbers 41971245 and 42001229.

Data Availability Statement

The data presented in this study are available on request from the corresponding author.

Acknowledgments

We would like to thank the National Science and Technology Resources Sharing Service Platform–National Earth System Science Data Center–the Loess Plateau Subcenter (http://loess.geodata.cn, accessed on 2 March 2021) for their data support.

Conflicts of Interest

The authors declare no conflict of interest.

Appendix A

There was a significant linear correlation between the NDVI and vegetation coverage. We used the binary pixel model to estimate the vegetation coverage. Assuming that the pixel information is only composed of vegetation and soil, the calculation formula of the NDVI value is as follows.
f v = N D V I t N D V I s o i l t / N D V I v e g t N D V I s o i l t
where fv denotes the vegetation average in year t. NDVI(t) is the average vegetation index of year t, and the upper and lower thresholds of NDVI(t) are intercepted with 0.5% confidence. NDVIveg(t) is the vegetation index of the pure vegetation pixel, which is obtained by extracting the average value of the largest 0.5% area of NDVI(t). NDVIsoil(t) is the vegetation index of the pure soil pixel, which is obtained by raising the average value of 0.5% area with the smallest NDVI(t).
Next, we used the method of Cai et al. [51] to calculate the vegetation cover management factor C, and we estimated the average vegetation coverage factor of different land use types in the Loess Plateau for 1980–2018. The equation is as follows:
C = 1 f v t = 0 C = 0.6508 0.3436 l g f v t 0 < f v t < 78.3 %   C = 0 f v t > 78.3 %  
where C denotes the vegetation cover management factor.
The results are given in Table A1.
Table A1. Vegetation coverage factors of different land use types.
Land Use Types198020002005201020152018
Cultivated land0.0985 0.0879 0.0747 0.0791 0.0871 0.0903
Woodland 0.0451 0.0384 0.0360 0.0345 0.0362 0.0396
Grassland0.1467 0.1343 0.1200 0.1230 0.1171 0.1078
Waters 0.1556 0.1313 0.1166 0.1533 0.1398 0.1294
Construction land0.0839 0.0769 0.0721 0.0852 0.1028 0.1092
Unutilized land0.3120 0.2825 0.2628 0.2801 0.2855 0.2122

Appendix B

Figure A1. Scatterplots of GDP statistics and analog values on the prefecture-level city.
Remotesensing 15 03035 g0a1

References

  1. Costanza, R.; de Groot, R.; Braat, L.; Kubiszewski, I.; Fioramonti, L.; Sutton, P.; Farber, S.; Grasso, M. Twenty years of ecosystem services: How far have we come and how far do we still need to go? Ecosyst. Serv. 2017, 28 Pt A, 1–16. [Google Scholar] [CrossRef]
  2. Daily, G.; Myers, J.P.; Reichert, J.; Postel, S. Nature’s Services: Societal Dependence on Natural Ecosystems; Island Press: Washington, DC, USA, 1997. [Google Scholar]
  3. Newbold, T.; Hudson, L.N.; Arnell, A.P.; Contu, S.; De Palma, A.; Ferrier, S.; Hill, S.L.L.; Hoskins, A.J.; Lysenko, I.; Phillips, H.R.P.; et al. Has land use pushed terrestrial biodiversity beyond the planetary boundary? A global assessment. Science 2016, 353, 288–291. [Google Scholar] [CrossRef] [PubMed]
  4. Johnson, C.N.; Balmford, A.; Brook, B.W.; Buettel, J.C.; Galetti, M.; Lei, G.C.; Wilmshurst, J.M. Biodiversity losses and conservation responses in the Anthropocene. Science 2017, 356, 270–274. [Google Scholar] [CrossRef] [PubMed]
  5. Foley, J.A.; DeFries, R.; Asner, G.P.; Barford, C.; Bonan, G.; Carpenter, S.R.; Chapin, F.S.; Coe, M.T.; Daily, G.C.; Gibbs, H.K.; et al. Global consequences of land use. Science 2005, 309, 570–574. [Google Scholar] [CrossRef] [PubMed] [Green Version]
  6. Li, S.; Zhang, H.; Zhou, X.; Yu, H.; Li, W. Enhancing protected areas for biodiversity and ecosystem services in the Qinghai–Tibet Plateau. Ecosyst. Serv. 2020, 43, 101090. [Google Scholar] [CrossRef]
  7. Millennium, E.A. Ecosystems and Human Well-Being: Synthesis; World Resources Institute: Washington, DC, USA, 2005. [Google Scholar]
  8. Bongaarts, J. Summary for policymakers of the global assessment report on biodiversity and ecosystem services of the Intergovernmental Science-Policy Platform on Biodiversity and Ecosystem Services. Popul. Dev. Rev. 2019, 45, 680–681. [Google Scholar] [CrossRef] [Green Version]
  9. United Nations. Transforming Our World: The 2030 Agenda for Sustainable Development. 2015. Available online: https://sustainabledevelopment.un.org/post2015/transformingourworld/publication (accessed on 15 October 2015).
  10. Keesstra, S.; Mol, G.; de Leeuw, J.; Okx, J.; Molenaar, C.; de Cleen, M.; Visser, S. Soil-Related Sustainable Development Goals: Four Concepts to Make Land Degradation Neutrality and Restoration Work. Land 2018, 7, 133. [Google Scholar] [CrossRef] [Green Version]
  11. Sachs, J.D.; Schmidt-Traub, G.; Mazzucato, M.; Messner, D.; Nakicenovic, N.; Rockstrom, J. Six Transformations to achieve the Sustainable Development Goals. Nat. Sustain. 2019, 2, 805–814. [Google Scholar] [CrossRef]
  12. Fischer, J.; Riechers, M.; Loos, J.; Martin-Lopez, B.; Temperton, V.M. Making the UN Decade on Ecosystem Restoration a Social-Ecological Endeavour. Trends Ecol. Evol. 2021, 36, 20–28. [Google Scholar] [CrossRef]
  13. Morita, K.; Okitasari, M.; Masuda, H. Analysis of national and local governance systems to achieve the sustainable development goals: Case studies of Japan and Indonesia. Sustain. Sci. 2020, 15, 179–202. [Google Scholar] [CrossRef] [Green Version]
  14. Yu, S.M.; Sial, M.S.; Tran, D.K.; Badulescu, A.; Thu, P.A.; Sehleanu, M. Adoption and Implementation of Sustainable Development Goals (SDGs) in China-Agenda 2030. Sustainability 2020, 12, 6288. [Google Scholar] [CrossRef]
  15. Pashkevich, M.D.; d’Albertas, F.; Aryawan, A.A.K.; Buchori, D.; Caliman, J.-P.; Chaves, A.D.G.; Hidayat, P.; Kreft, H.; Naim, M.; Razafimahatratra, A.; et al. Nine actions to successfully restore tropical agroecosystems. Trends Ecol. Evol. 2022, 37, 963–975. [Google Scholar] [CrossRef] [PubMed]
  16. Feng, X.M.; Fu, B.J.; Piao, S.; Wang, S.H.; Ciais, P.; Zeng, Z.Z.; Lu, Y.H.; Zeng, Y.; Li, Y.; Jiang, X.H.; et al. Revegetation in China’s Loess Plateau is approaching sustainable water resource limits. Nat. Clim. Chang. 2016, 6, 1019–1022. [Google Scholar] [CrossRef]
  17. Deng, L.; Liu, G.B.; Shangguan, Z.P. Land-use conversion and changing soil carbon stocks in China’s ‘Grain-for-Green’ Program: A synthesis. Glob. Chang. Biol. 2014, 20, 3544–3556. [Google Scholar] [CrossRef] [PubMed]
  18. Cao, Z.; Li, Y.R.; Liu, Y.S.; Chen, Y.F.; Wang, Y.S. When and where did the Loess Plateau turn “green”? Analysis of the tendency and breakpoints of the normalized difference vegetation index. Land Degrad. Dev. 2018, 29, 162–175. [Google Scholar] [CrossRef]
  19. Lu, N.; Fu, B.J.; Stafford-Smith, M.; Maestre, F.T.; Cheng, L.H. Breaking the land degradation-poverty nexus in drylands. Sci. Bull. 2022, 67, 2508–2512. [Google Scholar] [CrossRef]
  20. Mehrabi, Z.; Ellis, E.C.; Ramankutty, N. The challenge of feeding the world while conserving half the planet. Nat. Sustain. 2018, 1, 409–412. [Google Scholar] [CrossRef] [Green Version]
  21. Xing, L.; Xue, M.G.; Hu, M.S. Dynamic simulation and assessment of the coupling coordination degree of the economy-resource-environment system: Case of Wuhan City in China. J. Environ. Manag. 2019, 230, 474–487. [Google Scholar] [CrossRef]
  22. Schaltegger, S.; Synnestvedt, T. The link between ‘green’ and economic success: Environmental management as the crucial trigger between environmental and economic performance. J. Environ. Manag. 2002, 65, 339–346. [Google Scholar] [CrossRef]
  23. Wagner, M. How to reconcile environmental and economic performance to improve corporate sustainability: Corporate environmental strategies in the European paper industry. J. Environ. Manag. 2005, 76, 105–118. [Google Scholar] [CrossRef] [Green Version]
  24. Liu, J.G.; Hull, V.; Batistella, M.; DeFries, R.; Dietz, T.; Fu, F.; Hertel, T.W.; Izaurralde, R.C.; Lambin, E.F.; Li, S.X.; et al. Framing Sustainability in a Telecoupled World. Ecol. Soc. 2013, 18, 26. [Google Scholar] [CrossRef]
  25. Tamazian, A.; Chousa, J.P.; Vadlamannati, K.C. Does higher economic and financial development lead to environmental degradation: Evidence from BRIC countries. Energy Policy 2009, 37, 246–253. [Google Scholar] [CrossRef]
  26. Dinda, S. Environmental Kuznets Curve hypothesis: A survey. Ecol. Econ. 2004, 49, 431–455. [Google Scholar] [CrossRef] [Green Version]
  27. Leal, P.H.; Marques, A.C. The evolution of the environmental Kuznets curve hypothesis assessment: A literature review under a critical analysis perspective. Heliyon 2022, 8, e11521. [Google Scholar] [CrossRef] [PubMed]
  28. Hsiao, C.-M. Economic Growth, CO2 Emissions Quota and Optimal Allocation under Uncertainty. Sustainability 2022, 14, 8706. [Google Scholar] [CrossRef]
  29. Apergis, N.; Ozturk, I. Testing Environmental Kuznets Curve hypothesis in Asian countries. Ecol. Indic. 2015, 52, 16–22. [Google Scholar] [CrossRef]
  30. Venter, O.; Sanderson, E.W.; Magrach, A.; Allan, J.R.; Beher, J.; Jones, K.R.; Possingham, H.P.; Laurance, W.F.; Wood, P.; Fekete, B.M.; et al. Sixteen years of change in the global terrestrial human footprint and implications for biodiversity conservation. Nat. Commun. 2016, 7, 12558. [Google Scholar] [CrossRef] [PubMed] [Green Version]
  31. Konan, D.E. Limits to growth: Tourism and regional labor migration. Econ. Model. 2011, 28, 473–481. [Google Scholar] [CrossRef] [Green Version]
  32. Hatfield-Dodds, S.; Schandl, H.; Adams, P.D.; Baynes, T.M.; Brinsmead, T.S.; Bryan, B.A.; Chiew, F.H.S.; Graham, P.W.; Grundy, M.; Harwood, T.; et al. Australia is ‘free to choose’ economic growth and falling environmental pressures. Nature 2015, 527, 49–53. [Google Scholar] [CrossRef]
  33. Li, S.; Liu, X.; Paudel, B.; Xu, F.; Deng, Q. Stable sediment retention and rapid economic growth occurred together from the end of the 1970s to 2015 in the Three Gorges Reservoir area. Land Degrad. Dev. 2021, 32, 3653–3665. [Google Scholar] [CrossRef]
  34. Hartmann, J.; Preisendörfer, P. The relationship between ecology and economy in German public opinion, 1984–2019. Environ. Polit. 2023, 1–20. [Google Scholar] [CrossRef]
  35. Acuna, V.; Diez, J.R.; Flores, L.; Meleason, M.; Elosegi, A. Does it make economic sense to restore rivers for their ecosystem services? J. Appl. Ecol. 2013, 50, 988–997. [Google Scholar] [CrossRef]
  36. Fang, C.L.; Liu, H.M.; Li, G.D. International progress and evaluation on interactive coupling effects between urbanization and the eco-environment. J. Geogr. Sci. 2016, 26, 1081–1116. [Google Scholar] [CrossRef]
  37. Liu, J.; Li, S.; Ouyang, Z.; Tam, C.; Chen, X. Ecological and socioeconomic effects of China’s policies for ecosystem services. Proc. Natl. Acad. Sci. USA 2008, 105, 9477–9482. [Google Scholar] [CrossRef] [PubMed] [Green Version]
  38. Folke, C. Resilience: The emergence of a perspective for social-ecological systems analyses. Glob. Environ. Chang.-Hum. Policy Dimens. 2006, 16, 253–267. [Google Scholar] [CrossRef]
  39. Ostrom, E. A General Framework for Analyzing Sustainability of Social-Ecological Systems. Science 2009, 325, 419–422. [Google Scholar] [CrossRef]
  40. Liu, H.M.; Fang, C.L.; Fang, K. Coupled Human and Natural Cube: A novel framework for analyzing the multiple interactions between humans and nature. J. Geogr. Sci. 2020, 30, 355–377. [Google Scholar] [CrossRef]
  41. Ren, M.E. Sediment discharge of the Yellow River, China: Past, present and future—A synthesis. Acta Oceanol. Sin. 2015, 34, 1–8. [Google Scholar] [CrossRef]
  42. Wang, S.A.; Fu, B.J.; Piao, S.L.; Lu, Y.H.; Ciais, P.; Feng, X.M.; Wang, Y.F. Reduced sediment transport in the Yellow River due to anthropogenic changes. Nat. Geosci. 2016, 9, 38–41. [Google Scholar] [CrossRef]
  43. Ning, J.C.; Zhang, D.J.; Yu, Q. Quantifying the efficiency of soil conservation and optimized strategies: A case-study in a hotspot of afforestation in the Loess Plateau. Land Degrad. Dev. 2021, 32, 1114–1126. [Google Scholar] [CrossRef]
  44. Xu, X.; Zhang, D. Evaluating the effect of ecological policies from the pattern change of persistent green patches–A case study of Yan’an in China’s Loess Plateau. Ecol. Inform. 2021, 63, 101305. [Google Scholar] [CrossRef]
  45. Jiang, C.; Zhang, H.Y.; Zhang, Z.D. Spatially explicit assessment of ecosystem services in China’s Loess Plateau: Patterns, interactions, drivers, and implications. Glob. Planet. Chang. 2018, 161, 41–52. [Google Scholar] [CrossRef]
  46. Wu, X.T.; Wei, Y.P.; Fu, B.J.; Wang, S.; Zhao, Y.; Moran, E.F. Evolution and effects of the social-ecological system over a millennium in China’s Loess Plateau. Sci. Adv. 2020, 6, eabc0276. [Google Scholar] [CrossRef] [PubMed]
  47. Wang, S.; Song, S.; Zhang, J.Z.; Wu, X.T.; Fu, B.J. Achieving a fit between social and ecological systems in drylands for sustainability. Curr. Opin. Environ. Sustain. 2021, 48, 53–58. [Google Scholar] [CrossRef]
  48. Fu, B.J.; Wu, X.T.; Wang, Z.Z.; Wu, X.L.; Wang, S. Coupling human and natural systems for sustainability: Experience from China’s Loess Plateau. Earth Syst. Dyn. 2022, 13, 795–808. [Google Scholar] [CrossRef]
  49. Liu, J.Y.; Kuang, W.H.; Zhang, Z.X.; Xu, X.L.; Qin, Y.W.; Ning, J.; Zhou, W.C.; Zhang, S.W.; Li, R.D.; Yan, C.Z.; et al. Spatiotemporal characteristics, patterns, and causes of land-use changes in China since the late 1980s. J. Geogr. Sci. 2014, 24, 195–210. [Google Scholar] [CrossRef]
  50. Ning, J.; Liu, J.; Kuang, W.; Xu, X.; Zhang, S.; Yan, C.; Li, R.; Wu, S.; Hu, Y.; Du, G.; et al. Spatiotemporal patterns and characteristics of land-use change in China during 2010–2015. J. Geogr. Sci. 2018, 28, 547–562. [Google Scholar] [CrossRef] [Green Version]
  51. Cai, C.F.; Ding, S.W.; Shi, Z.H.; Huang, L.; Zhang, G.Y. Study of applying USLE and geographical information system IDRISI to predict soil erosion in small watershed. J. Soil Water Conserv. 2000, 14, 19–24. [Google Scholar]
  52. National Bureau of Statistics of China. China City Statistical Yearbook; China statistics Press: Beijing, China, 2019. (In Chinese)
  53. Li, X.C.; Zhou, Y.Y.; Zhao, M.; Zhao, X. A harmonized global night-time light dataset 1992–2018. Sci. Data 2020, 7, 168. [Google Scholar] [CrossRef]
  54. Sharp, R.; Tallis, H.T.; Ricketts, T.H.; Guerry, A.D. InVEST 3.2.0 Users Guide; The Natural Capital Project; Stanford University: Stanford, CA, USA; University of Minnesota: Minneapolis, MN, USA; The Nature Conservancy: Arlington, VA, USA; World Wildlife Fund: New York, NY, USA, 2018. [Google Scholar] [CrossRef]
  55. Li, S.; He, F.; Liu, X.; Hua, L. Historical land use reconstruction for South Asia: Current understanding, challenges, and solutions. Earth-Sci. Rev. 2023, 238, 104350. [Google Scholar] [CrossRef]
  56. Yang, N.; Wu, L.; Deng, S.; Zhang, C. Spatialization Method of Provincial Statistical GDP Data Based on DMSP/OLS Night Lighting Data: A Case Study of Guangxi Zhuang Autonomous Region. Geogr. Geo-Inf. Sci. 2014, 30, 108–111. [Google Scholar]
  57. Wu, X.T.; Wang, S.; Fu, B.J.; Feng, X.M.; Chen, Y.Z. Socio-ecological changes on the Loess Plateau of China after Grain to Green Program. Sci. Total Environ. 2019, 678, 565–573. [Google Scholar] [CrossRef] [PubMed]
  58. Song, X.; Peng, C.; Zhou, G.; Jiang, H.; Wang, W. Chinese Grain for Green Program led to highly increased soil organic carbon levels: A meta-analysis. Sci. Rep. 2014, 4, 4460. [Google Scholar] [CrossRef] [Green Version]
  59. Fu, B.J.; Liu, Y.; Lu, Y.H.; He, C.S.; Zeng, Y.; Wu, B.F. Assessing the soil erosion control service of ecosystems change in the Loess Plateau of China. Ecol. Complex. 2011, 8, 284–293. [Google Scholar] [CrossRef]
  60. Peng, S.Z.; Gang, C.C.; Cao, Y.; Chen, Y.M. Assessment of climate change trends over the Loess Plateau in China from 1901 to 2100. Int. J. Climatol. 2018, 38, 2250–2264. [Google Scholar] [CrossRef]
  61. Shi, P.; Feng, Z.H.; Gao, H.D.; Li, P.; Zhang, X.M.; Zhu, T.T.; Li, Z.B.; Xu, G.C.; Ren, Z.P.; Xiao, L. Has “Grain for Green” threaten food security on the Loess Plateau of China? Ecosyst. Health Sustain. 2020, 6, 1709560. [Google Scholar] [CrossRef] [Green Version]
  62. Liu, S.J.; Xue, L. The spatio-temporal heterogeneity of county-level economic development and primary drivers across the Loess Plateau, China. J. Geogr. Sci. 2021, 31, 423–436. [Google Scholar] [CrossRef]
  63. Yang, J.Y. The Implementation of the Western Development Strategy and the Research of Human Resource Management. Agro Food Ind. Hi-Tech 2017, 28, 730–734. [Google Scholar]
  64. Bai, Y.; Liu, Y.S.; Li, Y.H.; Wang, Y.S.; Yuan, X.F. Land consolidation and eco-environmental sustainability in Loess Plateau: A study of Baota district, Shaanxi province, China. J. Geogr. Sci. 2022, 32, 1724–1744. [Google Scholar] [CrossRef]
  65. Delang, C.O.; Yuan, Z. Ecological and Environmental Impact. In China’s Grain for Green Program: A Review of the Largest Ecological Restoration and Rural Development Program in the World; Delang, C.O., Yuan, Z., Eds.; Springer International Publishing: Cham, Switzerland, 2015; pp. 135–145. [Google Scholar] [CrossRef]
  66. Maatta, I.; Ferreira, T.; Lessmann, C. Night-time lights and wealth in very small areas: Namibian complete census versus DHS data. Rev. Reg. Res. Jahrb. Fur Reg. 2022, 42, 161–190. [Google Scholar] [CrossRef]
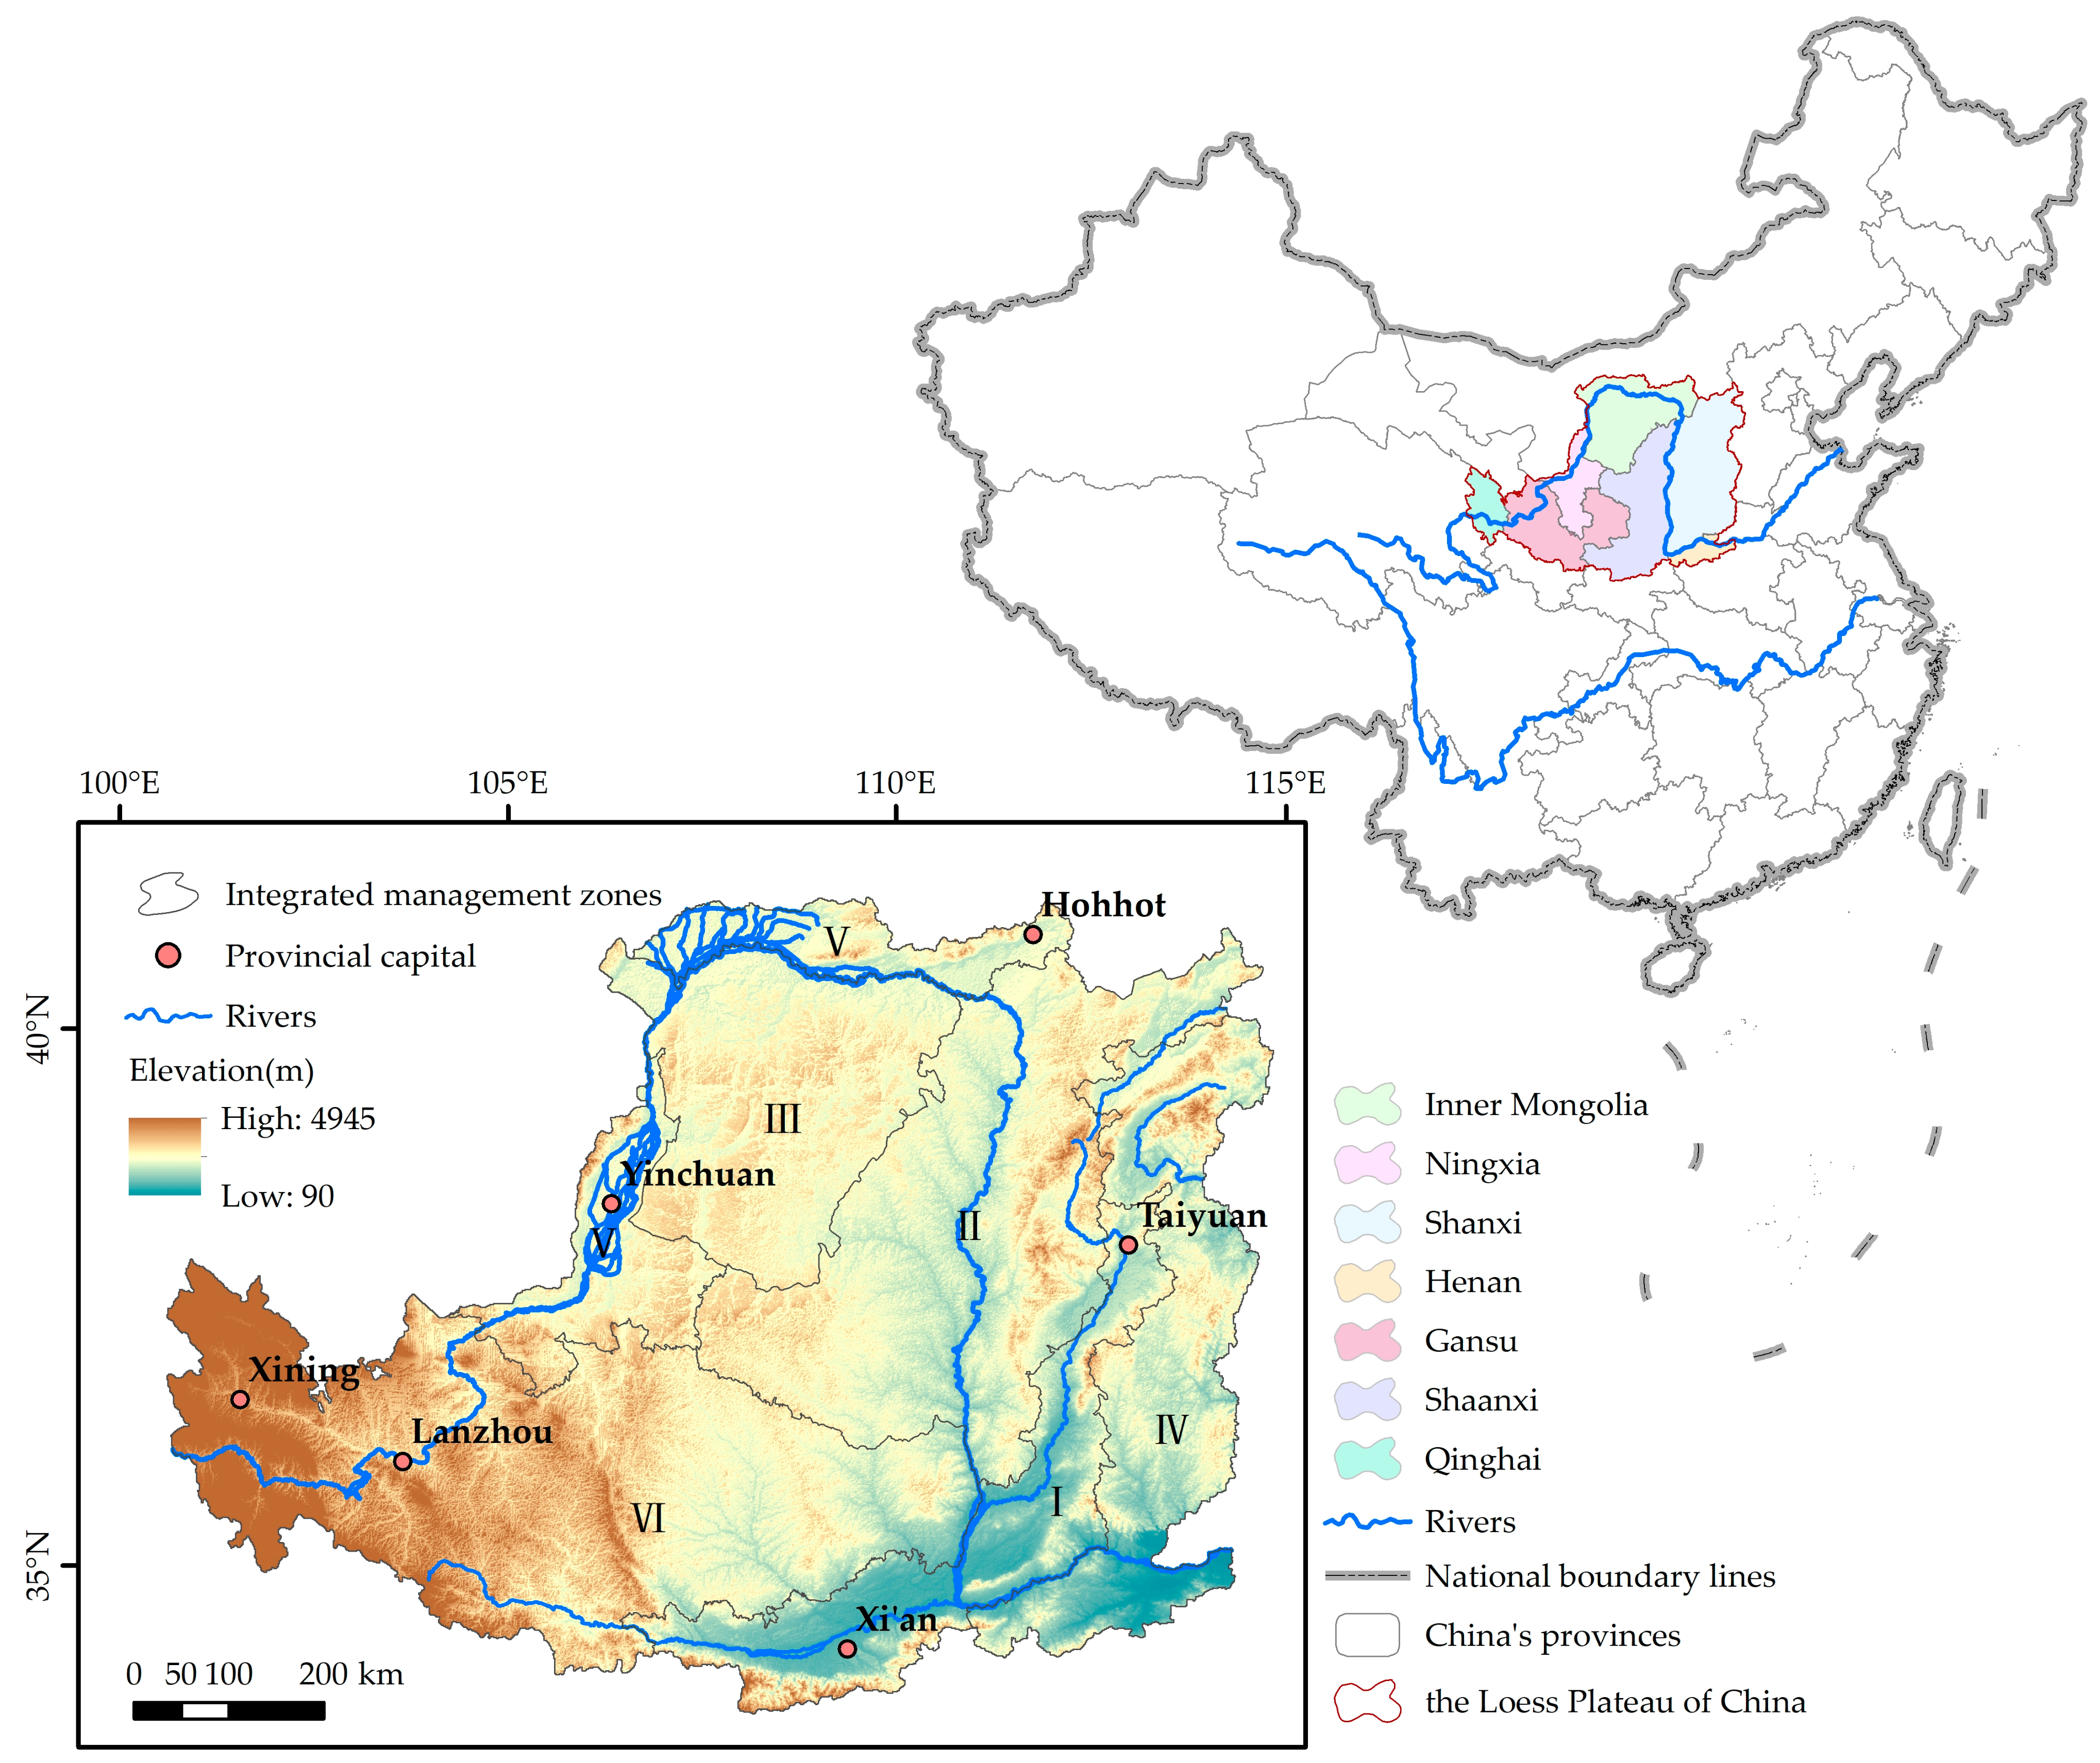
Figure 1. Location of the Loess Plateau and its comprehensive management zoning based on [18]. I: valley plain region; II: loess hilly gully region; III: sand and desert region; IV: earth-rock mountain region; V: agricultural irrigation region; VI: loess gully region. The large-scale Grain for Green program (also known as the Conversion of Cropland to Forest and Grassland program) has been implemented here since 1999 to reduce severe soil erosion.
Remotesensing 15 03035 g001
Figure 2. Spatial distribution of changes in soil retention amount on the Loess Plateau. (a) Before the implementation of the Grain for Green program during 1980–2000, (be) after the Grain for Green program during 2000–2018, and (f) the whole study period for 1980–2018. The soil retention service showed an increasing trend before the implementation of the Grain for Green program and a fluctuant upward trend after the Grain for Green program.
Remotesensing 15 03035 g002
Figure 3. Changes in the spatial distribution of gross domestic product in the Loess Plateau for periods (a) 1980–2000, (b) 2000–2005, (c) 2005–2010, (d) 2010–2015, (e) 2015–2018, and (f) 1980–2018. After 2000, the gross domestic product increased substantially, nearly for the whole region, especially for the urban center and surrounding regions.
Remotesensing 15 03035 g003
Figure 4. Trends of soil retention service and gross domestic product of the Loess Plateau for 1980–2018.
Remotesensing 15 03035 g004
Figure 5. Spatial distribution of the relationship between changes in soil retention service and economic development in the Loess Plateau for 1980–2018. (a) Trends in soil retention service, (b) trends in GDP, and (c) the relationship between soil retention service and GDP. “↑” represents an increase, “↓” represents a decrease, and “→” represents stability. Figures in parentheses refer to the proportion of such areas to the total land area. Soil retention service and GDP grew simultaneously in more than 60% of the study area. (I: valley plain region; II: loess hilly gully region; III: sand and desert region; IV: earth-rock mountain region; V: agricultural irrigation region; VI: loess gully region).
Remotesensing 15 03035 g005
Figure 6. Changes in soil retention service and GDP in each integrated management zone of the Loess Plateau. The simultaneous increase in soil retention service and GDP accounted for the largest proportion in most integrated management zones.
Remotesensing 15 03035 g006
Figure 7. Analysis of the potential reasons for the synergy between soil retention service and economic development.
Remotesensing 15 03035 g007
Table 1. Datasets required for calculating soil retention service and measuring economic development.
Dataset NameDataset Description and Source
DEMThe 1 km DEM data were downloaded from the Resource and Environment Science and Data Center, Chinese Academy of Sciences (http://www.resdc.cn, accessed on 27 February 2021).
Rainfall erosivity index RThe 250 m R is the average value for 1986–2015. It was downloaded from the National Science and Technology Resources Sharing Service Platform–National Earth System Science Data Center–the Loess Plateau Subcenter (http://loess.geodata.cn, accessed on 2 March 2021).
Soil erodibility factor KThe 30 m K was calculated by achievements of the second national soil survey for 1979–1994, which was downloaded from the same data-sharing platform as the rainfall erosivity index R.
LULCThe 1 km LULC datasets include six land use types, including cultivated land, forest, grassland, water area, construction land, and unutilized land, covering the years 1980, 2000, 2010, 2015, and 2018 [49,50]. They were downloaded from the same data-sharing platform as DEM.
Watershed boundaryIt was downloaded from the same data-sharing platform as the rainfall erosivity index R.
Cover-management factor CThe C of each land use type in corresponding years was calculated based on averaged Normalized Difference Vegetation Index (NDVI) of each land use type and the method of Cai et al. [51] (see Appendix A). The 1982–2020 monthly 5 km NDVI dataset product of China was used (http://loess.geodata.cn, accessed on 16 May 2023).
Support practice factor PIt was determined by the actual situation of the Loess Plateau [45].
GDPWe collected the statistics of the GDP constant price from China’s city Statistical Yearbook and provincial Statistical Yearbook from 1980 to 2018, including the statistical yearbooks of Gansu, Ningxia, Inner Mongolia, Shaanxi, Shanxi, Henan, and Qinghai [52].
Night-time light dataThe 1992–2018 global night-time lighting dataset (https://doi.org/10.6084/m9.figshare.9828827.v2, accessed on 10 December 2021) [53] was used. It is a combination of the Defense Meteorological Satellite Program (DMSP)—Operational Linescan System (OLS) and the Visible Infrared Imaging Radiometer Suite (VIIRS) nightlight datasets by harmonizing the inter-calibrated night-time lighting observations from the DMSP data and the simulated DMSP-like night-time lighting observations from the VIIRS data.
Table 2. Soil retention amount of the Loess Plateau and six integrated management zones for 1980–2018 (unit: billion tons).
Integrated Management Zone198020002005201020152018
Valley plain0.4237 0.4258 0.4276 0.4272 0.4272 0.4278
Loess hilly gully 0.3147 0.3164 0.3181 0.3177 0.3178 0.3183
Sand and desert0.0057 0.0057 0.0058 0.0058 0.0058 0.0059
Earth-rock mountain 0.5452 0.5480 0.5506 0.5502 0.5504 0.5516
Agricultural irrigation0.0446 0.0449 0.0452 0.0451 0.0452 0.0456
Loess gully0.8329 0.8384 0.8437 0.8423 0.8429 0.8453
Sum2.1667 2.1792 2.1909 2.1883 2.1894 2.1944
Table 3. Relative error of gross domestic product regression results of the Loess Plateau for 1980–2018.
Item198020002005201020152018
GDP statistics (unit: billion USD)88.10 159.87 361.74 851.73 1348.97 1576.05
GDP analog value (unit: billion USD)88.32 161.19 323.25 758.40 1366.61 1549.70
Relative error (ranged from 0 to 1)0.0025 0.0082 0.1064 0.1096 0.0131 0.0167
Table 4. Gross domestic product of the Loess Plateau and its integrated management zones for 1980–2018 (unit: billion USD).
Integrated Management Zone198020002005201020152018
Valley plain10.54 19.21 43.33 93.84 117.46 139.55
Loess hilly gully 6.42 12.89 37.77 91.95 158.90 207.83
Sand and desert0.50 1.66 7.18 31.92 64.38 65.40
Earth-rock mountain 7.15 13.54 33.53 78.23 110.13 130.70
Agricultural irrigation3.66 8.81 23.16 64.97 95.84 101.31
Loess gully3.97 9.61 26.81 75.41 149.72 219.47
Sum32.24 65.72 171.78 436.32 696.44 864.27
Disclaimer/Publisher’s Note: The statements, opinions and data contained in all publications are solely those of the individual author(s) and contributor(s) and not of MDPI and/or the editor(s). MDPI and/or the editor(s) disclaim responsibility for any injury to people or property resulting from any ideas, methods, instructions or products referred to in the content.