Technical Note

Socioeconomic and Climate Effects on Changes in Wetlands in China during a Three-Decade Period of Rapid Growth

1
Department of Landscape and Urban Planning, Faculty of Environmental Sciences, Czech University of Life Sciences Prague, Kamýcká 129, 16500 Praha-Suchdol, Czech Republic
2
Department of Applied Ecology, Faculty of Environmental Sciences, Czech University of Life Sciences Prague, Kamýcká 129, 16500 Praha-Suchdol, Czech Republic
*
Author to whom correspondence should be addressed.
Remote Sens. 2023, 15(6), 1683; https://doi.org/10.3390/rs15061683
Submission received: 31 January 2023 / Revised: 15 March 2023 / Accepted: 16 March 2023 / Published: 21 March 2023

Abstract

:
China has experienced dramatic economic growth and social development, especially in the period between 1978 and 2008. The biodiversity and the socioeconomic sustainability in China were under threat, and the loss of wetlands was a significant aspect of ecological deterioration in the country at that time. However, the driving factors for the loss of wetlands are not well understood, probably due to a lack of accurate country-scale data. This study analyzes the changes in China’s wetland area between 1978 and 2008 (1978, 1990, 2000, and 2008) and the interchange between different wetland types from 1990 to 2000. We select 29 socioeconomic parameters (per capita GDP, primary industry added value, secondary industry ratio, total population, arable land, pesticide use, aquatic products, railway mileage, domestic wastewater, urban sewage treatment capacity, etc.) and three meteorological parameters (annual temperature, annual precipitation, and annual sunshine) to analyze the driving forces of changes in wetlands. The factor analysis based on these parameters shows that two factors can explain 65.8% of the total variation from the data, while eight parameters can explain 59.7%. Furthermore, multiple linear regression analysis reveals that five factors are of great significance in explaining wetland change in China, which are annual temperature (p < 0.001), inland waterway mileage (p < 0.001), urban land acquisition (p = 0.01), secondary industry ratio (p = 0.014), and railway mileage (p = 0.02). In conclusion, climate change (especially temperature) and inland waterway mileage are the primary factors for changes in the wetlands in China, and other socioeconomic indicators, especially from industrial and construction factors, also play an important role in changes in wetlands during China’s rapid economic development. In order to enhance wetland conservation efforts in China, we recommend prioritizing efforts to mitigate climate change on wetlands, promoting sustainable development policies, restoring and creating wetlands in urban areas, and utilizing advanced technologies to obtain accurate data.

1. Introduction

Wetlands are one of the essential types of ecosystems in the world. They are of great value to human society thanks to their special ecosystem functions and services, such as protecting biodiversity, adjusting hydrology and climate, providing essential habitats and products, and tourism resources [1]. Wetlands account for 6% of the land area on the Earth and retain about 770 billion tons of carbon, representing about 35% of the carbon storage in the terrestrial ecosystem. Most of this carbon, around 500 billion tons, is stored in peatlands. As an example, 1.9 billion tons of peat are stored in the 8 million ha of the Ruoergai wetlands. This implies that the destruction of 1 ha of wetlands leads to carbon dioxide emissions of 15 thousand tons [2]. Therefore, understanding the changes and degradation of wetlands is crucial for land conservation and carbon mitigation efforts.
Wetlands across the globe are facing severe degradation due to climate change, accelerated urbanization, and rapid economic development. It has been estimated that wetland losses have reached 87% since 1700, 70% since 1900, and 30% since 1970 [3]. Moreover, the rate of wetland loss was about four times more rapid in the 20th century than in earlier centuries. Unfortunately, wetlands are shrinking in the 21st century, especially in Asia’s mangroves [3].
Both nature and human factors drive change in wetlands, and their influences vary depending on the type of wetland [4]. It has been reported that changes in river wetland areas correlated positively with changes in temperature (both the mean annual temperature and the extreme minimum temperature) and in forest areas, and the changes in city construction areas and mean annual temperature correlated positively with changes in reservoir wetland area [5]. The causes and the processes of wetland degradation vary by region and wetland type. For example, there was a significant reduction in marsh and reservoir wetlands in Central and Eastern China, while an increase in the river and lake wetlands was found mainly in Western China [5].
However, direct human activities can also be the primary cause of wetland changes. For example, modifications carried out by humans have had a more significant impact on historical and contemporary coastal wetland losses than rising sea levels [6]. In northern China, large areas of woodlands, grasslands, and wetlands have been converted to croplands, while in southern China, large areas of croplands have been transformed into urban areas [7]. A study on wetland changes in Shenzhen, the fastest developing city in China over the past four decades, found that urban expansion was the main cause of wetland loss, and its impact varied depending on wetland type. The study also revealed that regional socioeconomic and natural environmental differences were the main factors contributing to the differences in wetland dynamics among different administrative units [8].
Remote sensing is a valuable tool for acquiring spatial and temporal information about wetlands [9], and it has been used to quantify changes in wetland areas. However, wetland change is a complex process influenced by many factors (climate, socioeconomic factors, environmental pollution, etc.). The integration of social and natural sciences in wetland research can contribute to addressing the issue of the lack of information and promote consistency across different government policies [10]. Until now, research investigating the driving factors for wetland change has mostly dealt with individual factors, e.g., only climate factors or only socioeconomic factors. At the same time, the lack of consistency in methodologies on wetland studies makes it difficult to draw comparisons between the results across different studies and regions. Due to limited data availability, it is difficult to assess the drivers and factors for wetlands accurately. Long-term data are often expensive and time-consuming to collect, and there is a lack of integration of social and ecological factors. Our hypothesis is, therefore, that quantifying and analyzing the relationship between changes in wetland and climate, socioeconomic, and environmental pollution factors all at the same time will help to achieve a comprehensive understanding of the driving factors for wetland change.
Therefore, the objectives of this study were (1) to compare the changes in China’s wetland area during the three decades of the rapid growth period (1978–2008); (2) to analyze the driving factors of climate, socioeconomic, and environmental pollution parameters on changes in wetlands (area loss and changes in wetland types) in China during the high-speed economic development. Based on these objectives, the study aims to reveal the underlying forces behind changes in China’s wetlands during rapid economic growth. The findings of the study will provide a theoretical basis to help developing countries protect wetlands more effectively.

2. Materials and Methods

2.1. Study Site

China lies between latitudes 18° and 54°N and longitudes 73° and 135°E. The climate is mainly dominated by dry seasons and wet monsoons, which lead to pronounced temperature differences between winter and summer. There are ten climate zones in China; see Supplementary Figure S1.

2.2. Data Collection

Wetland area data were collected and recalculated from previous research [11,12]. In general, the wetland area was detected based on Landsat (https://landsat.gsfc.nasa.gov/, accessed on 17 March 2023) and CBERS-02B (from the China Resources Satellite Application Center, https://www.cresda.com/zgzywxyyzxeng/index.html, accessed on 17 March 2023) remote sensing data between 1978 and 2008 (1978, 1990, 2000 and 2008). Thematic Mapper (TM) bands 5, 4, and 3 and CBERS-02B bands 4, 3, and 2 were used for wetland mapping and manual interpretation, respectively. Detailed descriptions of the data processing and comparison methods can be found in previous research [12].
China’s economy has grown dramatically in the past four decades, especially between 1978 and 2008 (see Supplementary Figure S2). Therefore, this study focuses mainly on the influence of socioeconomic and climate factors on wetland changes during this period. In total, 29 different socioeconomic parameters were collected from 27 provinces and four municipalities for the four study years (1978, 1990, 2000, and 2008) from national and provincial statistical yearbooks: per capita GDP, primary industry added value, secondary industry added value, industry added value, construction industry added value, tertiary industry added value, primary industry ratio, secondary industry ratio, tertiary industry ratio, total population, urban population, rural population, arable land, pesticide use, aquatic products, railway mileage, inland waterway mileage, road mileage, industrial wastewater, domestic wastewater, domestic wastewater COD, urban built-up area, urban land acquisition, road area, urban drainage, urban sewage treatment capacity, urban green space, urban annual water supply, and municipal solid wastes. Three meteorological parameters (annual temperature, annual precipitation, and annual sunshine) were collected from the national and provincial statistical yearbooks for the study years (1990, 2000, and 2008). Some selected data from 1981 were used due to the unavailability of data for 1978. All the data types, sources, scale, unit, and pre-processing for each factor are given in Supplementary Table S1.

2.3. Data Analysis

The changes in wetland areas and average GDP per capita in China during the three decades were calculated by the difference between 1978 and 2008. All the data were standardized to the same units (dimensionless) before further statistical analysis. The Pearson correlation was used to explore the relationship between climate and socioeconomic factors in wetland areas and changes in types of wetlands, and only one factor was selected from the other related factors if the correlation values were above 0.8. Then, factor analysis was used to reduce the number of independent variables in the analysis while retaining most of the information. Afterward, multiple linear regression was used further to find the significant factors for changes in wetlands, and it was carried out in SigmaPlot 14.0 with the reduced socio-economic factors, and a VIF value of less than four was applied to avoid linear conjugation [13,14]. ANOVA was performed to compare the changes in wetland areas among the years 1978–1990, 1990–2000, and 2000–2008 of all 31 regions. The factor analysis and the correlation analysis were performed by Origin 2019b and R software. The climate zone distribution and the rates of changes in wetlands and GDP were carried out by ArcGIS. Origin 2019b and SigmaPlot 14.0 were used to draw other plots.

3. Results

3.1. Feature of Wetland Change

3.1.1. Changes in Overall Wetland Areas

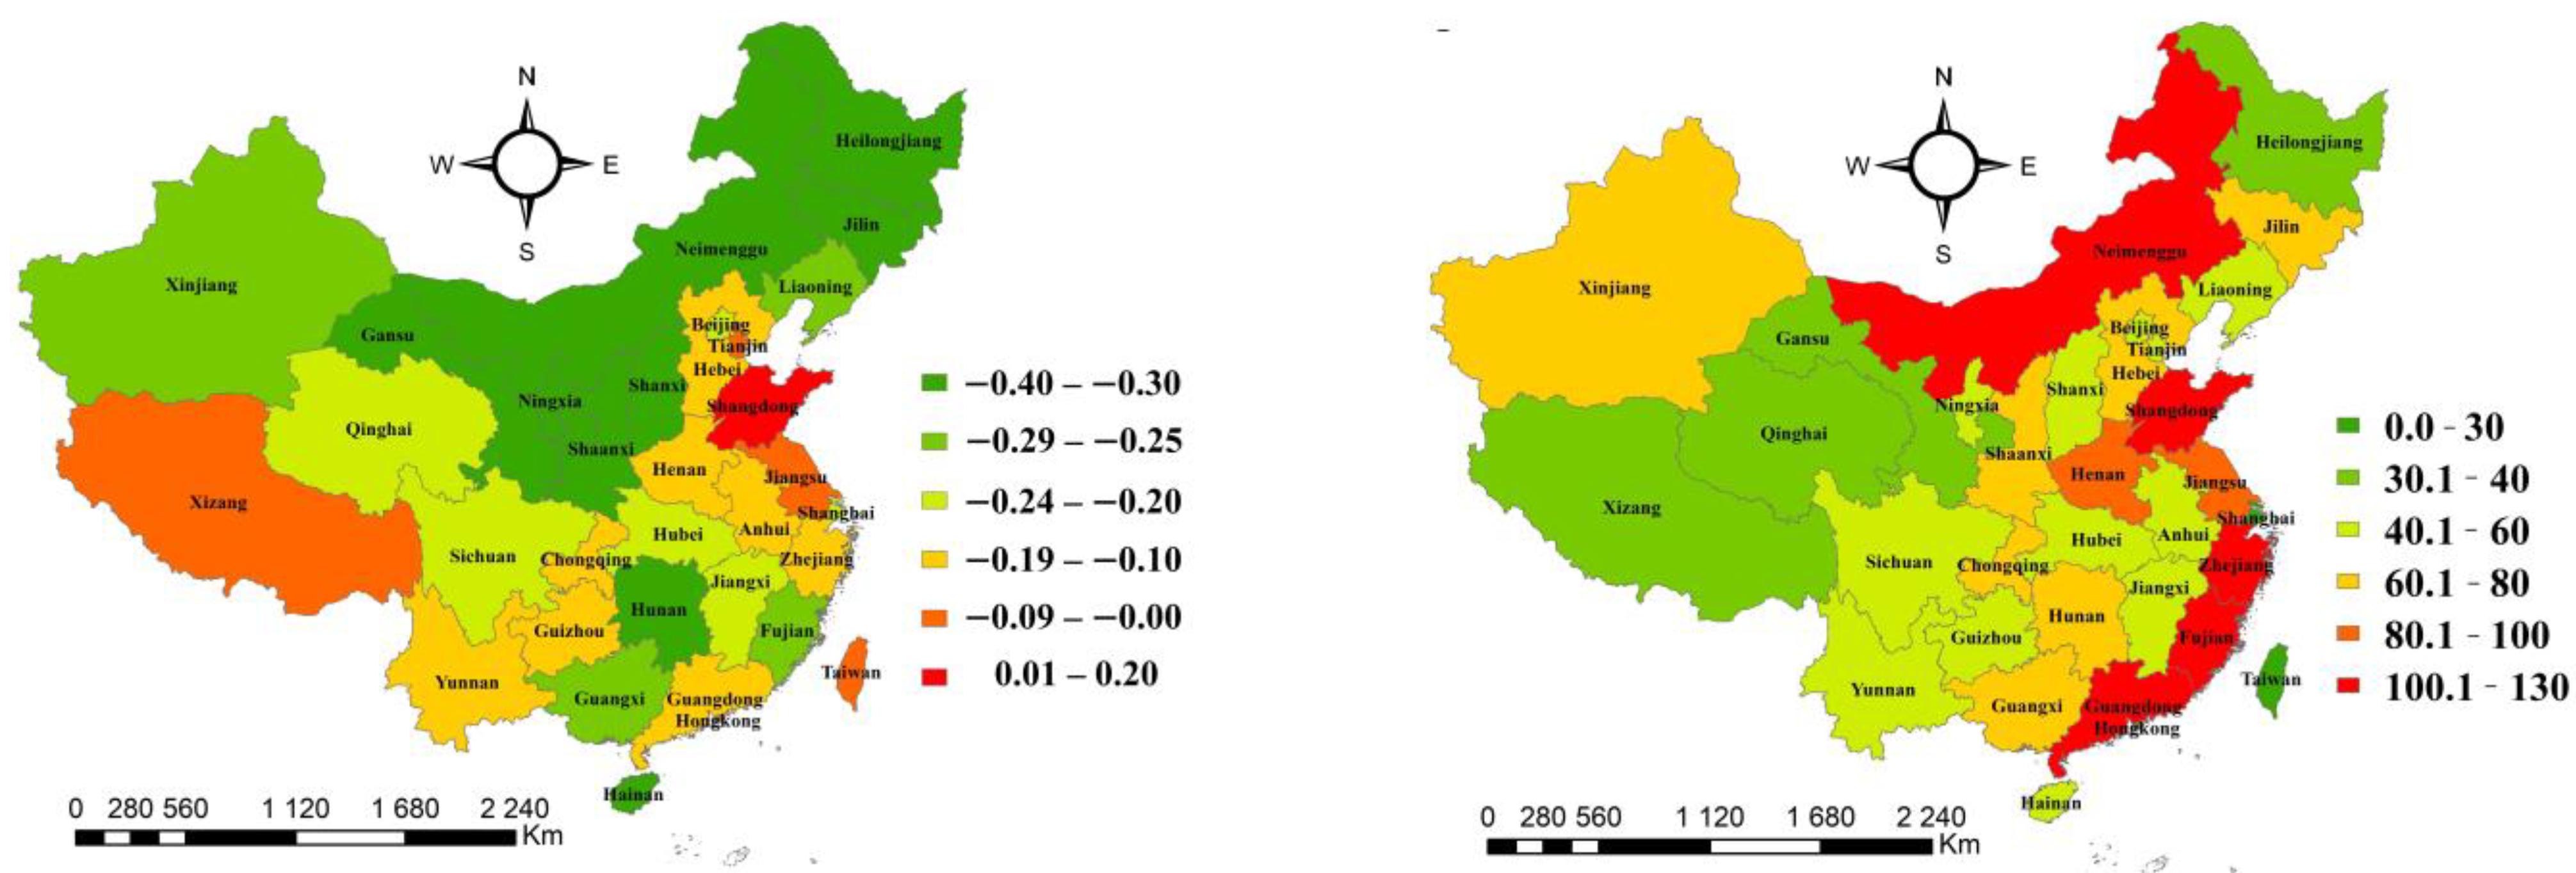
Overall, China’s total wetland area decreased between 1978 and 2008. The total wetland area fell from 416,442.48 km2 to 323,083.48 km2, i.e., an average area loss of 3112 km2 per year. The wetland area loss rate was dramatic between 1978 and 1990, when the average wetland loss was as much as −14.1%, but this tendency slowed down to −5.3% between 1990 and 2000, and then narrowed to −3.6% between 2000 and 2008 (Figure 1). The differences in the extreme (max and min) wetland area change rates for all 31 regions were 47.5% (−27.8–19.7%), 34.4% (−28.2–6.2%), and 32.5 (22.1–10.4%), for 1978–1990, 1990–2000, and 2000–2008, respectively. The ANOVA analysis confirms that the changes in wetland areas differed significantly between 1978–1990 and 1990–2000 (p < 0.001), and between 1978–1990 and 2000–2008 (p < 0.001), while the difference between 1990–2000 and 2000–2008 was non-significant (p = 0.516). Only three regions did not suffer a loss of total wetland areas between 1978 and 1990, and these numbers changed to 12 for 1990–2000 and 9 for 2000–2008 (Figure 2). This further confirms that the wetland deterioration situation has slowed down. Nevertheless, most regions (over 60%) still faced wetland loss. Specifically, the regions in the eastern part of China have had lower wetland loss rates than other regions, with Tibet being an exception (Figure 2). The wetland area change rates in Tibet were −13.6%, 4.1%, and 10.4% during the 1978–1990, 1990–2000, and 2000–2008 periods, respectively.

3.1.2. Change in Types of Wetlands

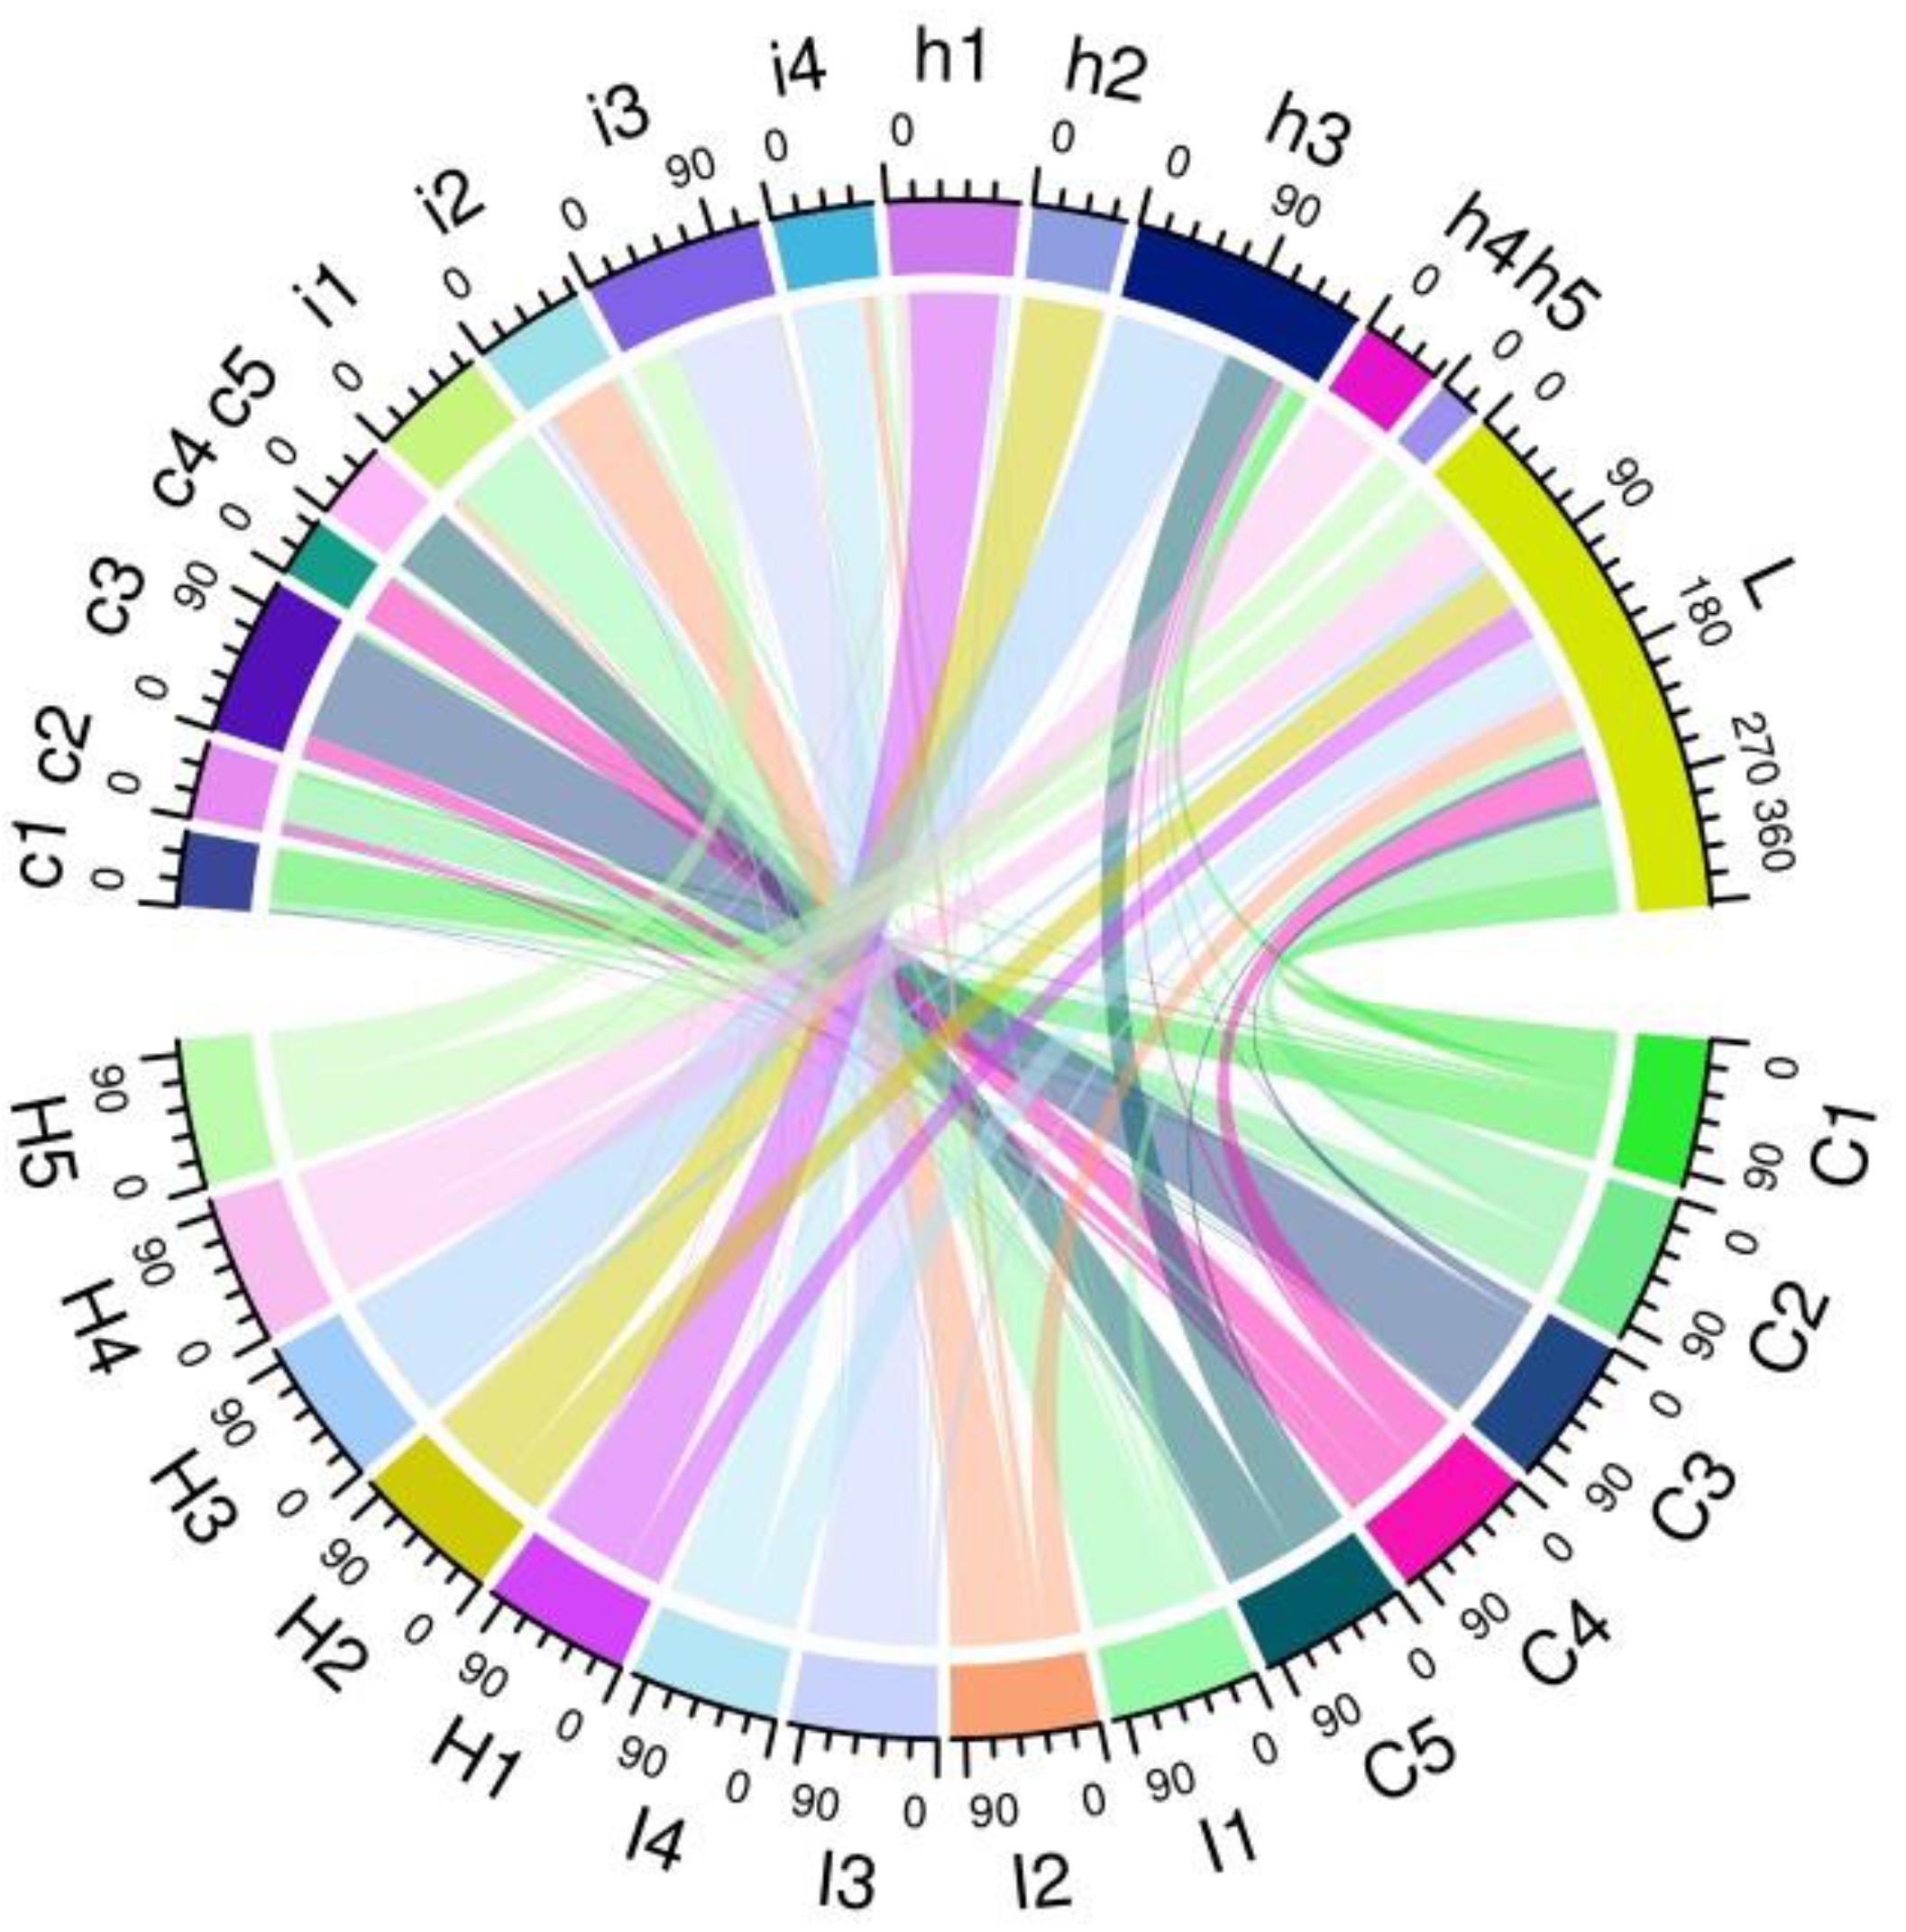
Due to its varying climatic regimes and topography, China has all types of wetlands defined by the Ramsar Convention. Inland wetlands are the dominant wetland types in China (85.7–92.6%), and coastal wetlands form a more or less stable percentage (3.8–4.7%). In contrast, human-made wetlands increased significantly from 3.2% (9792 km2) in 1978 to 10.5% (21,743 km2) in 2008 (Figure 3). In fact, the total areas of human-made wetlands are the only types that rose in the course of the period from 1978 to 2008, with a 122% increase in area. However, the area of artificial channel wetlands decreased (Figure 3). On the other hand, the total areas of inland and coastal wetlands experienced a loss of −37.8% (286,399 to 178,262 km2) and −39.8% (13,104 to 7890 km2) between 1978 and 2008 (Figure 3), respectively. The total change from wetland area to non-wetland was −35% from 1990 to 2000, with an area loss for all the wetland types. The remaining 65% of the changes were between different wetland types (Figure 4). The major changes between wetland types were mainly between similar categories. Apart from internal changes, the five coastal wetland types easily changed to seawater fish farms/salt flats; in contrast, only a small number of seawater fish farms/salt flats changed to coastal wetlands. The inland wetlands mainly changed to reservoirs/ponds, while very few human-made wetlands changed to inland wetlands (Figure 4).

3.2. Analysis of Driving Factors for Wetland Change

3.2.1. Driving Factors for Changes in a Whole Wetland Area

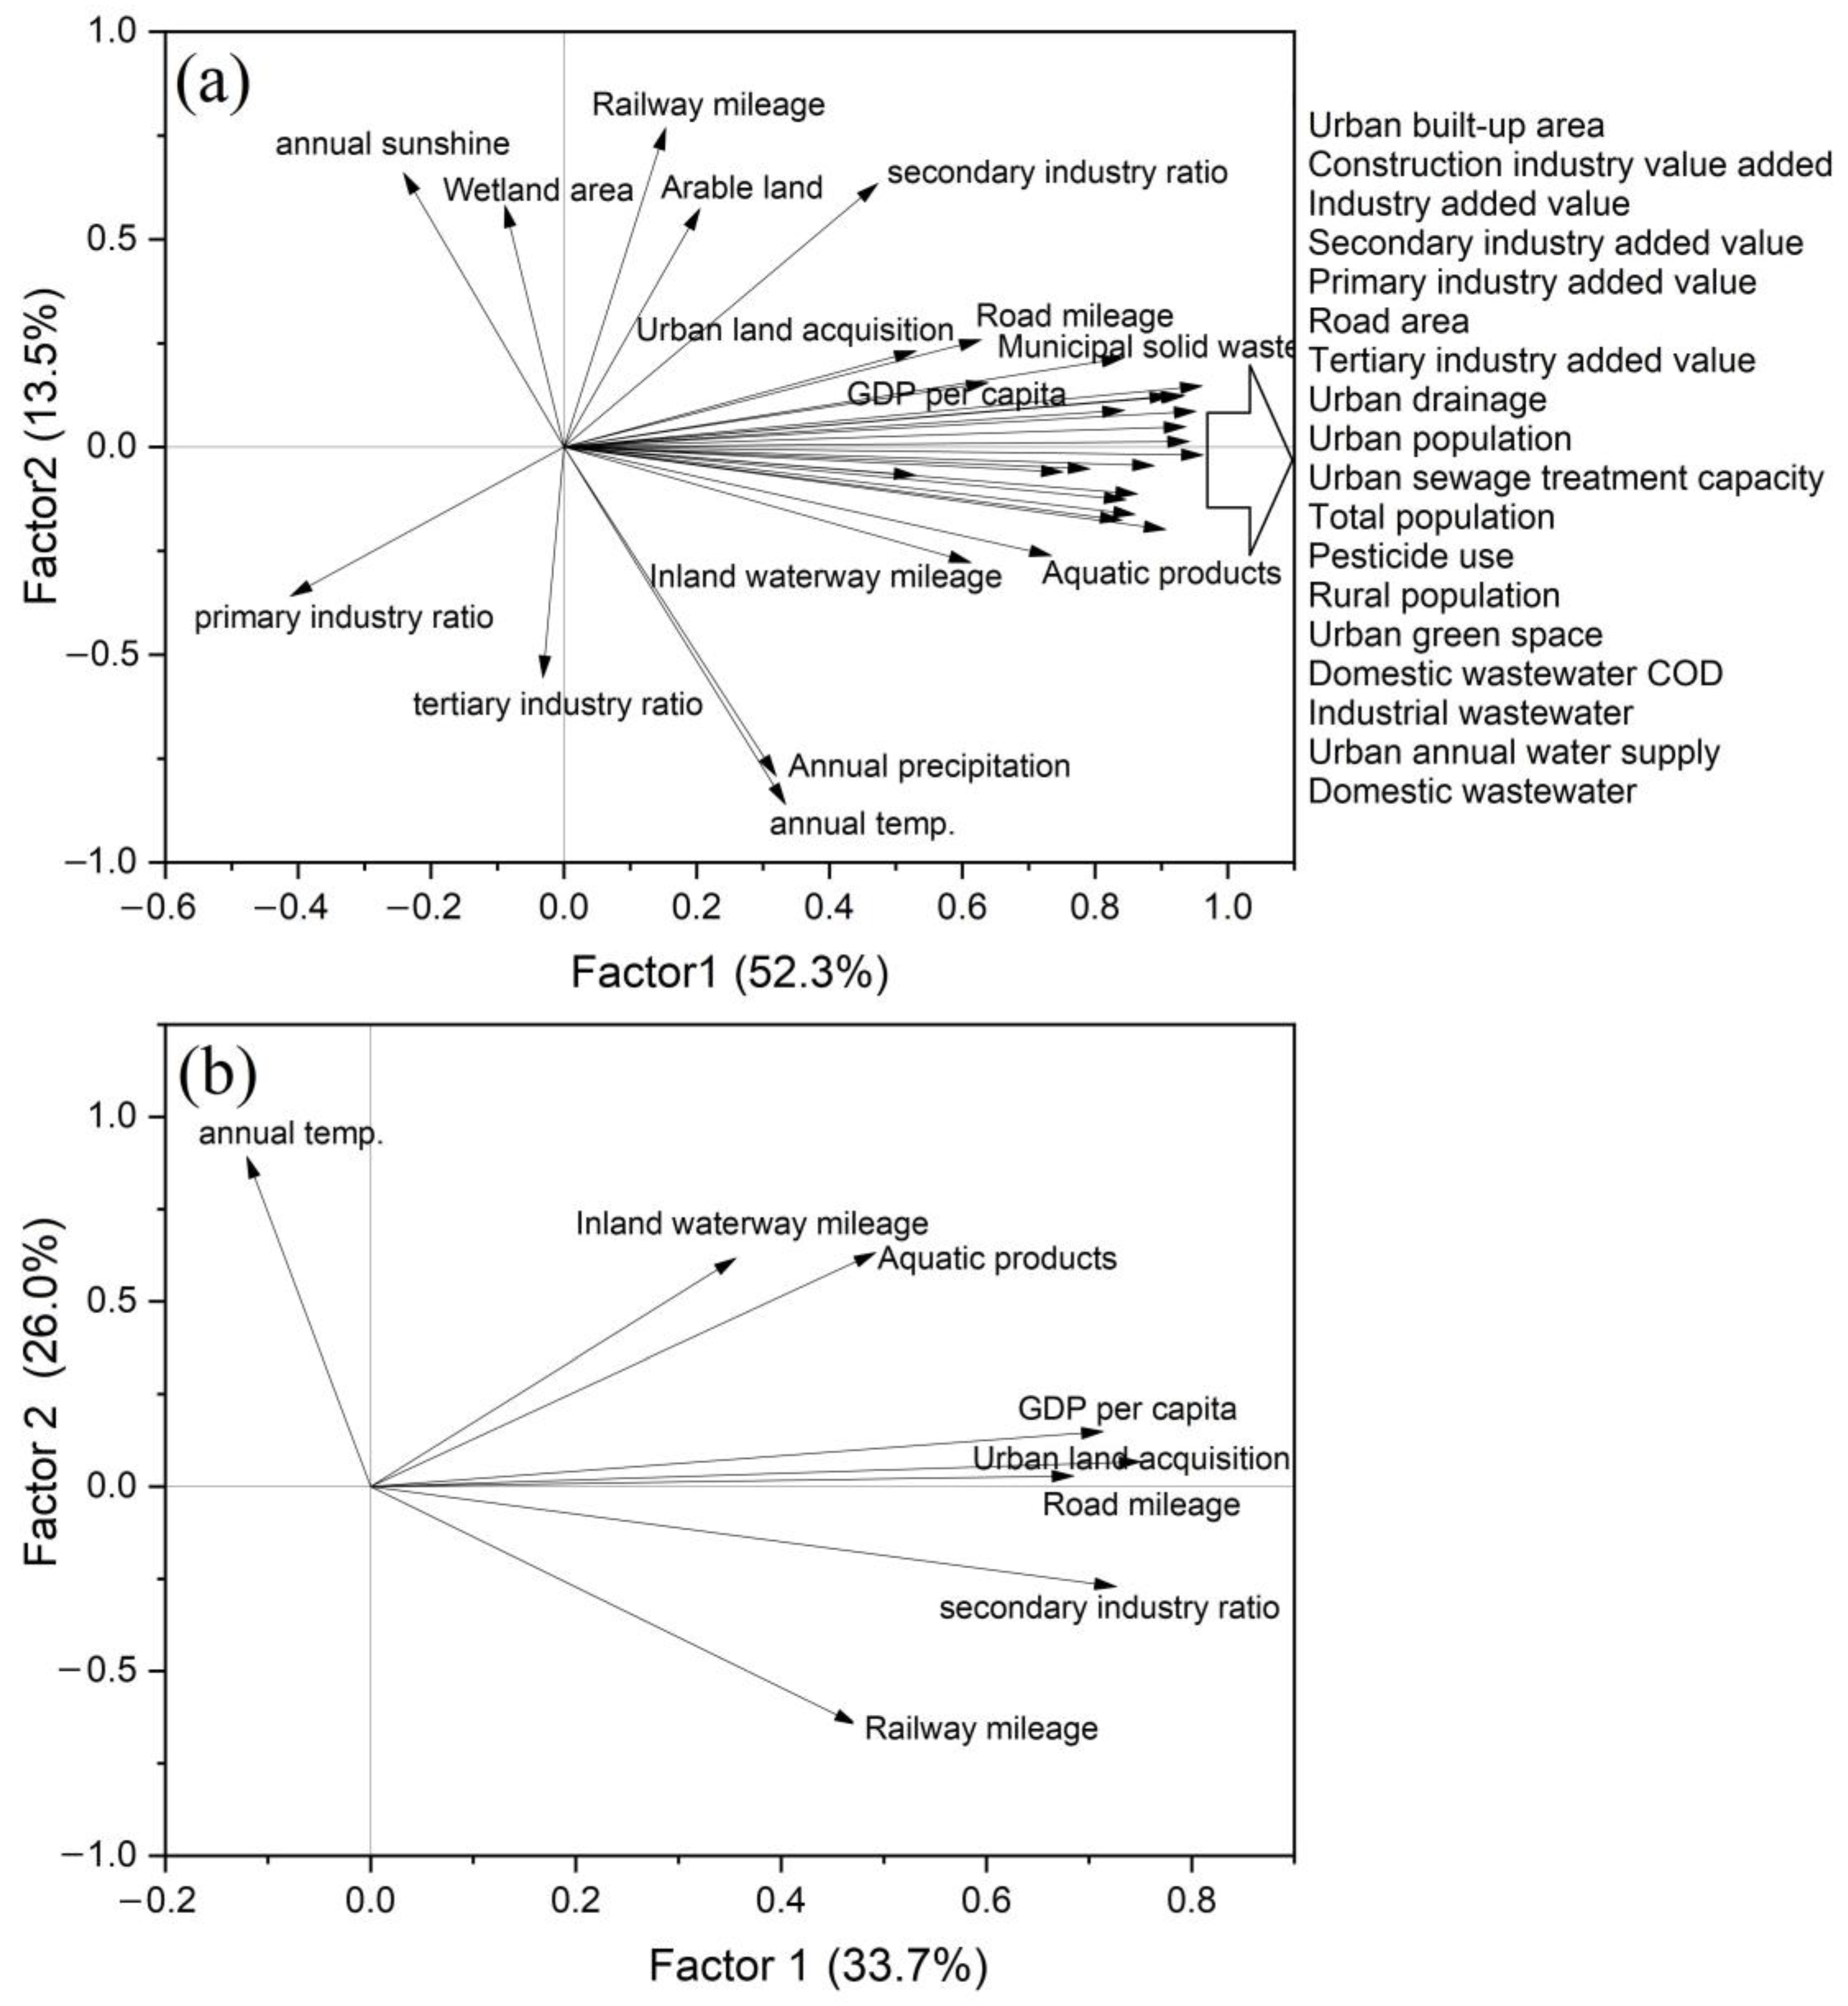
The factor analysis based on 29 socioeconomic and three climate parameters shows that two factors can explain 65.8% of the total variation from the data (Figure 5a). Factor 1, which mainly involves urban and industrial development parameters, can explain 52.3% of the total variation. The correlation results show that many socioeconomic parameters have a high correlation with each other (Supplementary Table S2); therefore, VIF values of less than four were applied to avoid linear conjugation to reduce the socioeconomic parameters. Eight parameters were therefore used for further factor analysis. Two new factors can explain 59.7% of the total variation from the data (Figure 5b). Factor 1 (33.7%) is mainly influenced by GDP per capita, the secondary industry ratio, road mileage, and urban land acquisition, while factor 2 (26.0%) is influenced by the annual temperature, aquatic products, railway mileage, and inland waterway mileage. These eight main parameters have rotated loadings (absolute values) over 0.6, and the annual temperature has the highest rotated loading of 0.89 (Table 1). This shows that temperature is the most decisive factor in wetland changes, and socioeconomic parameters play a second important role in China during the study period. Railway mileage has a negative rotated loading (−0.64) on factor 2, which means that it negatively influences changes in wetlands.
All the climate and socioeconomic parameters for the two factors are shown in Supplementary Table S4. Seven socioeconomic factors are shown to be the main driving factors for changes in wetland areas among the 29 parameters: per capita GDP, the secondary industry ratio, aquatic products, railway mileage, inland waterway mileage, road mileage, and urban land acquisition (Table 1). The inland waterway mileage shows an extremely significant (p < 0.001) effect on changes in wetland areas (Table 2). This indicates that direct socioeconomic activities on the water influence wetland changes most because water is the most critical component for wetland systems. Furthermore, urban land acquisition, the secondary industry ratio, and railway mileage correlate significantly with changes in wetland areas (Table 2). Therefore, we made a multiple linear regression of wetland area with those eight main climate and socioeconomic factors as follows (Equation (1)).
Wetland area = 1.725 + (0.226 × GDP per capita) − (4.194 × secondary industry ratio) − (0.642 × annual temp.) + (0.113 × Aquatic products) + (0.279 × Railway mileage) + (0.324 × Inland waterway mileage) − (0.00655 × Road mileage) − (0.257 × Urban land acquisition), R2 = 0.608

3.2.2. Driving Factors for the Changes in Wetland Types

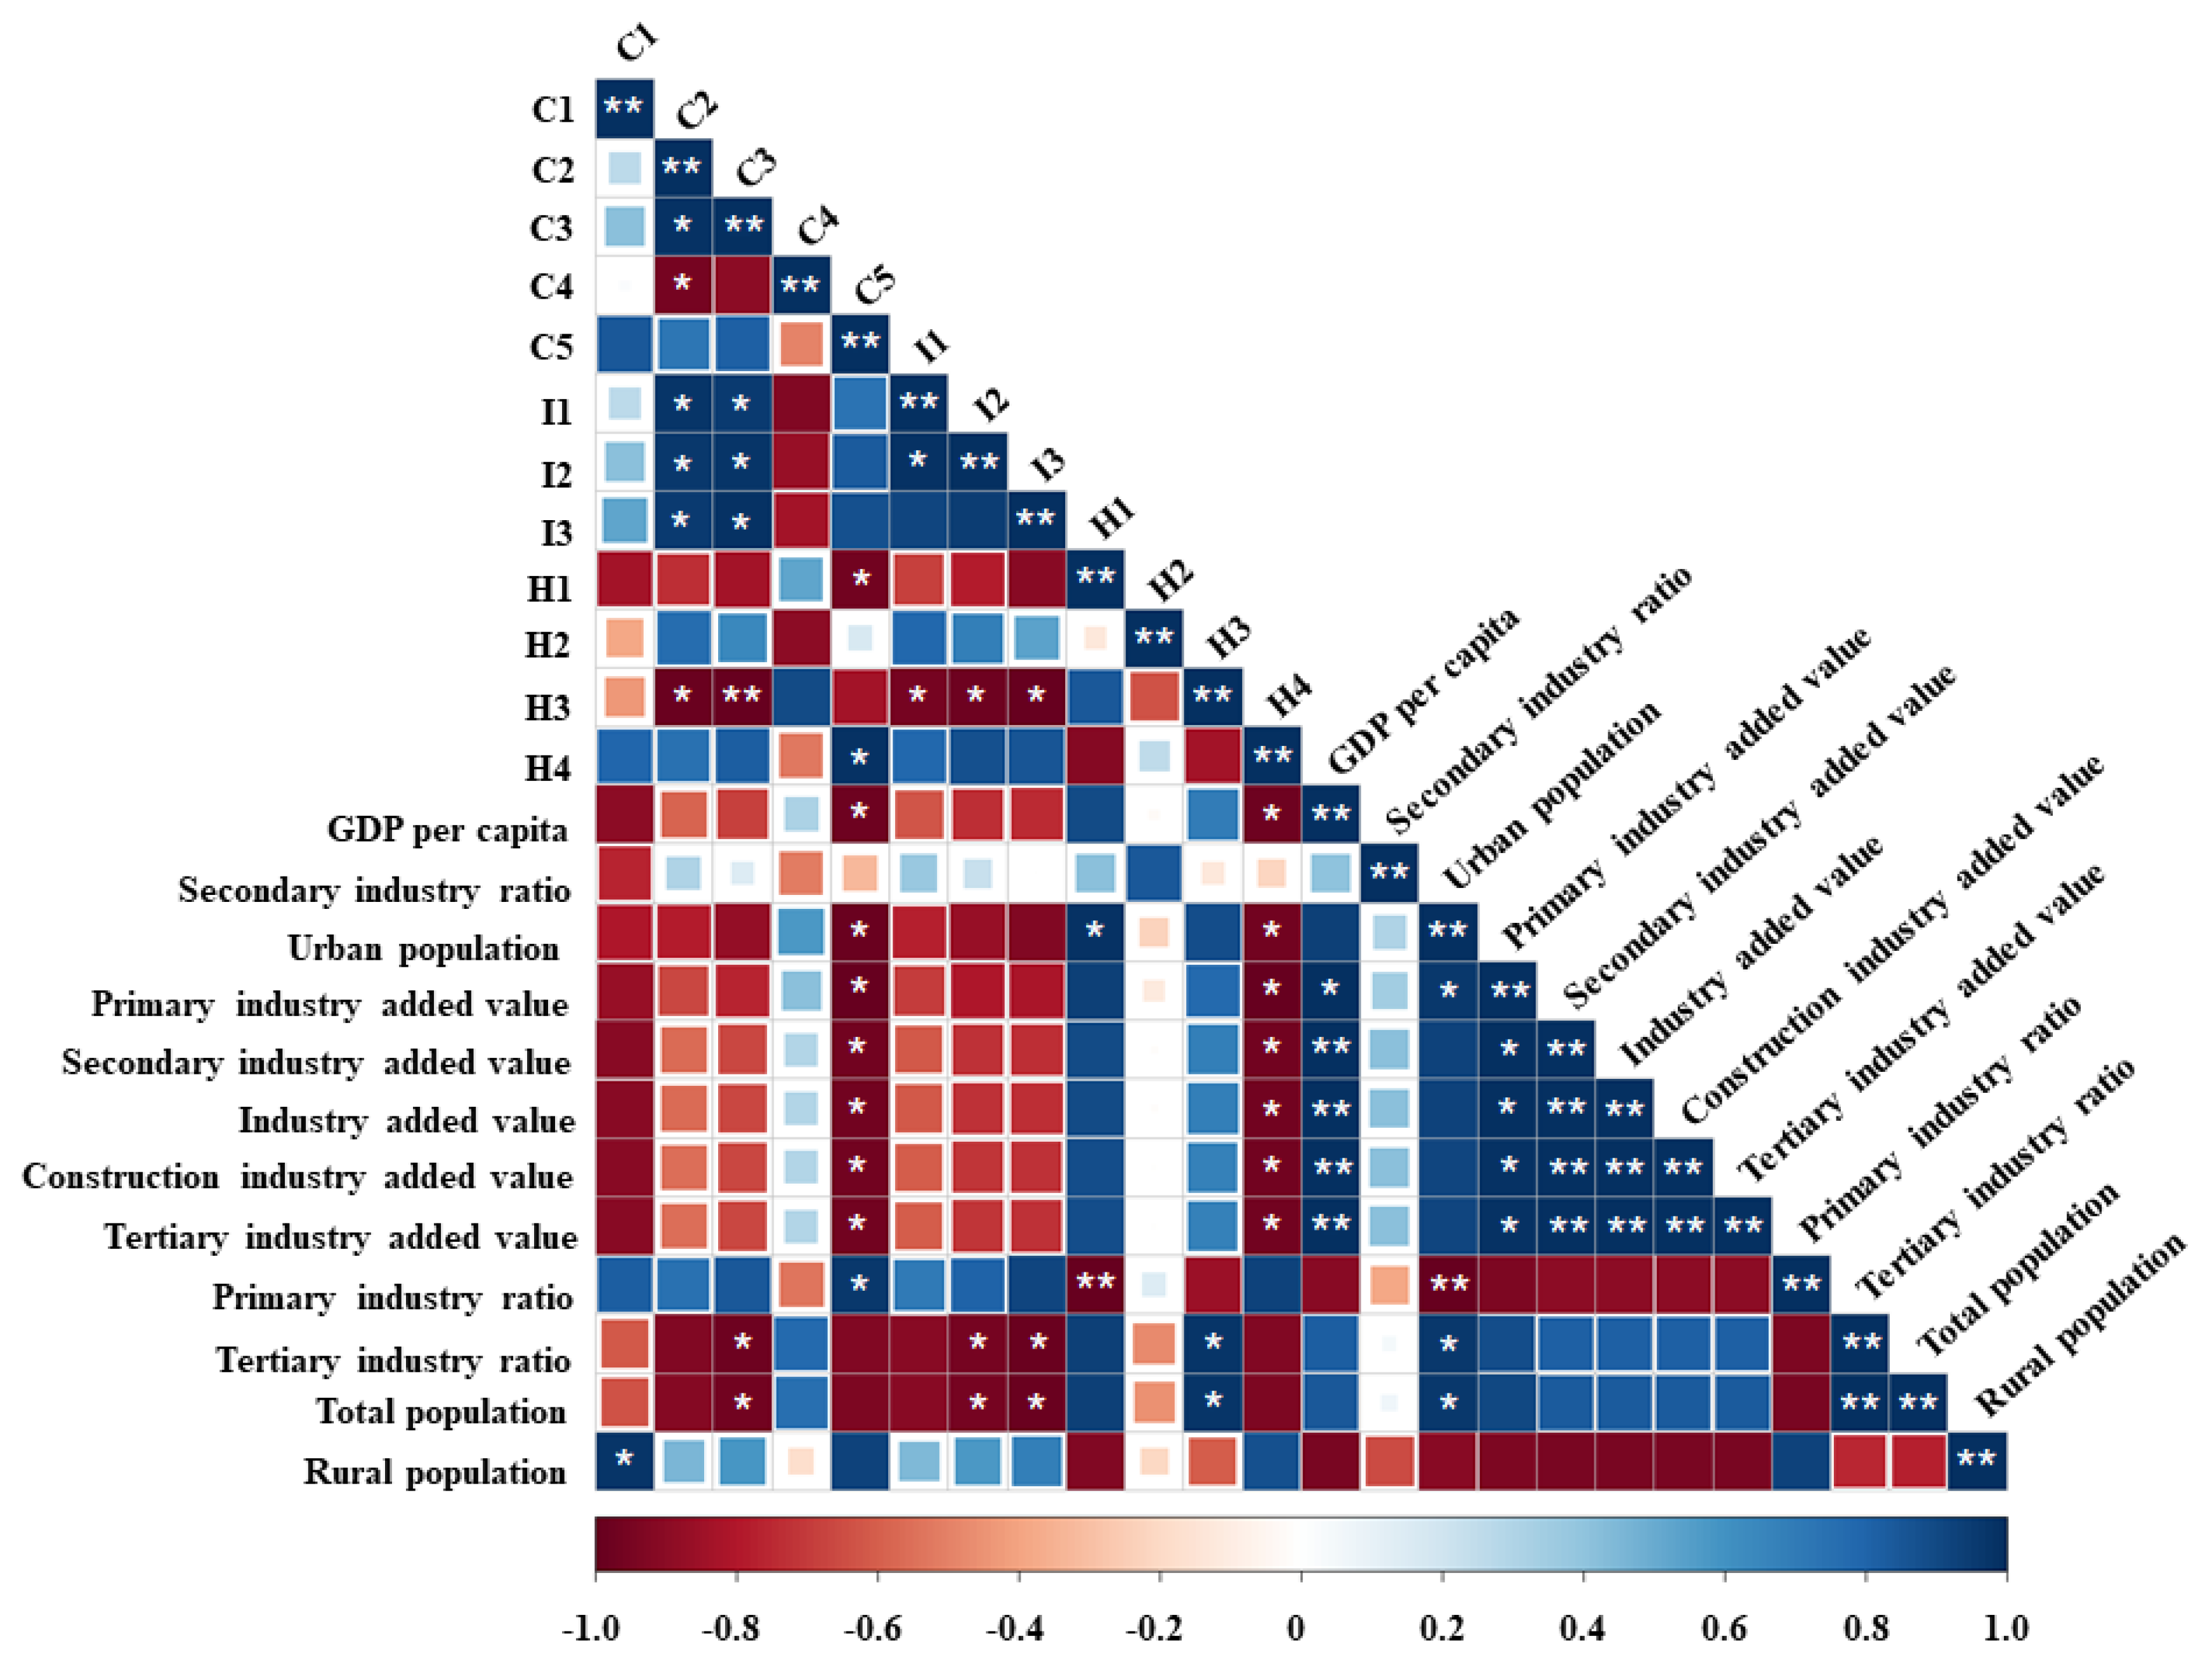
The effects of climate change on changes in wetlands vary in type. Our study found that estuarine deltas and river wetlands show a significant negative correlation with annual temperature (see Supplementary Table S3). There is no significant difference between climate factors and other wetland types. The correlation between changes in wetland type and socioeconomic factors differs from our analysis (Figure 6, Supplementary Table S3). Shallow beaches/tidal zones correlate significantly with the rural population. Estuarine water has a significantly strong negative correlation with the tertiary industry ratio and total population. Lagoons have a significant negative correlation with per capita GDP, urban population, and all the industry-added value, but they have a positive correlation with the primary industry ratio. Floodplain wetlands and lakes show a significantly strong negative correlation with the tertiary industry ratio and total population. Reservoirs/ponds show a highly significant strong negative correlation with the primary industry ratio, while it has a significant strong positive correlation with the urban population. This is mainly because those reservoirs were protected, or were even created as a drinking water source for cities due to the increasing urban population. Seawater fish farms/salt flats have a significant strong positive correlation between the tertiary industry ratio and total population, driven by the consumption of seafood by humans due to population growth. Other artificial wetlands correlate significantly negatively with per capita GDP, urban population, and industry-added value (primary, secondary, construction, and tertiary). This indicates that dramatic industrial development can lead to a significant reduction in artificial wetlands. However, constructed wetlands (one type of artificial wetlands) for wastewater treatment in China increased dramatically with the urban population’s growth and per capita GDP since 2000.

4. Discussion

4.1. Climate Factors Affect Changes in Wetlands

4.1.1. Changes in Wetland Area Influenced by Climate Factors

Climate change is one of the main drivers of wetland loss based on a meta-analysis of 22 countries, and it is especially significant in developed countries [15]. Temperature is crucial for evaluating wetlands’ status and the wetlands’ changes because it can significantly influence their hydrological and evapotranspiration regimes. For example, in the Kilombero catchment, Tanzania, it was reported that an increase in temperature caused deforestation and farmland expansion into the floodplain [16]. Moderate increases in temperature in natural wetlands indicate that the impacts of human activities extend into non-cultivated areas [16]. The loss of wetlands in China’s Qinghai-Tibet plateau was reported to have correlated closely with an increase in air temperature, which was over two-fold faster in 1982–2004 than in 1965–1982 [17]. In the Maqu wetlands, it was found that the driving forces behind the changes (1990–2020) were predominantly temperature and precipitation, especially the growing season temperature [18]. In addition, a study on the winter wetlands of Lake Poyang (the largest freshwater lake in China) found that 70% of the long-term changes (1973–2013) in the wetland vegetation area can be explained by the local temperature [19]. The changes in the bay-type coastal wetland of Jiaozhou Bay in the Shandong Peninsula are correlated with the continuous increase in temperature as the leading natural factor, which shows an overall decreasing trend from 1983 to 2019 [20]. On the other hand, the temperature rise increased plant biomass, especially in shallow underground biomass. A temperature rise can also promote soil respiration in alpine wetlands, thus promoting soil carbon release [21]. However, the increasing greenhouse gas emissions from wetlands result from environmental and anthropogenic causes rather than global warming alone [22].
Precipitation is another critical driving factor in wetland changes, mainly because it can alter the wetland soil conditions, thus affecting soil respiration and plant photosynthesis. The change in precipitation and evaporation was the main driving factor for wetland changes in the Three-River Headwaters region in China from 1990 to 2012; the increase in the humidity index in this region contributed to the continuous rise in wetlands [23]. The wetlands area loss of about 16.4% from 2000 to 2018 in the southern Mongolian Plateau is mainly driven by the Mongolian monsoon climate and reduced precipitation [24]. However, wetlands can also influence climate. For example, lakes and wetlands cause a circulation response inverse to the Saharan heat low, which can strongly affect the northward extension of the African summer monsoon depending on their latitudinal position [25].
Sunshine duration is a direct driving factor for wetland plant growth and can therefore influence wetland change. Sunshine duration has been shown to have a significant positive correlation with wetland vegetation coverage from the Hongze Lake national wetland (about 113 km2), based on ten years of assessment (2000–2009) [26]. Zhang et al. also reported that the influence of sunshine duration on wetland plants was more substantial than the influence of the temperature and precipitation of the Dongting Lake wetland from 2000 to 2019 [27]. The vegetation emergence time was more sensitive to temperature and sunshine duration than precipitation for most lakes on the Yangtze Plain between 2001 and 2014 [28].

4.1.2. Changes in Wetland Types Influenced by Climate Factors

In general, the influence of climate change on wetlands varies with wetland type and geographical location. Coastal wetlands are more sensitive to a rise in sea level, while boreal wetlands will be under the stress of increased temperature, which will probably cause more evapotranspiration and lower organic matter accumulation in wetland soil [29]. It has been reported that temperature and precipitation correlated significantly and positively with the changes in river wetlands and lake wetlands in the Yellow-River-Source National Park from 2000 to 2020, while they had no apparent influence on marsh wetlands [30]. Climate dominated the wetland changes in the Pumqu River Basin, the southwestern part of the Tibetan Plateau, China. For example, riverine and lacustrine wetlands were mainly affected by the warm-season average temperature, the palustrine wetland was driven primarily by the annual precipitation and by the warm-season average temperature, and the change in the floodplain wetlands was interrelated with the warm-season precipitation [31]. Yu and Hu compared the long-term (2000–2011) vegetation changes in four types of wetlands in China and the USA. They found that the influence of agriculture was lower than the climate effects for the Everglades wetland (marsh wetland) and for the core partitions of the Yancheng (coastal wetland), Chongming (river wetland), and Hongze Lake wetlands (lake wetland). However, the entire partitions of the Yancheng, Chongming, and Hongze Lake wetlands showed noticeable influences from agricultural activities apart from the impact of climate [32]. For different types of marshes in China, it has been reported that the marsh vegetation growth correlates positively with the precipitation and the minimum temperature in the growing season, and correlates especially significantly with the night temperature [33]. Spatially, in eastern Inner Mongolia, the growth of marsh meadows, herbaceous marshes, inland salt marshes, and seasonal saltwater marshes has a positive correlation with the precipitation in the growing season; the minimum temperature in the growing season has a positive effect on the vegetation growth of herbaceous marshes, marsh meadows, inland salt marshes, forest swamp, and bush swamp in cold regions (e.g., Northern Northeast China) and in the high-altitude areas (e.g., Tibet Plateau) [33]. In the Heilongjiang River Basin, climate change had a tremendous impact, with a contribution rate of 66% to low-intensity wetland loss, especially for the changes in shrub wetlands (contribution rate of 58%) and in forested wetlands (53%) [34].
Greenhouse gases emitted from wetlands into the atmosphere can contribute significantly to global warming and differ according to the wetland type. For example, Liu et al. reported that CH4 and N2O emissions were significantly affected by increased temperature, and that the N2O emission rate was considerably higher in palustrine wetlands than in lacustrine and riverine wetlands on the Qinghai-Tibetan Plateau. However, the CO2 and CH4 emissions did not differ significantly among the three wetland types [35].

4.2. Effect of Socioeconomic Factors on Changes in Wetlands

4.2.1. Changes in Wetland Area Influenced by Socioeconomic Factors

Our results are in accordance with a previous study, which found that agriculture and built-up expansions are the major drivers for wetland loss in developing and least-developed countries [15]. Human activities contributed more (64%) than climate factors to wetland changes in the Heilongjiang River Basin, especially for herbaceous wetlands with moderate and severe intensity in the middle and lower reaches [34]. Human activity factors (degree of interference, population density, and GDP) were more significant than natural factors for wetland changes in the Wujiang Basin of Guizhou province, with an explanatory power of 83% from human interference [36]. Hagger et al. assessed the global mangrove change across coastal geomorphic units over 20 years (1996–2016), considering socioeconomic and biophysical variables. They found that the drivers have changed within the study period and that drivers of loss can also become drivers of gain [37]. For example, economic growth shifted from harming mangroves in the first ten years to enabling mangrove expansion in the second 10 years [37]. Chen et al. reported that socioeconomic factors (total population, GDP, investment in fixed assets, and aquaculture area) were the main drivers forcing changes in the landscape pattern in coastal wetlands in the Liao River Estuary between 1986 and 2020 [38]. Zhao and Liu concluded that wetland landscapes correlated positively with human interference (e.g., the household contract responsibility system, rural productivity, and severe overgrazing) in western Jilin Province between 1986 and 2019 [39]. The population was the most important driving force for changing the Jiaozhou Bay coastal wetland (Shangdong, China), 77% of which was converted into non-wetland between 1983 and 2019 [20]. Population density and GDP were shown to be the main drivers in the Dongting Lake wetlands between 1995 and 2020, and their interaction mainly was linearly enhanced, with no weakening effect [40]. In the Chang-Zhu-Tan urban agglomeration between 2000 and 2015, the most important socioeconomic factors affecting change in wetlands were the urbanization rate index, per capita GDP, and population, as reflected in contribution rates (Wald statistic) of 9.82, 9.27, and 7.85, respectively [41]. At the same time, the wetland ecosystem service value is also a crucial indicator for wetland function assessment. It was reported that socioeconomic development has had the greatest impact on the value of wetland ecosystem services, based on a 35-year evaluation (1980–2015) of land use data for Northeast China, in which the average contribution weights varied from 45% to 54% [42].

4.2.2. Changes in Wetland Types Influenced by Socioeconomic Factors

The driving factors usually vary according to wetland types. Inland wetlands are likely influenced by farming irrigation, reclamation, and reduced drainage, while artificial wetlands are more associated with economic development and water infrastructure [43]. For example, artificial wetlands increased from south to north and east to west in China between 1978 and 2008, following the economic development movement during this period [43]. Coastal wetlands vary closely with population and with the fishery industry, e.g., the wetlands in Jiangsu and Zhejiang provinces are mainly affected by fishery production; the changes in the wetlands in Fujian and Guangdong provinces are due to tidal land reclamation, and the wetlands around the Bohai Sea have been significantly affected by the development of oilfields [43]. At the same time, coastal wetlands have been rapidly converted into numerous artificial facilities due to the more rapid population growth rate in coastal areas than in other regions.
Overall, the driving factors for changes in wetlands are complex. There are different types of changes for different types of wetlands in different periods. For example, the dynamic change in reservoir wetlands in Beijing shows three phases. In 1984–1998, climate factors (average annual precipitation and entry water index) were the major driving factors that promoted the growth of wetlands; between 1998 and 2004, human activities (population, urbanization rate) dominated the changes in wetlands and caused significant loss of wetlands; in 2004–2010, changes in wetlands were affected both by climate (precipitation) and by socioeconomic factors (urbanization rate), and caused a slight increase in wetland area [44]. It is therefore vital to understand the current driving factors for a wetland in order to protect it.

4.3. Implications and Suggestions for Wetland Conservation in China

We propose the following implications and suggestions for wetland conservation in China based on our findings.
(1)
Measures should be taken to mitigate the impacts of climate change on wetlands. The effects of climate change, such as rising temperature, were shown to be the leading factors impacting wetlands change in China. Thus, efforts to reduce greenhouse gas emissions and implement adaptation strategies to protect wetlands from the effects of climate change should be prioritized.
(2)
There is a need to balance economic development and wetland conservation. While economic growth is essential, it should not come at the expense of wetland loss. Policies and regulations that encourage sustainable development and protect wetlands should be implemented. This could include measures such as zoning regulations that restrict development in wetland areas, and incentives for businesses that implement environmentally friendly practices.
(3)
Wetland restoration and wetland creation should be actively promoted. This can include the restoration of degraded wetlands and the creation of new wetlands, particularly in urban areas where wetlands are often lost due to urbanization in China. This will not only help protect biodiversity and ecosystem services but also provide opportunities for eco-tourism and other economic activities.
(4)
More comprehensive and accurate data on changes in wetlands in China are needed in order to better understand the dynamics of wetland change and inform conservation efforts. Long-term monitoring programs and remote sensing, and other advanced technologies might be used to gather data and provide insights into the state of wetlands in China.

4.4. Limitations of the Study and Future Research Needs

Our study on wetland change in China provides important insights into the driving forces and trends of wetland change, but it is essential to consider its limitations when interpreting the results and planning further research.
First, this study used data on a national scale, which may not reflect the heterogeneity of the wetland ecosystems in China. That is because different wetland types vary in terms of their hydrology, vegetation, and other characteristics, and these differences may influence the driving factors of wetland change. It is therefore essential to consider regional differences when analyzing wetland change in China. This could involve examining specific wetland types or exploring variations in environmental and socioeconomic factors across different regions, which can provide more precise protection strategies for specific wetland types at specific regions.
Secondly, this study used statistical methods such as factor analysis and multiple regression analysis to identify the driving forces of wetland changes. While these methods are useful for identifying correlations between different factors and wetland change, they may not capture the complex and dynamic interactions among the different factors. Other approaches, such as simulation models or causal networks, may provide a more comprehensive understanding of the driving forces of wetland change.
Thirdly, changes in government policies and regulations and community involvement may significantly impact wetland conservation. Therefore, future studies should consider the role of these factors in driving wetland change, and explore how changes in policy and community engagement can be leveraged to promote wetland conservation.
Fourthly, future research should consider the social and cultural values associated with wetlands. Wetlands are not only important for their ecological functions, but also for their cultural and social significance. Integrating social and cultural considerations into wetland conservation efforts can promote community participation in conservation activities and enhance the long-term sustainability of wetland conservation efforts.

5. Conclusions

In conclusion, China’s wetland area decreased during the three-decade rapid growth period (1978–2008), and the wetland loss rate slowed as the economy grew. There was an increase in human-made wetlands in China, but the growth in their area remained relatively small compared to the loss of natural wetlands. Based on our analysis of 29 socioeconomic factors and three climate factors, we can conclude that climate effects, particularly the annual temperature and inland waterway mileage, were the primary driving factors for changes in wetland areas in China between 1978 and 2008. Other socioeconomic indicators, especially from industry (secondary industry ratio) and construction (urban land acquisition and railway mileage), also played an important role in wetland changes during China’s rapid economic development. However, different wetland types may be influenced by various factors. There is a need for more detailed research on the driving factors for specific wetland types. In general, our study has offered specific suggestions for the protection and management of wetlands in China concerning climate change and construction development. It might also serve as a reference for other developing countries.

Supplementary Materials

The following supporting information can be downloaded at: https://www.mdpi.com/article/10.3390/rs15061683/s1. Figure S1: Map of China with different climate zones; Figure S2: The GDP and its growth rate in China from 1978 to 2020; Table S1: Data types, scale, unit, sources, and pre-processing; Table S2: Pearson correlations of all the selected climate and socioeconomic factors with wetland area; Table S3: Pearson correlation of climate and socioeconomic factors on changes in wetland types; Table S4: Rotated loadings (Quartimax method) of all the climate and socioeconomic parameters on the two factors.

Author Contributions

Conceptualization, Y.G. and Z.C.; methodology, Y.G. and Z.C; software, Y.G.; validation, Y.G.; formal analysis, Y.G.; resources, P.S.; data curation, Y.G.; writing—original draft preparation, Y.G.; writing—review and editing, Y.G. and Z.C.; supervision, P.S.; funding acquisition, Y.G. All authors have read and agreed to the published version of the manuscript.

Funding

This research was supported by the IGA Faculty of Environmental Sciences CZU Prague “Socio-economic effects on wetland change in China and Czechia—No. 2021B0007”.

Data Availability Statement

It’s already mentioned in the Material and Methods.

Conflicts of Interest

The authors declare no conflict of interest.

References

  1. Ramachandra, T.V.; Rajinikanth, R.; Ranjini, V.G. Economic Valuation of Wetlands. J. Environ. Biol. 2005. [Google Scholar]
  2. Meng, W.; He, M.; Hu, B.; Mo, X.; Li, H.; Liu, B.; Wang, Z. Status of Wetlands in China: A Review of Extent, Degradation, Issues and Recommendations for Improvement. Ocean Coast Manag. 2017, 146. [Google Scholar] [CrossRef]
  3. Davidson, N.C. Wetland Losses and the Status of Wetland-Dependent Species. In The Wetland Book; Finlayson, C., Milton, G., Prentice, R., Davidson, N., Eds.; Springer: Berlin/Heidelberg, Germany, 2016; pp. 1–14. [Google Scholar]
  4. Fraissinet, M.; Ancillotto, L.; Migliozzi, A.; Capasso, S.; Bosso, L.; Chamberlain, D.E.; Russo, D. Responses of Avian Assemblages to Spatiotemporal Landscape Dynamics in Urban Ecosystems. Landsc. Ecol. 2023, 38, 293–305. [Google Scholar] [CrossRef]
  5. Bian, H.; Li, W.; Li, Y.; Ren, B.; Niu, Y.; Zeng, Z. Driving Forces of Changes in China’s Wetland Area from the First (1999–2001) to Second (2009–2011) National Inventory of Wetland Resources. Glob. Ecol. Conserv. 2020, 21. [Google Scholar] [CrossRef]
  6. Kirwan, M.L.; Megonigal, J.P. Tidal Wetland Stability in the Face of Human Impacts and Sea-Level Rise. Nature 2013, 504, 53–60. [Google Scholar] [CrossRef]
  7. Liu, J.; Tian, H.; Liu, M.; Zhuang, D.; Melillo, J.M.; Zhang, Z. China’s Changing Landscape during the 1990s: Large-Scale Land Transformations Estimated with Satellite Data. Geophys. Res. Lett. 2005, 32, 1–5. [Google Scholar] [CrossRef] [Green Version]
  8. Zeng, H.; Gao, Q.; Chen, X.; Li, G. Changes of the Wetland Landscape in Shenzhen City from 1988 to 2007 and the Driving Force Analysis. Shengtai Xuebao/Acta Ecologica Sinica 2010, 30, 2706–2714. [Google Scholar]
  9. Guo, M.; Li, J.; Sheng, C.; Xu, J.; Wu, L. A Review of Wetland Remote Sensing. Sensors 2017, 17, 777. [Google Scholar] [CrossRef] [Green Version]
  10. Turner, R.; van den Bergh, J.C.J.M.; Söderqvist, T.; Barendregt, A.; van der Straaten, J.; Maltby, E.; van Ierland, E.C. Ecological-Economic Analysis of Wetlands: Scientific Integration for Management and Policy. Ecol. Econ. 2000, 35, 7–23. [Google Scholar] [CrossRef]
  11. Gong, P.; Niu, Z.G.; Cheng, X.; Zhao, K.Y.; Zhou, D.M.; Guo, J.H.; Liang, L.; Wang, X.F.; Li, D.D.; Huang, H.B.; et al. China’s Wetland Change (1990–2000) Determined by Remote Sensing. Sci. China Earth Sci. 2010, 53, 1036–1042. [Google Scholar] [CrossRef]
  12. Niu, Z.G.; Zhang, H.Y.; Wang, X.W.; Yao, W.B.; Zhou, D.M.; Zhao, K.Y.; Zhao, H.; Li, N.N.; Huang, H.B.; Li, C.C.; et al. Mapping Wetland Changes in China between 1978 and 2008. Chin. Sci. Bull. 2012, 57. [Google Scholar] [CrossRef] [Green Version]
  13. Liu, Y.; Tian, J.; Zheng, W.; Yin, L. Spatial and Temporal Distribution Characteristics of Haze and Pollution Particles in China Based on Spatial Statistics. Urban. Clim. 2022, 41. [Google Scholar] [CrossRef]
  14. Bosso, L.; Smeraldo, S.; Russo, D.; Chiusano, M.L.; Bertorelle, G.; Johannesson, K.; Butlin, R.K.; Danovaro, R.; Raffini, F. The Rise and Fall of an Alien: Why the Successful Colonizer Littorina Saxatilis Failed to Invade the Mediterranean Sea. Biol. Invasions 2022, 24, 3169–3187. [Google Scholar] [CrossRef]
  15. Let, M.; Pal, S. Socio-Ecological Well-Being Perspectives of Wetland Loss Scenario: A Review. J. Environ. Manag. 2023, 326. [Google Scholar] [CrossRef]
  16. Muro, J.; Strauch, A.; Heinemann, S.; Steinbach, S.; Thonfeld, F.; Waske, B.; Diekkrüger, B. Land Surface Temperature Trends as Indicator of Land Use Changes in Wetlands. Int. J. Appl. Earth Obs. Geoinf. 2018, 70, 62–71. [Google Scholar] [CrossRef]
  17. Zhang, Y.; Wang, G.; Wang, Y. Changes in Alpine Wetland Ecosystems of the Qinghai-Tibetan Plateau from 1967 to 2004. Environ. Monit. Assess 2011, 180, 189–199. [Google Scholar] [CrossRef] [Green Version]
  18. Zhang, B.; Niu, Z.; Zhang, D.; Huo, X. Dynamic Changes and Driving Forces of Alpine Wetlands on the Qinghai–Tibetan Plateau Based on Long-Term Time Series Satellite Data: A Case Study in the Gansu Maqu Wetlands. Remote Sens. 2022, 14, 4147. [Google Scholar] [CrossRef]
  19. Han, X.; Chen, X.; Feng, L. Four Decades of Winter Wetland Changes in Poyang Lake Based on Landsat Observations between 1973 and 2013. Remote Sens. Environ. 2015, 156, 426–437. [Google Scholar] [CrossRef]
  20. Tian, Y.; Li, J.; Wang, S.; Ai, B.; Cai, H.; Wen, Z. Spatio-Temporal Changes and Driving Force Analysis of Wetlands in Jiaozhou Bay. J. Coast Res. 2022, 38, 328–344. [Google Scholar] [CrossRef]
  21. Zhao, S.-K.; Chen, K.-L.; Wu, C.-Y.; Mao, Y.-H. Effect of Temperature Increase on Dynamic Changes of Soil Respiration in Alpine Wetlands. J. Ecol. Rural. Environ. 2019, 35, 225–233. [Google Scholar] [CrossRef]
  22. Pasut, C.; Tang, F.H.M.; Maggi, F. A Mechanistic Analysis of Wetland Biogeochemistry in Response to Temperature, Vegetation, and Nutrient Input Changes. J. Geophys. Res. Biogeosci. 2020, 125. [Google Scholar] [CrossRef]
  23. Tong, L.; Xu, X.; Fu, Y.; Li, S. Wetland Changes and Their Responses to Climate Change in the “Three-River Headwaters” Region of China since the 1990s. Energies 2014, 7, 2515–2534. [Google Scholar] [CrossRef] [Green Version]
  24. Jie, W.-H.; Xiao, C.-L.; Zhang, C.; Zhang, E.; Li, J.-Y.; Wang, B.; Niu, H.-W.; Dong, S.-F. Remote Sensing-Based Dynamic Monitoring and Environmental Change of Wetlands in Southern Mongolian Plateau in 2000–2018. China Geol. 2021, 4, 353–363. [Google Scholar] [CrossRef]
  25. Specht, N.F.; Claussen, M.; Kleinen, T. Simulated Range of Mid-Holocene Precipitation Changes from Extended Lakes and Wetlands over North Africa. Clim. Past 2022, 18, 1035–1046. [Google Scholar] [CrossRef]
  26. Yu, K.; Hu, C. Changes in Vegetative Coverage of the Hongze Lake National Wetland Nature Reserve: A Decade-Long Assessment Using MODIS Medium-Resolution Data. J. Appl. Remote Sens. 2013, 7. [Google Scholar] [CrossRef] [Green Version]
  27. Zhang, M.; Lin, H.; Long, X.; Cai, Y. Analyzing the Spatiotemporal Pattern and Driving Factors of Wetland Vegetation Changes Using 2000–2019 Time-Series Landsat Data. Sci. Total Environ. 2021, 780. [Google Scholar] [CrossRef]
  28. Hou, X.; Chen, X.; Liu, W.; Feng, L.; Ali, T.A. Changes in the Wetland Vegetation Growth Patterns in Large Lakes on the Yangtze Plain. Int. J. Remote Sens. 2019, 40, 4290–4301. [Google Scholar] [CrossRef]
  29. Čížková, H.; Květ, J.; Comín, F.A.; Laiho, R.; Pokorný, J.; Pithart, D. Actual State of European Wetlands and Their Possible Future in the Context of Global Climate Change. Aquat. Sci. 2013, 75, 3–26. [Google Scholar] [CrossRef] [Green Version]
  30. Ma, T.; She, Y.; Zhao, L.; Hu, B.; Feng, X.; Zhao, J.; Zhao, Z. Alpine Wetland Evolution and Their Response to Climate Change in the Yellow-River-Source National Park from 2000 to 2020. Water 2022, 14, 2351. [Google Scholar] [CrossRef]
  31. Zhang, Y.; Yan, J.; Cheng, X.; He, X. Wetland Changes and Their Relation to Climate Change in the Pumqu Basin, Tibetan Plateau. Int. J. Environ. Res. Public Health 2021, 18, 2682. [Google Scholar] [CrossRef]
  32. Yu, K.; Hu, C. Long-Term Vegetation Changes in Four Types of Wetland in China and USA between 2000 and 2011: Observations from MODIS. Int. J. Remote Sens. 2019, 40, 4302–4325. [Google Scholar] [CrossRef]
  33. Shen, X.; Liu, B.; Jiang, M.; Wang, Y.; Wang, L.; Zhang, J.; Lu, X. Spatiotemporal Change of Marsh Vegetation and Its Response to Climate Change in China From 2000 to 2019. J. Geophys. Res. Biogeosci. 2021, 126. [Google Scholar] [CrossRef]
  34. Dang, Y.; He, H.; Zhao, D.; Sunde, M.; Du, H. Quantifying the Relative Importance of Climate Change and Human Activities on Selected Wetland Ecosystems in China. Sustainability 2020, 12, 912. [Google Scholar] [CrossRef] [Green Version]
  35. Liu, Y.; Liu, G.; Xiong, Z.; Liu, W. Response of Greenhouse Gas Emissions from Three Types of Wetland Soils to Simulated Temperature Change on the Qinghai-Tibetan Plateau. Atmos. Environ. 2017, 171, 17–24. [Google Scholar] [CrossRef]
  36. Xi, S.-J.; Cai, P.-L.; An, Y.-L. Spatio-Temporal Change and Driving Factors of Integrated Ecological Risk of Catchments in Karst Mountainous Area of Guizhou Province from 2000 to 2018. J. Ecol. Rural. Environ. 2020, 36, 1106–1114. [Google Scholar] [CrossRef]
  37. Hagger, V.; Worthington, T.A.; Lovelock, C.E.; Adame, M.F.; Amano, T.; Brown, B.M.; Friess, D.A.; Landis, E.; Mumby, P.J.; Morrison, T.H.; et al. Drivers of Global Mangrove Loss and Gain in Social-Ecological Systems. Nat. Commun. 2022, 13. [Google Scholar] [CrossRef]
  38. Chen, X.; Zhang, M.; Zhang, W. Landscape Pattern Changes and Its Drivers Inferred from Salt Marsh Plant Variations in the Coastal Wetlands of the Liao River Estuary, China. Ecol. Indic. 2022, 145. [Google Scholar] [CrossRef]
  39. Zhao, D.; Liu, J. Heterogeneity of Wetland Landscapes and Their Relationships with Anthropogenic Disturbances and Precipitation in a Semiarid Region of China. Env. Monit Assess 2022, 194. [Google Scholar] [CrossRef]
  40. Long, X.; Lin, H.; An, X.; Chen, S.; Qi, S.; Zhang, M. Evaluation and Analysis of Ecosystem Service Value Based on Land Use/Cover Change in Dongting Lake Wetland. Ecol. Indic. 2022, 136. [Google Scholar] [CrossRef]
  41. Zhang, M.; Zeng, Y. Temporal and Spatial Dynamic Changes and Driving Forces Analysis of Wetland Landscape of Chang-Zhu-Tan Urban Agglomeration. Nongye Gongcheng Xuebao/Trans. Chin. Soc. Agric. Eng. 2018, 34, 241–249. [Google Scholar] [CrossRef]
  42. Song, F.; Su, F.; Mi, C.; Sun, D. Analysis of Driving Forces on Wetland Ecosystem Services Value Change: A Case in Northeast China. Sci. Total Environ. 2021, 751. [Google Scholar] [CrossRef] [PubMed]
  43. Gong, N.; Niu, Z.; Qi, W.; Zhang, H. Driving Forces of Wetland Change in China. Yaogan Xuebao/J. Remote Sens. 2016, 20, 172–183. [Google Scholar] [CrossRef]
  44. Gong, Z.; Li, H.; Zhao, W.; Gong, H. Driving Forces Analysis of Reservoir Wetland Evolution in Beijing during 1984–2010. J. Geogr. Sci. 2013, 23, 753–768. [Google Scholar] [CrossRef]
Figure 1. Changes in wetland areas (left) and average GDP per capita (right) in 31 regions of China during the three decades.
Remotesensing 15 01683 g001
Figure 2. Rates of changes in wetland areas (left) and average GDP per capita (right) in China during the three decades (1978–2008).
Remotesensing 15 01683 g002
Figure 3. Area of three main wetland types (left) and subtypes (right) in China in 1978, 1990, 2000, and 2008. I1: River wetlands (including floodplains with rivers as river wetlands, landscaping and recreational water bodies, and other wetlands), I2: Lakes, I3: Inland marshes/swamps; H1: Reservoirs/ponds, H2: Artificial channels, H3: Seawater fish farms/salt flats, H4: Other artificial wetlands; C1: Tidal zones/shallow beaches, C2: Marine marshes/mangrove, C3: Estuarine waters, C4: Estuarine deltas, C5: Lagoons.
Remotesensing 15 01683 g003
Figure 4. The interchange between different types of wetlands from 1990 (uppercase letters) to 2000 (lowercase letters). I1: River wetlands, I2: floodplain wetlands, I3: Lakes, I4: Inland marshes/swamps; H1: Reservoirs/ponds, H2: Artificial channels, H3: Seawater fish farms/salt flats, H4: Other artificial wetlands; C1: Tidal zones/shallow beaches, C2: Marine marshes/mangrove, C3: Estuarine waters, C4: Estuarine deltas, C5: Lagoons; L: Wetland loss.
Remotesensing 15 01683 g004
Figure 5. Factor analysis on changes in wetland areas: (a) all 32 factors, (b) the 8 most important factors.
Remotesensing 15 01683 g005
Figure 6. Similarity matrix of wetland types and socioeconomic factors. I1: River wetlands, I2: floodplain wetlands, I3: Lakes, I4: Inland marshes/swamps; H1: Reservoirs/ponds, H2: Artificial channels, H3: Seawater fish farms/salt flats, H4: Other artificial wetlands; C1: Tidal zones/shallow beaches, C2: Marine marshes/mangrove, C3: Estuarine water, C4: Estuarine deltas, C5: Lagoons; significant level: p < 0.05 (*) and p < 0.001 (**).
Remotesensing 15 01683 g006
Table 1. Rotated loadings (Quartimax method) of the main climate and socioeconomic parameters on factors 1 and 2.
Factor 1Factor 2
GDP per capita0.710.15
Secondary industry ratio0.73−0.27
Annual temperature−0.120.89
Aquatic products0.490.63
Railway mileage0.47−0.64
Inland waterway mileage0.360.62
Road mileage0.690.03
Urban land acquisition0.750.07
Table 2. Multiple linear regression of wetland area with main climate and socioeconomic factors.
CoefficientStd. ErrortpVIF
Constant1.7250.7362.3440.024
GDP per capita0.2260.1161.950.0571.837
Secondary industry ratio−4.1941.636−2.5630.0142.38
Annual temperature−0.6420.141−4.549<0.0013.505
Aquatic products0.1130.08811.2780.2081.906
Railway mileage0.2790.1152.4130.022.457
Inland waterway mileage0.3240.09033.591<0.0011.401
Road mileage−0.006550.102−0.06390.9492.164
Urban land acquisition−0.2570.0953−2.6910.011.648
Disclaimer/Publisher’s Note: The statements, opinions and data contained in all publications are solely those of the individual author(s) and contributor(s) and not of MDPI and/or the editor(s). MDPI and/or the editor(s) disclaim responsibility for any injury to people or property resulting from any ideas, methods, instructions or products referred to in the content.