Article

Assimilation and Inversion of Ionospheric Electron Density Data Using Lightning Whistlers

Department of Space Physics, School of Electronic Information, Wuhan University, Wuhan 430072, China
*
Author to whom correspondence should be addressed.
Remote Sens. 2023, 15(12), 3037; https://doi.org/10.3390/rs15123037
Submission received: 30 April 2023 / Revised: 5 June 2023 / Accepted: 7 June 2023 / Published: 10 June 2023

Abstract

:
The data assimilation algorithm is a common algorithm in space weather research. In this paper, the time-frequency information in the dispersion spectrum of lightning whistlers received by the ZH-1 satellite is used as the observed value, and the international reference ionospheric model serves as the background model to construct the calculation model of the propagation time of lightning whistlers in the ionosphere. Kalman filtering is adopted to assimilate the electron density distribution along the propagation path of lightning whistlers. The results show that the situation where the electron density of the background model deviates greatly from the true value is significantly improved through data assimilation. The electron density after assimilation is in good agreement with the true value, which effectively helps realize the process of using observed values to correct the background value. On this basis, the influence of the frequency difference on the assimilation inversion effect is studied, and the results show that the assimilation effect is worse when the frequency difference between frequency points is less than 1 kHz.

1. Introduction

1.1. Ionospheric Data Assimilation

The ionosphere is an important area for human space activities, and it has a significant influence on various radio systems. With the increasing number of human space activities, the demand for ionosphere monitoring and forecasting is increasing in related fields [1]. In the past, ionosphere detection was mainly conducted using ground-based methods, of which the leading method was vertical sounding. The development of satellite technology in recent decades has made it possible to use satellites to observe the ionosphere, such as through ground-based global navigation satellite system (GNSS) observations and radio occultation observations. How to use these detection data to accurately model the ionosphere has always been an active research topic, and one of the principal methods is data assimilation [2,3]. Data assimilation makes up for the deficiencies of empirical modeling and theoretical modeling and effectively improves the accuracy of ionospheric models. The basic theory is to adopt a series of algorithms, such as optimal estimation theory, the Kalman filtering method, and the variational method, to assimilate and fuse observations on a background model based on the physical mechanism to minimize the overall error between the model and observations, thus obtaining more accurate physical parameters [4].
In the wake of the development of the GNSS and ground-based observation networks in recent years, the theory of ionospheric data assimilation has also been progressing vigorously. In the field of ionospheric data assimilation, Richmond et al. [5] first established the assistive mapping of the ionospheric electrodynamics model. Angling et al. [6,7] built the electron density assimilating model (EDAM) using the best linear unbiased estimator theory. The EDAM can process ground-based global positioning system (GPS), occultation, and other observation data to obtain the global ionospheric electron density distribution. Based on the three-dimensional (3D) variational data assimilation technique, Bust et al. [8,9] constructed the ionospheric data assimilation three-dimensional (IDA3D) model based on the empirical ionospheric model. The IDA3D model has a multi-source data processing function. It can assimilate and process a variety of data, including digisonde, ground-based GPS, occultation, satellite beacon, and satellite positioning measurement data, to obtain information about ionospheric changes on a global scale. Bust and Immel [10] developed the Ionospheric Data Assimilation Four-Dimensional (IDA4D) model based on the Ionospheric Connection Explorer (ICON). They took the IRI model as the background model, and used the ground-based GPS TEC, COSMIC-2 radio occultation, ICON FUV radiance, and ICON EUV electron density data as the observed values. They inputted the observed values into the IDA4D model to obtain the global electron density field. Ercha et al. [11] developed a new TEC-based ionospheric data assimilation system (TIDAS) using the three-dimensional variational (3DVAR) approach. The NeQuick model was used as the background model. The TIDAS model assimilated ground-based GNSS TEC, COSMIC radio occultation data, JASON satellite altimeter TEC, and Millstone Hill incoherent scatter radar measurements to reconstruct the regional three-dimensional electron density distribution. The accuracy of the assimilation results was verified by ionosonde. Based on the GNSS data from the China Crustal Movement Observation Network (CMONOC), Qiao et al. [4] adopted the Kalman filter assimilation method to establish a fast electron density nowcasting model for China and its adjacent regions. These researchers used data assimilation technology as a method to study ionospheric physics and to adjust the output parameters of the modified model by absorbing the observation data. The most mature ionospheric assimilation models thus far are the Jet Propulsion Laboratory/University of Southern California assistive ionosphere model (JPL/USC GAIM) and the Utah State University global assimilation of ionospheric measurements model (USU GAIM) [12,13]. The former used a physics-based ionosphere model and Kalman filtering to assimilate a variety of ionosphere sounding data sources, such as satellite in situ electron density measurements, as well as digisonde, occultation, and ground-based GPS data sources, to reconstruct the global three-dimensional electron density distribution within the range of 90 km to 3500 km [13,14]. The latter took the ionospheric forecast model as the background field and employed Gauss–Markov Kalman filtering to assimilate various observation data to generate the three-dimensional global electron density distribution [14]. The observation data used in ionospheric assimilations in the past were mainly from ground-based observations and space-based observations; however, ground-based GNSS observations cannot observe the oceans and some other areas due to the limits of station distribution, and this method is affected by the quality of the GPS signal [7]. Ionospheric vertical sounding has difficulty detecting the ionization state of the D-layer, and cannot carry out ionosphere detection above the F-layer peak value. The occultation observations have a low spatial resolution in higher ionosphere regions [4]. Lightning whistlers propagate along the geomagnetic field in the ionosphere and are a natural signal with a high incidence and intensity, which makes them easily detectable by satellites around the world. Consequently, the lightning whistlers observed by satellites can be used as observation data for ionospheric data assimilation.

1.2. Lightning Whistlers

A lightning whistler is a very low-frequency (VLF) electromagnetic wave excited by lightning [15]. Although most of the energy generated by the lightning discharge propagates in the Earth-ionosphere waveguide [16], some of the energy can penetrate the ionosphere and travel to the opposite hemisphere along the geomagnetic field lines [17,18]. In the propagation process, the high-frequency electromagnetic waves propagate faster and arrive first, and the low-frequency electromagnetic waves have a slower speed and arrive later [19,20]. In the time-frequency spectrum, the frequency gradually decreases with time, which is called the dispersion spectrum. When the path length is long or the electron density along the transmission path is dense, the dispersion spectrum gradually becomes larger. This reveals the important fact that the dispersion of lightning whistlers depends on the plasma electron density distribution, geomagnetic field intensity, and path length along the propagation path [15]. Therefore, it is possible to conduct space physics research using the ionospheric information carried by lightning whistlers.
Lightning whistlers are mainly observed by ground VLF observation stations [21,22,23] and spacecraft. The disadvantage of a ground VLF observation station is its spatial limitation, and its observation signal is vulnerable to ground interference. The lightning whistlers observed by satellites are not limited by the spatial position and are not susceptible to ground interference. Therefore, the lightning whistlers detected by electromagnetic satellites are more suitable for ionospheric research. In recent years, a large number of searchers have studied the detection algorithms for lightning whistlers recorded by satellites. Dharma et al. [24] used adaptive thresholding methods, a median filter, and an open method to remove noises in the spectrogram image recorded by the Akebono satellite, and then used the connected-component labeling method to label and detect lightning whistlers. Ahmad et al. [25] adopted the Bresenham algorithm to automatically detect lightning whistlers recorded by the Arase satellite. Konan et al. [26] developed a machine-learning-based model capable of automatically detecting whistlers using the Sliding Deep Neural Convolutional Neural Network (SDNN) and You Only Look Once Version 3 (YOLOV3) object detection network.
Thanks to the evolution of space technology over the past three decades, many electromagnetic satellites have been launched to monitor the electromagnetic environment in the area of space around Earth. Many searchers have conducted space physics research using lightning whistlers observed by satellites. For example, Bayupati et al. [27] hypothesized about using two ionospheric electron density models and compared the dispersion trend of lightning whistlers along Akebono satellite’s trajectory, which was calculated theoretically with that observed by the satellite. The results showed that the theoretical dispersion trend is basically consistent with the actual observation, and that the effect of model 2 was better. Bayupati’s research proved that the dispersion of lightning whistlers can be used to study electron density distribution in the ionosphere. Oike et al. [28] used an automatic lightning whistler detection method to analyze the spatial and temporal distribution of lightning whistlers observed by satellites. The results revealed that lightning activity and ionospheric conditions will affect the occurrence of lightning whistlers. Zahlava  et al. [29] found through observation with the DEMETER spacecraft and Van Allen Probes that the degree of attenuation of the dispersion characteristic of lightning whistlers is lower at night, and concluded that the density of the spatial ionosphere is lower at night. Santolik et al. [30] pointed out that the form of lightning recorded by ground VLF observation stations is very similar to that observed by satellites, and both forms have dispersion characteristics. Putri and Kasahara et al. [31] proposed two correction functions to modify the empirical electron density model, and theoretically calculated the dispersion of lightning whistlers observed by the Arase satellite using ray tracing. After proper adjustment, the theoretical calculation value satisfied the dispersion of lightning whistlers observed by the Arase satellite, correcting the electron density profile.

1.3. Innovation

Until now, research on ionospheric data assimilation has focused on assimilating a variety of ionospheric observations from space and the ground, such as from ground-based GPS, satellite observations, digisonde, and other data sources. The assimilation results mostly include electron density. These observations are all obtained via ionosphere detection through artificially emitted electromagnetic signals. Few researchers have used the ionospheric information carried by lightning whistlers, a natural signal, to conduct ionospheric data assimilation research. Some scholars have analyzed the relationship between whistler dispersion characteristics and the electron density, proving that lightning whistlers can be used to obtain or correct the electron density distribution in the ionosphere. However, few scholars have studied the specific methods of using lightning whistlers to invert or modify the ionospheric electron density [32], and the research on adopting the data assimilation method to achieve this goal is even rarer.
The dispersion characteristics of lightning whistlers observed by satellites contain information about the ionospheric electron density; thus, retrieving electron density profiles using lightning whistlers has become a meaningful issue, and the data assimilation method provides an effective way to solve this problem. By adopting the data assimilation method, the electron density distribution along the lightning whistler’s propagation path can be inverted. This inversion method is based on the electron density distribution information provided by the background model. The assimilation of the ionospheric electron density using lightning whistlers as a natural source is an extension of previous observation data obtained by artificial detection signals, and is also a new method of electron density inversion using lightning whistlers. Consequently, in this paper, the ionospheric electron density information carried by lightning whistlers is used to obtain the ionospheric electron density profile via the data assimilation method, and its validity is evaluated.

2. Values

In general, data assimilation methods incorporate observations into models, providing a global/regional description of a system that is optimally consistent with both the model and observations [2]. The observed value and background value are essential elements in data assimilation. This section introduces the observation and background model selected for data assimilation. The validation data used to verify the assimilation effect are also presented.

2.1. Observation

In this paper, The China Seismo-Electromagnetic Satellite (CSES, also called ZH-1) is selected as the lightning whistler observation system. The ZH-1 satellite is the first electromagnetic monitoring satellite in China, and the electric-field detector (EFD) carried by the satellite adopts active double-probe detection to obtain electric-field data in four frequency bands in the satellite’s orbit. The electric-field detection data for three components (X, Y, and Z) include the power spectrum data in four frequency bands (ULF, ELF, VLF, and HF) in the survey mode and the waveform data in the burst mode. The frequency range and sampling rate of the VLF band are 1.8–20 kHz and 50 kHz, respectively, and the VLF-band EFD can capture global lightning whistlers [33]. The ZH-1 satellite covers latitudes that range from 65° north to 65° south. It operates in burst survey mode over the Chinese mainland and its surrounding 1000 km area, as well as in two global seismic belts (the Pacific seismic belt and the Eurasian seismic belt), while it operates in survey mode in other regions. The inclination of the orbit of the ZH-1 is 97.4°, making it a sun-synchronous orbit. Global observations with a spatial resolution of approximately 500 km can be achieved in a regression cycle [34]. The observation data are stored separately according to the ascending orbit (night) and descending orbit (day), and the observation time is approximately 34 min per half orbit (ascending/descending orbit) [33]. Until now, the ZH-1 satellite has been observing in orbit for more than 3 years, and it has collected a large amount of waveform and power spectrum data on global electromagnetic fields. The satellite’s working area is shown in Figure 1. The flight height of the ZH-1 satellite in orbit is approximately 507 km, which means it is close to the top of the ionosphere and the boundary of the plasmasphere. In this region, there are abundant events in the ELF and VLF frequency bands, such as lightning whistlers and quasi-periodic radiation [35].
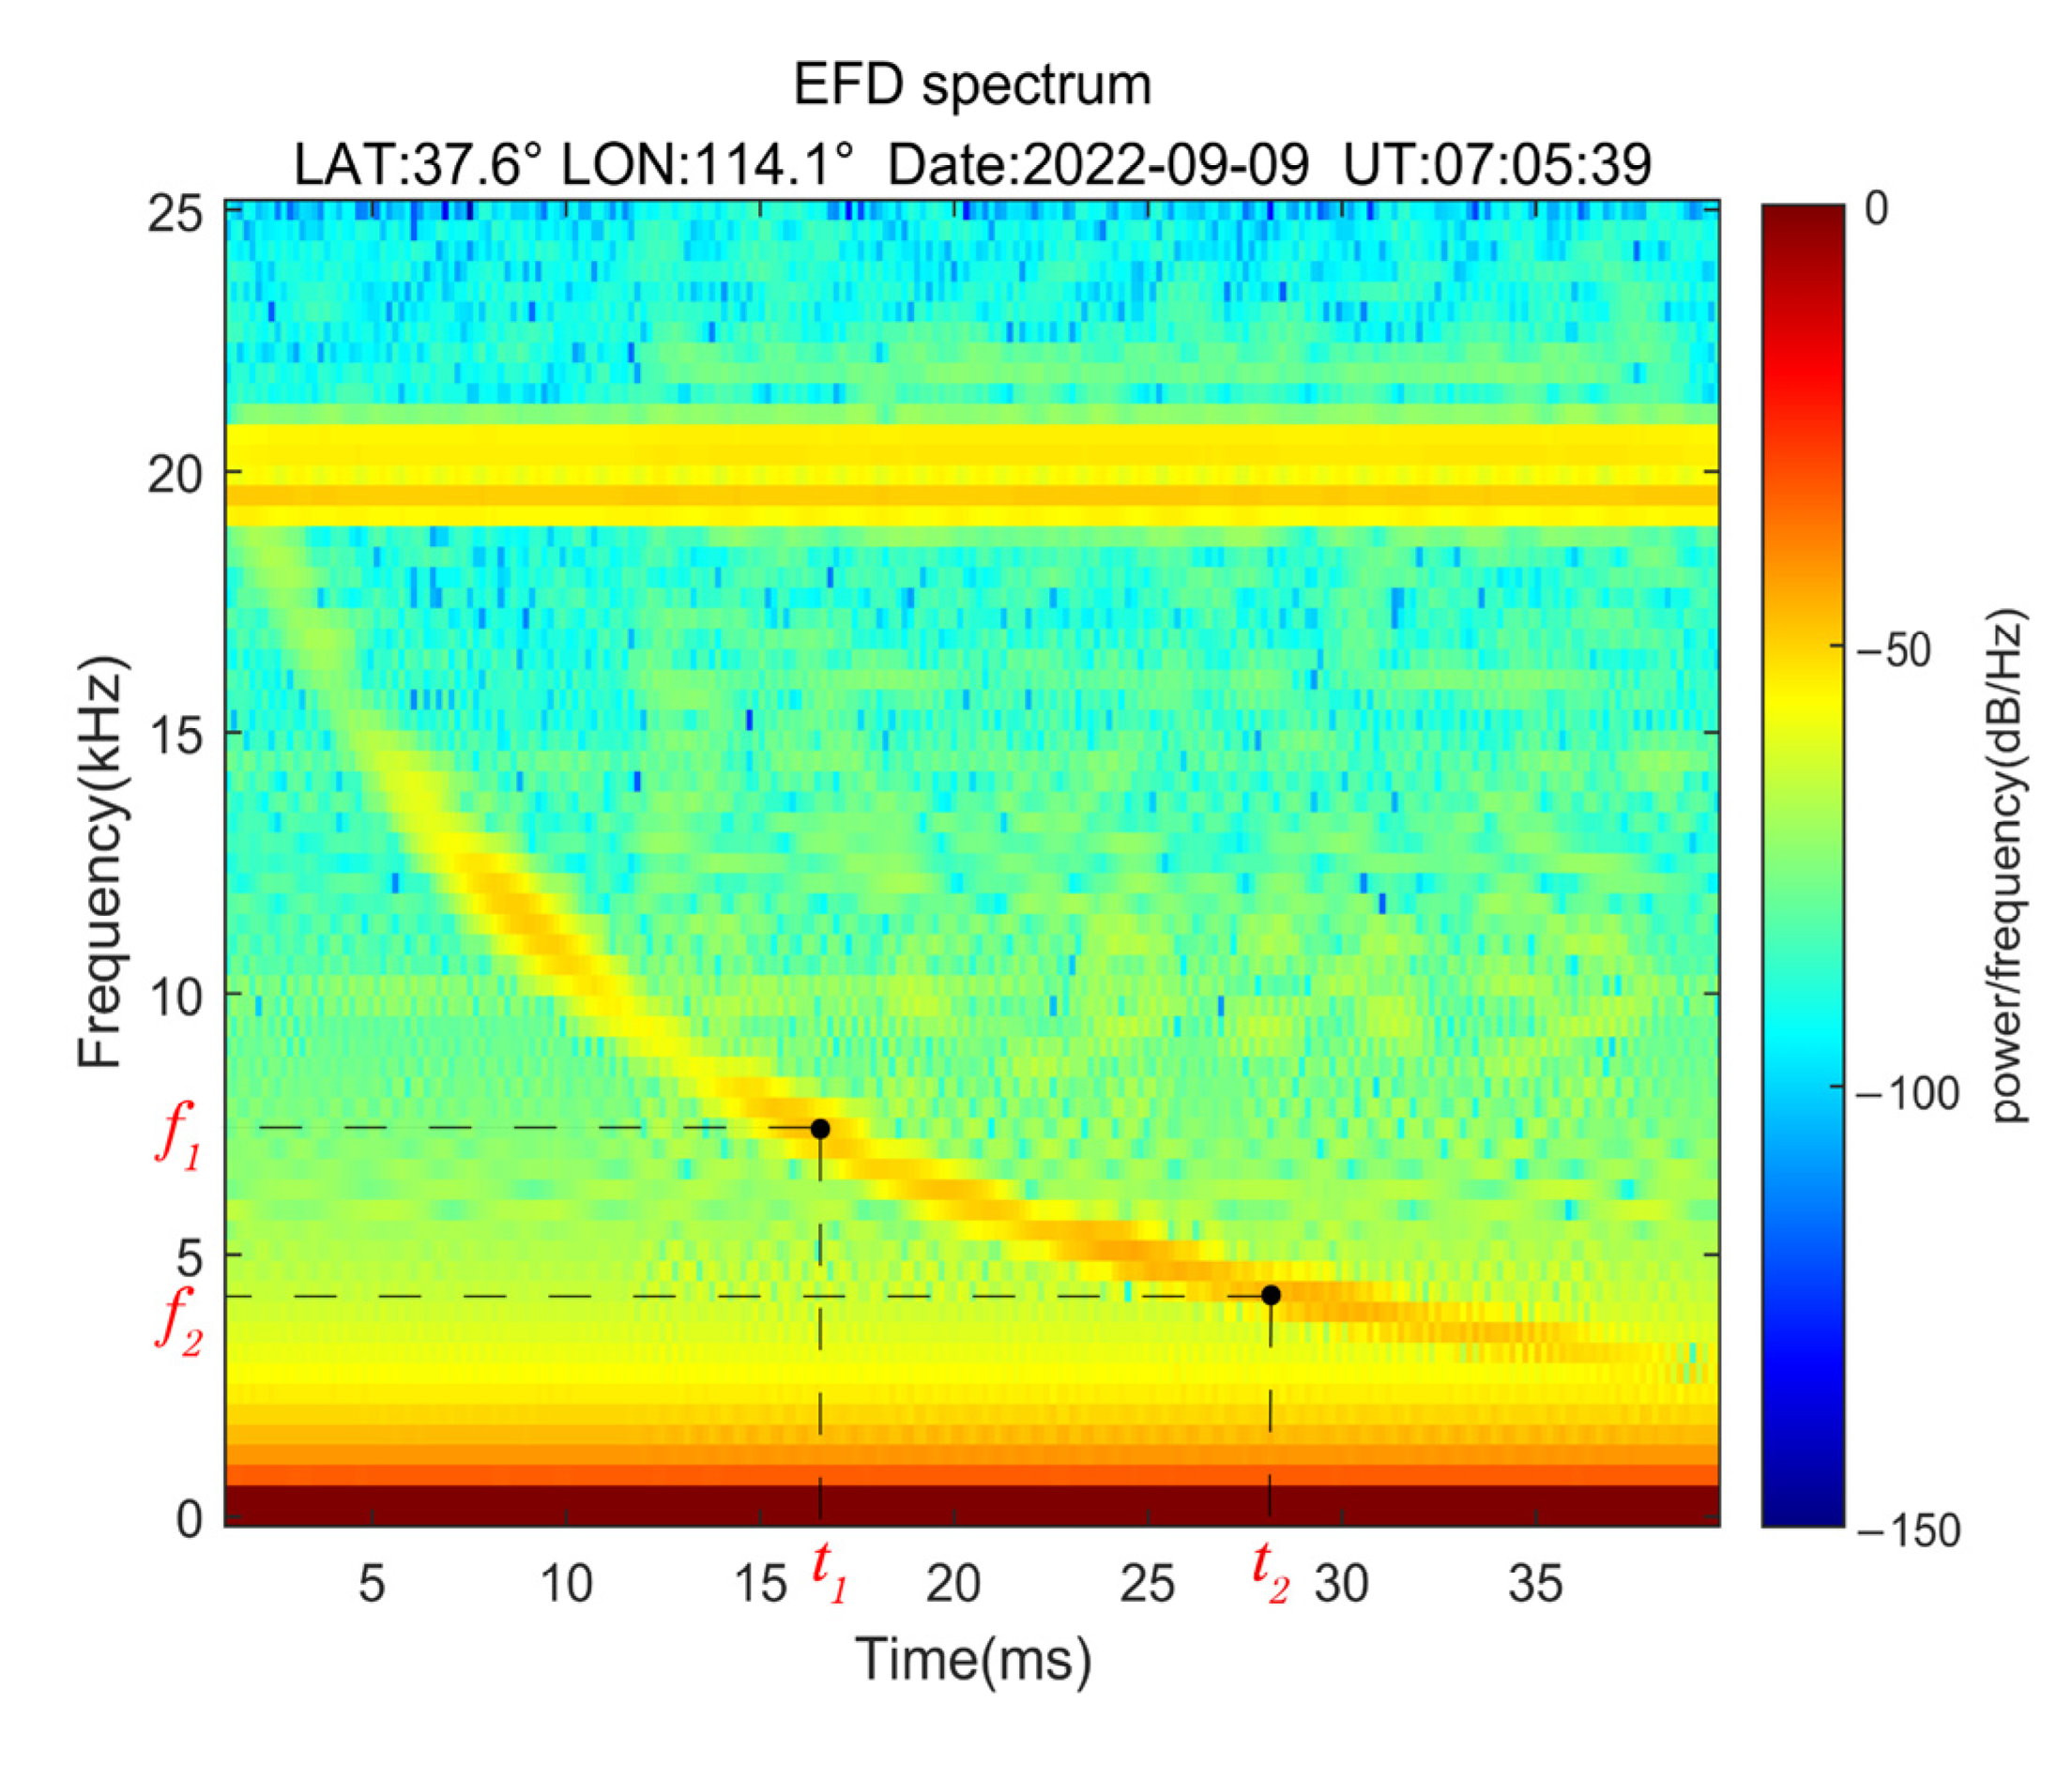
Both the electric-field detector and the search coil magnetometer on the ZH-1 satellite can detect lightning whistlers, which present a dispersion pattern in the time-frequency spectrum of the electromagnetic data in the VLF band (Figure 2). The physical mechanism that produces this feature is that the higher-frequency electromagnetic wave propagates faster and arrives first [20]. In the time-frequency spectrum, the frequency gradually decreases with time, which is called the dispersion spectrum [24,25]. As shown in Figure 2, different colors represent the power spectral density of the electric field; f1 is the frequency corresponding to the maximum power spectral density at time t1, and f2 is the frequency corresponding to the maximum power spectral density at time t2. The points, such as (t1, f1) and (t2, f2), are referred to as time-frequency points. The time-frequency points on the dispersion spectrum correspond to the arrival times of lightning whistlers with different frequencies. The arrival time difference of signals with different frequencies is taken as the observed value in this paper.

2.2. Background Model

In this paper, the IRI model is selected as the background model. The IRI model is one of the most widely used empirical models, and it was developed and updated by the International Union of Radio Science and the Committee on Space Research [36]. Its data come from more than 180 ionosphere-detecting stations around the world, as well as from satellites. It mainly simulates the global distribution of a series of ionospheric parameters, such as electron density (Figure 3), electron temperature, ion composition, ion temperature, and ion drift [36]. The electron density of the IRI model is derived by extending the tracing point of the peak electron density, including the F2, F1, and E regions, and it is described by mathematical functions in the vertical direction and orthogonal polynomials in the horizontal direction.

2.3. Verification Data

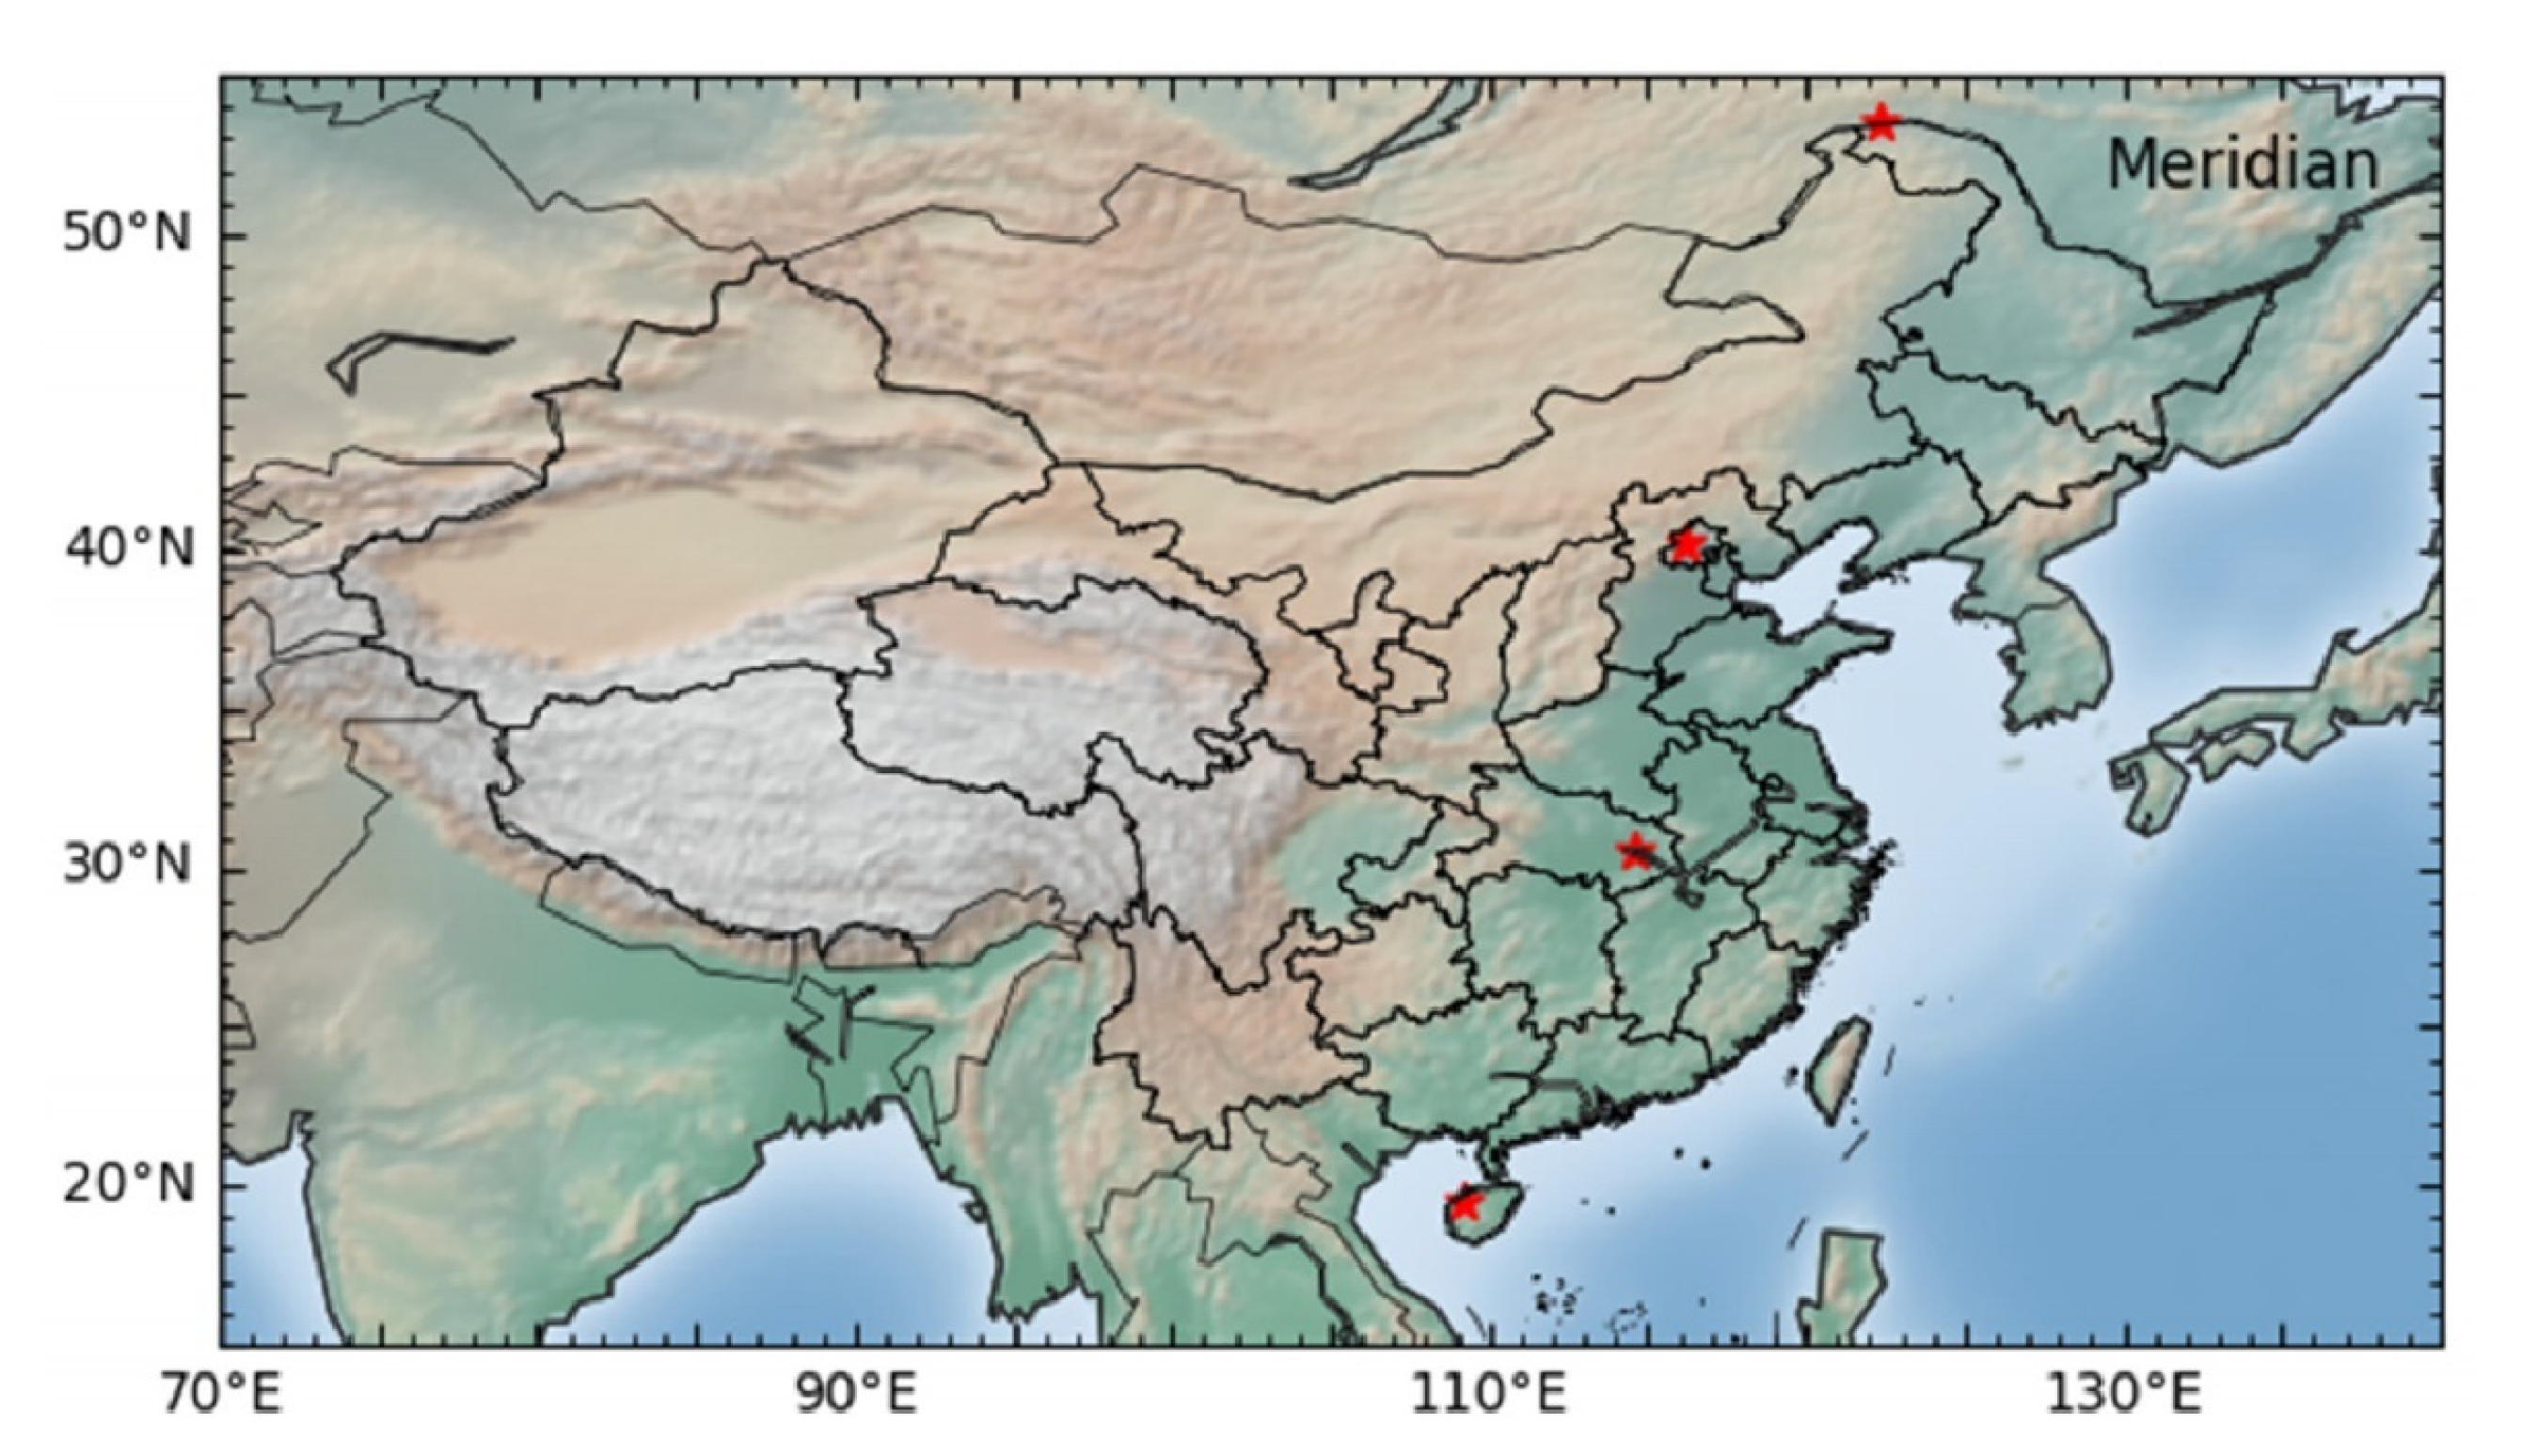
To verify the effectiveness of the assimilation inversion results, we need to find reliable independent data to obtain the true electron density profile in the ionosphere. The digisonde stations that are a part of the Meridian Project emit high-frequency radio pulses vertically from the ground, varying in frequency from 1 to 30 MHz. The digisonde receives its reflected signal at the same place, measures the propagation time of echo, and obtains the ionogram of virtual height that changes with frequency. Based on the metric analysis and inversion of the ionogram, ionospheric characteristic parameters and the electron density profile below the height of the maximum of the F2 region can be obtained. An arbitrary number of parabolic segments may be fitted to the profile to approximate its shape. A file with the suffix SAO can be generated to store all the information [4]. Figure 4 shows the location distribution of four digisonde stations of the Meridian Project. In this paper, the electron density profile in the SAO file is used as the verification data.

3. Materials and Methods

3.1. Meshing Method

The partial energy of the VLF/ELF electromagnetic wave radiated by lightning in nature propagates along the geomagnetic field line in the ionosphere in the form of a whistler, and then, its signal is received by satellites located in the ionosphere. The propagation path of a lightning whistler from the bottom of the ionosphere to the satellite’s position along a geomagnetic line is uniformly gridded in the vertical direction. To improve the calculation accuracy, the mesh width was set to 100 m. Figure 5 shows a schematic of the mesh division. In the data assimilation process, we assume that the electron density and geomagnetic field in the same mesh are the same.

3.2. Assimilation Algorithm

Among the numerous data assimilation methods, Kalman filtering is easy to understand and implement, does not need an adjoining model, and can explicitly transfer the error covariance forward [37]. In this paper, the Kalman filtering method was employed to assimilate the ionospheric data. Briefly, the data assimilation must include useful information, which mainly includes three aspects. 1. Background and observed values: The observed value includes the observation error and representative error, but is not accurate. Therefore, we use various theoretical methods to estimate its real value as much as possible. 2. Uncertainty: the error itself is also helpful information for data assimilation, and the method of calculating the error in the assimilation process directly determines the final effect of the assimilation. 3. Covariance: this is the physical and spatial correlation between various values, which is crucial information for data assimilation [37].
The international geomagnetic reference field (IGRF) is a universal model used to describe the main magnetic field of the Earth. It was established and is maintained by the geomagnetic model team supported by the V-MOD Working Group. Based on the IGRF model, the geomagnetic inclination and geomagnetic field intensity at the location of the satellite can be ascertained, and the geomagnetic field line L through the satellite can be determined. Lefeuvre et al. [38] clarified in their article that the 0+ whistler travels through a short and direct upward path to the satellite without crossing the geomagnetic equator to reach the opposite hemisphere. Any 0+ whistler signal components that are below ~1.8 kHz that are received by the satellite must have entered the magnetosphere nearly overhead of the causative discharge (in those cases where the satellite pass happens to be immediately over the thunderstorm). We can use this theory to determine that the lightning whistlers received by the satellite in our study propagate directly rather than from the opposite hemisphere. In addition, we can also use the average wave normal angle (WNA) corresponding to the whistler to determine that the lightning whistlers used in our study are direct propagation (driving) [39]. According to the theory that lightning whistlers propagate along the geomagnetic field lines [17,18], we can conclude that path L is the propagation path of a lightning whistler received by the satellite in the ionosphere. The geomagnetic inclination and geomagnetic field intensity at any position on propagation path L are obtained from the IGRF model. From the IRI model, the electron density at any position on the ionospheric propagation path at the corresponding time can be also determined.
The refractive index distribution on propagation path L can be calculated using the Appleton–Hartree (A–H) formula, which is the dispersion relationship of the electromagnetic wave propagation in plasma in the magneto-ionic theory [40]:
n 2 = 1 X 1 j Z Y T 2 2 ( 1 X j Z ) Y T 4 4 ( 1 X j Z ) 2 + Y L 2 ,
where n is the refractive index, X = ω p 2 / ω 2 , Y = ω h / ω , Z = γ e / ω , ω p ω p e = N e e 2 / m e ε 0 is the plasma frequency, N e is the electron density, m e is the electronic mass, ε 0 is the dielectric constant of vacuum, e is the unit charge quantity, B 0 is the geomagnetic field intensity, ω h = e · B 0 / m e is the gyro-frequency, Y T = Y sin φ , Y L = Y cos φ , φ is the angle between the wave vector and geomagnetic field, γ e is the collision frequency, and ω is the angular frequency of the lightning whistler in the VLF band.
It is very complicated to directly apply the A–H formula to solve for the problem of propagation in any direction. In the whistler theory, where the approximate model of quasi-longitudinal propagation is satisfied [40], the partial energy of the VLF/ELF electromagnetic wave radiated by lightning in nature propagates along the geomagnetic field line in the ionosphere in the form of a whistler. Therefore, ϕ ≈ 0 and YL ≈ Y. The collision affects the strength of the signal, but has little effect on the propagation time of the lightning whistlers. Based on the time, geography, and corresponding ionospheric state informationwhen a lightning whistler was received by the ZH-1 satellite, the propagation time of the lightning whistler with a frequency of 5.5 kHz from the bottom of the ionosphere to the altitude of the satellite is calculated with and without collision. The time difference is 6.8 us, which is far less than the millisecond order of the propagation time. Therefore, it is reasonable to ignore the collision. The formula of the collision frequency is ύ = 1.82 × 10¹¹ × e(−0.15h) [41,42], where h represents the height and its unit is km. When the collision is ignored, the A–H formula simplifies to
n 2 = 1 X 1 Y L = 1 X 1 Y ,
Based on the electron density and the geomagnetic field vector given by the IGRF model, the values of X and Y in the A–H formula can be calculated, and the refractive index of a lightning whistler at any position on the ionospheric propagation path can be obtained. The representation of the relationship between the refractive index and the propagation speed of the electromagnetic wave is as follows:
v = c n r ,
where v is the propagation speed of the lightning whistler, n r is the real part of the refractive index, and c is the speed of light.
Then, the propagation time of a lightning whistler on a certain path is as follows:
d t = d s v = n r d h sin θ c ,
where d s is the path length, d h is the length in the vertical direction, and θ is the geomagnetic inclination. Thus, the total time of lightning whistler propagation in the ionosphere is as follows:
t = h 1 h n r sin θ c d h ,
where h 1 is the height of the bottom of the ionosphere, and h is the height of the satellite.
Based on the mesh divided in the vertical direction in the ionosphere described in Section 2, and assuming that the electron density, geomagnetic field intensity, and geomagnetic inclination are the same within the same mesh, the propagation time in a mesh satisfies the following equation:
d Δ t = d s v 1 d s v 2 = ( n r 1 sin θ c n r 2 sin θ c ) d h ,
where Δt is the propagation time difference of two whistler signals with different frequencies in a mesh, d h is the length of the mesh in the vertical direction, and n r 1 and n r 2 are the refractive indices of lightning whistlers with frequencies f 1 and f 2 in the same mesh, respectively.
Therefore, the total time difference between two whistler signals with different frequencies propagating to the satellite along geomagnetic field lines in the ionosphere is
Δ t = h 1 h ( n r 1 sin θ c n r 2 sin θ c ) d h ,
Utilizing the discretization inversion theory, Equation (7) can be simplified into the following form according to the mesh divided by the height in the area to be assimilated, as described in Section 2:
d = H x + e ,
where d is the observed value, representing the difference in the arrival time delay of two signals with different frequencies in the lightning whistler dispersion spectrum observed by the satellite. H is the observation operator, which converts the mode vector to the observation vector. H is a vector composed of the vertical lengths of mesh points through which lightning whistlers pass. We set the vertical length of the mesh points to 100 m, and H is a vector with all elements of 100. Because the relationship between the observed and background values is nonlinear, the observation operator H is nonlinear, and e is the discretization error, which is usually ignored. x is the difference between the reciprocal of the propagation velocity times’ sinusoidal value of the geomagnetic inclination for two lightning whistlers with different frequencies in each mesh:
x = ( n r 1 ( N e 1 , f 1 ) sin θ 1 c n r 2 ( N e 1 , f 2 ) sin θ 1 c , n r 1 ( N e 2 , f 1 ) sin θ 2 c n r 2 ( N e 2 , f 2 ) sin θ 2 c , , n r 1 ( N e n , f 1 ) sin θ n c n r 2 ( N e n , f 2 ) sin θ n c )
where N e n is the electron density value in the nth mesh, and θ n is the geomagnetic inclination in the nth mesh.
In this paper, the Kalman filtering algorithm [37] was selected for data assimilation of the observation data, and the implementation method is as follows:
x a = x b + B H T R + H B H T 1 ( d H x b ) ,
where x b is the background value, which is calculated using Equation (10) according to the electron density given by the IRI background model; x a is the analysis value, because this value is a function of the mesh electron density and x a can be converted into the mesh electron density analysis value; and B and R represent the error covariance of the background value and the observed value, respectively.
Based on Equation (10), we can comprehend that data assimilation can be considered to be a process in which the observed value revises the background value. The relative size and spatial distribution of B and R determine the relative weight and spatial structure of the influence of the observed value and background value on the analysis value [37]. The error covariance directly affects the effect of the data assimilation and becomes one of the key points in the ionospheric data assimilation. In accordance with previous research results, it is assumed that the observation error is proportional to the square of the observed value [6,8], and thus the observation error covariance matrix can be expressed as follows:
R i j = α × d i × d j , i = j 0 , i j ,
where i and j are observation points; R i j is the observation error covariance; and α is the scale factor.
For the error covariance matrix of the background value, the assumption is made that the background value has a Gaussian distribution in the vertical direction and can be separated [4,8], and its elements are expressed as follows:
B i j = β × x b i × x b j × e ( L i j 2 / 2 L h 2 ) ,
where x b i and x b j represent the background values of the background model at point i and point j, and L i j represents the distance between the ith point and the jth point in the height direction. L h represents the correlation distance in the height direction, and β is the proportional coefficient. Concerning previous research results and considering that the ionospheric data assimilation height in this paper is within the height of the ZH-1 satellite (approximately 500 km), the height correlation distance was set as 30 km.

4. Results

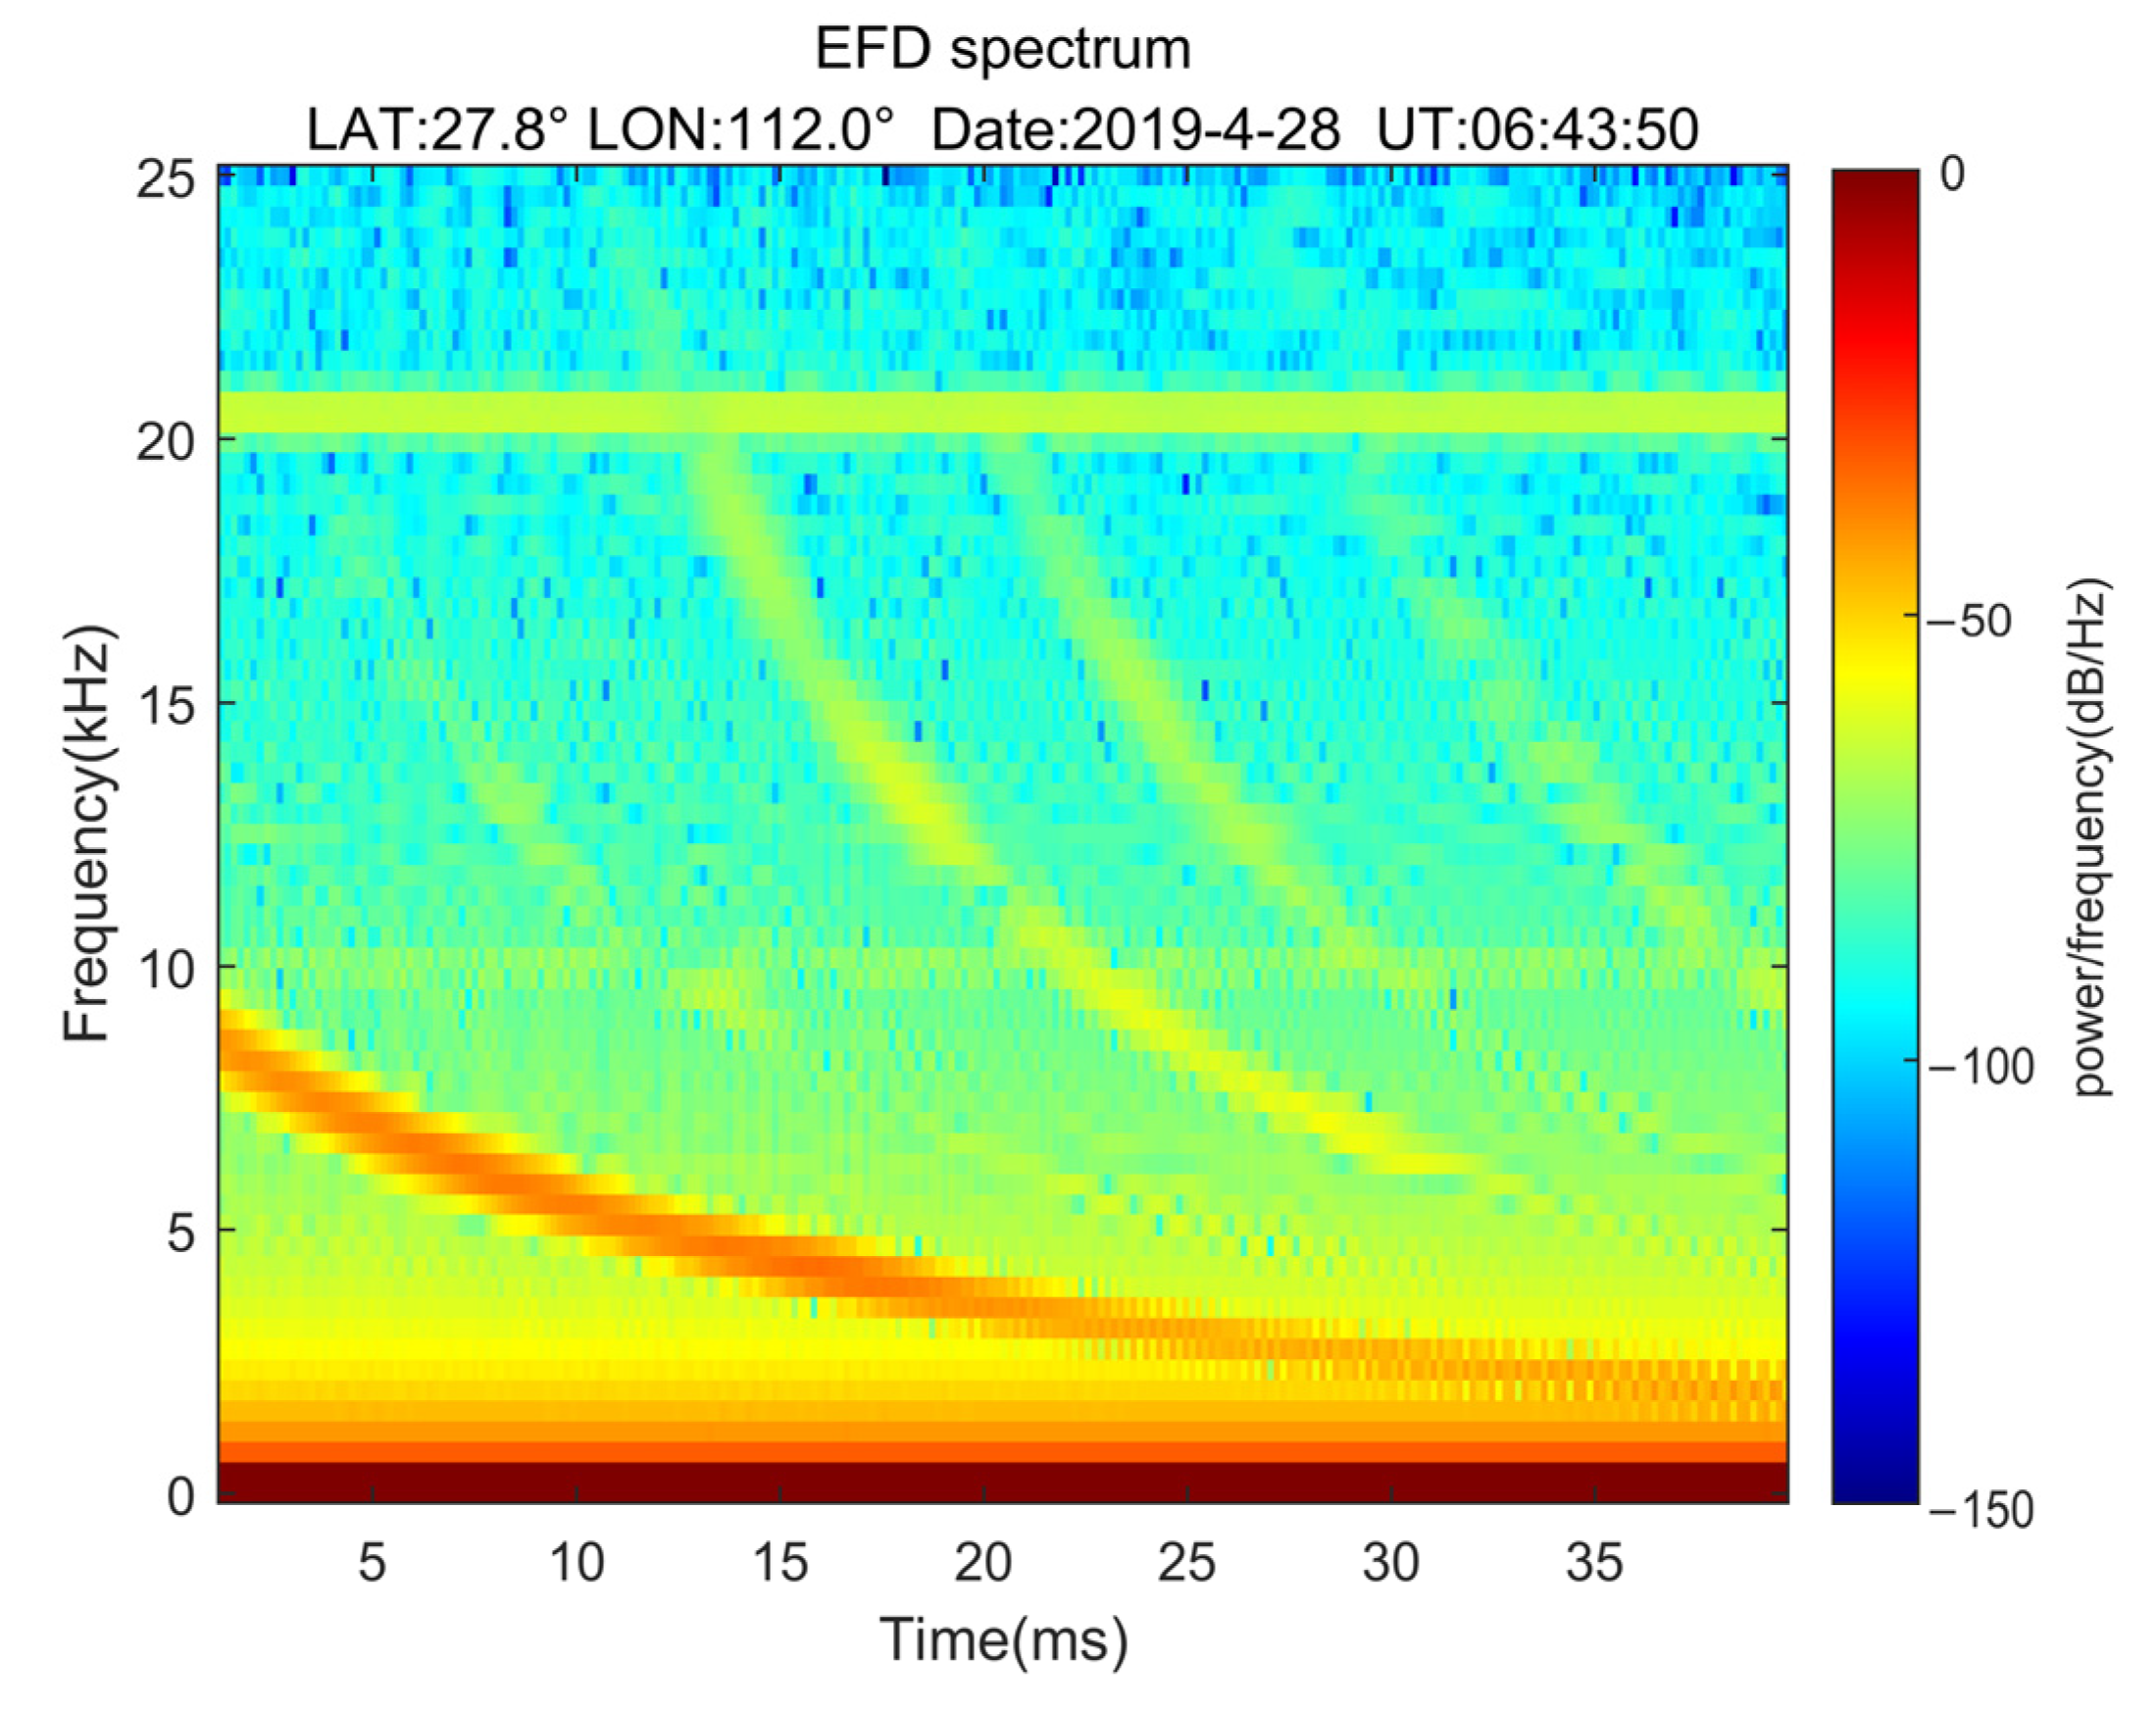
The VLF band electric-field Ex component waveform data were selected from a recording point of the EFD over Wuhan, China, on 28 April 2019. The selected waveform data included 2048 sampling points, with a sampling frequency of 50 kHz. Then, the 95% overlapped short-time Fourier transform was used on the waveform data (Figure 6) to obtain the time-frequency spectrum (Figure 7). The time-frequency spectrum exhibits an obvious dispersion pattern, and the frequency gradually decreases with time. Santolik et al. [30] pointed out that the form of lightning observed by the satellite is very similar to that recorded by the ground VLF observation stations, and both have dispersion characteristics. Therefore, the signal can be judged to be a lightning whistler.
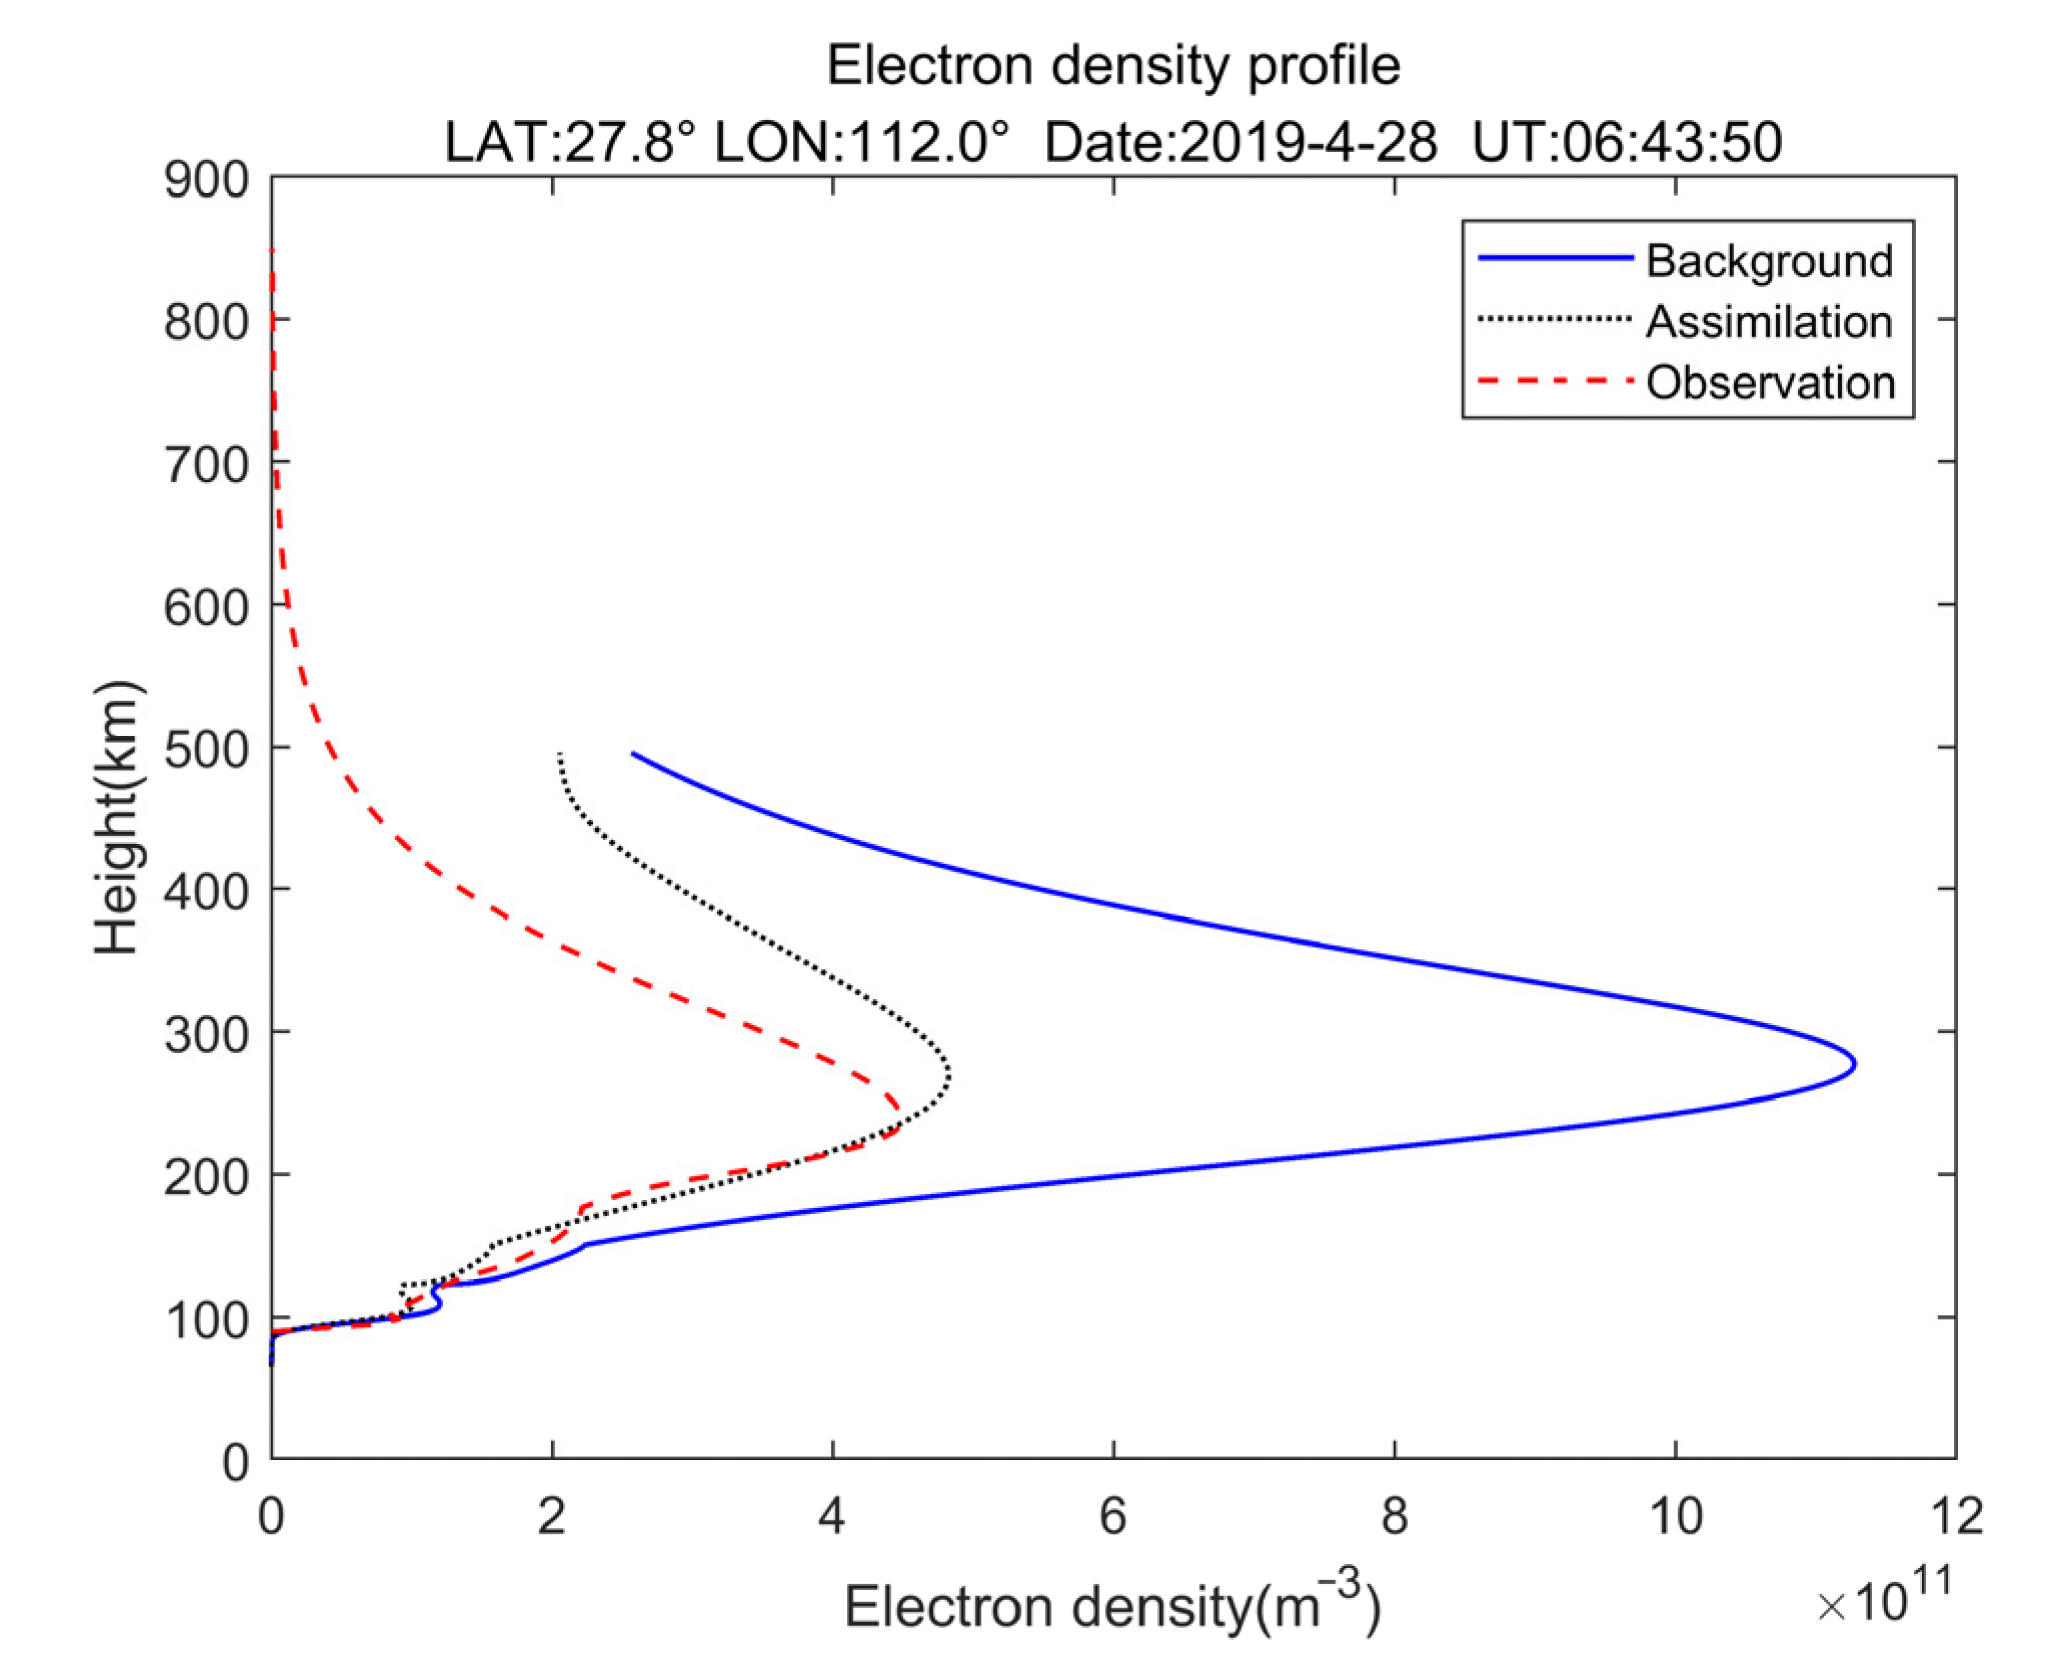
As described in Section 2, two time points t 1 and t 2 in the dispersion spectrum of the lightning whistler are selected at random, and the frequencies f 1 and f 2 corresponding to the maximum power spectral density at these two time points are determined; thus, the observed value is d = t 1 t 2 . The background value x b is calculated using the electron density from the IRI model. The Kalman filtering algorithm is used to assimilate d and x b to obtain the electron density analysis value. Figure 8 presents the electron density profile results, in which the blue solid line is from the IRI background model, and the black dotted line is the result of the assimilation.
The electron density profile data from the Wuhan Zuoling digisonde station of the Meridian Project at the time corresponding to the whistlers detected by the satellite on 28 April 2019 were selected as the true values, which were used to analyze the electron density error before and after the data assimilation. In Figure 8, the red dotted line is the true value observed by the digisonde.
To further verify the accuracy and stability of the data assimilation, the inversion accuracy of the electron density before and after the assimilation was evaluated. The mean absolute error and root mean square error of the electron density are defined as follows:
μ ( Δ N e ) = 1 N i = 1 N Δ N e i ,
σ ( Δ N e ) = 1 N i = 1 N ( Δ N e ( i ) Δ N e ¯ ) 2 ,
where Δ N e ¯ represents the mean value of Δ N e , and N represents the number of meshes.
It can be seen from Figure 8 that the electron density profile calculated using the IRI model is quite different from the real observations. The maximum electron density given by the model is approximately 1.1 × 10 12 m−3, while the maximum electron density observed is approximately 4.5 × 10 11  m−3, i.e., it is more than two times lower. The profile results after the assimilation show that the overall electron density is much smaller than the background model results and is in good agreement with the real observations. The validation results obtained using independent data sources demonstrate the effectiveness of the assimilation.
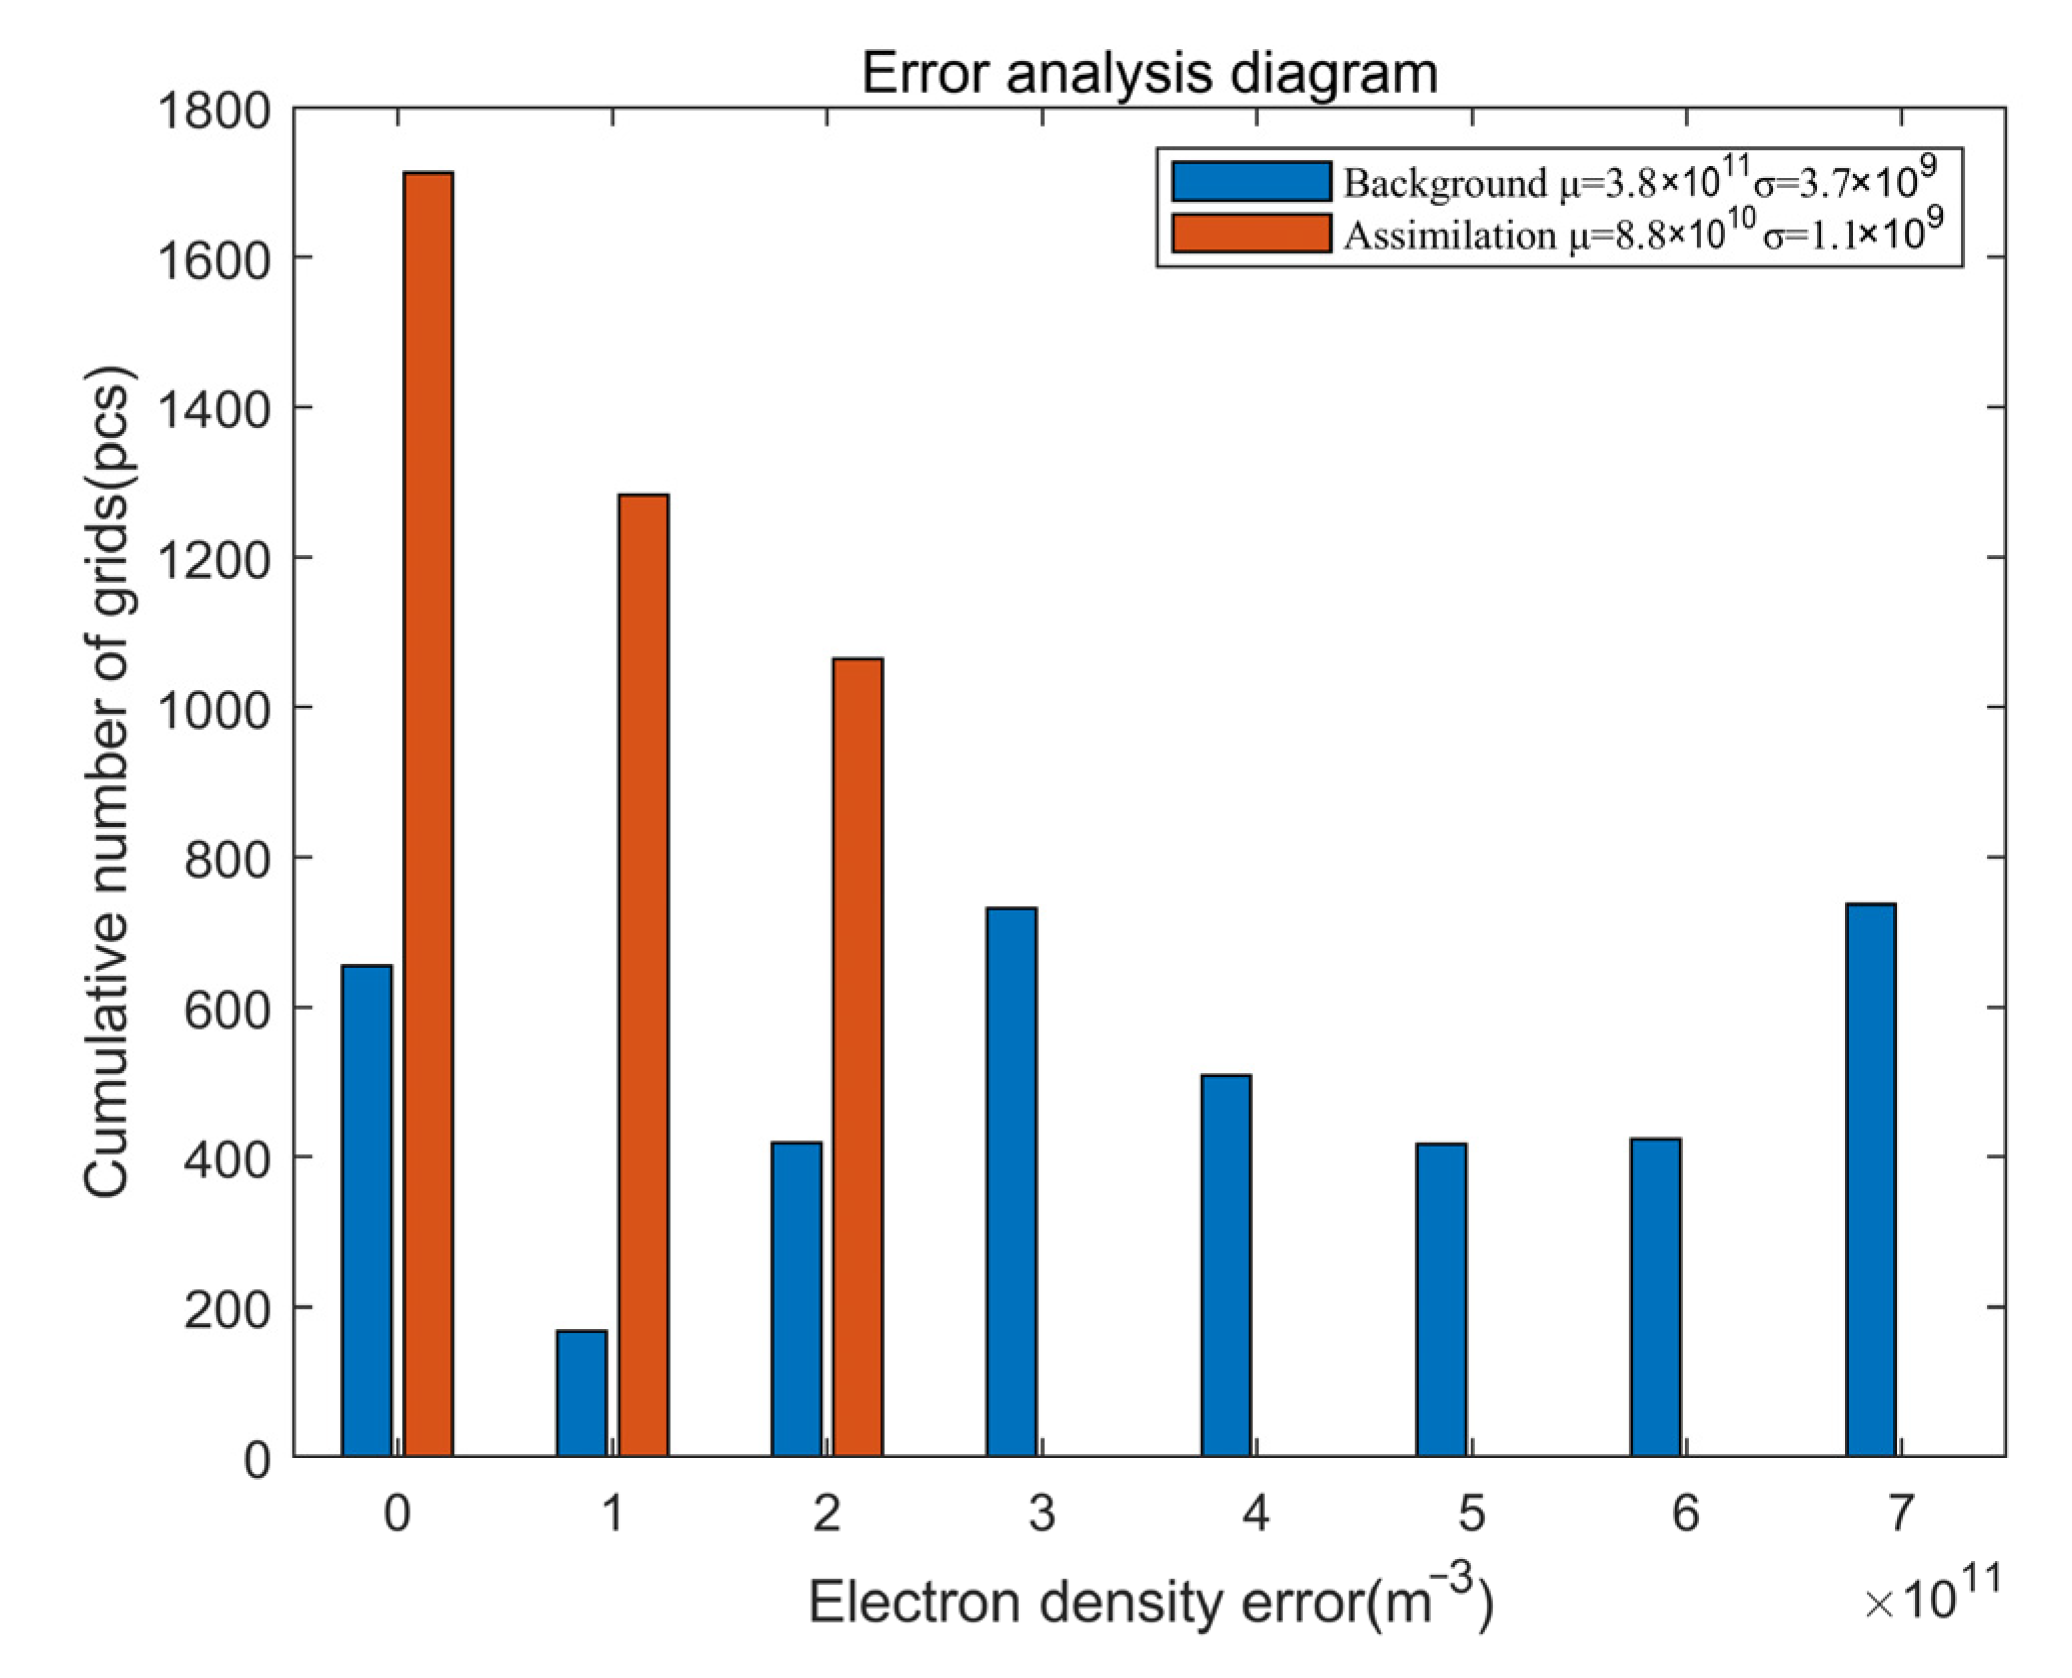
As can be seen from the error analysis histogram in Figure 9, the electron density error after assimilation is concentrated within a smaller error range compared with that before assimilation, which indicates that the electron density error after assimilation is reduced and that the assimilation effect is significant. The mean absolute error and root mean square error of the electron density calculated after assimilation are considerably lower than before the assimilation, indicating that the accuracy of the electron density improved significantly after assimilation.
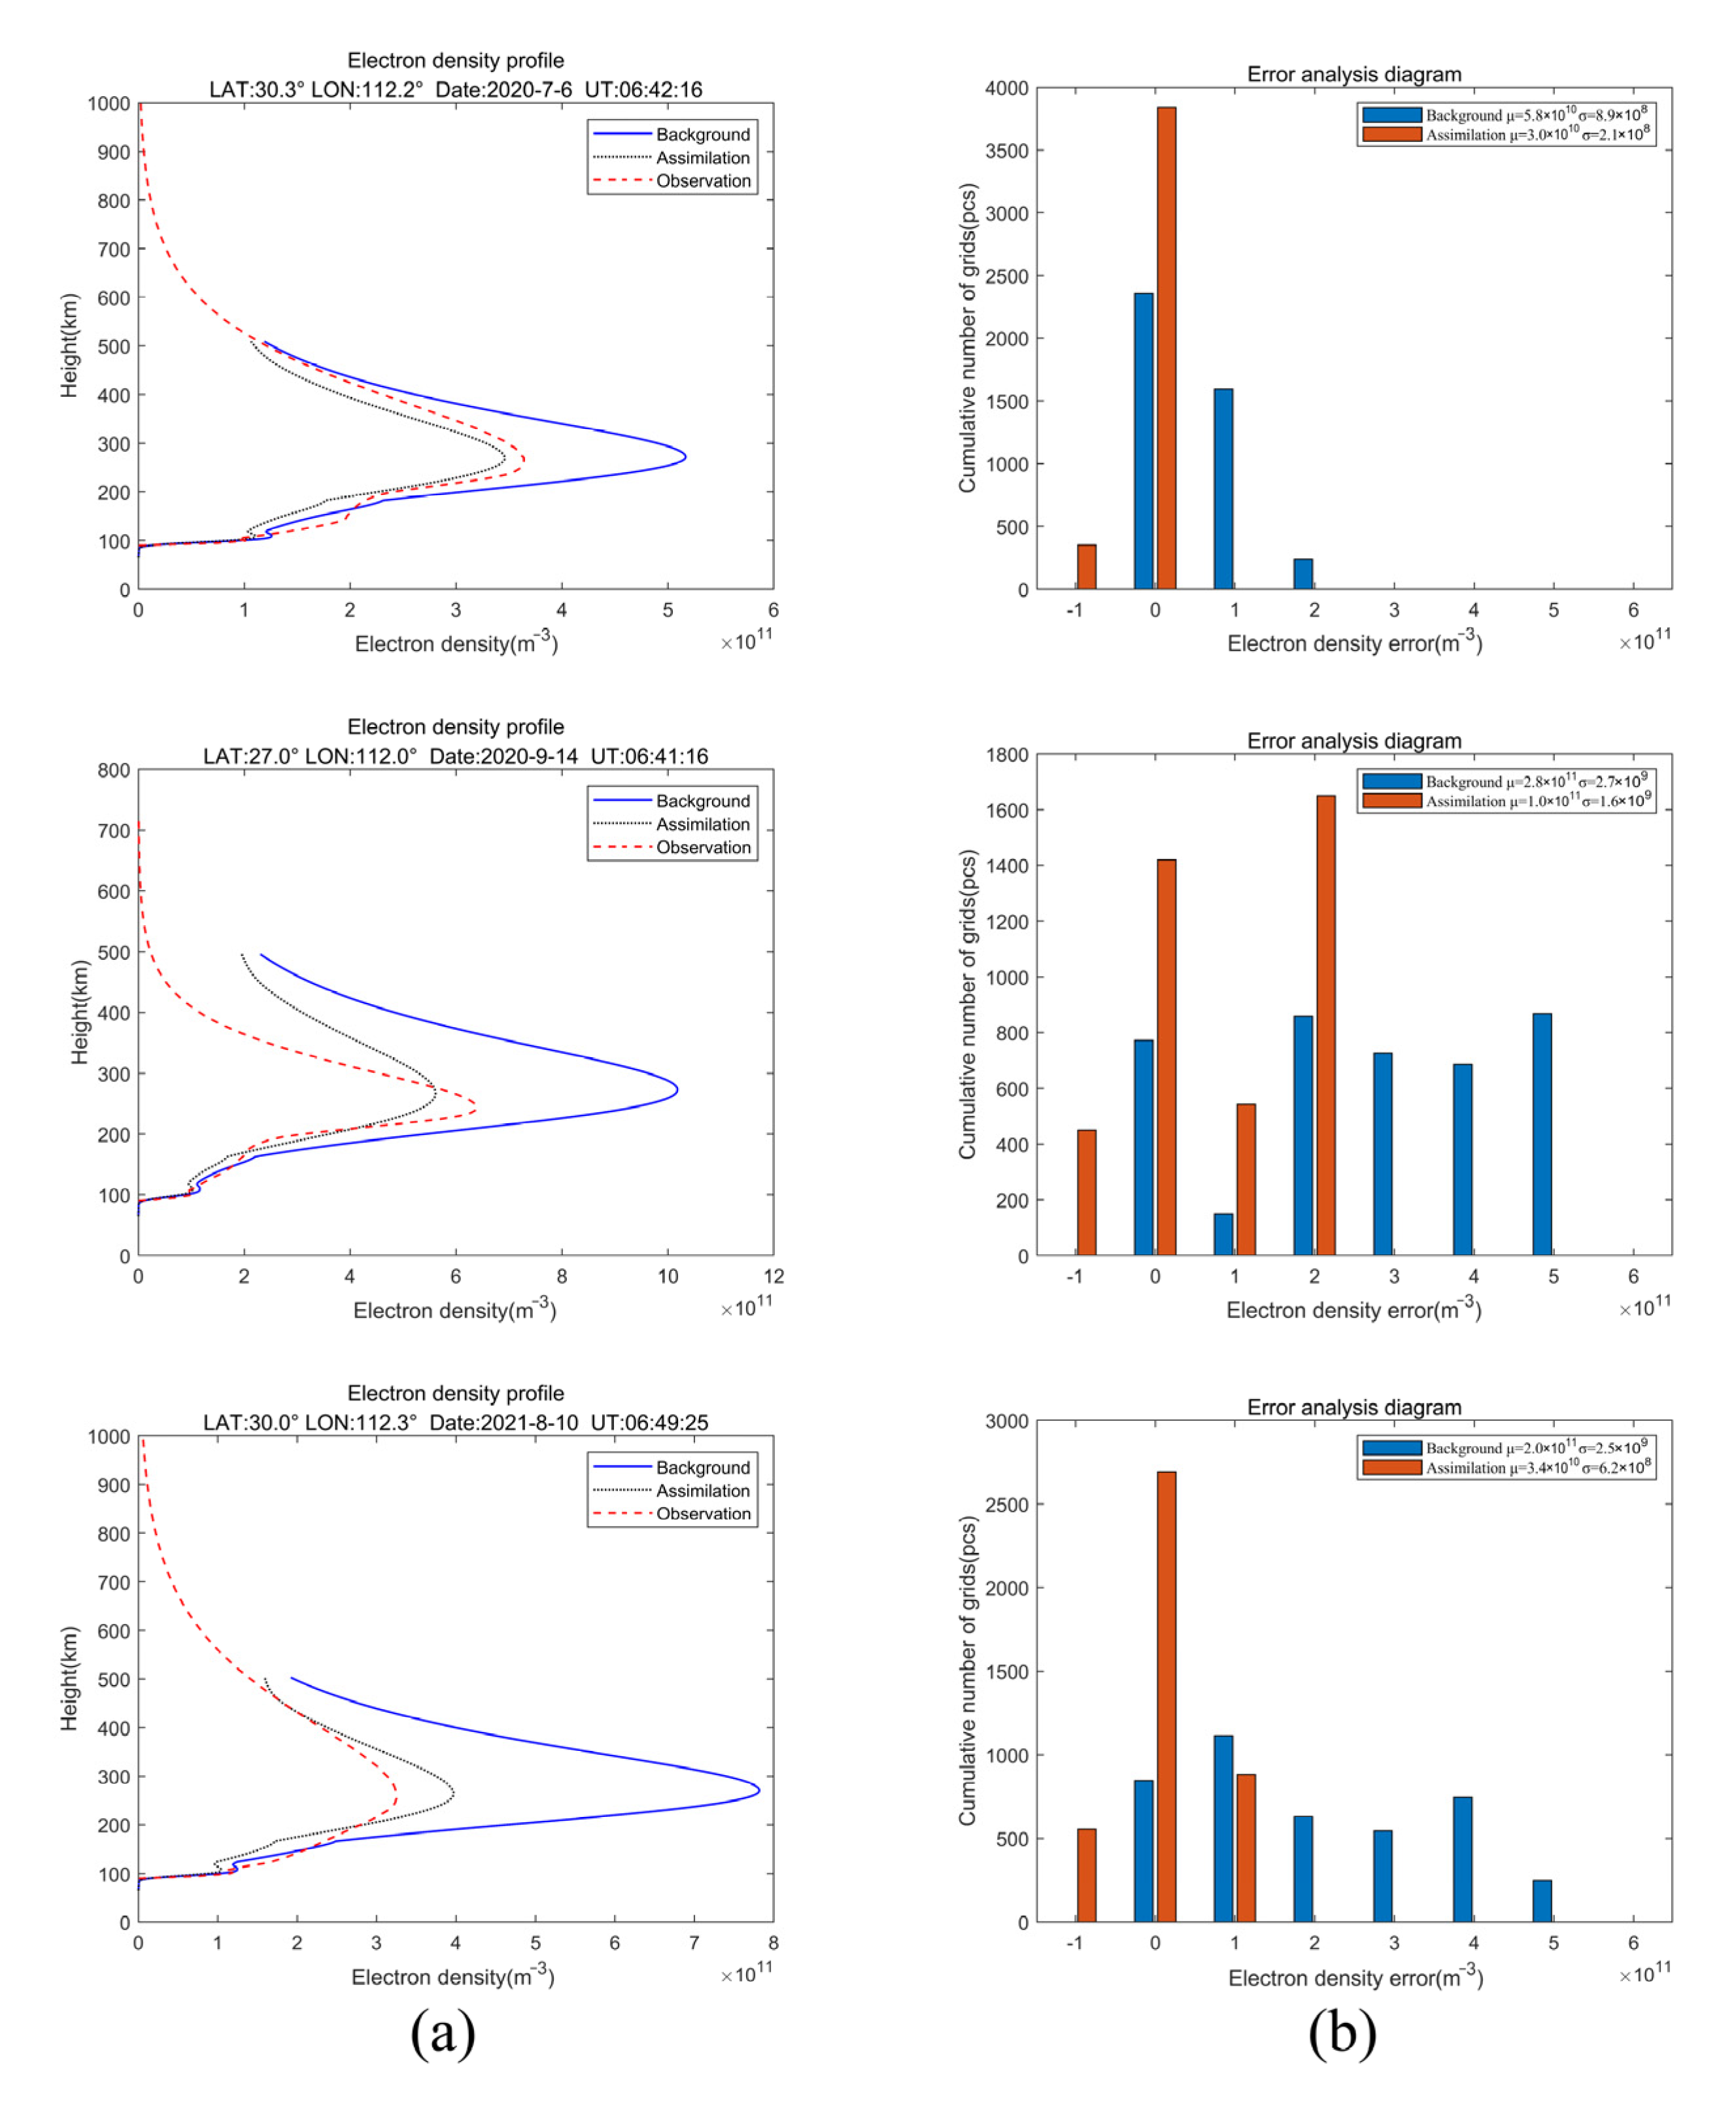
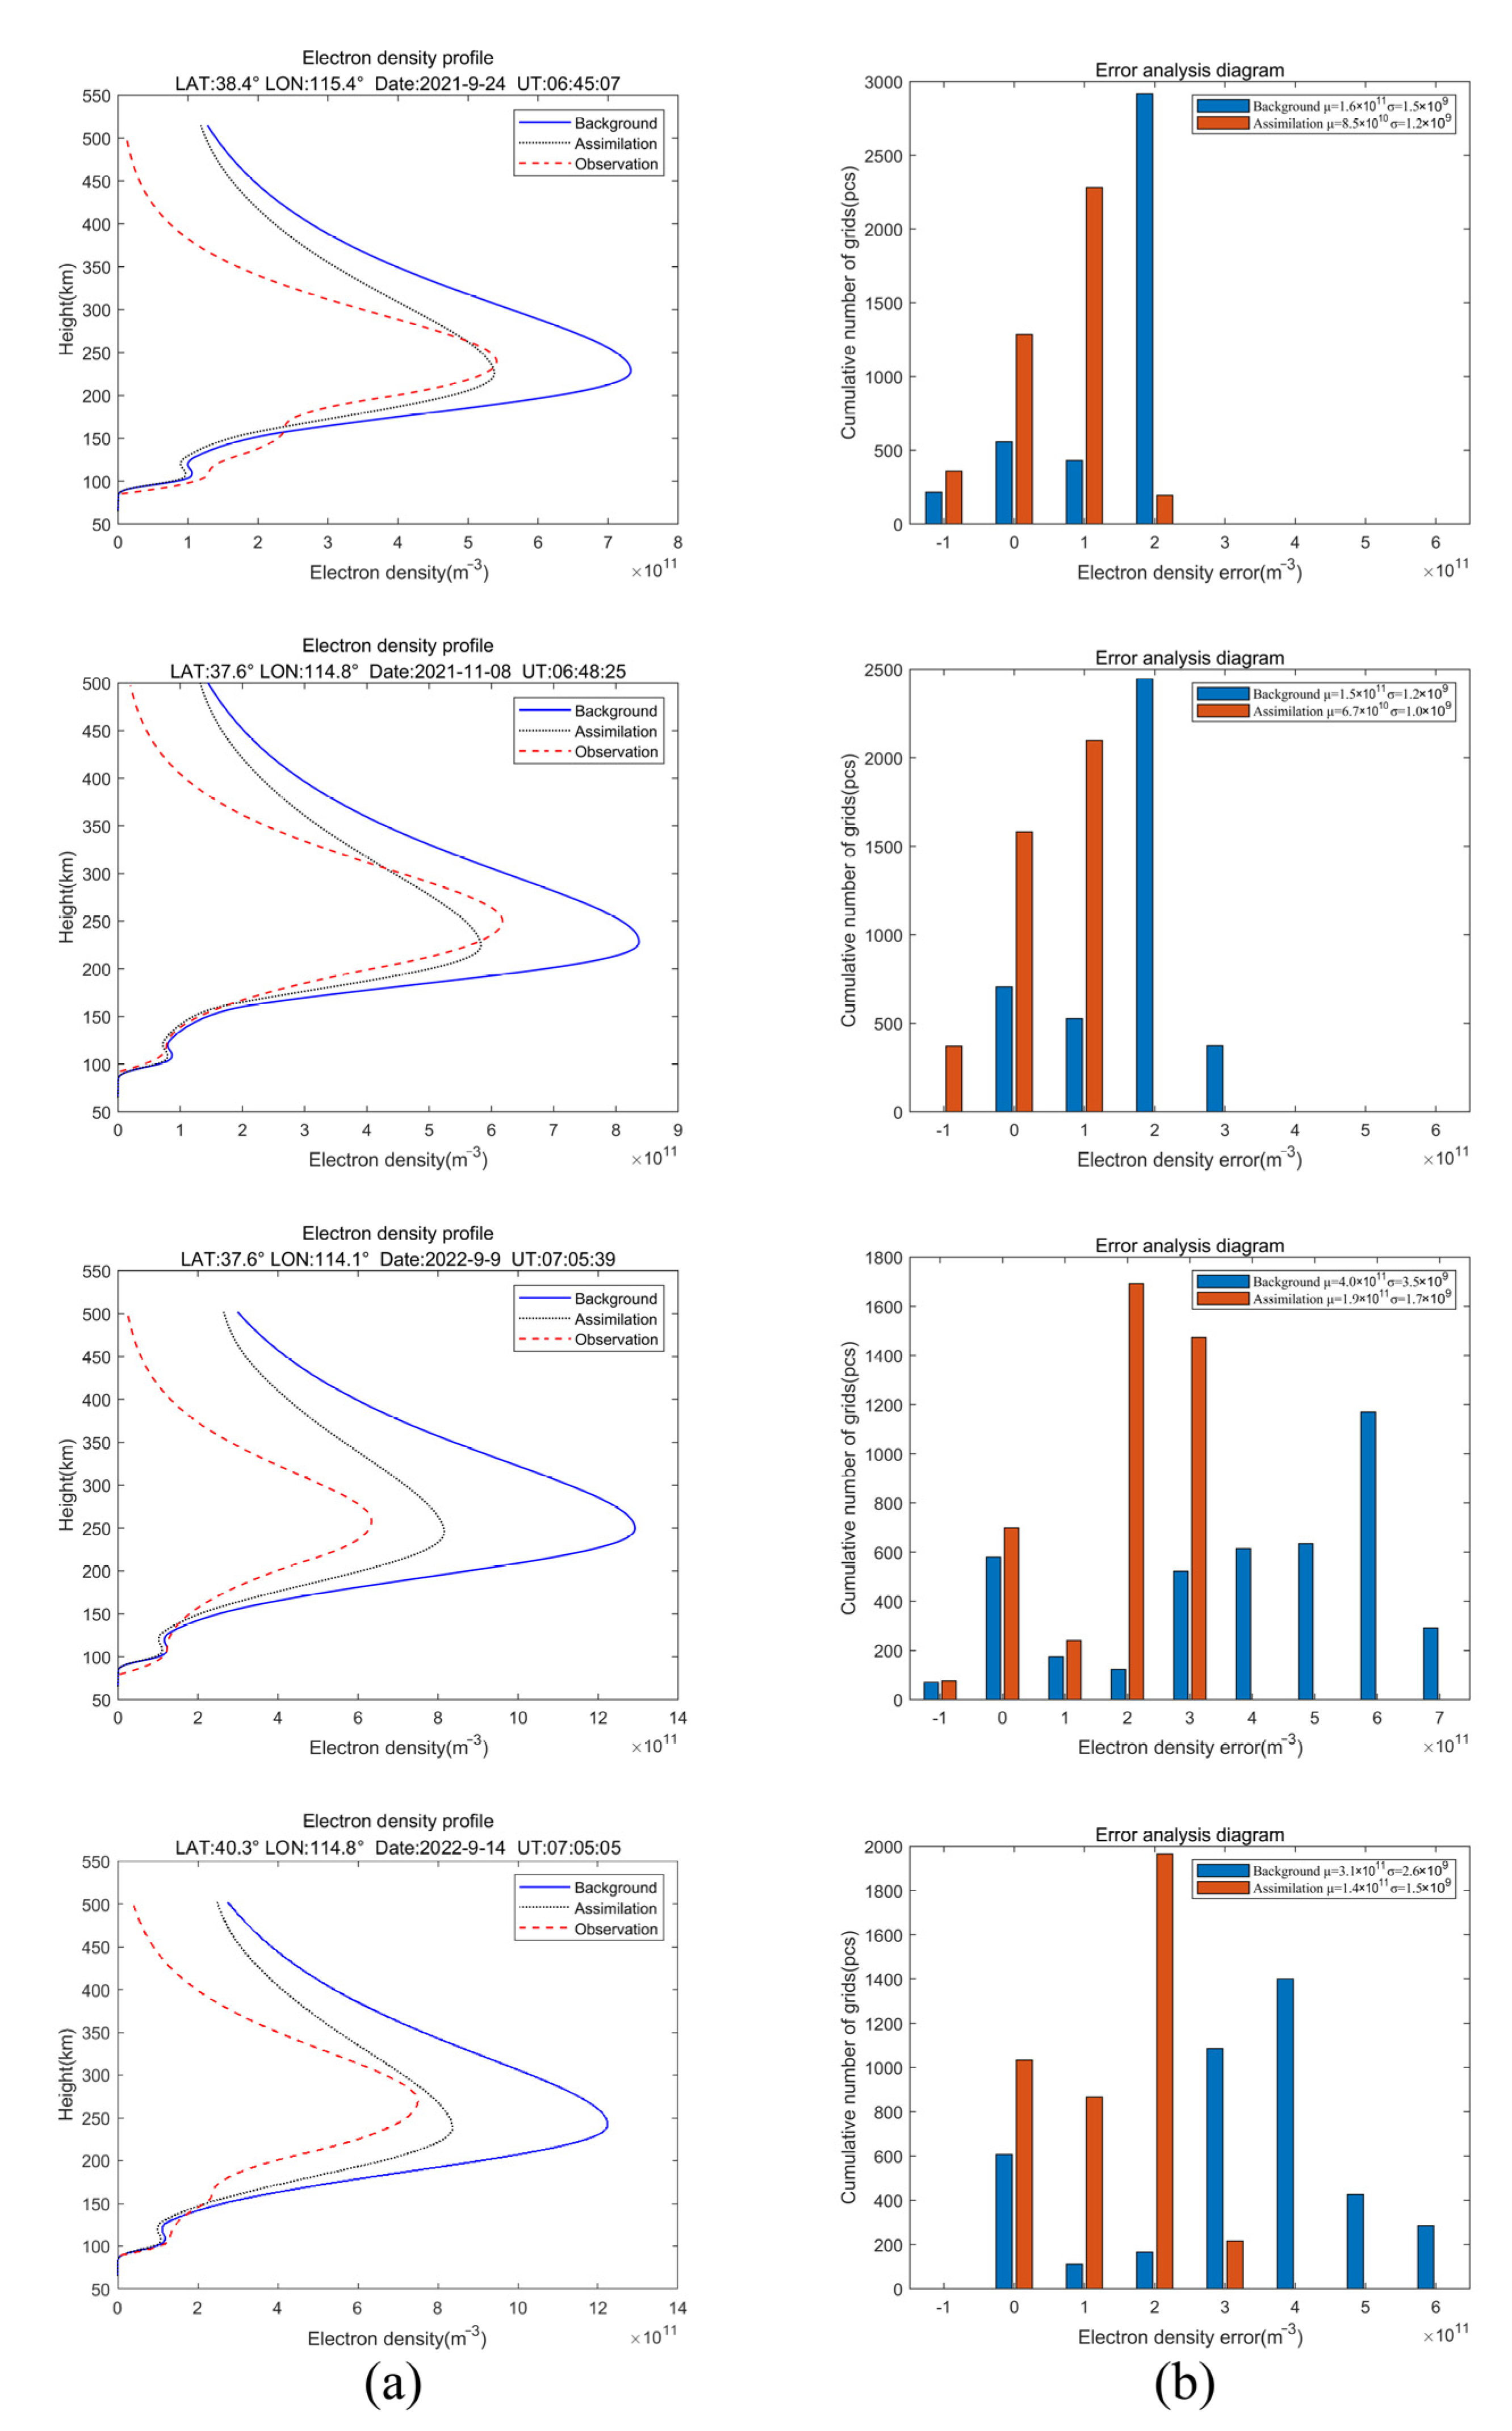
To further verify the effectiveness of the ionospheric data assimilation, we selected multiple sets of lightning whistler data over Wuhan and Beijing. The electron density observed by the Wuhan Zuoling and Beijing Changping digisonde stations of the Meridian Project was taken as the true value. The assimilation results are as follows:
Figure 10a and Figure 11a intuitively display the electron density profiles before and after the assimilation of multiple lightning whistler data over Wuhan and Beijing. It can be seen that the electron density value given by the IRI model has a large deviation from the value observed by the digisonde. After the data assimilation, the situation where the electron density value was too large was remarkably improved. After the assimilation inversion, the electron density is closer to the true value, which demonstrates that assimilating the integral electron density into the background model can effectively improve the accuracy of the background model.
Figure 10b and Figure 11b present the error distribution of the electron density before and after assimilation compared with the true value. Compared with the background model, the electron density errors after assimilation are concentrated within a smaller error interval, and the mean absolute error and root mean square error of the electron density are both reduced. This fully indicates that the electron density is closer to the true value after assimilation. The data assimilation effectively realizes the process of using the observed values to correct the background values.
Although the electron density at different heights after assimilation is well corrected, the height corresponding to the peak value of electron density is not corrected and is still the same as in the background model. This is because lightning whistlers directly supply time-frequency information rather than electron density profile information, which is derived from the background model.

5. Discussion

We determined the corresponding frequency according to the position with the maximum power spectral density at a specific time point. Therefore, the accuracy of the frequency selection will be affected where the electric-field intensity of lightning whistlers is weak, that is, where the SNR is low. An inaccurate frequency selection will have a negative impact on the assimilation results. Multiple dispersion spectra may overlap when several lightning bolts arrive simultaneously, and the accuracy of the frequency selection will also be affected. Most of the energy of lightning whistlers is concentrated in the range of 500–5500 Hz [43]. Based on extensive observations of lightning whistlers received by the ZH-1 satellite electric-field detector, we found that most of the energy of lightning whistlers received by the ZH-1 satellite is concentrated in the range of 1–10 kHz. In order to reduce the error of the frequency selection, we selected a non-overlapping dispersion spectrum of lightning whistlers, and then the time-frequency points were selected as the observed values in the range of 1~10 kH with a large electric-field intensity.
The frequency difference is the difference between the frequencies corresponding to two different frequency points in the dispersion spectrum of lightning whistlers. Since the selection of the frequency points in the dispersion spectrum of lightning whistlers is random in Section 4, in this section we discuss the influence of the frequency difference on the assimilation results. Taking the lightning whistler data collected over the Wuhan region on 28 April 2019 and over the Beijing region on 24 September 2021 as examples, multiple sets of frequency points with different frequency differences in the dispersion spectrum were selected for data assimilation, and the results were analyzed.
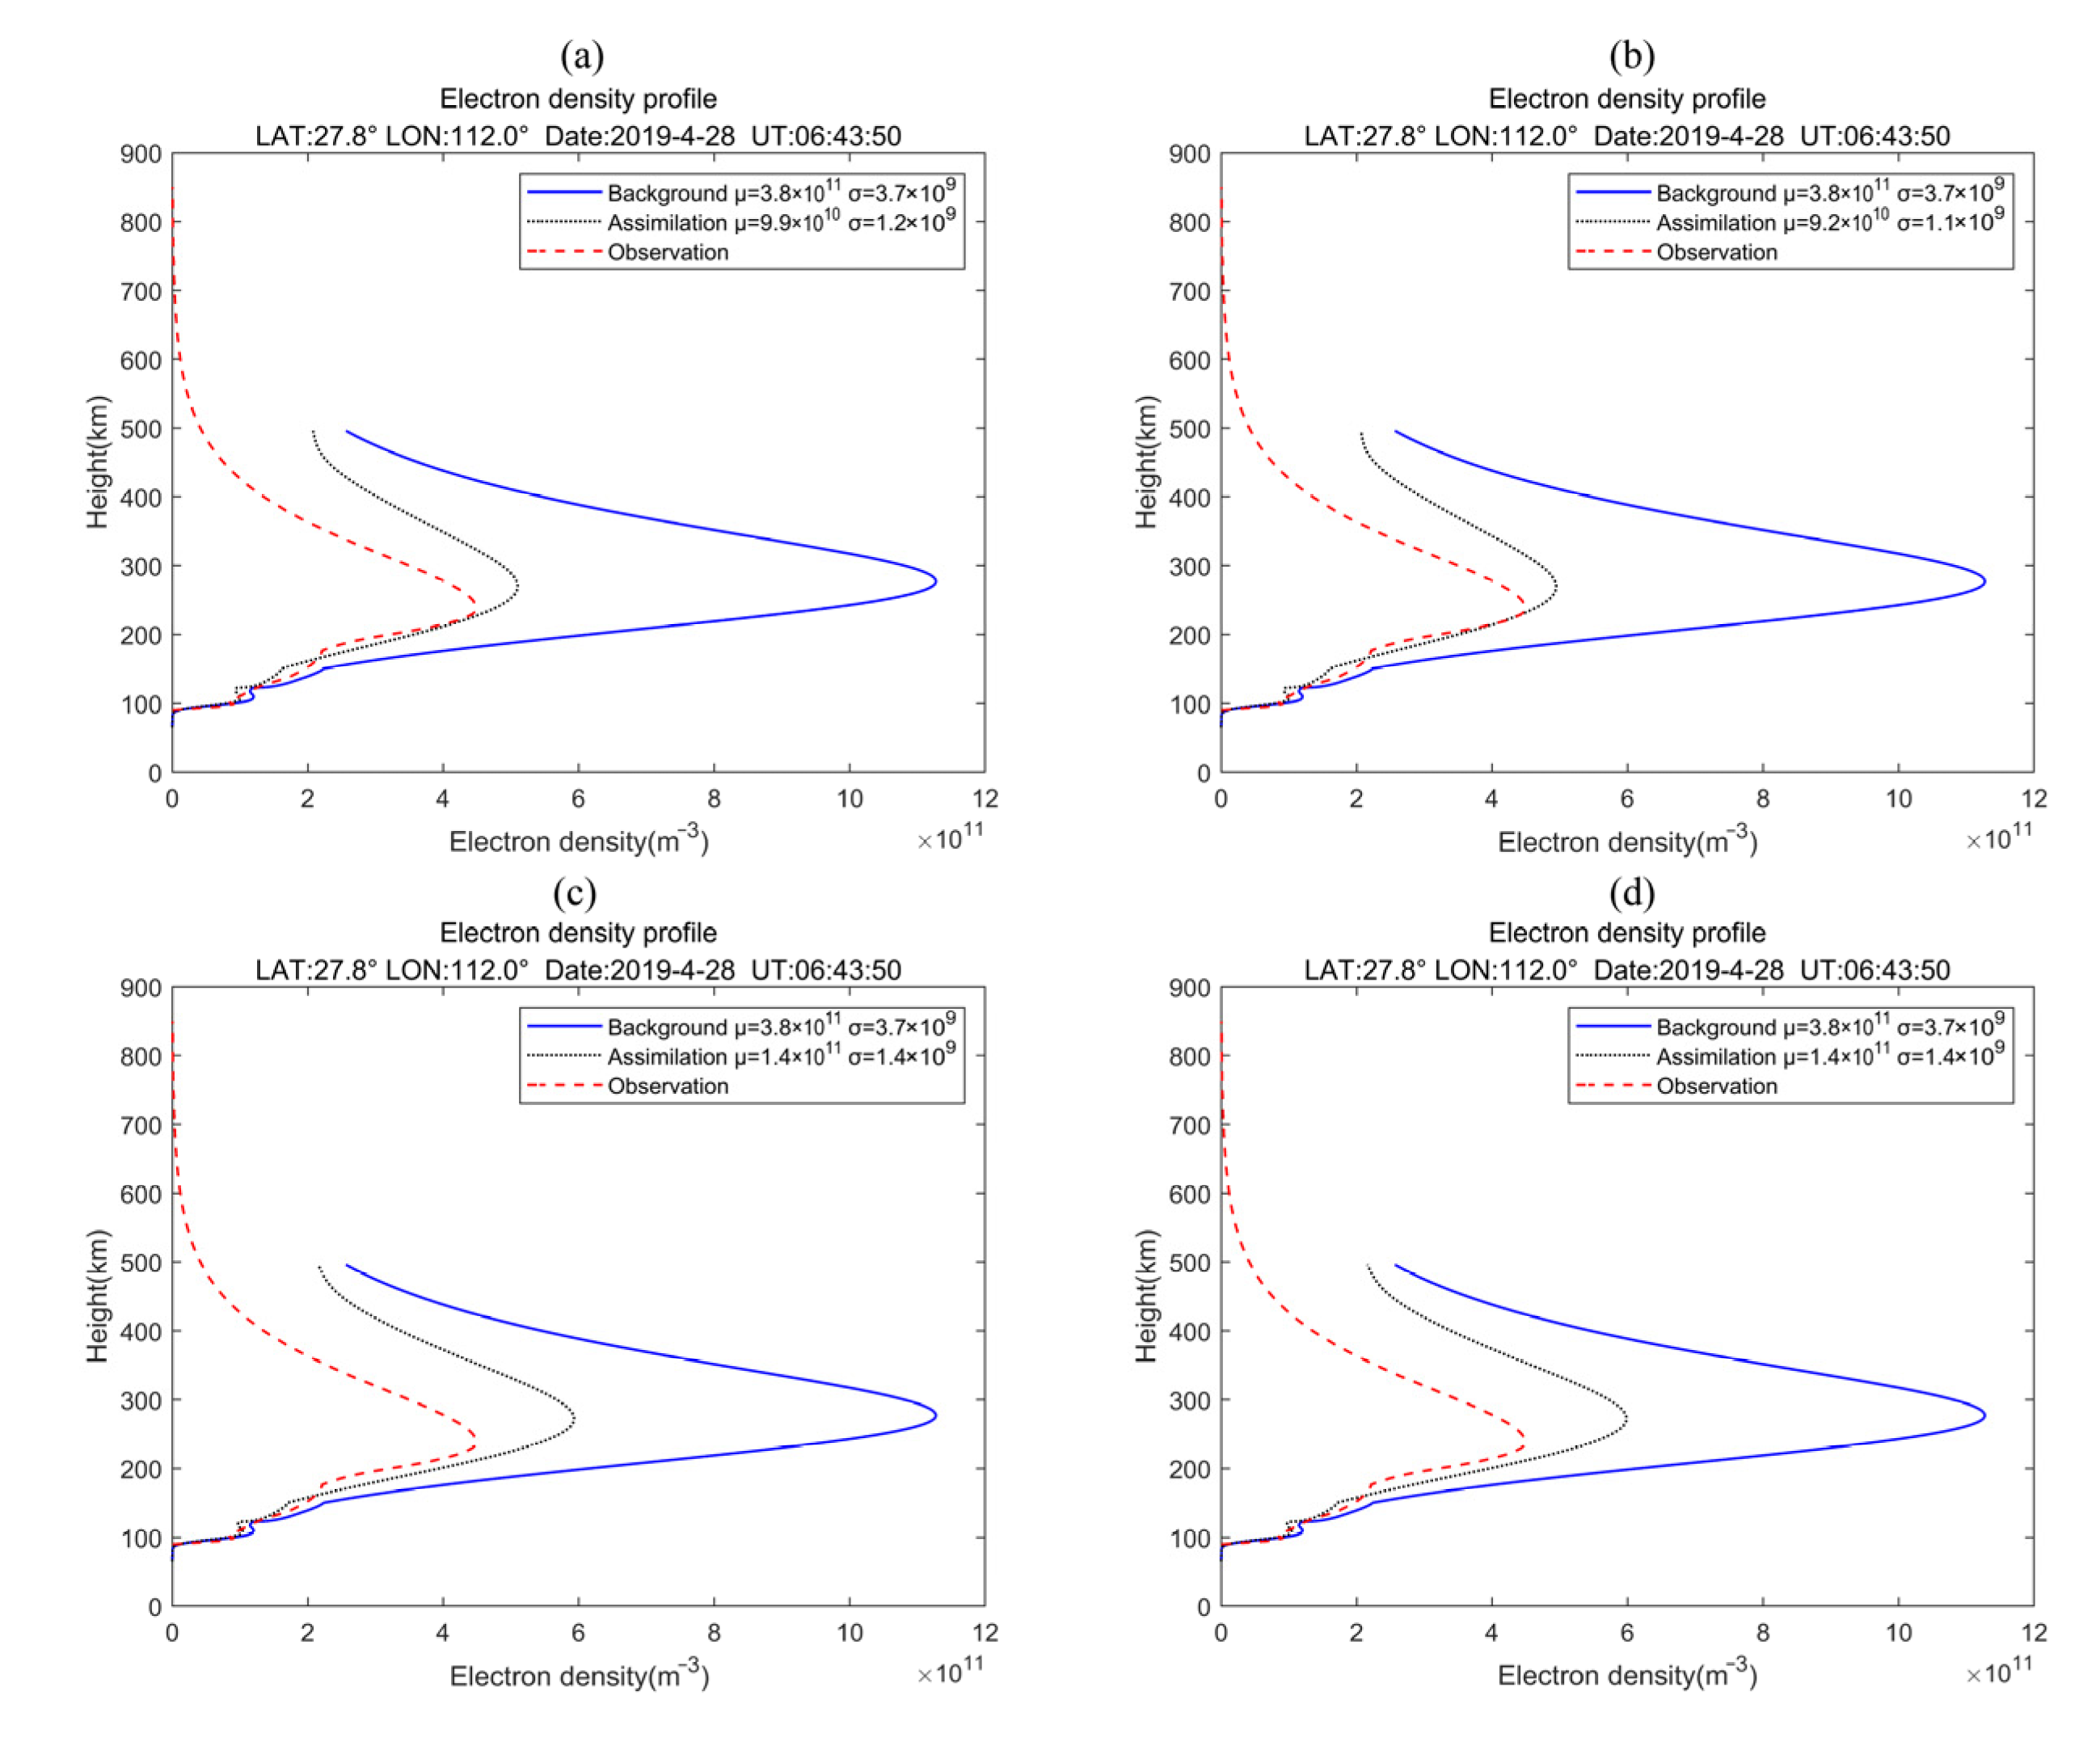
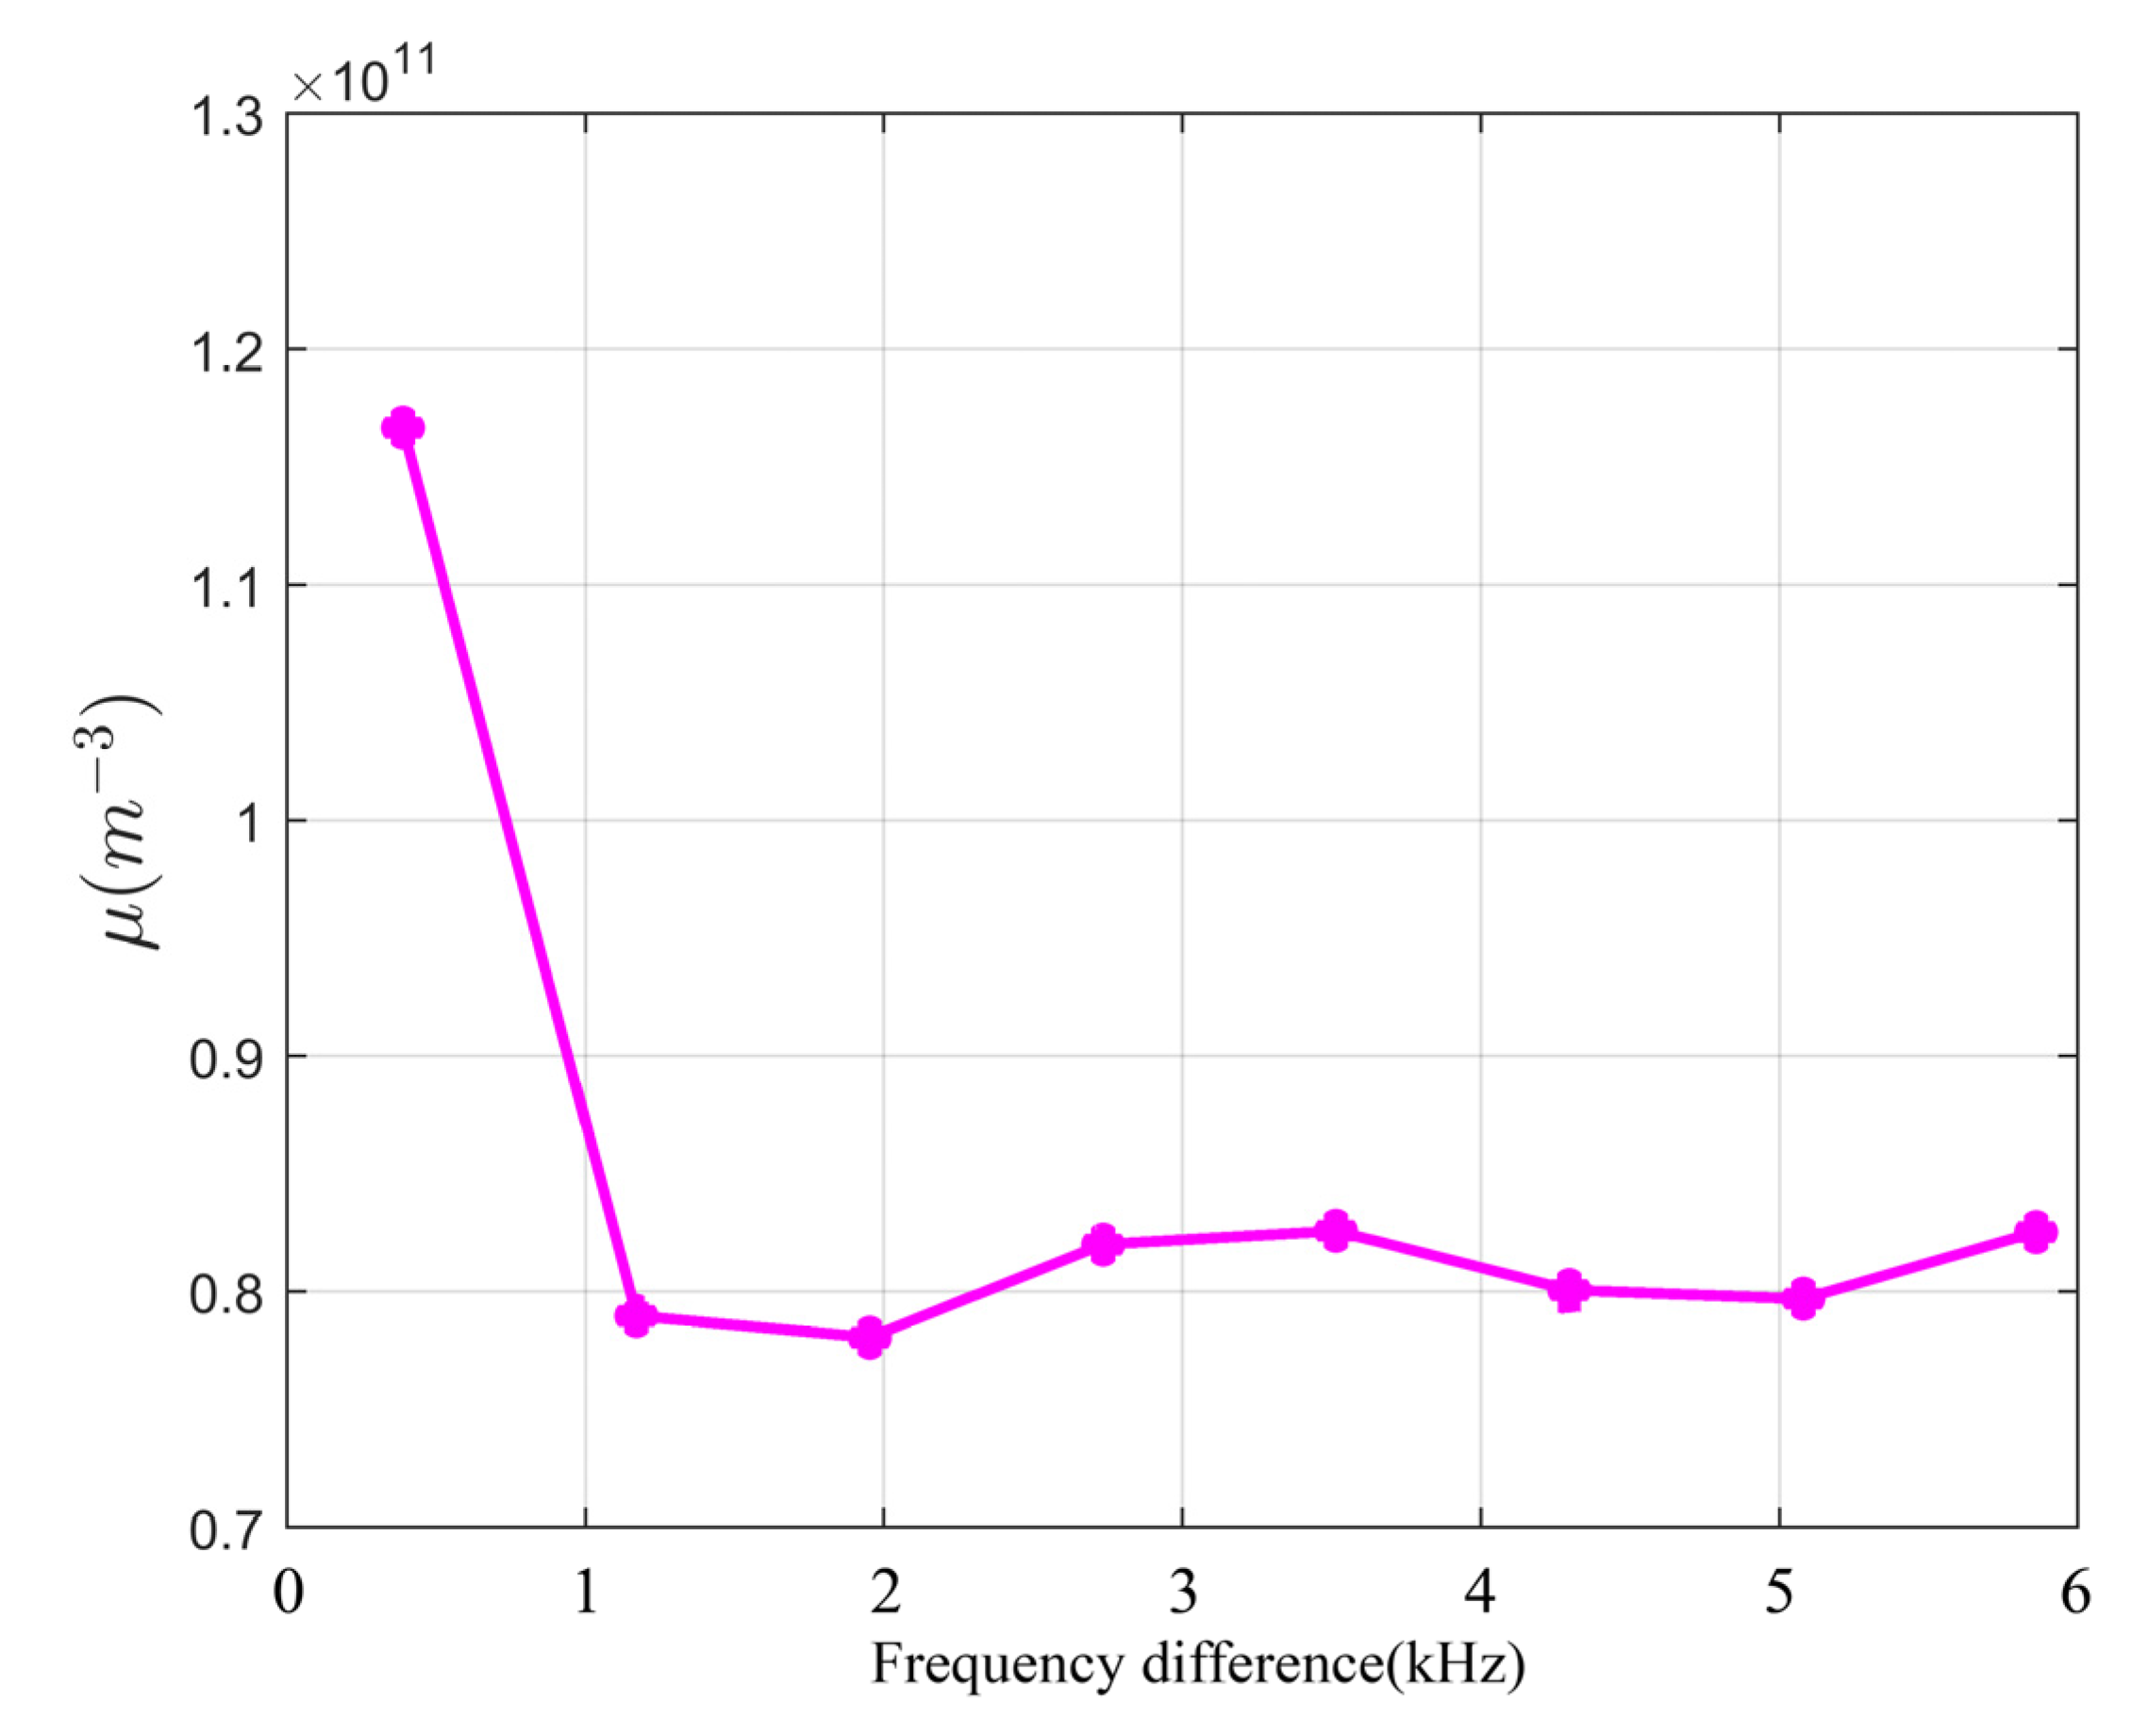
Four groups of frequency points were selected from the whistler dispersion spectrum recorded over Wuhan for data assimilation. The electron density profile results are shown in Figure 12. The four groups of frequency points selected are (8.6 kHz, 3.1 kHz), (7.4 kHz, 3.5 kHz), (5.9 kHz, 5.1 kHz), and (5.9 kHz, 5.5 kHz), with frequency differences of 5.5 kHz, 3.9 kHz, 0.8 kHz, and 0.4 kHz. To more intuitively display the relationship between the frequency difference and assimilation effect, more groups of different frequency points in the whistler dispersion spectrum over Wuhan were selected for data assimilation, and line statistical charts of the mean absolute error were drawn (Figure 13).
Similarly, four groups of frequency points were selected from the whistler dispersion spectrum recorded over Beijing for assimilation and inversion. The four groups of frequency points are (9.4 kHz, 3.9 kHz), (9.0 kHz, 6.2 kHz), (7.8 kHz, 7 kHz), and (7.8 kHz, 7.4 kHz), with frequency differences of 5.5 kHz, 2.8 kHz, 0.8 kHz, and 0.4 kHz, respectively, and the results are shown in Figure 14. Similarly, more groups of different frequency points in the whistler dispersion spectrum over Beijing were selected for data assimilation, and line statistical charts of the mean absolute error were drawn (Figure 15).
Figure 12 and Figure 14 show that when the frequency difference between the selected frequency points is greater than 1 kHz, the assimilation result is closer to the true value (digisonde observation), and the inversion effect is better. The assimilation result deviates significantly from the true value when the frequency difference between the selected frequency points is less than 1 kHz. Figure 13 and Figure 15 illustrate that the mean absolute error μ of the electron density is relatively large when the frequency difference is less than 1 kHz, and μ is relatively small when the frequency difference is greater than 1 kHz.
As a result, as we take the observed value from the time-frequency dispersion spectrum of lightning whistlers observed by satellite, we should try to select time-frequency points with large frequency differences and should avoid selecting time-frequency points with frequency differences of less than 1 kHz.

6. Conclusions

In this study, the time-frequency information in the dispersion spectrum of lightning whistlers received by the ZH-1 satellite was used as the observed value, and the IRI model was used as the background model to construct a calculation model of the propagation time delay of lightning whistlers in the ionosphere. The Kalman filtering algorithm was adopted to assimilate and invert the electron density distribution along the propagation path of lightning whistlers, and the electron density profile data from digisonde stations were taken as the true values for the effectiveness evaluation. The results show that the situation where the electron density value of the background model deviated greatly from the true value was significantly improved through data assimilation. The electron density after assimilation was in good agreement with the true value, and the electron density error after assimilation was reduced, which effectively helped realize the process of using observed values to correct the background value. On this basis, the influence of the frequency difference on the assimilation inversion effect was studied, and the results revealed that the assimilation effect was worse when the frequency difference between frequency points was less than 1 kHz.
The assimilation algorithm proposed in this study cannot correct for the height corresponding to the peak value of the electron density. This is because lightning whistlers directly supply time-frequency information rather than electron density profile information. Therefore, in future work, other observation data, such as digisonde, incoherent scattering radar, GNSS occultation, and other data with ionospheric profile information, can be added to the assimilation model, and the peak-height accuracy of the electron density can be effectively improved using the multi-source data assimilation method. In addition, based on the results of this study, the Gauss–Markov algorithm can be used to update the results to achieve the data prediction function.

Author Contributions

Conceptualization, T.X. and M.L.; data curation, T.X.; formal analysis, T.X.; funding acquisition, C.Z.; investigation, S.H.; methodology, T.X.; project administration, C.Z.; resources, M.L.; supervision, C.Z.; validation, T.X., M.L. and C.Z.; visualization, S.H.; writing—original draft, T.X.; writing—review and editing, T.X. All authors have read and agreed to the published version of the manuscript.

Funding

This research was funded by the Foundation of National Key Laboratory of Electromagnetic Environment, grant No. 6142403200303; the National Natural Science Foundation of China, grant No. 42104150; the Chinese Academy of Sciences, Key Laboratory of Geospace Environment, University of Science & Technology of China, grant No. GE2020-01; and the Fundamental Research Funds for the Central Universities, grant No. 2042021kf0020.

Data Availability Statement

The data from the ZH-1 satellite presented in this study are openly available at https://leos.ac.cn/#/home (accessed on 5 May 2022). The data from the digisonde stations of the Meridian Project presented in this study are openly available at https://data.meridianproject.ac.cn/ (accessed on 1 June 2022).

Acknowledgments

The authors gratefully acknowledge the Center for Space Information Research, National Institute of Natural Hazards, MEM, for providing the ZH-1 satellite data and gratefully acknowledge the Meridian Space Weather Monitoring Project for the digisonde data.

Conflicts of Interest

The authors declare no conflict of interest.

References

  1. Stanislawska, I.; Lastovicka, J.; Bourdillon, A.; Zolesi, B.; Cander, L.R. Monitoring and modeling of ionospheric characteristics in the framework of European COST 296 Action MIERS. Space Weather 2010, 8, S02001. [Google Scholar] [CrossRef] [Green Version]
  2. Yue, X.; Schreiner, W.S.; Lin, Y.C.; Rocken, C.; Kuo, Y.H.; Zhao, B. Data assimilation retrieval of electron density profiles from radio occultation measurements. J. Geophys. Res. 2011, 116, A03317. [Google Scholar] [CrossRef] [Green Version]
  3. Yue, X.; Schreiner, W.S.; Kuo, Y.-H.; Hunt, D.C.; Wang, W.; Solomon, S.C.; Burns, A.G.; Bilitza, D.; Liu, J.Y.; Wan, W.; et al. Global 3-D ionospheric electron density reanalysis based on multisource data assimilation. J. Geophys. Res. 2012, 117, A09325. [Google Scholar] [CrossRef] [Green Version]
  4. Qiao, J.; Zhou, C.; Liu, Y.; Zhao, J.; Zhao, Z. Ionospheric Kalman Filter Assimilation Based on Covariance Localization Technique. Remote Sens. 2022, 14, 4003. [Google Scholar] [CrossRef]
  5. Richmond, A.D.; Kamide, Y. Mapping electrodynamic features of the high-latitude ionosphere from localized observations—Technique. J. Geophys. Res. Space Phys. 1988, 93, 5741–5759. [Google Scholar] [CrossRef]
  6. Angling, M.J.; Cannon, P.S. Assimilation of radio occultation measurements into background ionospheric models. Radio Sci. 2004, 39, RS1S08. [Google Scholar] [CrossRef]
  7. Angling, M.J. First assimilations of COSMIC radio occultation data into the Electron Density Assimilative Model (EDAM). Ann. Geophys. 2008, 26, 353–359. [Google Scholar] [CrossRef] [Green Version]
  8. Bust, G.S.; Garner, T.W.; Gaussiran, T.L., II. Ionospheric Data Assimilation Three-Dimensional (IDA3D): A global, multisensor, electron density specification algorithm. J. Geophys. Res. 2004, 109, A11312. [Google Scholar] [CrossRef] [Green Version]
  9. Bust, G.S.; Crowley, G. Tracking of polar cap ionospheric patches using data assimilation. J. Geophys. Res. 2007, 112, A05307. [Google Scholar] [CrossRef] [Green Version]
  10. Bust, G.S.; Immel, T.J. IDA4D: Ionospheric Data Assimilation for the ICON Mission. Space Sci. Rev. 2020, 216, 33. [Google Scholar] [CrossRef] [Green Version]
  11. Aa, E.; Zhang, S.R.; Erickson, P.J.; Wang, W.; Coster, A.J.; Rideout, W. 3-D regional ionosphere imaging and SED reconstruction with a new TEC-based ionospheric data assimilation system (TIDAS). Space Weather 2022, 20, e2022SW00305. [Google Scholar] [CrossRef]
  12. Wang, C.; Hajj, G.; Pi, X.; Rosen, I.G.; Wilson, B. Development of the Global Assimilative Ionospheric Model. Radio Sci. 2004, 39, RS1S06. [Google Scholar] [CrossRef]
  13. Schunk, R.W.; Scherliess, L.; Sojka, J.J.; Thompson, D.C.; Anderson, D.N.; Codrescu, M.; Minter, C.; Fuller-Rowell, T.J.; Heelis, R.; Hairston, M.; et al. Global Assimilation of Ionospheric Measurements (GAIM). Radio Sci. 2004, 39, RS1S02. [Google Scholar] [CrossRef]
  14. Scherliess, L.; Schunk, R.W.; Sojka, J.J.; Thompson, D.C.; Zhu, L. Utah State University Global Assimilation of Ionospheric Measurements Gauss-Markov Kalman filter model of the ionosphere: Model description and validation. J. Geophys. Res. 2006, 111, A11315. [Google Scholar] [CrossRef] [Green Version]
  15. Helliwell, B. Whistlers and related ionospheric phenomena. Am. J. Phys. 1966, 34, 81. [Google Scholar] [CrossRef]
  16. Bernstein, S.; Burrows, M.; Evans, J.; Griffiths, A.; McNeill, D.; Niessen, C.; Richer, I.; White, D.; Willim, D. Long-Range Communications at Extremely Low Frequencies. Proc. IEEE 1974, 62, 292–312. [Google Scholar] [CrossRef]
  17. Crouchley, J. A Study of Whistling Atmospherics. V. Dispersion. Aust. J. Phys. 1964, 17, 88. [Google Scholar] [CrossRef] [Green Version]
  18. Carpenter, D.L. Remote sensing of the magnetospheric plasma by means of whistler mode signals. Rev. Geophys. 1988, 26, 535–549. [Google Scholar] [CrossRef]
  19. Menietti, J.D.; Gurnett, D.A. Whistler propagation in jovian magnetoshere. Geophys. Res. Lett. 1980, 7, 49–52. [Google Scholar] [CrossRef]
  20. Daniell, G.J. Approximate dispersion formulae for whistlers. J. Atmos. Terr. Phys. 1986, 48, 267–270. [Google Scholar] [CrossRef]
  21. Chen, Y.; Yang, G.; Ni, B.; Zhao, Z.; Gu, X.; Zhou, C.; Wang, F. Development of ground-based ELF/VLF receiver system in Wuhan and its first results. Adv. Space Res. 2016, 57, 1871–1880. [Google Scholar] [CrossRef]
  22. Cohen, M.B.; Inan, U.S.; Paschal, E.W. Sensitive Broadband ELF/VLF Radio Reception with the AWESOME Instrument. IEEE Trans. Geosci. Remote Sens. 2009, 48, 3–17. [Google Scholar] [CrossRef]
  23. Farges, T.; Blanc, E. Lightning and TLE electric fields and their impact on the ionosphere. Comptes Rendus Phys. 2011, 12, 171–179. [Google Scholar] [CrossRef]
  24. Dharma, K.S.; Bayupati, I.; Buana, P.W. Automatic lightning whistler detection using connected component labeling method. J. Theor. Appl. Inf. Technol. 2014, 66, 638–645. Available online: http://www.jatit.org/volumes/Vol66No2/34Vol66No2.pdf (accessed on 1 October 2022).
  25. Ali Ahmad, U.; Kasahara, Y.; Matsuda, S.; Ozaki, M.; Goto, Y. Automatic Detection of Lightning Whistlers Observed by the Plasma Wave Experiment Onboard the Arase Satellite Using the OpenCV Library. Remote Sens. 2019, 11, 1785. [Google Scholar] [CrossRef] [Green Version]
  26. Konan, O.; Mishra, A.K.; Lotz, S. Machine Learning Techniques to Detect and Characterise Whistler Radio Waves. arXiv 2020, arXiv:2002.01244. [Google Scholar]
  27. Bayupati, I.P.A.; Kasahara, Y.; Goto, Y. Study of Dispersion of Lightning Whistlers Observed by Akebono Satellite in the Earth’s Plasmasphere. IEICE Trans. Commun. 2012, 95, 3472–3479. [Google Scholar] [CrossRef] [Green Version]
  28. Oike, Y.; Kasahara, Y.; Goto, Y. Spatial distribution and temporal variations of occurrence frequency of lightning whistlers observed by VLF/WBA onboard Akebono. Radio Sci. 2014, 49, 753–764. [Google Scholar] [CrossRef]
  29. Záhlava, J.; Němec, F.; Santolík, O.; Kolmašova, I.; Hospodarskyy, G.B.; Parrot, M.; Kurth, W.S.; Bortnik, J.; Kletzing, C. Longitudinal dependence of whistler mode electromagnetic waves in the Earth’s inner magnetosphere. J. Geophys. Res. Space Phys. 2018, 123, 6562–6575. [Google Scholar] [CrossRef] [Green Version]
  30. Santolik, O.; Parrot, M.; Inan, U.S.; Buresova, D.; Gurnett, D.A.; Chum, J. Propagation of unducted whistlersfrom their source lightning: A case study. J. Geophys. Res. 2009, 114, A03212. [Google Scholar] [CrossRef]
  31. Putri, D.P.S.; Kasahara, Y.; Ota, M.; Matsuda, S.; Tsuchiya, F.; Kumamoto, A.; Matsuoka, A.; Miyoshi, Y. A Proposal for Modification of Plasmaspheric Electron Density Profiles Using Characteristics of Lightning Whistlers. Remote Sens. 2023, 15, 1306. [Google Scholar] [CrossRef]
  32. Coïsson, P.; Hulot, G.; Vigneron, P.; Deram, P.; Léger, J.M.; Jager, T. 0+ whistlers in the ELF band recorded by Swarm satellites used to reconstruct the ionosphere below the satellite height. In Geophysical Research Abstracts; EGU General Assembly: Vienna, Austria, 2019; Volume 21. [Google Scholar]
  33. Huang, J.; Shen, X.; Zhang, X.; Lu, H.; Tan, Q.; Wang, Q.; Yan, R.; Chu, W.; Yang, Y.; Liu, D.; et al. Application system and data description of the China Seismo-Electromagnetic Satellite. Earth Planet. Phys. 2018, 2, 444–454. [Google Scholar] [CrossRef]
  34. Huang, J.; Lei, J.; Li, S.; Zeren, Z.; Li, C.; Zhu, X.; Yu, W. The Electric Field Detector (EFD) onboard the ZH-1 satellite and first observational results. Earth Planet. Phys. 2018, 2, 469–478. [Google Scholar] [CrossRef]
  35. Zhima, Z.; Huang, J.; Shen, X.; Xia, Z.; Chen, L.; Piersanti, M.; Yang, Y.; Wang, Q.; Zeng, L.; Lei, J.; et al. Simultaneous observations of ELF/VLF rising-tone quasiperiodic waves and energetic electron precipitations in the high-latitude upper ionosphere. J. Geophys. Res. Space Phys. 2020, 125, e2019JA027574. [Google Scholar] [CrossRef]
  36. Bilitza, D. International Reference Ionosphere 2000. Radio Sci. 2016, 36, 261–275. [Google Scholar] [CrossRef] [Green Version]
  37. Kalman, R.E. A New Approach to Linear Filtering and Prediction Problems. J. Basic Eng. 1960, 82D, 35–45. [Google Scholar] [CrossRef] [Green Version]
  38. Lefeuvre, F.; Marshall, R.; Pinc, J.L.; Inan, U.S.; Lagoutte, D.; Parrot, M.; Berthelier, J.J. On remote sensing oftransient luminous events’ parent lightning discharges by ELF/VLF wave measurements on board a satellite. J. Geophys. Res. 2009, 114, A09303. [Google Scholar] [CrossRef] [Green Version]
  39. Kang, N.; Bortnik, J. Structure of energy precipitation induced by superbolt-lightning generated whistler waves. Geophys. Res. Lett. 2022, 49, e2022GL097770. [Google Scholar] [CrossRef]
  40. Booker, H.G. The magneto-ionic theory and its application to the ionosphere: J. A. RATCLIFFE: Cambridge University Press, 1959. x + 206pp., 40s. J. Atmos. Terr. Phys. 1959, 16, 398. [Google Scholar] [CrossRef]
  41. Belrose, J.S.; Burke, M.J. Study of the Lower Ionosphere using Partial Reflection: 1. Experimental Technique and Method of Analysis. J. Geophys. Res. 1964, 69, 2799–2818. [Google Scholar] [CrossRef]
  42. Kane, J. Re-evaluation of ionospheric electron densities and collision frequencies derived from rocket measurements of refractive index and attenuation. J. Atmos. Terr. Phy. 1961, 23, 338–347. [Google Scholar] [CrossRef]
  43. Fišer, J.; Chum, J.; Diendorfer, G.; Parrot, M.; Santolik, O. Whistler intensities above thunderstorms. Ann. Geophys. 2010, 28, 37–46. [Google Scholar] [CrossRef] [Green Version]
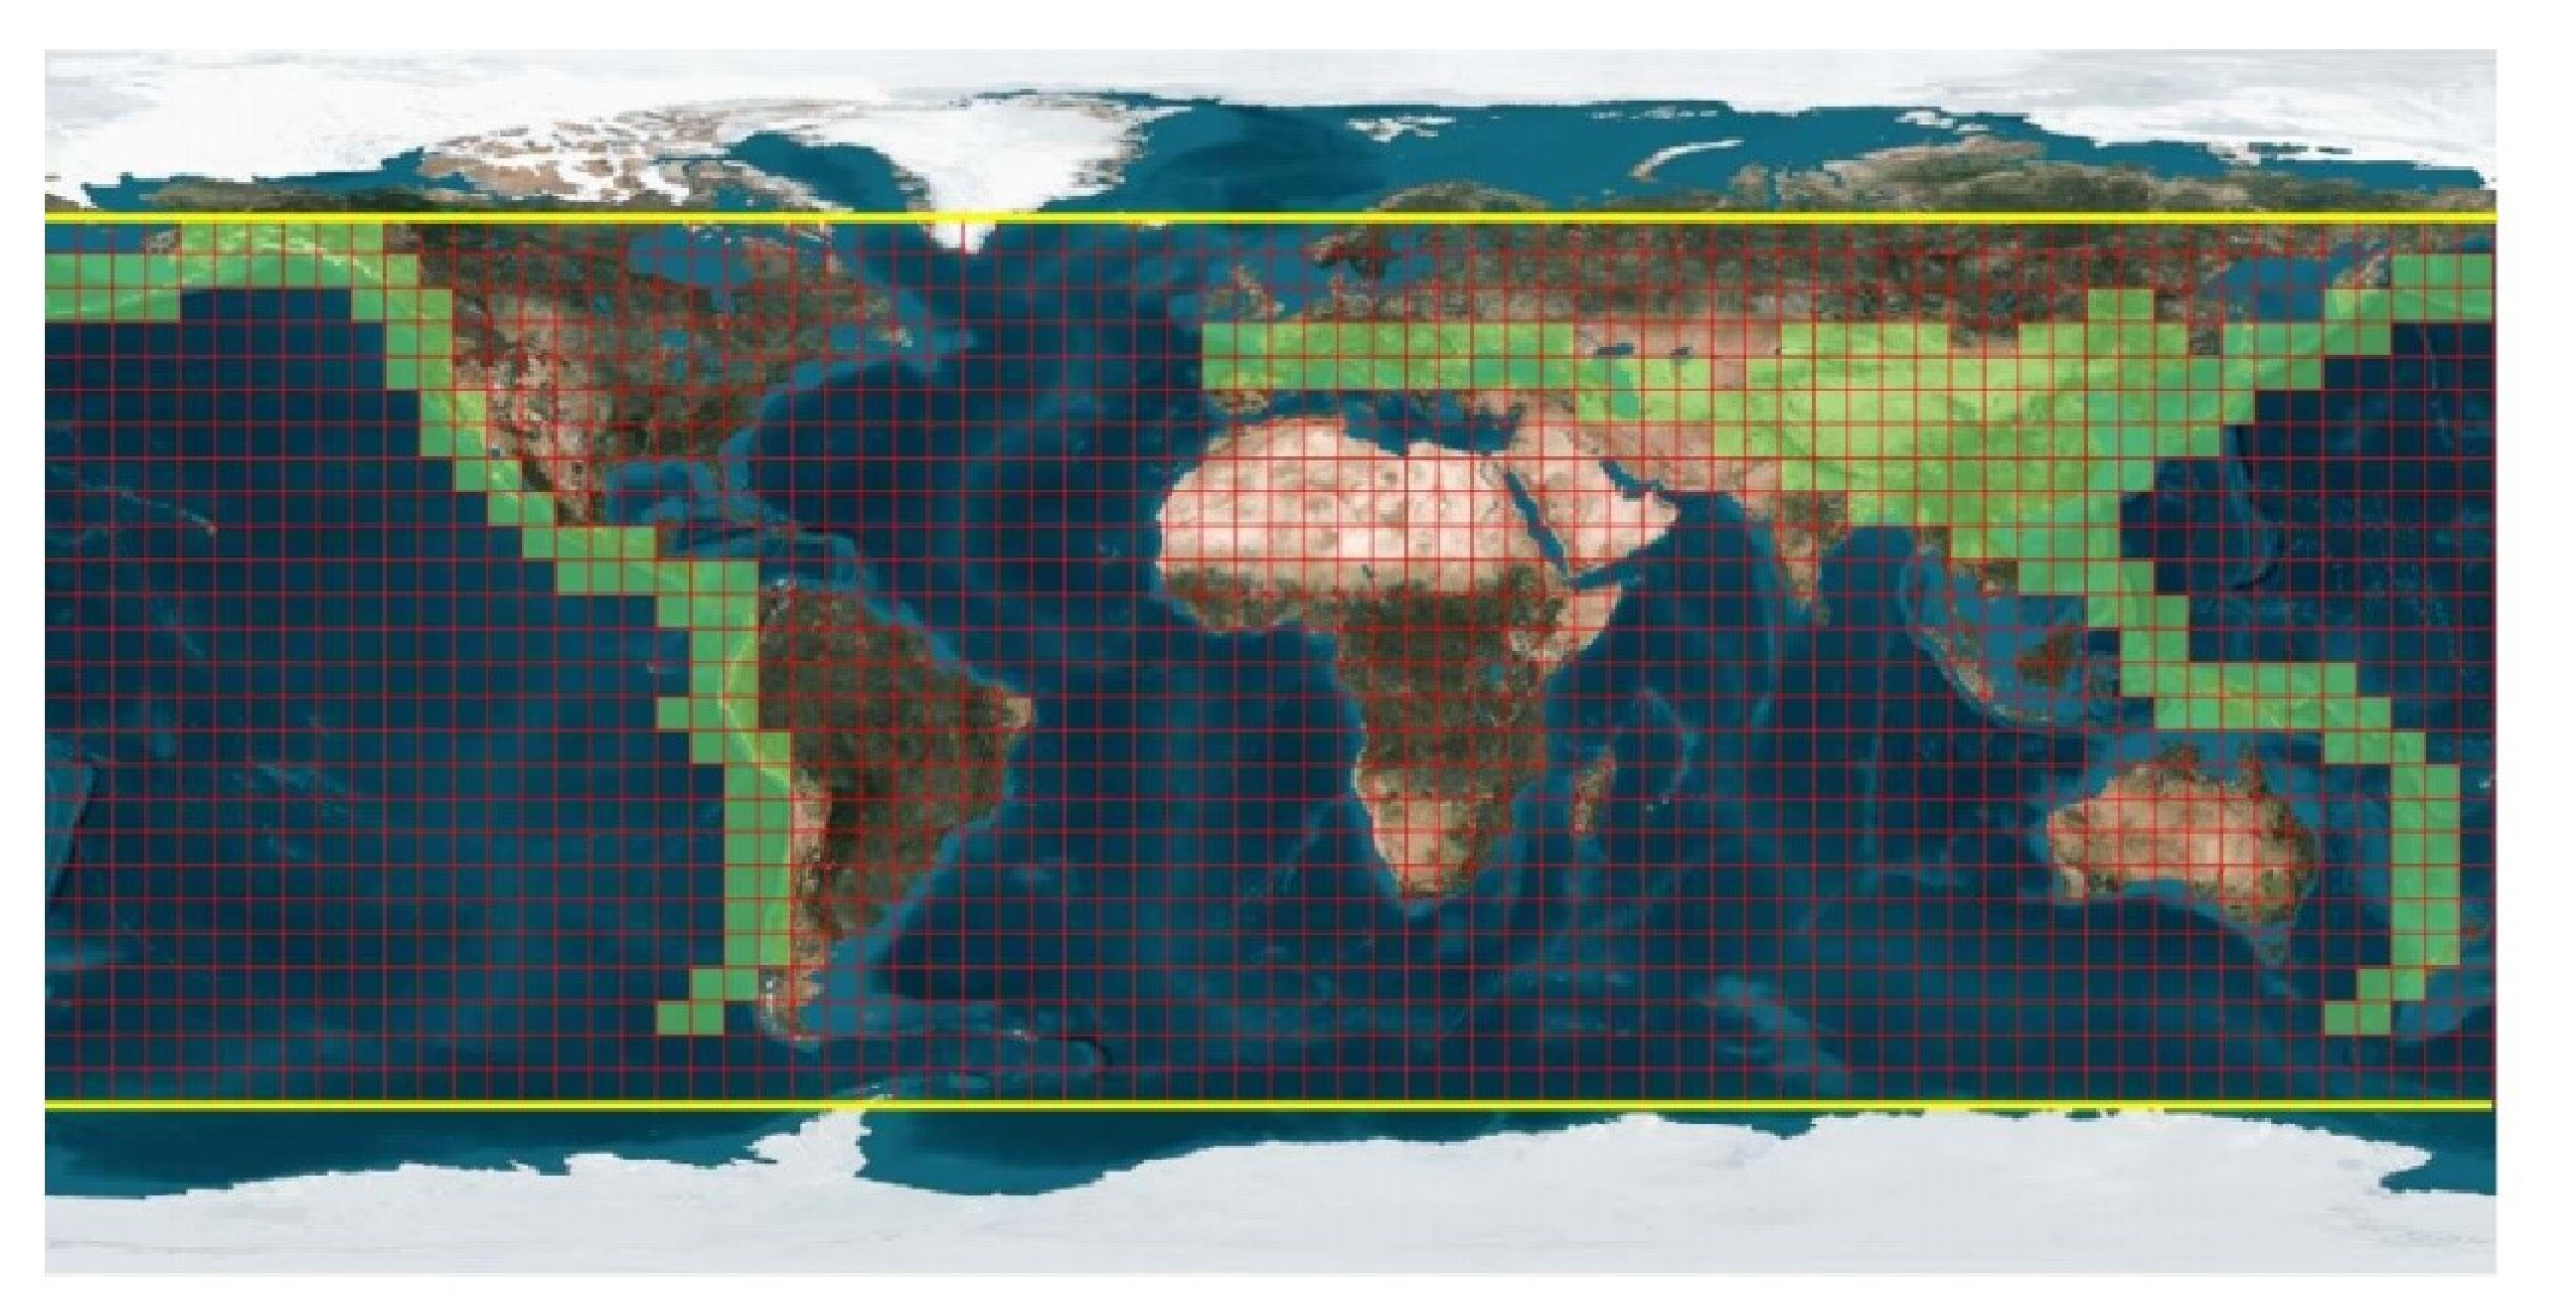
Figure 1. Image of the satellite’s working area. The green area is the working area under burst mode, and the areas inside the yellow line and outside the green area are the work areas under survey mode.
Remotesensing 15 03037 g001
Figure 2. Time-frequency spectrum of a lightning signal.
Remotesensing 15 03037 g002
Figure 3. Electron density profile (black curve) and electron temperature (red curve) of the IRI model.
Remotesensing 15 03037 g003
Figure 4. Geographic distribution of digisonde stations (red star).
Remotesensing 15 03037 g004
Figure 5. The 2D schematic of the meshing method.
Remotesensing 15 03037 g005
Figure 6. Electric-field waveform. The geographical coordinate of the satellite observation is 27.8°N and 112.0°E, the altitude is 496 km, the date is 28 April 2019, and the time is 06:43:50.
Remotesensing 15 03037 g006
Figure 7. Time-frequency spectrum of a lightning whistler corresponding to the data in Figure 6. This whistler corresponds to a negative cloud–ground flash (-CG) measured by the Institute of Electrical Engineering of the Chinese Academy of Science at 06:43:50.521 UT of −24.1 kA located at 30.536°N and 112.316°E, i.e., ~300 km from the satellite’s ground position.
Remotesensing 15 03037 g007
Figure 8. Electron density profile. The blue solid line is from the IRI background model, the black dotted line is the result of the assimilation, and the red dotted line is the true value observed by the digisonde. The electron density error is defined as Δ N e = N e r e f N e o b s , where N e r e f represents the electron density of the mesh points before or after assimilation, and N e o b s represents the electron density of the same mesh point observed by the digisonde. The electron density error distribution histogram is shown in Figure 9, in which the abscissa is the electron density error and the ordinate is the cumulative number of meshes.
Remotesensing 15 03037 g008
Figure 9. Histogram of the error distribution.
Remotesensing 15 03037 g009
Figure 10. Results of regional assimilation in Wuhan: (a) electron density profile and (b) histogram of the error distribution.
Remotesensing 15 03037 g010
Figure 11. Results of regional assimilation in Beijing: (a) electron density profile and (b) histogram of the error distribution.
Remotesensing 15 03037 g011
Figure 12. Assimilation results of multiple groups of frequency points over the Wuhan area, with frequency differences of (a) 5.5 kHz, (b) 3.9 kHz, (c) 0.8 kHz, and (d) 0.4 kHz.
Remotesensing 15 03037 g012
Figure 13. Line statistical chart of frequency difference and mean absolute error over the Wuhan region.
Remotesensing 15 03037 g013
Figure 14. The assimilation results of multiple groups of frequency points over the Beijing area, with frequency differences of (a) 5.5 kHz, (b) 2.8 kHz, (c) 0.8 kHz, and (d) 0.4 kHz.
Remotesensing 15 03037 g014
Figure 15. Line statistical chart of frequency difference and mean absolute error over the Beijing region.
Remotesensing 15 03037 g015
Disclaimer/Publisher’s Note: The statements, opinions and data contained in all publications are solely those of the individual author(s) and contributor(s) and not of MDPI and/or the editor(s). MDPI and/or the editor(s) disclaim responsibility for any injury to people or property resulting from any ideas, methods, instructions or products referred to in the content.