Communication

Effects of Atmospheric Coherent Time on Inverse Synthetic Aperture Ladar Imaging through Atmospheric Turbulence

1
Key Laboratory of Atmospheric Optics, Anhui Institute of Optics and Fine Mechanics, Chinese Academy of Sciences, Hefei 230031, China
2
Science Island Branch, University of Science and Technology of China, Hefei 230026, China
3
School of Physics, Hefei University of Technology, Hefei 230601, China
4
School of Environmental Science and Optoelectronic Technology, University of Science and Technology of China, Hefei 230026, China
*
Author to whom correspondence should be addressed.
These authors contributed equally to this work.
Remote Sens. 2023, 15(11), 2883; https://doi.org/10.3390/rs15112883
Submission received: 29 March 2023 / Revised: 25 May 2023 / Accepted: 29 May 2023 / Published: 1 June 2023
(This article belongs to the Special Issue SAR Images Processing and Analysis)

Abstract

:
Inverse synthetic aperture ladar (ISAL) can achieve high-resolution images for long-range moving targets, while its performance is affected by atmospheric turbulence. In this paper, the dynamic evolution of atmospheric turbulence is studied by using an infinitely long phase screen (ILPS), and the atmospheric coherent time is defined to describe the variation speed of the phase fluctuation induced by atmospheric turbulence. The simulation results show that the temporal decoherence of the echo induced by turbulence causes phase fluctuation and introduces an extra random phase, which deteriorates the phase stability and makes coherent synthesis impossible. Thus, we evaluated its effects on ISAL imaging and found a method to mitigate the impact of turbulence on ISAL images. The phase compensation algorithm could correct the phase variation in different pulses instead of that within the same pulse. Therefore, the relationship between the atmospheric coherent time and pulse duration time (rather than that between the atmospheric coherent time and ISAL imaging time) ultimately determines the ISAL imaging quality. Furthermore, these adverse effects could be mitigated by increasing the atmospheric coherent time or decreasing the pulse duration time, which results in an improvement in the ISAL imaging quality.

Graphical Abstract

1. Introduction

Inverse synthetic aperture ladar (ISAL) is a kind of active imaging radar that combines the advantages of synthetic aperture techniques [1] with coherent laser radar to obtain high-resolution images [2]. Compared with conventional microwave radar, laser radar creates a larger Doppler bandwidth and improves the imaging quality in terms of azimuth resolution. Owing to laser heterodyne (coherent) detection, ISAL could monitor the amplitude and phase data of extremely weak echoes [3], which enables imaging for long-distance moving targets with a high resolution. However, the laser decoherence induced by atmospheric turbulence reduces the heterodyne detection efficiency and introduces extra phase noise, resulting in degradation of the image resolution. This is one of the main obstacles to the application of ISAL. Therefore, it is necessary to study systematically the effect mechanism of atmospheric turbulence on ISAL and find ways to overcome the adverse effects in order to successfully implement ISAL.
Over the past decade, most previous simulation and experiment works on ISAL and SAL imaging in atmospheric turbulence have been demonstrated [4,5,6,7,8,9,10,11]. In 2014, the performance characterization of phase gradient autofocus for ISAL was studied by CJ Pellizzari [12], who showed that the phase gradient algorithm (PGA) can still maintain its advantage of automatic focusing under atmospheric turbulence and low signal-to-noise ratio (SNR) conditions. In 2016, based on a Monte Carlo random factor, Lu Tian-an [6] used a Kolmogorov phase screen to simulate turbulence and rank one phase error estimation to compensate SAL images. Russell Trahan [3] demonstrated the correction capability of the PGA algorithm under a low carrier-to-noise ratio (CNR) and atmospheric turbulence through experimentation. In the same year, Ning Wang [13] found that the influence of atmospheric turbulence was related to the time through an experiment with ISAL at 1.1 km. That aside, there are few studies on eliminating or mitigating the adverse effects of atmospheric turbulence on ISAL, such as from Randy S. Depoy and Arnab K. Shaw [14,15]. In 2019, they evaluated the performance of three model error correction algorithms to mitigate atmospheric blurring in reconstructed imagery [14]. In 2020, model-based reconstruction algorithms with model error corrections are proposed to mitigate the deleterious effects of atmospheric turbulence and restore image quality [15]. In 2022, Ming Liu studied the imaging performance and anti-interference ability of an SAL with photonic lantern coupling under atmospheric turbulence [16]. At the same time, Jiyu Xue employed the PGA algorithm to study the ISAL imaging of rough targets in slant atmospheric turbulence through the use of an atmospheric random phase screen [11]. It was found that ISAL images with rough targets could be resolved not only under under weak turbulence but strong turbulence. Generally, turbulence-induced phase fluctuation is a continuously varying random process. Nevertheless, methods used in previous studies did not consider to describe the dynamic evolution of turbulence. Aside from that, the decoherence induced by turbulence could reduce the heterodyne efficiency and could introduce an extra random phase, which would deteriorate the phase stability and make coherent synthesis impossible. Thus, we develop corresponding methods to overcome the shortcomings of existing studies.
Considering the dynamic evolution of turbulence, we employ the moving ILPS method [17] to simulate the time-varying receiving electric field. Based on the principle of heterodyne detection, the influence of atmospheric turbulence on heterodyne detection can be investigated from both the spatial and temporal domains. The spatial decoherence of echo causes distortions in the laser wavefront, degrading the optical field from a single mode to multi-mode, and causing a mismatch between the reference and return signal modes, resulting in a rapid decrease in the SNR. The temporal decoherence of echo induced by turbulence could add an extra random phase, which deteriorates the phase stability of the echo and results in imperfect performance at the receiver. Therefore, the size and variation speed of the phase fluctuation are the main factors to corrupt the desired signal, which leads to high-resolution ISAL imaging losing its unique advantage.
To analyze the temporal decoherence of the echo induced by turbulence, the atmospheric coherent time is defined [18] to describe the variation speed of the phase fluctuation of the echo. The atmospheric coherent time can be improved by increasing the wavelength and adjusting the transmitting and receiving parameters properly. Then, we investigate its influence on ISAL images. According to heterodyne detection and the ISAL image principle, we demonstrate that the relationship between the pulse duration time and atmospheric coherent time determines the ISAL imaging quality. It is shown that our proposal can effectively mitigate the adverse effect of atmospheric turbulence on ISAL and can improve image quality.
This paper is organized as follows. In Section 2, the main methods used in this paper are briefly introduced, including the infinitely long phase screen method, heterodyne detection process, and range-Doppler (R-D) algorithm. In Section 3, we investigate the influence of atmospheric turbulence with the R-D algorithm on ISAL imaging and evaluate the correction effect of our proposed relative size to compensate for the turbulence-induced phase error for ISAL images. In Section 4, we discuss the ISAL imaging results and conclude the paper.

2. Numerical Methods

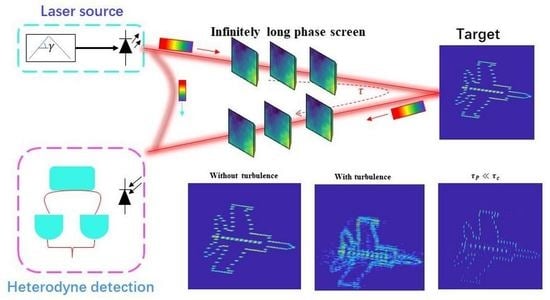
2.1. ISAL Image Processing Model

A well-developed ISAL image processing model comprises three primary assignments: a transmitter side, a receiver side, and ISAL raw data compensation. Ladar transmits a signal to a target and receives an echo signal from it through the atmospheric turbulence. Generally, the phase data of the echo signal are obtained by heterodyne detection, and then phase compensation and self-focusing processing are performed to obtain the target image after aperture synthesis. A concrete illustration is presented in Figure 1.

2.2. Infinitely Long Phase Screen

A turbulent atmosphere is equivalent to placing a series of thin random phase screens in a vacuum. The light field diffracts to the phase screens, and each phase screen introduces a random contribution to the phase. This diffraction and phase modulation process continues until the beam is transmitted to the receiving end. The multilayer random phase screen is a common random phase screen method used in laser propagation simulations [19]. The main random phase screen generation methods are the FFT power spectrum inversion method [20], fractal method [21], and Zernike polynomial method [22], where the FFT method with added subharmonics is the most common method [23]. However, the random phase screen is established on the fact that the laser pulse width is significantly narrower than the time scale width of random refractive index fluctuations [24]. Therefore, the dynamical process of incident light propagating through atmospheric turbulence cannot be investigated using this method. Moreover, the static assumption will lose its usefulness when the influence of the wind velocity on ISAL imaging is studied.
The infinitely long phase screen method can overcome this barrier to simulate very long exposure times (without using the whole memory space) as well as the time evolution of the turbulence parameters [17]. First, we generate an initially random phase screen with the FFT power spectrum inversion method and take the last few columns (rows) of the last-generated phase screen to construct a matrix Z. The matrix Z is combined with the turbulence power spectral density function to generate a new column (row) X, which is added to the last generated one, and the excess part of the oversized phase screen is discarded. In the simulation process, these new columns (rows) are generated in each iteration according to the wind velocity v, wind direction θ , iteration time, grid spacing, and other parameters. The relationship between the new column (row) X and the partial data Z is given by [17]
X = A Z + B β
where β is a Gaussian random vector with zero mean and its covariance is equal to unity [25,26,27]. Matrices A and B can be calculated from the covariance of the X and Z vectors, including the matrices Z Z T , X Z T , Z X T , and X X T . All the covariance matrices can be acquired from constructing the distance matrix r i , j and acting on the phase covariance function C φ r . In the von Kármán spectrum, the covariance can be expressed as [28]
C φ r = 2 π r L 0 5 6 L 0 r 0 Γ 11 / 6 2 5 / 6 π 3 / 8 24 5 Γ 6 5 5 6 K 5 / 6 2 π r L 0
where K 5 / 6 · represents the McDonald function, Γ · represents the gamma function, L 0 is the outer scale, and r 0 is the Fried parameter.

2.3. Heterodyne Detection Processes with ISAL

Heterodyne detection is an important technique for implementing high-resolution ISAL images. As a kind of coherent detection, highly steady coherence between the local oscillator signal and echo signal in the heterodyne detection process should be maintained. However, the spatial decoherence of the echo induced by turbulence could reduce the SNR and heterodyne efficiency, while the temporal decoherence of the echo induced by turbulence could introduce an extra random phase, which deteriorates the phase stability of the echo and makes the coherent synthesis impossible. Therefore, it is necessary to analyze the effect of turbulence on ISAL imaging based on the heterodyne detection principle. Here, the signal transmission and coherent detection processes under the atmospheric turbulence are given. It is assumed that both the local oscillation E L x , y , t and the return signal E S x , y , t can be expressed as
E L x , y , t = E L x , y exp i ω L t
E S x , y , t = E S x , y exp i ω S t
where ω L and ω S are the frequency of the local and return signals, respectively. After E L and E S are coherently detected on the beam-combining mirror, the heterodyne signal is as follows:
i ( t ) = E S x , y , t + E L x , y , t 2 d x d y = E S x , y , t 2 + E L x , y , t 2 + E S * x , y , t E L x , y , t + E S x , y , t E L * x , y , t d x d y
where the last two items are beat frequency items, and by adding the phase items ϕ S x , y , ϕ L x , y , the above equation can be written as
i ( t ) = E S x , y 2 + E L x , y 2 + 2 E L x , y E S x , y cos ω S ω L t + ϕ S x , y ϕ L x , y d x d y
where ϕ L x , y is the initial phase of the local signal and ϕ S x , y is the phase fluctuation caused by atmospheric turbulence. It should be noted that detection can only be performed if the reference and return signals are in the same modes. In order to achieve good coherence with the reference light, the mode-matching requirements must be satisfied. The transverse mode of the laser can be described by the Hermite–Gaussian polynomial H m , n x , y with orthogonal normalization and completeness:
H m , n x , y H k , l * x , y d x d y = δ m , k δ n , l
The light field in the atmosphere can be decomposed according to the Laguerre–Gaussian (L-G) mode or Hermite–Gaussian (H-G) mode. First, the echo signal electric field E S x , y is expanded according to the H-G polynomial:
E S x , y = C m , n S H m , n x , y
where
C m , n S = E S x , y H m , n * x , y d x d y
In Equation (9), C m , n S = C m , n S e i ϕ m , n , C m , n S 2 represents the proportion of m and n mode compositions in the echo signal field, and ϕ m , n represents the additional phase of m and n. The local reference light field E L x , y is generally a T E M 00 mode:
E L x , y = C 0 , 0 L H 0 , 0 x , y
Based on the detection conditions, we can see that when the reference light is in T E M 00 mode, only the component of the T E M 00 mode in the echo signal field participates in the beat frequency. Therefore, the mode decomposition is performed to obtain the coefficients and phases of the T E M 00 mode of the echo. Then, Equation (6) can be written as
i ( t ) = C 0 , 0 L 2 + C 0 , 0 S 2 + 2 C 0 , 0 L C 0 , 0 S cos ω S ω L t + ϕ 0 , 0 S ϕ 0 , 0 L
where C 0 , 0 S = C 0 , 0 S e i ϕ 0 , 0 S is the coefficient of the echo signal’s T E M 00 mode. The random variation in C 0 , 0 S directly affects the heterodyne detection efficiency, the absolute C 0 , 0 S affects the amplitude of the coherent signal, and the angle ϕ 0 , 0 S affects the phase history data of the coherent signal. If ϕ 0 , 0 S hardly changes during the ISAL imaging time, then the imaging resolution will be high; otherwise, the image quality will be reduced. For the linear frequency modulation (LFM) signal, the local oscillator signal is obtained after a certain time delay τ r e f :
S L t = S t τ r e f = r e c t t τ r e f T P exp j 2 π f c t τ r e f + π K t τ r e f 2
where f c and K represent the center frequency and chirp rate, respectively. Therefore, the received echo signal with a time delay τ can be expressed as
S r t = S t τ = r e c t t τ T P exp j 2 π f c t τ + π K t τ 2
The raw ISAL data are obtained by laser heterodyne detection, which can be expressed as [29]
S n t = A r e c t t τ T P exp j 2 π K τ τ r e f t τ r e f + j π K τ τ r e f 2 j 2 π f c τ τ r e f
where τ = 2 R / c , τ r e f = 2 R r e f / c , and R and R r e f represent the distance from ladar to the target and the distance of the reference signal from ladar to the target, respectively. Let R Δ = R R r e f , t = t τ r e f . Then, Equation (14) can be written as
S n t = A r e c t t 2 R Δ c T P exp j 2 π K 2 R Δ c t exp j 4 π f c c R Δ exp j 4 π K c 2 R Δ 2
Thus, the heterodyne signal affected by atmospheric turbulence can be written as
S n t = A r e c t t 2 R Δ c T P exp j 2 π K 2 R Δ c t exp j 4 π f c c R Δ exp j 4 π K c 2 R Δ 2 exp ( i ϕ 00 )
Finally, the motion compensation algorithm is used to achieve target imaging.

2.4. Range-Doppler Algorithm

For ISAL, the imaging algorithm is the significant procedure to achieve well-focused images. The conventional range-Doppler algorithm (RDA) is widely used in two-dimensional focused imaging, especially for chirp pulse signals [30]. The main algorithm steps of the RDA are given below, where the raw ISAL data are arranged in the range cells (range dimension) and the number of pulse (cross-range dimension) domains. First, we use range compression to obtain the ISAL range profiles. Then, we apply translational motion compensation (TMC) to remove the target’s translational motion, which includes range alignment and phase adjustment. Secondly, we apply rational motion compensation (RMC), such as the polar reformatting algorithm (PFA) to correct rotation errors. Finally, after removing translational and rotational motion, an ISAl range-Doppler image is generated by using the Fourier transform in the pulse domain. To display ISAL images in the range and cross-range domains, cross-range scaling is also needed to convert the Doppler shift to the cross-range domain.

3. Simulation Results

3.1. Laser Beam Propagation in Atmospheric Turbulence

To quantify the turbulence’s effect on laser propagation, the evolution of a laser beam across the turbulent channel and the impact of different atmospheric coherent times on the ISAL raw data are presented. The phase distribution and amplitude as well as the phase fluctuation over time of the received laser beam’s T E M 00 mode in different turbulence parameters are shown in Figure 2. Here, according to [18], the T E M 00 mode phase fluctuation speed after the atmospheric turbulence could be quantified by the atmospheric coherent time, which was equal to 0.45 ms, 2.37 ms, and 4.50 ms for each row from left to right in Figure 2.
The phase distribution of the laser beam distorted after propagation is shown in Figure 2. With stronger turbulence, the T E M 00 mode amplitude and phase fluctuations become more intense. The spatial decoherence of the echo induced by the turbulence could reduce the SNR and heterodyne efficiency, while the temporal decoherence could introduce an extra random phase. Such mode crosstalk and phase instability could reduce the SNR and efficiency during heterodyne detection, resulting in coherent synthesis being impossible. It should be noted that applying adaptive optics (AO) [31,32] technology in the ISAL process can correct the wavefront phase distortion and effectively upgrade the SNR of the heterodyne signal, but it cannot improve the phase instability of the echo induced by turbulence. However, after the requirements of the SNR are satisfied, the phase stability of the echo is the key factor for the ISAL imaging quality. Hence, it is of great significance for evaluating the influence of the phase fluctuation induced by turbulence on heterodyne detection’s performance and the ISAL imaging quality. According to [18], atmospheric coherent time reflects the phase fluctuation speed of the echo in the atmospheric turbulence. Therefore, we consider that the relationship between the atmospheric coherent time and pulse duration time is the main factor to determine the ISAL imaging quality in turbulent conditions.

3.2. RDA Compensation Simulation

Based on the above analysis, for the ISAL images affected by atmospheric turbulence, the RDA was simulated. Due to the limitations of the experimental conditions, an aircraft model was used. The transmission signal in the simulation was the LFM signal. The parameters of the target plane simulated to be in rotation is shown in Table 1, including both the translations and angular motion errors. The target model composed of point scatters with uniform reflectivity is shown in Figure 3.
ISAL transmits N chirped pulse signals to the target, and M samples are taken in each chirped pulse. The ISAL imaging results without turbulence are shown in Figure 4, where the ISAL imaging time τ T is equal to 1.3 s. It can be seen that without turbulence, TMC and RMC overcame image blurring and defocusing caused by target motion, which can effectively improve the ISAL imaging quality.
To investigate the influence of atmospheric turbulence on ISAL imaging, the aircraft model in the ISAL process with different atmospheric coherent times τ c is shown in Figure 5. The turbulence nearly had no influence on the ISAL process (see the top row) for τ c τ T (i.e., the turbulence was frozen under the whole ISAL process). However, atmospheric turbulence would significantly reduce the imaging quality of ISAL when τ c τ T . The reason for this phenomenon is that the turbulence remains in a frozen state throughout the entire ISAL process for τ c τ T , implying that the induced phase fluctuation is smaller, and thus the ISAL imaging quality is higher; otherwise, the result will be the opposite.
Compared with Figure 4, Figure 5 shows that the TMC and RMC algorithms can effectively overcome the adverse effects induced by turbulence. The phase correction mechanism is the key problem. There are two possible correction mechanisms. The first one is that TMC can correct the phase fluctuations throughout the entire ISAL process. The second one is that it can only correct the phase fluctuations between different pulses. Next, we shall further explore the mechanisms of TMC.
Phase fluctuations at different pulses and in the entire ISAL process can reduce the ISAL imaging quality without TMC, as illustrated in Figure 6. Moreover, the phase fluctuations between different pulses can be corrected effectively by using TMC and RMC. However, these cannot be corrected through the entire ISAL process. The reason for this phenomenon is that TMC includes range alignment and phase adjustment. Phase adjustment eliminates the phase drift between different pulses as the range profiles are aligned, which means that TMC can only correct the phase fluctuation between different pulses.
From the TMC compensation principle, it can be seen that the relative difference between the atmospheric coherent time τ c and pulse duration time τ p determines the ISAL imaging quality in turbulent conditions. To verify the above anticipation, ISAL images were plotted with different pulse duration times τ p and ISAL imaging times τ T in atmospheric conditions.
Smaller τ p values could improve the compensation efficiency of the TMC algorithm, and target scatters were easier to identify (see the first row), as illustrated in Figure 7. However, there was not much difference between the ISAL images when the ISAL imaging time τ T became smaller. Compared with the upper and lower parts of Figure 7, τ p was the key parameter for mitigating the adverse effects of atmospheric turbulence on ISAL imaging.
In conclusion, turbulence-induced phase fluctuation in the range dimension is the key ingredient for causing a degradation in the ISAL imaging quality. In addition, TMC can only overcome the adverse effects of phase fluctuation at different pulses. Hence, two important conclusions can be drawn: (1) For a certain range resolution, increasing the chirp rate γ means reducing the pulse duration time τ p , and thereby the adverse effect of atmospheric turbulence can be overcome, and (2) there is no relationship between the compensation efficiency of TMC and the ISAL imaging time τ T . Thus, decreasing the ISAL imaging time τ T reduced the cross-range resolution and could not overcome the adverse effect of the turbulence.

3.3. Quantitative Evaluation of Image Quality

In addition to a visual comparison of the ISAL imaging results, we also evaluated the single-point ISAL imaging quality before and after compensation. For single-point ISAL imaging, the chirped pulse duration time τ p was equal to 35 µs, as presented in Figure 8a. Here, the peak side lobe ratio (PSLR) was used to evaluate the ISAL image quality [33], which describes the ability of an ISAL system to eliminate the distortion caused by adjacent point targets and can be expressed as
P S L R = 20 · log 10 A S max A m
where A S max and A m represent the maximum value of the main lobe and the strongest side lobe maximum value outside of the main lobe, respectively. The smaller PSLR values indicate a smaller side lobe amplitude and higher image quality. Therefore, the PSLR value of single-point imaging before and after compensation at different atmospheric coherent times τ c is given in Figure 8b.
The PSLR value after compensation was smaller than that before compensation, as shown in Figure 8b. In addition, with the longer atmospheric coherent times, the PSLR values became smaller, which indicates that the TMC algorithm can compensate for the phase error induced by atmospheric turbulence. On the other hand, the PSLR values for single-point imaging before and after compensation at different pulse duration times τ p and ISAL imaging times τ T are shown in Figure 8c,d. It was found that with the decreases in the pulse duration time τ p , the PSLR value became smaller, which means that smaller τ p values could improve the compensation efficiency of the TMC algorithm. However, with the decreases in the ISAL imaging time τ T , the PSLR value hardly changed, as shown in Figure 8d.
In summation, the relationship between the pulse duration time τ p and atmospheric coherent time τ c affected the ISAL image quality in the turbulence condition instead of the atmospheric coherent time τ c or the ISAL imaging time τ T .

4. Conclusions

The temporal decoherence of the echo induced by turbulence causes phase fluctuations and introduces an extra random phase, which directly affects the phase stability of the echo, resulting in imperfect performance in the ISAL imaging process. In this paper, we studied systematically the adverse effects of atmospheric turbulence on the ISAL imaging quality. We used the ILPS method to simulate dynamic evolution of atmospheric turbulence and defined the atmospheric coherent time to describe the variation speed of the phase fluctuations induced by atmospheric turbulence.
The main results can be summarized as follows. The TMC algorithm can effectively compensate for the phase fluctuation induced by atmospheric turbulence when τ c τ T . The TMC algorithm can compensate for the turbulence-induced phase fluctuations in the cross-range dimension but cannot compensate for those in the range dimension. This means that with TMC the relationship between the pulse duration time and atmospheric coherent time, rather than between the atmospheric coherent time and ISAL imaging time, ultimately determines the ISAL imaging quality in turbulent conditions. For a certain range resolution, reducing the pulse duration time could overcome the adverse effect of atmospheric turbulence. In addition, decreasing the ISAL imaging time τ T reduced the cross-range resolution, and it could not overcome the adverse effect of turbulence. Therefore, these adverse effects of atmospheric turbulence can be mitigated by increasing the atmospheric coherent time or decreasing the pulse duration time, and the ISAL imaging quality can be enhanced.

Author Contributions

A.A. and Y.R. conceptualized the study and contributed to the article’s organization; Z.T., S.L., Y.L., H.D. and R.R. contributed to the discussion of the simulation results; A.A. drafted the manuscript, which was revised by all authors. All authors have read and agreed to the published version of the manuscript.

Funding

This research was funded by the National Natural Science Foundation of China (grant number 11904369) and HFIPS Director’s Foundation (grant number YZJJ2023QN05).

Data Availability Statement

The next steps are also based on this research, therefore it is not appropriate to share procedures or data at this time.

Conflicts of Interest

The authors declare no conflict of interest.

References

  1. Crouch, S.; Barber, Z.W. Laboratory demonstrations of interferometric and spotlight synthetic aperture ladar techniques. Opt. Express 2012, 20, 24237–24246. [Google Scholar] [CrossRef] [PubMed]
  2. Green, T.J.; Marcus, S.; Colella, B.D. Synthetic-aperture-radar imaging with a solid-state laser. Appl. Opt. 1995, 34, 6941–6949. [Google Scholar] [CrossRef]
  3. Trahan, R.; Nemati, B.; Zhou, H.; Shao, M.; Hahn, I.; Schulze, W. Low-CNR inverse synthetic aperture LADAR imaging demonstration with atmospheric turbulence. In Proceedings of the Long-Range Imaging, Baltimore, MD, USA, 17–21 April 2016; Volume 9846, pp. 87–99. [Google Scholar]
  4. Hua, Z.; Li, H.; Gu, Y. Atmosphere turbulence phase compensation in synthetic aperture ladar data processing. In Proceedings of the MIPPR 2007: Multispectral Image Processing, Wuhan, China, 15 November 2007; Volume 6787, pp. 560–566. [Google Scholar]
  5. Guo, L.; Xing, M.; Tang, Y.; Dan, J. A novel modified Omega-k algorithm for synthetic aperture imaging lidar through the atmosphere. Sensors 2008, 8, 3056–3066. [Google Scholar] [CrossRef] [PubMed]
  6. Lu, T.A.; Li, H.P. Atmospheric turbulence induced synthetic aperture lidar phase error compensation. Opt. Commun. 2016, 381, 214–221. [Google Scholar] [CrossRef]
  7. Wang, C. Study of synthetic aperture ladar imaging through atmospheric turbulence. In Proceedings of the International Symposium on Photoelectronic Detection and Imaging 2011: Laser Sensing and Imaging; and Biological and Medical Applications of Photonics Sensing and Imaging, Beijing, China, 24–26 May 2011; Volume 8192, pp. 408–418. [Google Scholar]
  8. Karr, T.J. Synthetic aperture ladar resolution through turbulence. In Proceedings of the Atmospheric Propagation, San Jose, CA, USA, 28–29 January 2003; Volume 4976, pp. 22–33. [Google Scholar]
  9. Pellizzari, C.; Spencer, M.; Steinhoff, N.; Belsher, J.; Tyler, G.; Williams, S.; Williams, S. Inverse synthetic aperture ladar: A high-fidelity modeling and simulation tool. In Proceedings of the Unconventional Imaging and Wavefront Sensing 2013, San Diego, CA, USA, 25–29 August 2013; Volume 8877, p. 88770B. [Google Scholar]
  10. Schumm, B.E.; Dierking, M.P. Wave optics simulations of synthetic aperture ladar performance through turbulence. J. Opt. Soc. Am. A 2017, 34, 1888–1895. [Google Scholar] [CrossRef] [PubMed]
  11. Xue, J.; Cao, Y.; Wu, Z.; Li, Y.; Zhang, G.; Yang, K.; Gao, R. Inverse synthetic aperture lidar imaging and compensation in slant atmospheric turbulence with phase gradient algorithm compensation. Opt. Laser Technol. 2022, 154, 108329. [Google Scholar] [CrossRef]
  12. Pellizzari, C.J.; Bos, J.; Spencer, M.F.; Williams, S.; Williams, S.E.; Calef, B.; Senft, D.C. Performance characterization of Phase Gradient Autofocus for inverse synthetic aperture LADAR. In Proceedings of the 2014 IEEE Aerospace Conference, Big Sky, MT, USA, 1–8 March 2014; pp. 1–11. [Google Scholar]
  13. Wang, N.; Wang, R.; Li, G.; Zhang, K.; Wu, Y. Experiment of inverse synthetic aperture ladar at 1.1 km. In Proceedings of the Optical Measurement Technology and Instrumentation, Beijing, China, 9–11 May 2016; Volume 10155, p. 101551G. [Google Scholar]
  14. Depoy, R.S.; Shaw, A.K. Mitigating atmospheric phase-errors in SAL data using model-based reconstruction. In Proceedings of the 2019 IEEE National Aerospace and Electronics Conference (NAECON), Dayton, OH, USA, 15–19 July 2019; pp. 384–390. [Google Scholar]
  15. Depoy, R.S.; Shaw, A.K. Algorithm to overcome atmospheric phase errors in SAL data. Appl. Opt. 2020, 59, 140–150. [Google Scholar] [CrossRef] [PubMed]
  16. Liu, M.; Li, Y.; Du, Y.; Lei, T.; Qiu, J.; Hong, X.; Guo, H.; Wu, J. Performance Analysis of Synthetic Aperture Ladar System with Photonic Lantern Coupling under Atmospheric Turbulence. In Proceedings of the 2022 IEEE 10th International Conference on Information, Communication and Networks (ICICN), Zhangye, China, 23–24 August 2022; pp. 479–484. [Google Scholar]
  17. Assémat, F.; Wilson, R.W.; Gendron, E. Method for simulating infinitely long and non stationary phase screens with optimized memory storage. Opt. Express 2006, 14, 988–999. [Google Scholar] [CrossRef] [PubMed]
  18. Azizigul, A.; Zhi-Wei, T.; Shi-Wei, L.; Yan-Ling, L.; Rui-Zhong, R.; Yi-Chong, R. Influence of atmospheric turbulence on temporal coherence characteristics of received optical field. Acta Phys. Sin. 2022, 71. [Google Scholar] [CrossRef]
  19. Rao, R. Light Propagation in Turbulent Atmosphere; Anhui Science and Technology Publishing House: Hefei, China, 2005; Volume 5. [Google Scholar]
  20. McGlamery, B.L. Computer simulation studies of compensation of turbulence degraded images. In Proceedings of the Image Processing, Pacific Grove, CA, USA, 24–26 February 1976; Volume 74, pp. 225–233. [Google Scholar]
  21. Wu, H.; Yan, H.; Li, X.; Li, S. Generation of rectangular turbulence phase screens based on fractal characteristics of distorted wavefront. Acta Opt. Sin. 2009, 129, 114–119. [Google Scholar]
  22. Roddier, N.A. Atmospheric wavefront simulation using Zernike polynomials. Opt. Eng. 1990, 29, 1174–1180. [Google Scholar] [CrossRef]
  23. Sedmak, G. Implementation of fast-Fourier-transform-based simulations of extra-large atmospheric phase and scintillation screens. Appl. Opt. 2004, 43, 4527–4538. [Google Scholar] [CrossRef] [PubMed]
  24. Taylor, G.I. Statistical theory of turbulenc. Proc. R. Soc. Lond. A 1935, 151, 421–444. [Google Scholar] [CrossRef]
  25. Roddier, F. V the effects of atmospheric turbulence in optical astronomy. In Progress in Optics; Elsevier: Amsterdam, The Netherlands, 1981; Volume 19, pp. 281–376. [Google Scholar]
  26. Ziad, A.; Borgnino, J.; Martin, F.; Maire, J.; Mourard, D. Towards the monitoring of atmospheric turbulence model. Astron. Astrophys. 2004, 414, L33–L36. [Google Scholar] [CrossRef]
  27. Fried, D.L. Optical resolution through a randomly inhomogeneous medium for very long and very short exposures. JOSA 1966, 56, 1372–1379. [Google Scholar] [CrossRef]
  28. Andrews, L.C.; Phillips, R.L. Laser Beam Propagation through Random Media, 2nd ed.; SPIE Optical Engineering Press: Bellingham, WA, USA, 2005. [Google Scholar]
  29. Liu, Y. Research on Synthetic Aperture Ladar Imaging System. Ph.D. Thesis, Graduate School of National University of Defense Technology, Changsha, China, 2013. [Google Scholar]
  30. Cumming, I.G.; Wong, F.H. Digital processing of synthetic aperture radar data. Artech House 2005, 1, 108–110. [Google Scholar]
  31. Zhao, J.; Zhou, Y.; Braverman, B.; Liu, C.; Pang, K.; Steinhoff, N.K.; Tyler, G.A.; Willner, A.E.; Boyd, R.W. Performance of real-time adaptive optics compensation in a turbulent channel with high-dimensional spatial-mode encoding. Opt. Express 2020, 28, 15376–15391. [Google Scholar] [CrossRef] [PubMed]
  32. Xu, C.; Jin, K.; Jiang, C.; Li, J.; Song, A.; Wei, K.; Zhang, Y. Amplitude compensation using homodyne detection for inverse synthetic aperture LADAR. Appl. Opt. 2021, 60, 10594–10599. [Google Scholar] [CrossRef] [PubMed]
  33. Huang, L.; Wang, Y.; Jin, S. A Quantitative Evaluation Approach for ISAR Image Performance. Radar Sci. Technol. Pap. 2017, 15, 43–49. [Google Scholar]
Figure 1. Diagram of ISAL system in atmospheric turbulence.
Remotesensing 15 02883 g001
Figure 2. Amplitude and phase fluctuation of T E M 00 mode and phase distributions of received beam in different atmospheric coherent length r 0 . (ac) The amplitude fluctuation, (df) The phase fluctuation of T E M 00 mode and (gj) The phase distributions of received beam in different atmospheric coherent length r 0 .
Remotesensing 15 02883 g002
Figure 3. Simulated target model.
Remotesensing 15 02883 g003
Figure 4. Compensation results for ISAL imaging without atmospheric turbulence, where each column from left to right represents ISAL imaging without compensation and compensated by TMC or TMC + RMC.
Remotesensing 15 02883 g004
Figure 5. ISAL image with different values of atmospheric coherent time (top to bottom: τ c = 100 ms, 20 ms, and 1 ms; left to right: without, TMC, and TMC + PFA), where pulse duration time τ p = 5.12 ms and ISAL imaging time τ T = 1.3 s.
Remotesensing 15 02883 g005
Figure 6. ISAL imaging with atmospheric turbulence in different range and cross-range dimensions (upper and lower rows: ISAL imaging with phase fluctuation at different pulses and entire ISAL process; left to right: without compensation, TMC, and TMC + PFA).
Remotesensing 15 02883 g006
Figure 7. ISAL image with different pulse duration times τ p and ISAL imaging times τ T (upper and lower plots: τ c = 20 ms). For the upper two plots, τ T = 1.3 s, and for the lower two plots, τ p = 5.12 ms.
Remotesensing 15 02883 g007
Figure 8. ISAL imaging with PSLR values. (a) The single-point ISAL imaging with TMC + RMC compensation and (bd) The PSLR values at different atmospheric coherent times, pulse duration times, and ISAL imaging times, respectively.
Remotesensing 15 02883 g008
Table 1. Main parameters of the ladar and target.
Radar and Target ParameterValue
Laser wavelength (nm)1024
Pulse repetition frequency (Hz)17,987
Range sampling number64
Pulse number512
Distance of the target (m)1000
Range resolution (m)0.2927
Cross-range resolution (m)0.0556
Disclaimer/Publisher’s Note: The statements, opinions and data contained in all publications are solely those of the individual author(s) and contributor(s) and not of MDPI and/or the editor(s). MDPI and/or the editor(s) disclaim responsibility for any injury to people or property resulting from any ideas, methods, instructions or products referred to in the content.

