Article

PPA-Net: Pyramid Pooling Attention Network for Multi-Scale Ship Detection in SAR Images

1
Logistics Engineering College, Shanghai Maritime University, Shanghai 201306, China
2
Naval Academy, Brest Naval, Lanveoc-Poulmic, BP 600, F-29240 Brest, France
3
Department of Mechanical Engineering, University of Maryland Baltimore County, Baltimore, MD 21250, USA
4
Shanghai Engineering Research Center of Marine Renewable Energy, Shanghai Ocean University, Shanghai 201306, China
5
Institut d’Electronique et Des Technologies du NumeRique (IETR), CNRS UMR6164, Nantes Université, F-44000 Nantes, France
6
School of Electronic and Information Engineering, South China University of Technology, Guangzhou 510640, China
*
Author to whom correspondence should be addressed.
Remote Sens. 2023, 15(11), 2855; https://doi.org/10.3390/rs15112855
Submission received: 22 March 2023 / Revised: 6 May 2023 / Accepted: 16 May 2023 / Published: 31 May 2023

Abstract

:
In light of recent advances in deep learning and Synthetic Aperture Radar (SAR) technology, there has been a growing adoption of ship detection models that are based on deep learning methodologies. However, the efficiency of SAR ship detection models is significantly impacted by complex backgrounds, noise, and multi-scale ships (the number of pixels occupied by ships in SAR images varies significantly). To address the aforementioned issues, this research proposes a Pyramid Pooling Attention Network (PPA-Net) for SAR multi-scale ship detection. Firstly, a Pyramid Pooled Attention Module (PPAM) is designed to alleviate the influence of background noise on ship detection while its parallel component favors the processing of multiple ship sizes. Different from the previous attention module, the PPAM module can better suppress the background noise in SAR images because it considers the saliency of ships in SAR images. Secondly, an Adaptive Feature Balancing Module (AFBM) is developed, which can automatically balance the conflict between ship semantic information and location information. Finally, the detection capabilities of the ship detection model for multi-scale ships are further improved by introducing the Atrous Spatial Pyramid Pooling (ASPP) module. This innovative module enhances the detection model’s ability to detect ships of varying scales by extracting features from multiple scales using atrous convolutions and spatial pyramid pooling. PPA-Net achieved detection accuracies of 95.19% and 89.27% on the High-Resolution SAR Images Dataset (HRSID) and the SAR Ship Detection Dataset (SSDD), respectively. The experimental results demonstrate that PPA-Net outperforms other ship detection models.

1. Introduction

In the era of rapid development of radar technology, more and more countries and scholars are applying radar technology to various fields [1,2,3]. Synthetic Aperture Radar (SAR) was first proposed in the 1950s as a high-resolution imaging radar [4]. Compared with common passive imaging sensors such as infrared and optical sensors, SAR is more stable during the imaging process and less affected by background factors [5]. In addition, SAR has high resolution and wide field of view, which allows it to detect smaller vessels and effectively monitor a larger area for vessel detection [6]. Moreover, SAR can work in any weather and lighting conditions, and is not affected by the environment, enabling fast acquisition of real-time ship positions [7]. These advantages make SAR an important technological support for maritime safety monitoring and maritime transportation management [8].
In recent years, numerous methods for detecting ships in SAR images have been proposed. These methods can be broadly categorized into two groups based on their feature design approaches: traditional methods and deep learning-based methods.
Most traditional ship detection algorithms preprocess SAR images to enhance the contrast between the ship and the background and then use geometric features to identify the ship target [9,10,11]. These features include many properties, such as geometric and image properties, oriented gradient histograms, and scattering features. The Constant False Alarm Rate (CFAR) algorithm and its derivatives, such as Greatest Of CFAR, Cell Averaging CFAR, Order Statistic CFAR, and Smallest Of CFAR, are among the most commonly employed methods in the research [12,13,14,15]. Such methods mainly determine a threshold after processing the input noise and compare this threshold with the input signal. If the input signal exceeds this threshold, a target is identified. Some researchers have also exploited the difference in gray value between ships and background regions to detect ships at the superpixel level. For example, Liu et al. [16] used superpixel segmentation technology to segment sea and land areas to suppress the interference of land areas and then combined CFAR to achieve ship detection. Wang et al. [17] utilized a superpixel-based local contrast measure which is computed using simple linear iterative clustering and patch-based intensity dissimilarity measures. Li et al. [18] proposed a superpixel-based method for detecting targets in SAR images, which utilizes statistical differences in intensity distributions between target and clutter superpixels, and integrates global and local contrasts to achieve better target detection performance compared to backscattering-based methods. These methods require a good distribution model to describe the sea clutter and the selection of appropriate parameter settings to ensure good performance. However, the complex and variable environment in the ocean region makes it difficult to build a successful distribution model [19].
With the rapid development of the computer technology, deep learning has been widely applied in various fields [20,21,22]. In the field of object detection, deep learning-based object detection models automatically extract the features of targets through convolutional neural networks, reducing human involvement and making the extracted target features more accurate [23]. Especially in some complex background Synthetic Aperture Radar (SAR) images, deep learning-based object detection algorithms can effectively extract and recognize targets in images compared to traditional object detection algorithms [24]. Object detection algorithms based on deep learning can be divided into one-stage and two-stage object detection algorithms according to whether region proposals are executed on feature maps. R-CNN, Fast R-CNN, and Faster R-CNN are typical one-stage object detection algorithms which have high detection accuracy but require large computing power and long model inference time [25,26,27]. One-stage object detection algorithms include You Only Look Once (YOLO), Single Shot Multibox Detector (SSD), etc. Compared to two-stage object detection algorithms, one-stage object detection algorithms have a faster inference speed. However, the lack of a region proposal step in one-stage algorithms results in a loss of accuracy [28,29,30,31]. Hu et al. [32] proposed the Squeeze-and-Excitation (SE) block, which first introduced attention mechanism into the field of object recognition. SE weights the channels of the convolutional neural network, enabling the network to focus more on important channel features. Woo et al. [33] proposed the Convolutional Block Attention Module (CBAM), which suppresses non-object features in the image by combining channel attention mechanism with a spatial attention mechanism. Wang et al. [34] suggested that feature weights could be generated more efficiently by selecting an appropriate number of adjacent channels. Lin et al. [35] proposed that shallow features have better positional information and deep features have better semantic information in convolutional neural networks. To address this, they proposed Feature Pyramid Network (FPN) for fusing shallow and deep features. To better balance semantic and positional information, Wang et al. [36] constructed the Path Aggregation Network (PANet) by adding a top-down feature fusion path to FPN. Residual structures are also a way to optimize the expressive power of Convolutional Neural Network (CNN). For example, Bochkovskiy et al. [37] designed Cross Stage Partial Darknet53 (CSPDarknet53) as the backbone structure for object detection networks. CSPDarknet53 effectively alleviates the loss of small object information by introducing residual connections. In addition, they also added spatial pyramid pooling (SPP) to enhance the network’s ability to detect multi-scale objects. Li et al. [38] used residual structures to preserve more object information in the deep network of DetNet. Chen et al. [39] proposed the Atrous Spatial Pyramid Pooling (ASPP), which replaces the pooling operation in SPP with dilated convolution to reduce the loss of object information.
To achieve better SAR ship detection performance, researchers have gradually applied deep learning-based object detection methods and techniques to this field. Deep learning-based ship detection methods require a large amount of data to train the model. However, in the initial stage of SAR ship detection, researchers often face the challenge of a small dataset size. Lu et al. [40] improved the detection accuracy of ship detection models applied to a relatively small dataset by combining data augmentation and transfer learning methods, achieving a 1–3% improvement. Rostami et al. [41] proposed transferring knowledge from the electro-optical domain to the SAR domain by learning a shared invariant cross-domain embedding space, enabling electro-optical domain images to be used to train SAR domain object detection models. Zhang et al. [42] proposed a few-shot multi-class ship detection algorithm with an attention feature map and multi-relation detector. Truong et al. [43] constructed a convolutional neural network model using transfer learning techniques. Zhang et al. [44] built the first publicly available dataset for SAR ship detection, called the SAR Ship Detection Dataset (SSDD). Wei et al. [45] constructed the High-Resolution SAR Images Dataset (HRSID) for ship detection, and they applied residual structures and feature pyramid networks to build HR-SDNet. Currently, some researchers are focusing on model lightweighting. For example, Jin et al. [46] introduced an atrous convolution kernel to reduce the number of parameters while keeping the receptive field unchanged. Ma et al. [47] suggested a compact detection model, which uses lasso regularization to set the unimportant feature parameters to zero, thereby greatly reducing the parameters of You Only Look Once V4 (YOLOV4).
To deal with SAP image noise and background interference, incorporating attention mechanisms into SAR ship detection has been suggested. For example, Cui et al. [48] proposed a densely attentive pyramid network that embeds CBAM into FPN to weigh feature maps of different scales, highlighting ship features. Zhang et al. [49] proposed replacing traditional convolutions in CBAM with dilated convolutions to suppress background information while reducing the number of parameters. Wang et al. [50] integrated the Spatial Shuffle-Group Enhance attention module into the target detection network to alleviate interference from complex environments. Yang et al. [51] introduced the Coordinate Attention Module, which decodes features into one-dimensional vertical and horizontal features using two global pooling operations, suppressing clutter while further focusing on the ship position information. Since attention mechanisms suppress non-ship information in the image by assigning different region weights to feature maps, the correctness of weight generation has a significant impact on ship detection performance. However, the initial design of attention mechanisms such as CBAM was aimed at optical images and did not consider the influence of complex background information and large amounts of noise in SAR images on weight generation.
To address the problem of multi-scale ship detection, researchers have proposed approaches that focus on feature fusion or increasing the receptive field of the detection model. For example, Li et al. [52] proposed a Hierarchical Selective Filtering (HSF) layer to extract feature maps using three convolution kernels of different sizes. This design is similar to SPP, which increases the receptive field of the ship detection model. Zhu et al. [53] introduced FPN into the SAR ship detection model. Zhang et al. [54] proposed four different feature fusion methods based on FPN to alleviate the conflict between ship semantic information and position information in convolutional neural networks. Gao et al. [55] improved Path Aggregation Network (PANet). First, the feature fusion network was used to fuse the three-layer features of the backbone output. Then the information between different feature layers was further fused through variable convolution. However, these feature fusion methods only directly add adjacent features without considering the contribution of different input features to the output feature. Therefore, more sophisticated feature fusion methods are needed to improve the performance of the model.
Based on the above analysis, this paper first constructs Pooling Pyramid Attention Module (PPAM) from the perspective that attention mechanisms such as CBAM, SSE, and CAM do not consider the impact of non-ship information in SAR images on weight generation. Secondly, the Adaptive Feature Balancing Module (AFBM) is constructed to address the problem that FPN and other feature fusion methods directly combine adjacent features without considering different contributions of input features to the output feature. In addition, to further enhance the ship detection ability of the model for multi-scale ships, the Atrous Spatial Pyramid Pooling (ASPP) structure is introduced. Finally, we combine these three modules with CSPDarknet53 to build a multi-scale ship detection model for SAR complex backgrounds called Pyramid Pooling Attention Network (PPA-Net). The main contributions of this paper are as follows:
(1)
By analyzing the limitations of existing attention mechanisms in SAR ship detection, we propose a new attention module called PPAM. This module utilizes a pooling structure to reduce the impact of noise and background information on weight generation. Correct weight generation is more conducive to the suppression of noise and background information by attention mechanisms;
(2)
We designed AFBM, in which we propose using adaptive weighted feature fusion to selectively utilize semantic and positional information contained in different feature layers to improve the performance of the ship detection model;
(3)
An ASPP is introduced to enrich the receptive field while reducing information loss. This structure is particularly adapted to the detection of multi-scale ships.
The rest of the paper is structured as follows. Section 2 presents the materials and methods principles, Section 3 reports the experiments and comparisons with previous works, Section 4 discusses the experiments. Finally, Section 5 summarizes the paper and suggests directions for future work.

2. Materials and Methods

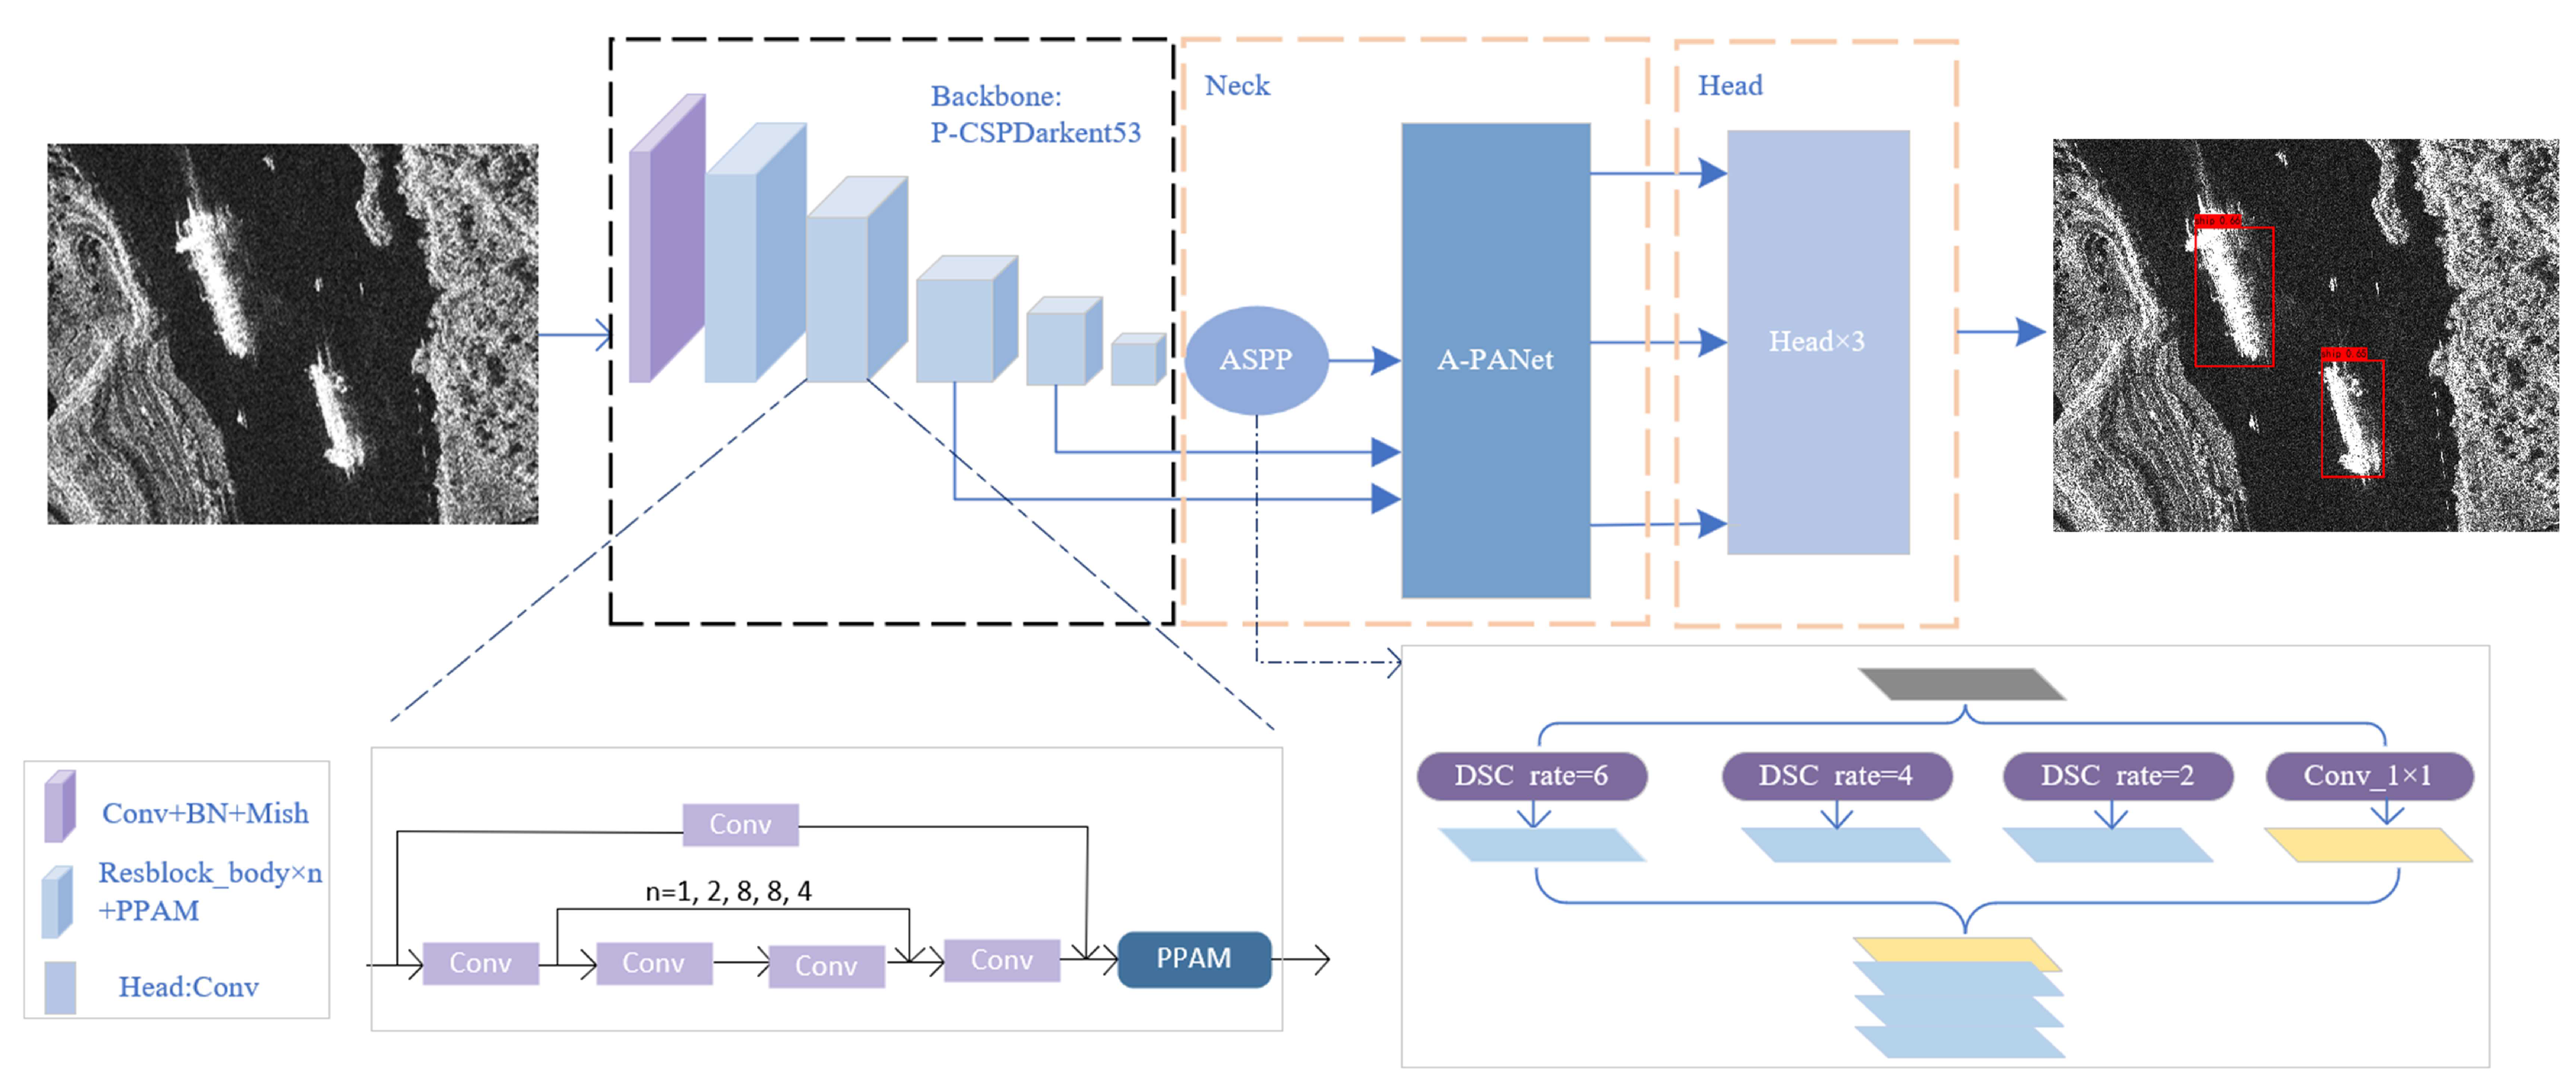
As shown in Figure 1, PPA-Net consists of three parts: the backbone structure, the neck structure, and the head structure. The workflow can be divided into three stages. Firstly, the sub-scenes SAR images are input into the backbone structure composed of CSPDarknet53 and PPAM for feature extraction. CSPDarknet53 includes one CBM (Conv + BN + Mish) block and 5 Resblock_body, which contain a large residual edge and small residual edges. The introduction of residual edges can effectively prevent the loss of information of small targets. In addition, to better suppress non-ship features in SAR images, we insert a PPAM after each Resblock_body. PPAM is a newly designed attention module used to suppress the influence of noise and background information in SAR images. Unlike previous works, when designing PPAM, we consider the influence of noise and background information in SAR images on the generation of attention mechanism weights. Next, the feature map obtained after feature extraction is optimized by AFBM and ASPP. AFBM is a feature fusion module designed to fully combine the semantic and positional information of ships. ASPP captures multi-scale ship information in the image through dilated convolutions with different dilation rates. Finally, the feature map optimized by ASPP and AFBM is further decoded by the head structure with convolution to generate the sub-scenes SAR images with annotation boxes.

2.1. Pooling Pyramid Attention Module (PPAM)

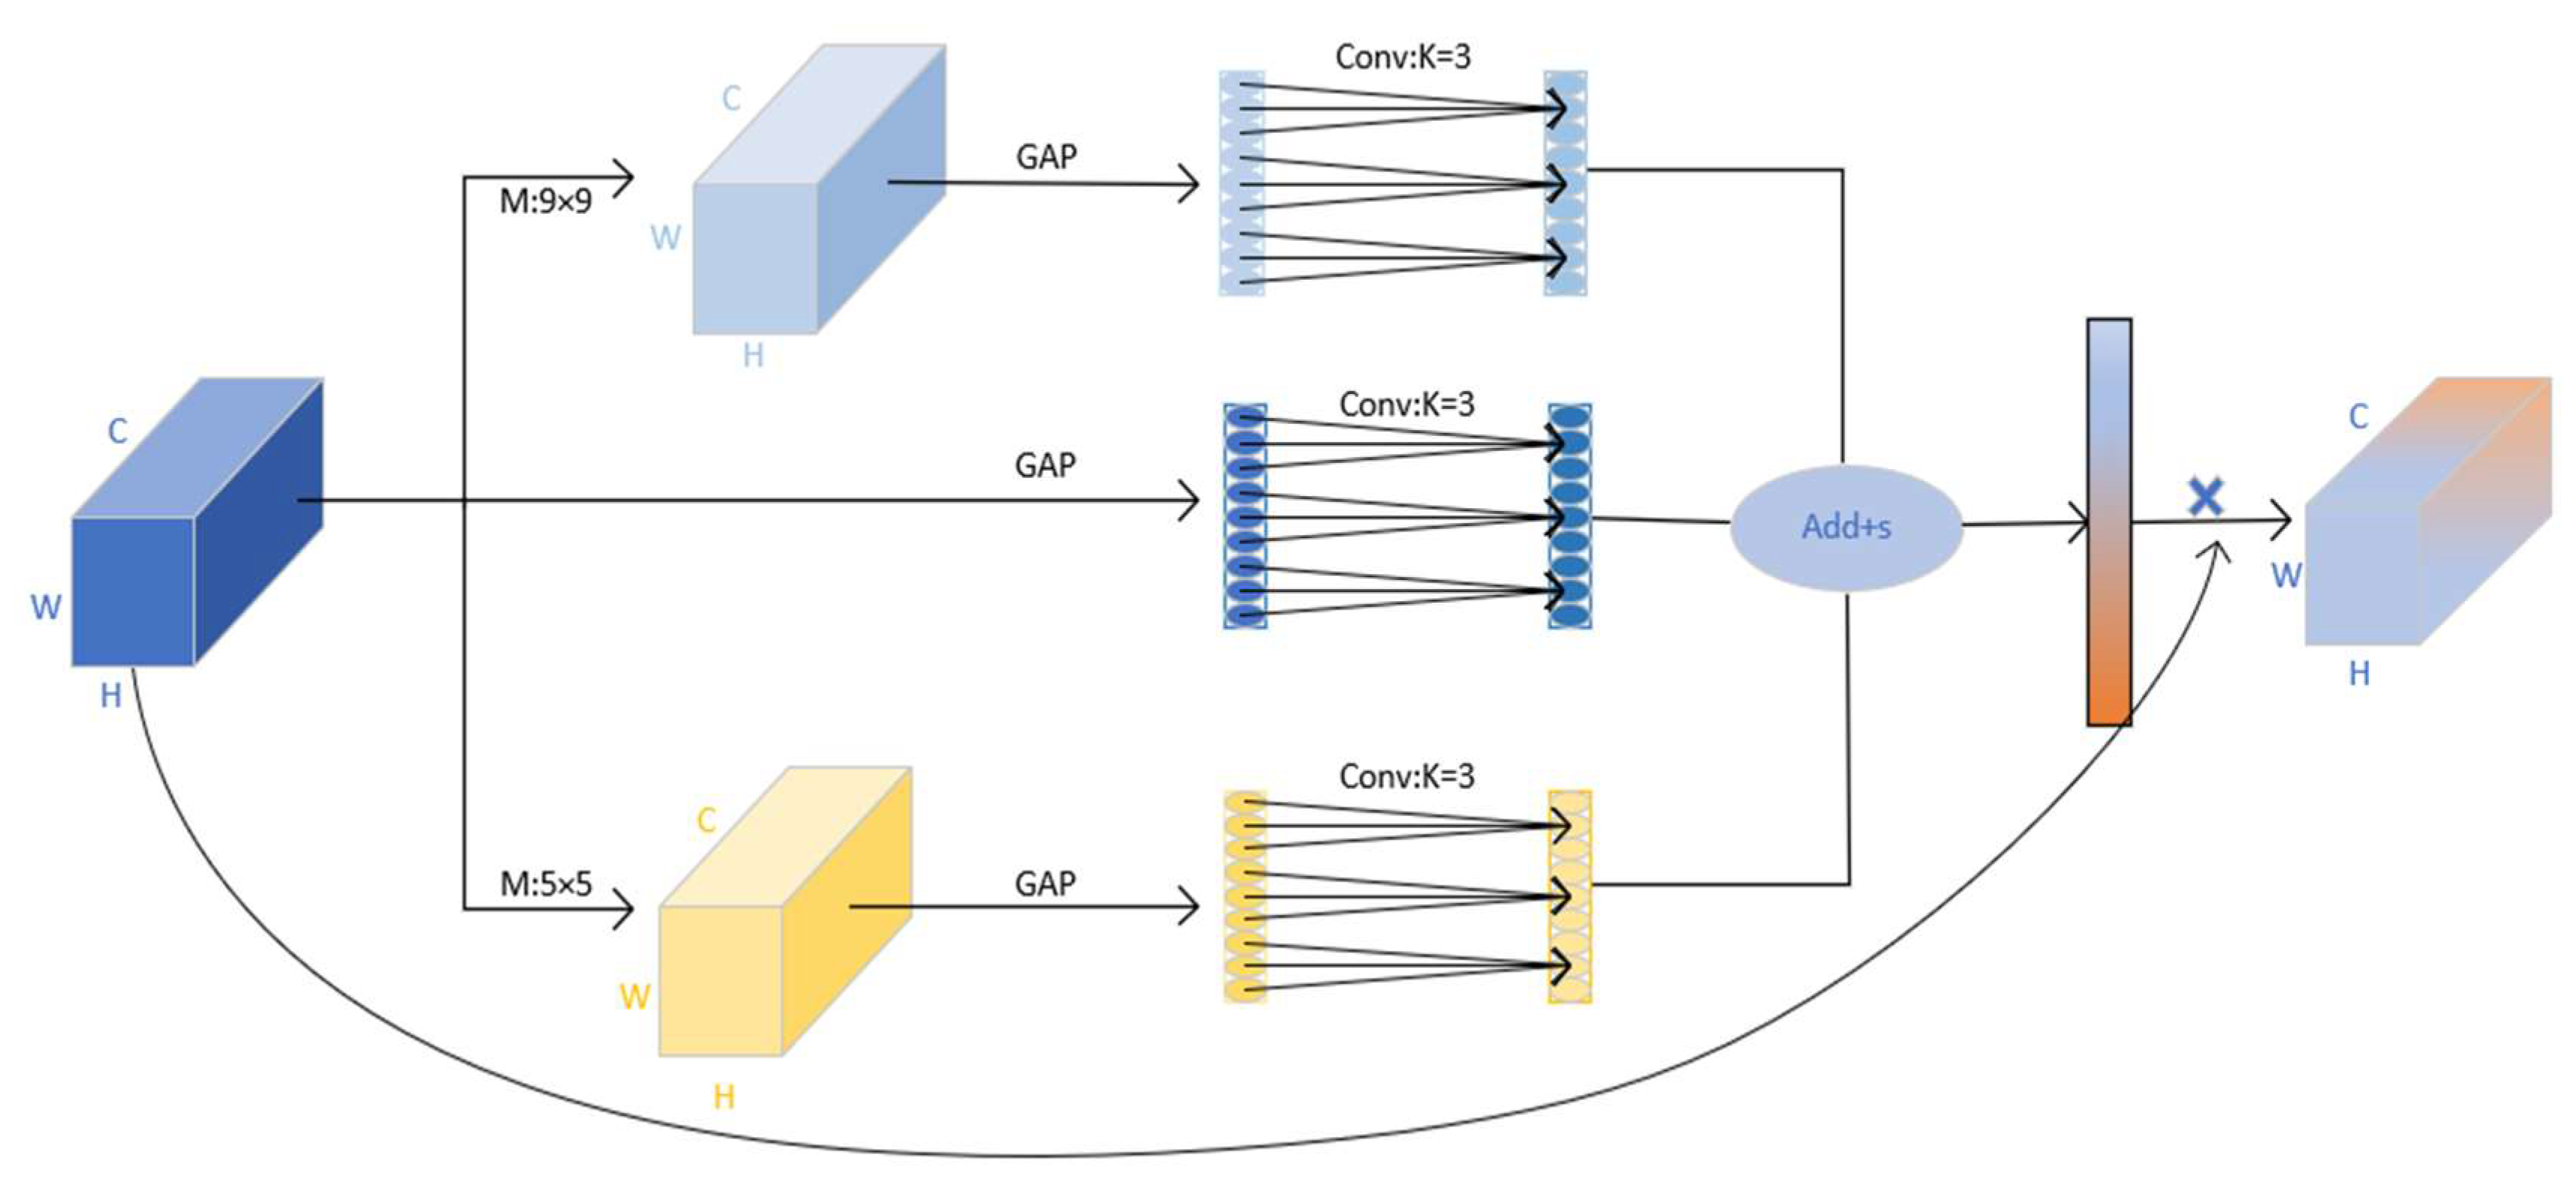
As the attention mechanism suppresses non-ship information in the image by assigning different area weights to the feature map, the correctness of weight generation has a significant impact on ship detection performance. However, the design of attention mechanisms such as CBAM did not consider the influence of complex background information and a large amount of noise in SAR images on weight generation. To address this issue, we have enhanced the previous attention mechanism by incorporating saliency cues of ships in SAR images. The overall structure of the introduced PPAM is shown in Figure 2. In this module, firstly, the pooling layer is used to augment the contrast between the ship and background information; secondly, the feature dimension is reduced by means of global average pooling, then the convolution operation is applied to obtain the weights of the three branches; and finally, the final channel weights are obtained by Sigmoid activation function. We use pooling cores of different sizes to construct three parallel branches with different fields of view, which makes PPAM more suitable for multi-scale ship detection.

2.1.1. Suppression of Background Information in the Channel

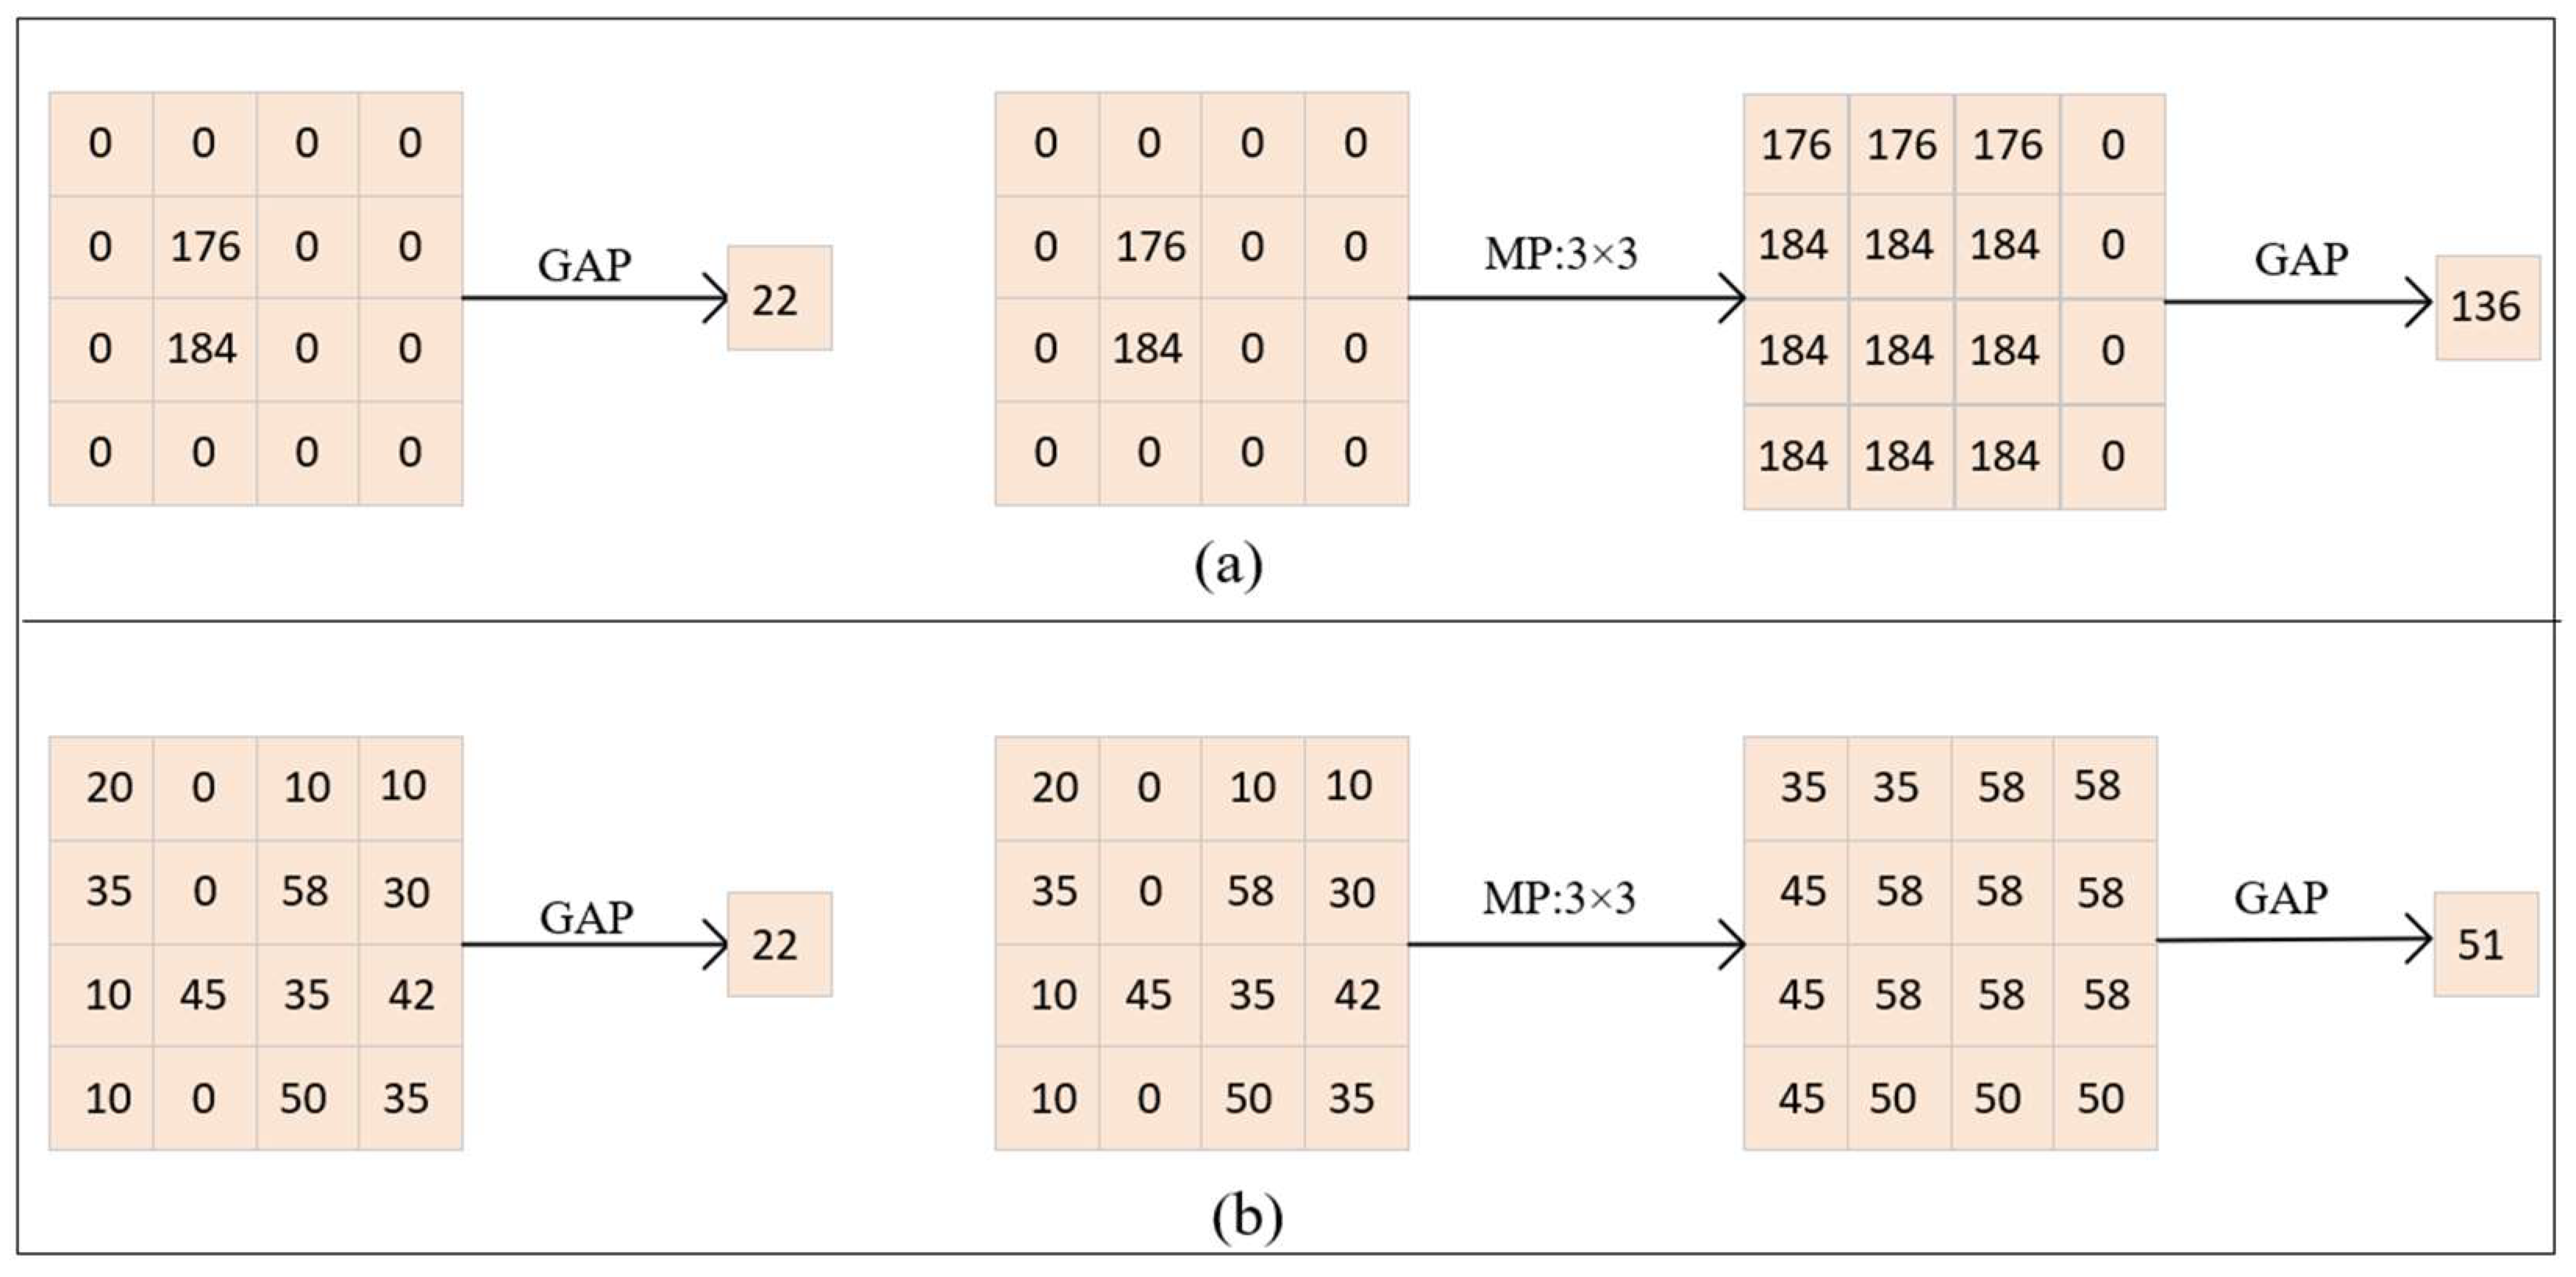
In mechanisms such as CBAM and SE that have previously gained attention, the input feature first reduces the feature dimension through the pooling layer, and then obtains the channel weight through the convolution layer or the fully connected layer. However, this weight generation method suffers from several limitations. That is, the information contained in the channel with a large amount of background information and the channel with ship information may become the same after global average pooling, which will make it difficult for the attention mechanism to distinguish the channel conducive to ship identification. Besides the shipping area, coast and noise areas might appear in SAR images, but the scattering intensity of these areas is usually weaker than that of the target area. This leads us to apply the max pooling operation to elevate the difference between background and object information. Shown in Figure 3a,b are two different channels. Based on the saliency of ships in SAR images, we assume that in the channel, values lower than 100 denote background features, and values greater than 100 denote the ship features. It can be seen that only ship features appear in Figure 3a and only background features appear in Figure 3b, but both contain the same eigenvalues after global average pooling. Therefore, it is difficult for the neural network to learn the correct weight. We added max pooling before global average pooling to effectively enhance differences in the information contained between the two.

2.1.2. Weight Generation

We apply one-dimensional convolution to replace the fully connected layer in the previous attention mechanism. K adjacent channels are selected to calculate the weight of the attention mechanism. The K value can be calculated as follows:
K = log 2 C 2 + 1 o d d ,
where K is the nearest odd number to |k| and C is the number of channels that input the feature graph.
Let X i R W × H × C be the output after the ith pooled operation, where W, H and C are width, height, and channel dimensions, respectively. Accordingly, the weights of channels in the PPAM block can be computed as:
ω = σ ( i = 1 3 C o n v k ( g ( X i ) ) ) ,
where g ( X i ) = 1 W × H w = 1 , h = 1 W , H ( X i ) w , h is channel-wise global average pooling (GAP) and σ is a Sigmoid function; C o n v k represents the convolution operation with convolution kernel size K.

2.2. Adaptive Feature Balancing Module (AFBM)

In a convolutional neural network, deep features embed rich semantic information, while shallow features have better location information. Therefore, a feature fusion module is added to most ship detection models to improve ship detection. FPN and PANet are often added to SAR ship detection models as classic feature fusion modules. FPN introduced the concept of feature fusion, which uses feature fusion from top to bottom to better detect target features. However, as the feature fusion path is too long, bottom information cannot be fully utilized; therefore, PANet has improved it. Compared with FPN, PANet adds an additional feature fusion path from the bottom to the top, alleviating the loss of feature information (Figure 4).
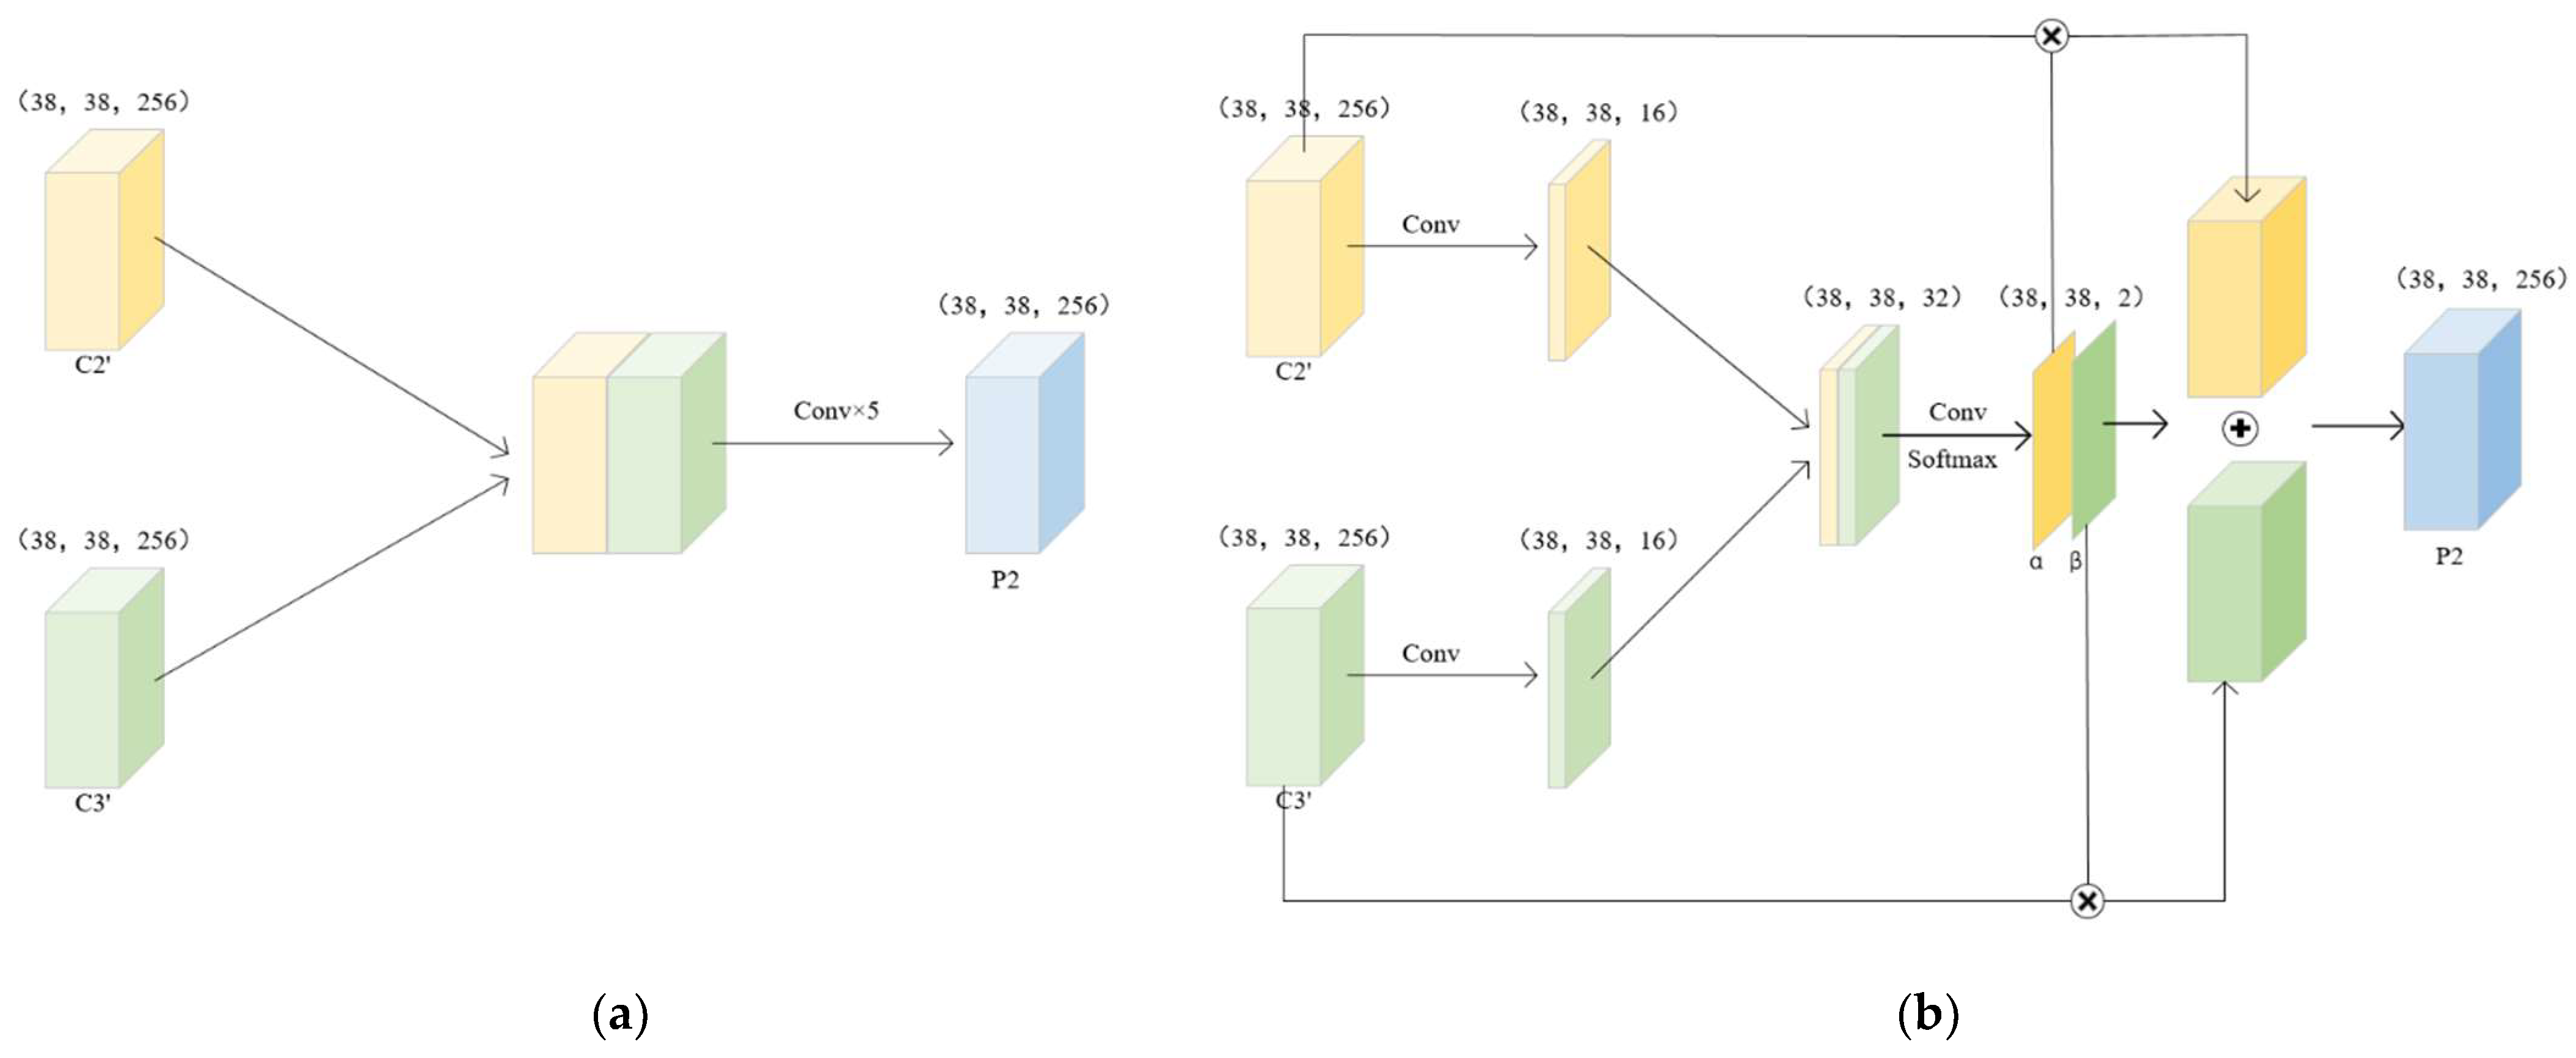
Although FPN and PANet improve the accuracy of ship detection, they only directly fuse the two adjacent feature layers after adjusting the dimensions (as shown in Figure 5a) without considering their contribution to the output. Therefore, we proposed an adaptive weighted feature fusion method and designed AFBM (shown in Figure 5b) based on PANet.
The overall workflow of AFBM is shown in Figure 5b, which can be divided into two stages: the first stage generates fusion weights α and β, while the second stage generates the fused output feature. In the first stage, the channel numbers of the two features to be fused (C2′ and C3′) are adjusted to 16 using a 1 × 1 convolution. Then, the two features with adjusted channel numbers are superimposed. Further, the relationship between the channel of the superimposed feature is established through convolution, and the channel number is adjusted to 2. Finally, the function Softmax function is used to generate the fusion weights α and β from the two channels. The generation of output feature P2 in the second stage is as follows:
P 2 = C 2 · α + C 3 · β ,
where C2′ and C3′ are the two adjacent input features, and α and β are the weights of the features learned by the convolutional neural network.
Compared with PANet, AFBM not only considers the degree of contribution of different feature layers to the output, but also omits the process of repeatedly adjusting the number of channels using five convolutional layers.

2.3. Atrous Spatial Pyramid Pooling (ASPP)

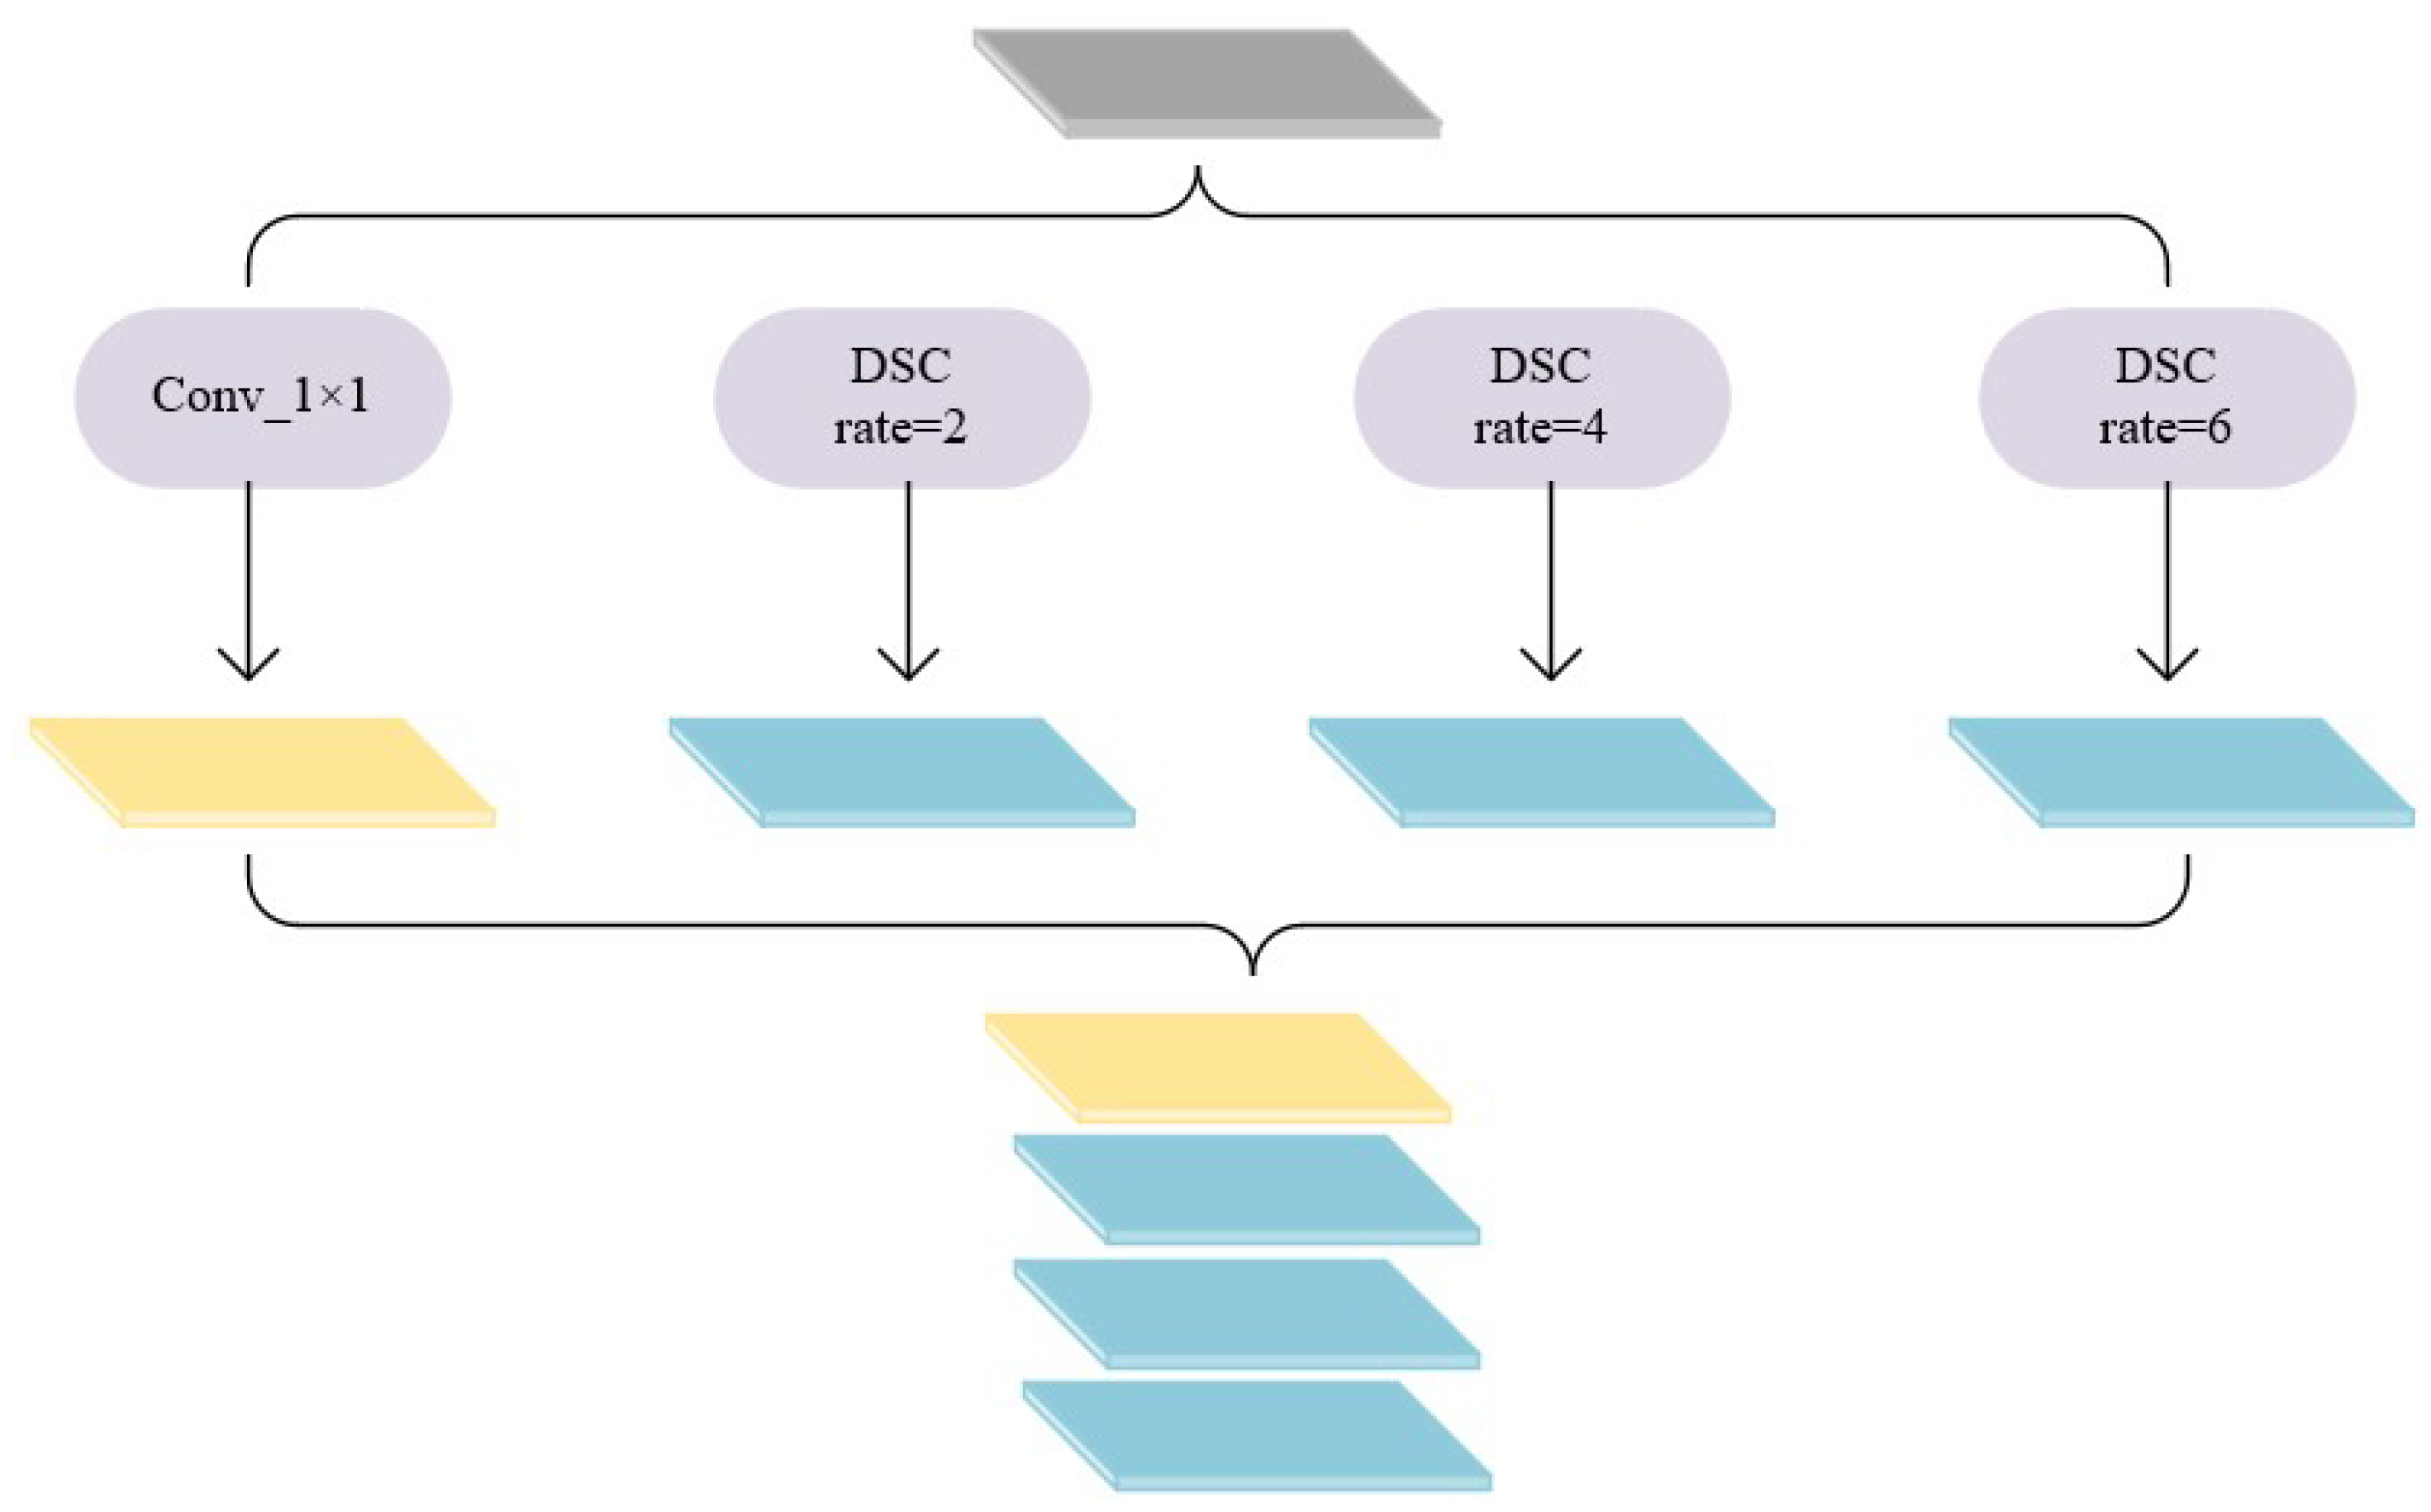
Detection capabilities of SAR ship detection models should consider variable ship sizes. To enhance the multi-scale ship detection capability of the ship detection model while reducing the loss of feature information, we introduce the ASPP module, as shown in Figure 6. The module has four parallel branches. The four branches contain three atrous convolutions with different dilation rates (rate = 2, 4, 6) and one regular convolution (kernel size = 1). Compared with pooling, atrous convolution has less information loss while obtaining different receptive field information. We apply this with normal convolutions to further integrate the semantic information of the input features. Finally, to make the output features retain as much receptive field information as possible, we further stack the output features of the four branches.
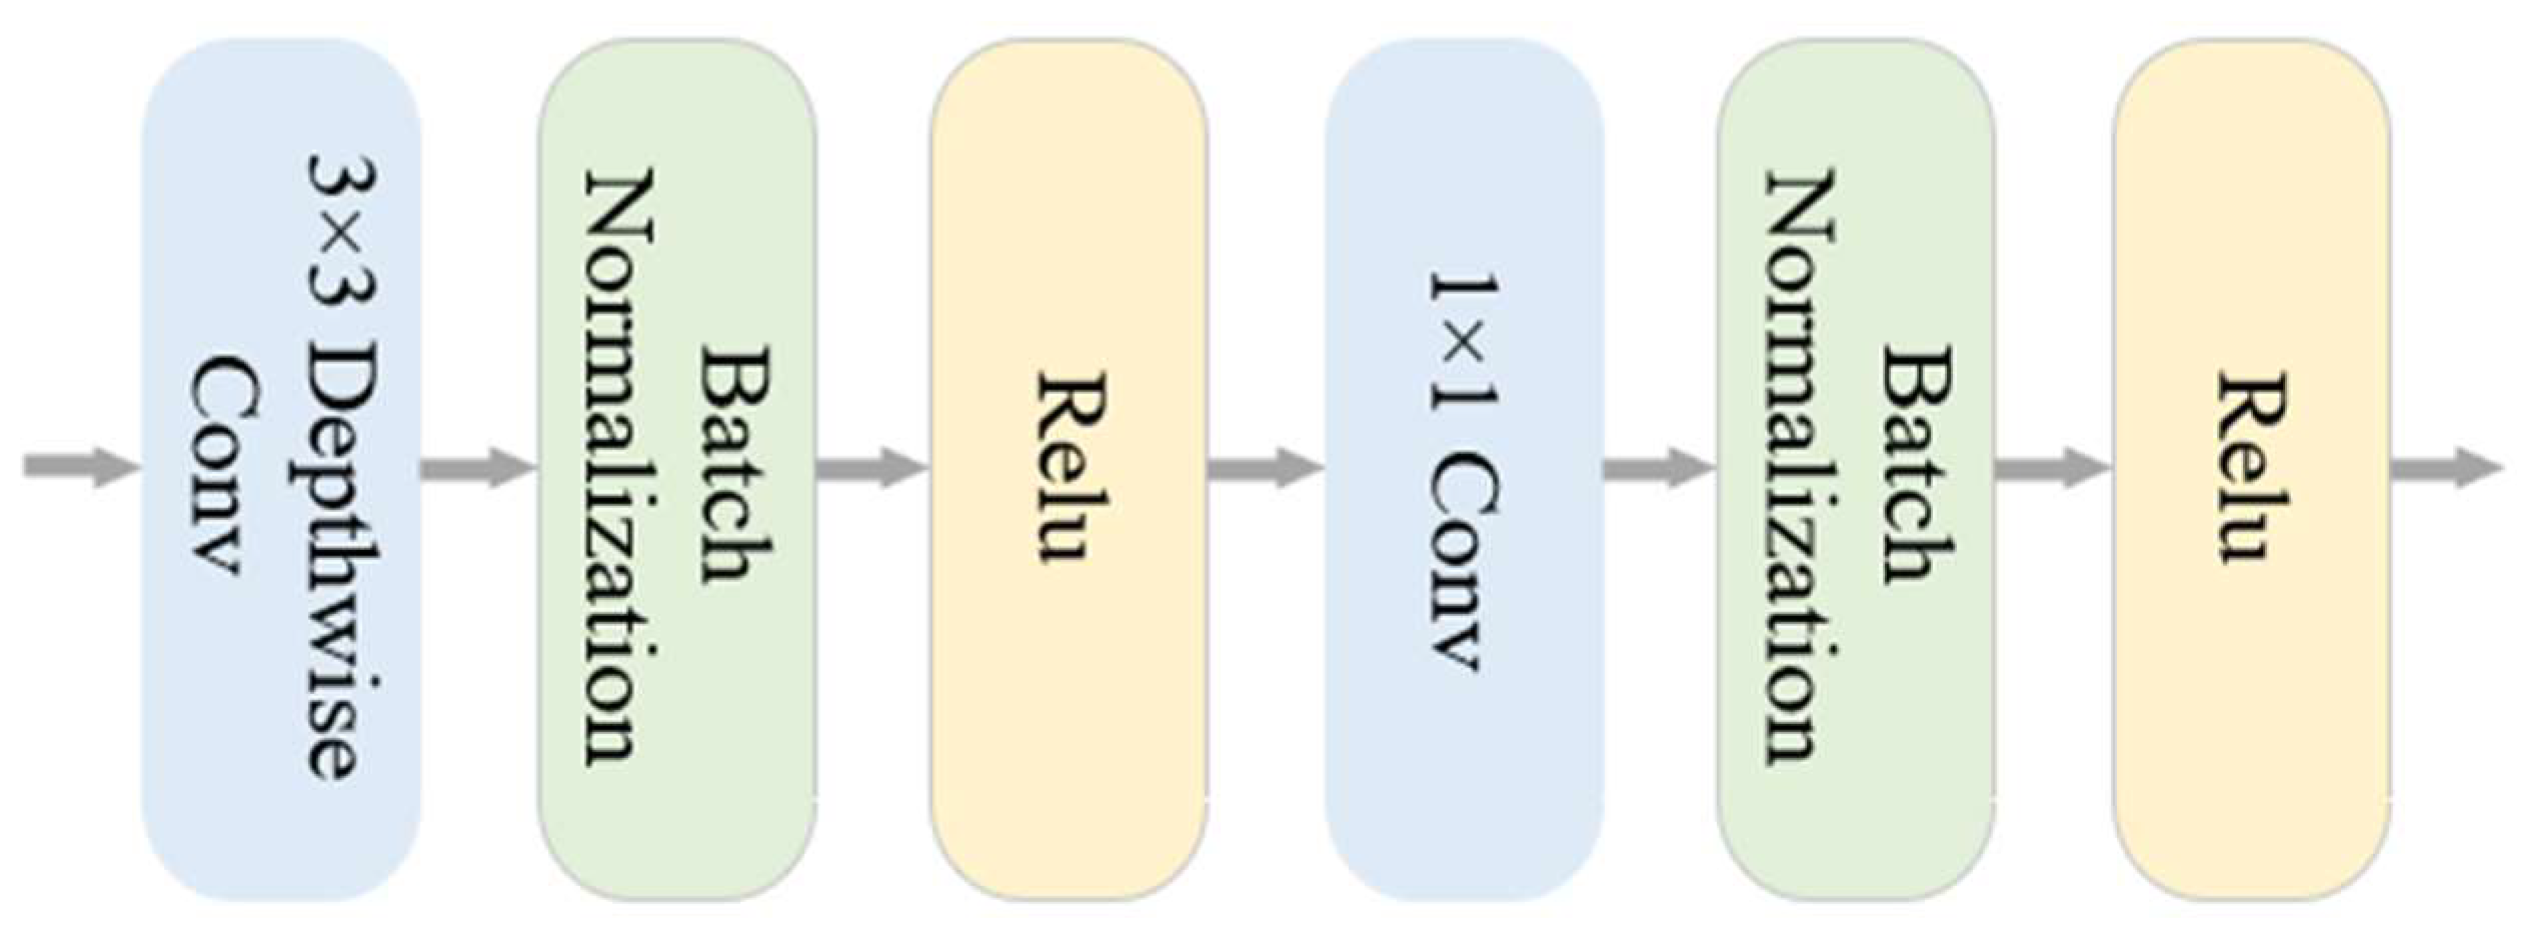
The introduction of parallel convolutional layers in the ASPP module increases the number of network parameters; therefore, to reduce the number of parameters, we introduce a Depthwise Separable Convolution (DSC) to decode ship location (Figure 7). DSC divides the traditional convolution process into regional convolution and inter-channel convolution. The regional convolution extracts the features of each channel of the feature layer, and the inter-channel convolution uses a 1 × 1 convolution kernel to integrate these feature channels. The Batch Normalization prevent the ship detection model from overfitting. The activation function increases the nonlinear expression ability of convolutional neural network.

3. Results

This section describes the experiments conducted to verify the effectiveness of PPA-Net. Firstly, the SAR ship dataset and hardware configuration used in the experiments are introduced. A series of ablative experiments were carried out, and the results were described. Finally, the proposed ship detection model was compared with previous algorithms on the SSDD and HRSID datasets. Through the analysis and comparison of the experimental results, the feasibility of the designed ship detection model was verified.

3.1. Dataset Introduction and Experimental Configuration

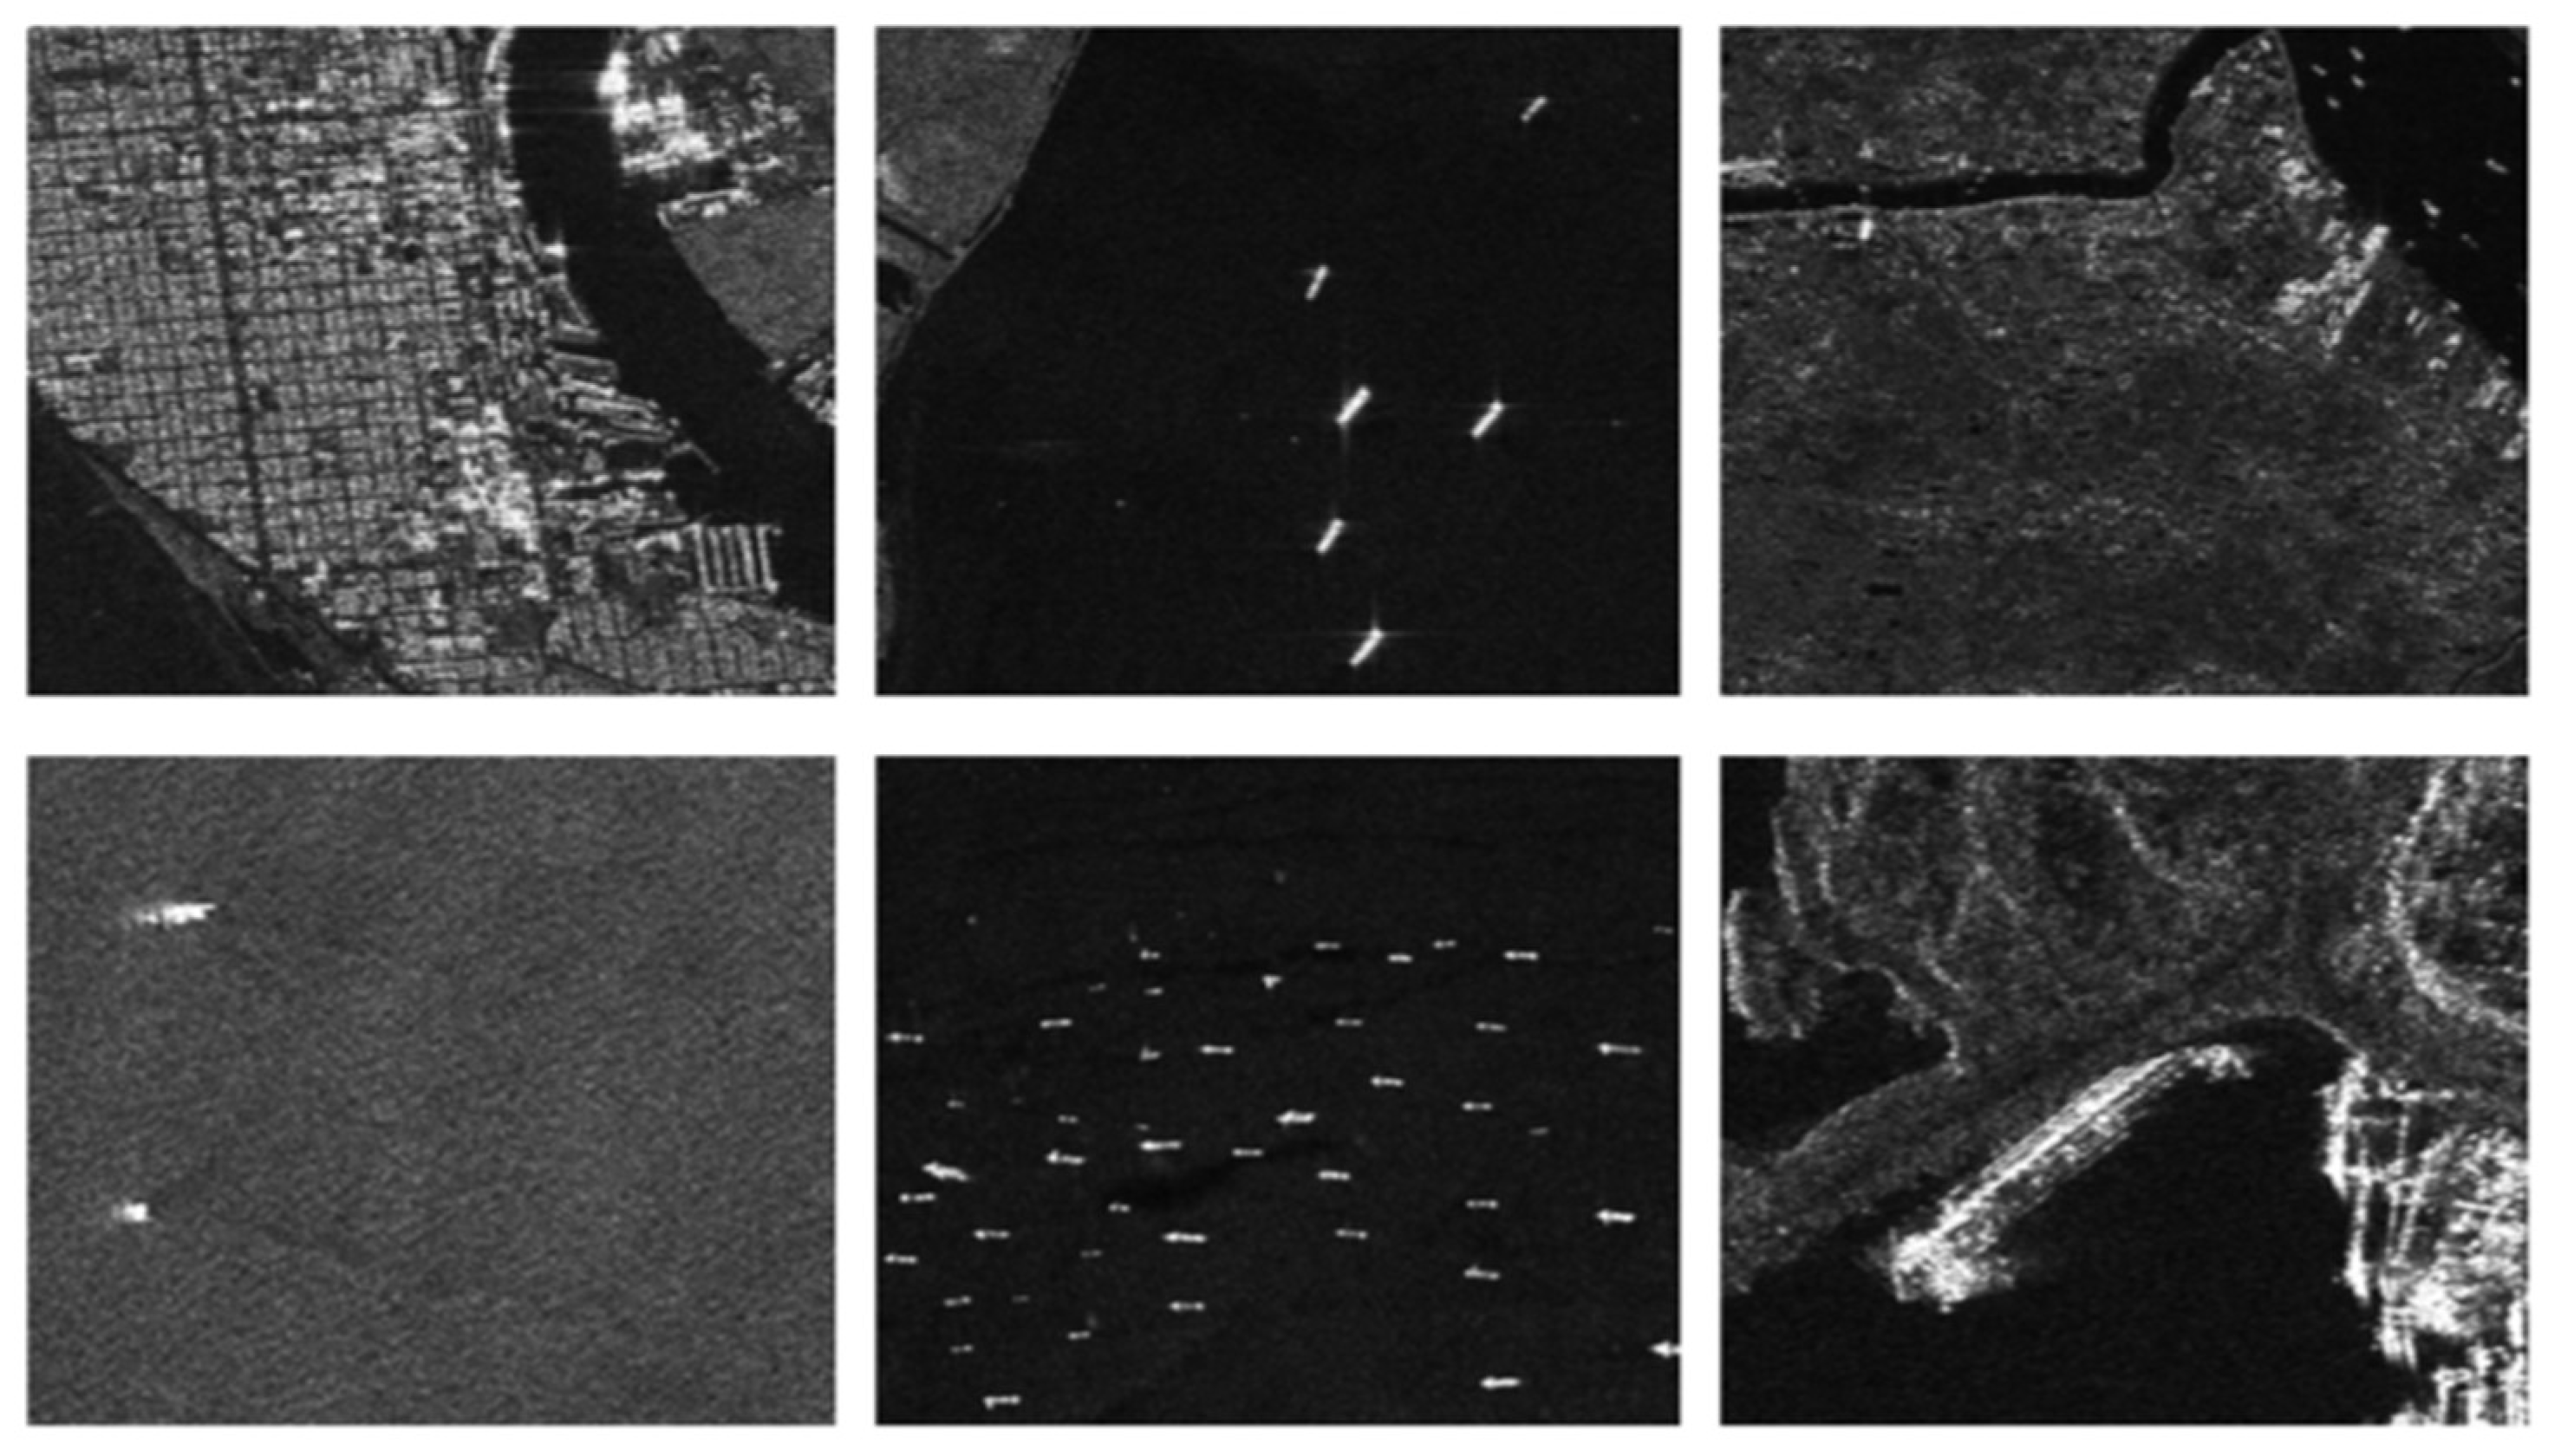
SSDD is the first widely used dataset for performance evaluation of ship detection models in the SAR ship detection field. The dataset is made up of ship images captured by synthetic aperture radar (SAR) using different polarization modes and created by professionals familiar with radar principles, target recognition and tagging tools. The dataset includes 1160 SAR images, covering ships of various sizes ranging from a few to hundreds of pixels, and 2578 ships distributed in various sea conditions. Therefore, in this experiment, SSDD is used as one of the datasets to evaluate the performance of PPA-Net. The images in the SSDD dataset are captured by synthetic aperture radars of different satellites, such as Radarsat-2, TerraSAR-X, and Sentinel-1, and include four polarization modes: HH, HV, VV, and VH. Some of the images in SSDD are shown in Figure 8.
In recent years, HRSID has also been frequently used to evaluate the performance of ship detection models in SAR ship detection field. HRSID is constructed using synthetic aperture radar with Sentinel-1 and TerraSAR-X, and includes three polarizations: HH, HV, and VV. HRSID contains a total of 5604 SAR images and 16,951 ships, and the images in the dataset are cropped to 800 × 800 pixels, which is more convenient for model training. In addition, compared to SSDD, HRSID contains more data, which can lead to better training of deep learning-based ship detection models. Some SAR images from HRSID are shown in Figure 9.
Ship targets from the dataset are classified into large, medium, and small objects based on the proportion of object detection in MS COCO (Microsoft coco: Common Objects in Context) [56]. Bounding boxes with an area smaller than 32 × 32 pixels correspond to small objects, those with an area between 32 × 32 pixels and 96 × 96 pixels correspond to medium objects, and those with an area larger than 96 × 96 pixels correspond to large objects. Statistical data of the SSDD and HRSID datasets are shown in Table 1.
We ensured the fairness and effectiveness of our experiments in three aspects: hardware configuration, hyperparameter setting of the ship detection model, and dataset configuration.
(1)
Hardware configuration: All our experiments were conducted on Windows 10 with Pytorch 1.10, CUDA11.5, and RTX3090 with 24 GB of memory;
(2)
During the training process, a learning rate of 0.01 and a batch size of 32 were used for all model training. The training was carried out iteratively for 300 rounds;
(3)
The experiments were conducted on the SSDD and HRSID datasets, respectively. We randomly divided the SSDD and HRSID datasets into training and testing sets in an 8:2 ratio. Specifically, the SSDD dataset contains 1160 images, with 928 images used for training and 232 images used for testing. The HRSID dataset contains 5604 images, with 4483 images used for training and 1121 images used for testing. The partitioning of the datasets ensures that the images used for training the models are not used for testing them. Additionally, the evaluation of all ship detection models was conducted on the aforementioned partitioned datasets, where all models used the same training and testing data. This ensures that all models were trained on the same data and tested on the same data.
To evaluate the performance of different methods, we used average precision (AP) as the main evaluation metric. Precision (P), recall (R), and F1 score were used as auxiliary evaluation metrics.

3.2. Ablation Experiment and Module Performance Analysis

To evaluate the effectiveness of the three modules, we conducted ablation experiments on PPA-Net by removing each module and using it as a baseline to demonstrate the impact of different combinations of these modules on ship detection. The experimental results are shown in Table 2.

3.2.1. PPAM

PPAM was added separately to the backbone of the baseline to suppress the impact of noise in SAR images on ship feature extraction. As shown in the data in Table 2, the ship detection model with PPAM added achieved an improvement of 3.85% in AP, 4.74% in P, 2.55% in R, and 0.03 in F1 compared to the baseline.
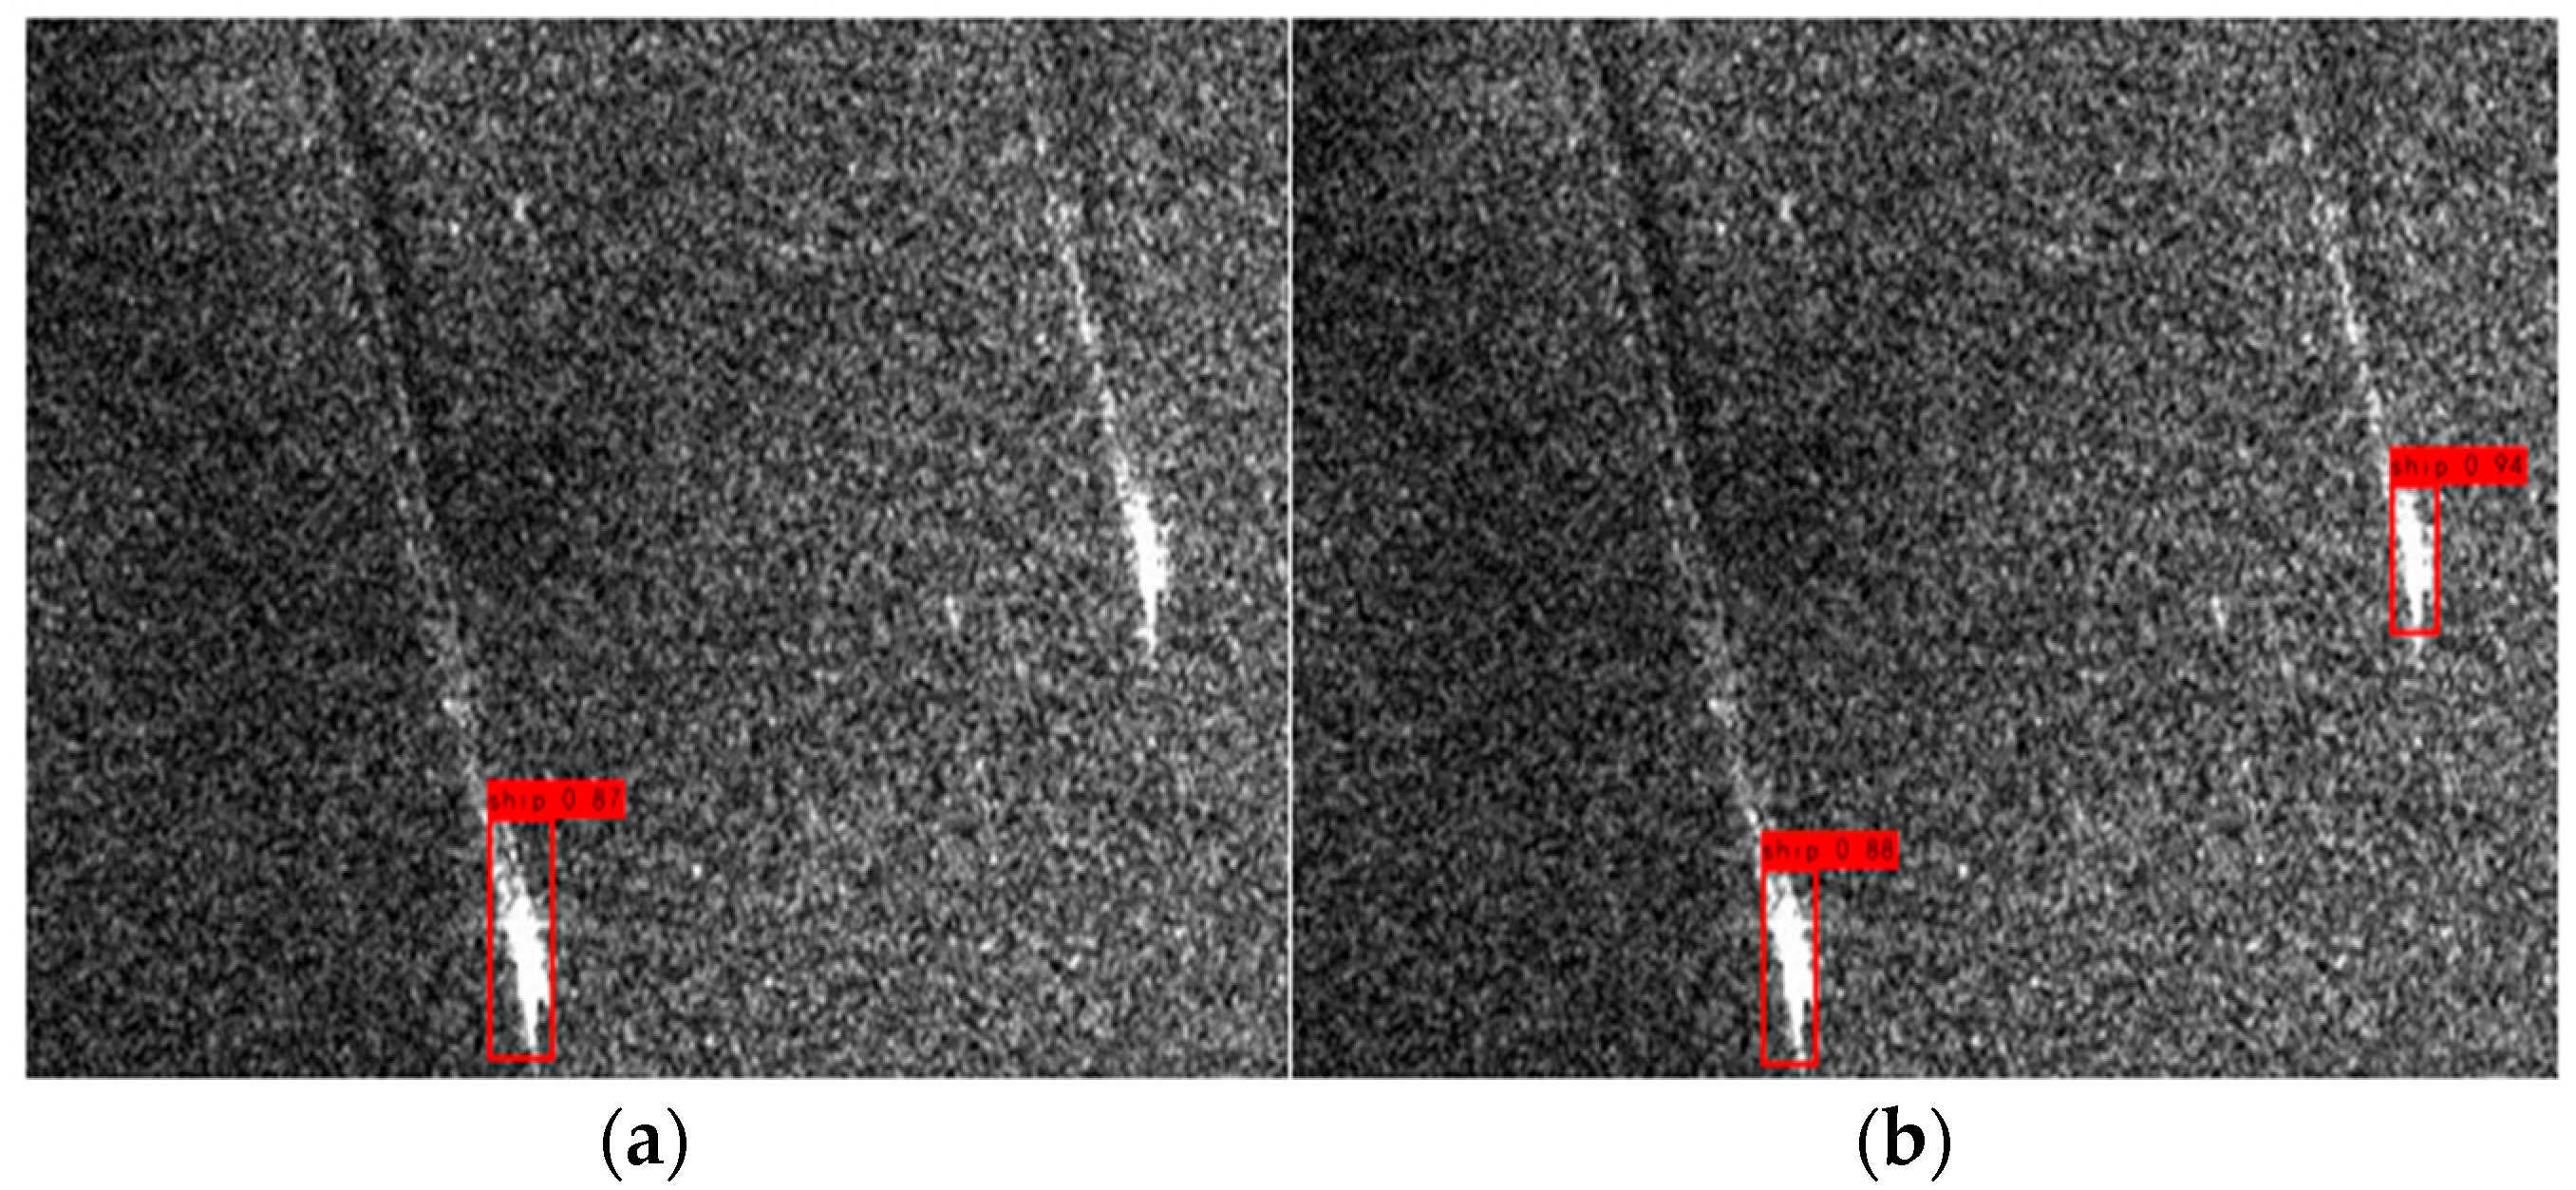
To illustrate the effectiveness of PPAM more intuitively, a visual comparison of the detection results is shown in Figure 10. The image in Figure 10 contains a large amount of noise, which leads to a smaller difference between ships and the surrounding background, affecting the feature extraction capability of the backbone of the ship detection model. As shown in Figure 10a, there are missed detections when using the baseline to detect ships, while the model with PPAM added in the baseline correctly detects the ship target, as shown in Figure 10b. This result further demonstrates the effectiveness of PPAM.

3.2.2. ASPP

To verify whether ASPP can enhance the ship detection model’s ability to detect multi-scale ships, we added ASPP separately to the baseline. As shown in Table 2, the ship detection model with ASPP added achieved an improvement of 3.4% in AP, 1.95% in P, 1.66% in R, and 0.01 in F1 compared to the baseline.
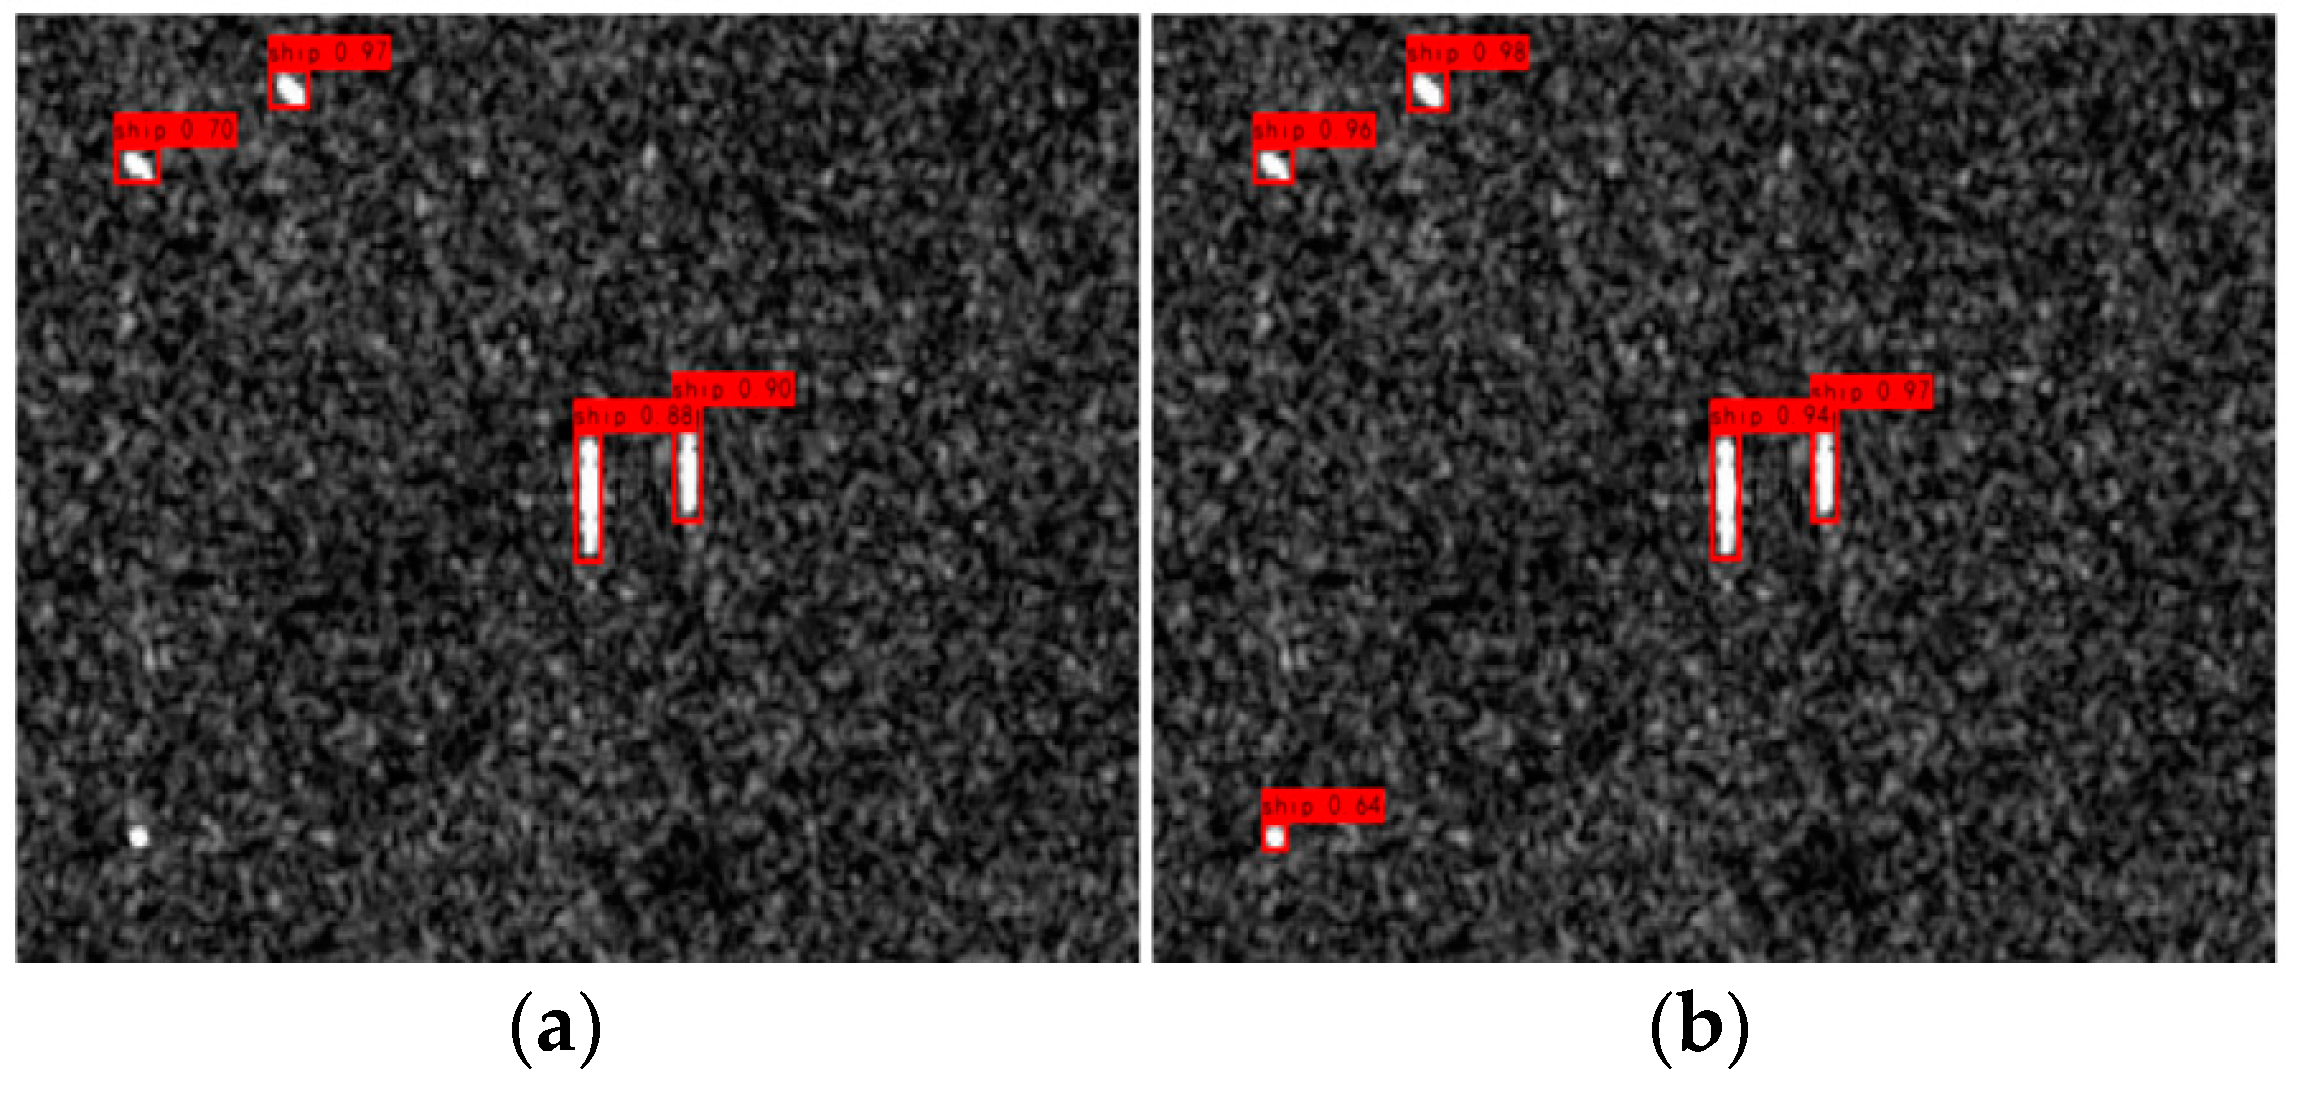
To further illustrate the effectiveness of the proposed ASPP module, a visual comparison of detection results is provided in Figure 11. The ships in this image vary slightly in scale, which greatly tests the model’s ability to detect different sizes of ships simultaneously. As shown in Figure 11a, in the baseline, the small ship in the lower left corner of the image is ignored because the model did not consider the detection of multi-scale ships. However, after adding ASPP to the baseline, the ship detection model correctly detects the ships (as shown in Figure 11b). This result further demonstrates that ASPP can enhance the ship detection model’s ability to detect multi-scale ships.

3.2.3. AFBM

To verify whether AFBM can improve the performance of the ship detection model, we added AFBM to the baseline model separately. As shown in Table 2, the ship detection model with AFBM achieved an increase of 4.5% in AP, 1.95% in P, 2.79% in R, and 0.03 in F1 compared to the baseline.
To further demonstrate the effectiveness of our AFBM, we provide visual comparisons of detection results in Figure 12. The image in Figure 12 contains a complex coastal environment, which poses a challenge for the ship detection model to have better robustness. As shown in Figure 12a, the baseline did not detect the ship in the image, but after adding AFBM to the model, the ship was correctly detected (as shown in Figure 12b). This fully demonstrates that our adaptive weighted feature fusion method, by balancing the language and location information of features, can enhance the performance of the ship detection model.

3.2.4. Combination of Different Modules

To investigate the potential negative impact of combining different modules on the ship detection model, we first added pairwise combinations of PPAM, ASPP, and AFBM modules to the baseline. As shown in Table 2, adding two modules simultaneously to the baseline led to a slight decrease in P compared to adding a single module. However, the combined use of two modules always outperformed the single use of any one module when considering the comprehensive evaluation metric AP. Finally, when all three modules were added to the baseline, AP increased by 4.96%, R increased by 4.66%, P increased by 7.75%, and F1 increased by 0.06%. The experiments combining different modules further validated the effectiveness of the three modules in enhancing the performance of the ship detection model.

3.3. Validation of Module Advancement

In this section, we conducted comparative experiments on the proposed PPAM and AFBM modules with commonly used attention and feature fusion modules in the SAR ship detection field on the SSDD dataset. The experimental results are shown in Table 3 and Table 4. Compared with CBAM, ECA, and SE, PPAM achieved improvements of 1.88%, 1.25%, and 1.33%, respectively, in terms of AP. In terms of P, PPAM achieved improvements of 1.74%, 2.96%, and 3.1%, respectively, compared with CBAM, ECA, and SE. Compared with CBAM, ECA, and SE, PPAM achieved improvements of −0.08%, 1.04%, and 0.89%, respectively, in terms of R. PPAM achieved improvements of 0.01, 0.02, and 0.01 in terms of F, respectively, compared with CBAM, ECA, and SE.
Compared with PANet and FPN, AFBM achieved improvements of 1.41% and 2.56%, respectively, in terms of AP. In terms of P, AFBM achieved improvements of 2.96% and 0.75%, respectively, compared with PANet and FPN. Compared with PANet and FPN, AFBM achieved improvements of 1.04 and 1.61%, respectively, in terms of R. PPAM achieved improvements of 0.01 and 0.01, respectively, in terms of F, compared with PANet and FPN.

3.4. Comparison with Other Advanced Ship Detection Models

In order to verify the effectiveness of PPA-Net for SAR ship detection, we conducted comparative tests with other advanced algorithms (YOLOV4, YOLOV5, HR-SDNet, DetNet). The comparative experiment was conducted on the SSDD and HRSID datasets, and the results are shown in Table 5 and Table 6. The experimental results on the SSDD dataset show that compared with YOLOV4, YOLOV5, HR-SDNet, and DetNet, PPA-Net improved the AP by 3%, 2.26%, 1.45%, and 2.51%, respectively. The precision was improved by 2.36%, 5.14%, 1.18%, and 1.68%, respectively, while the recall was improved by 6.87%, 4.58%, 1.01%, and 1.32%, respectively. The F1 score was improved by 0.05, 0.05, 0.01, and 0.04, respectively. The experimental results on the HRSID dataset show that compared with YOLOV4, YOLOV5, HR-SDNet, and DetNet, PPA-Net improved the AP by 7.56%, 3.34%, 2.62%, and 6.06%, respectively. The precision was improved by 4.44%, 4.68%, 1.69%, and 6.03%, respectively, while the recall was improved by 11.9%, 2.66%, 1.56%, and 7.56%, respectively. The F1 score was improved by 0.08, 0.05, 0.02, and 0.07, respectively.
To further ensure the reliability of the model performance, three additional experiments have been conducted on the SSDD dataset, and AP values were reported for all models in each experiment. We ensured that all models used the same training and testing sets for each experiment. The experimental results are shown in Table 7.
The superiority of PPA-Net over other ship detection models has been evaluated using multi-scale detection metrics for object detection in the MC COCO. These metrics are AP [IoU = 0.50:0.95] and AR [IoU = 0.50:0.95]. IoU = 0.50:0.95 represents the average precision and average recall at different IoU thresholds (ranging from 0.50 to 0.95 with an interval of 0.05). The experiment was conducted on the SSDD dataset, and the results are shown in Table 8. Compared with other object detection algorithms, PPA-Net achieved an improvement of 0.063–0.118 in detection precision and 0.042–0.073 in recall for small objects. For medium objects, PPA-Net achieved an improvement of 0.021–0.032 in detection precision and 0.043–0.056 in recall compared with other object detection algorithms. For large objects, PPA-Net achieved an improvement of 0.128–0.204 in detection precision and 0.015–0.024 in recall compared with other object detection algorithms.

3.5. Visualization Comparison of Detection Results

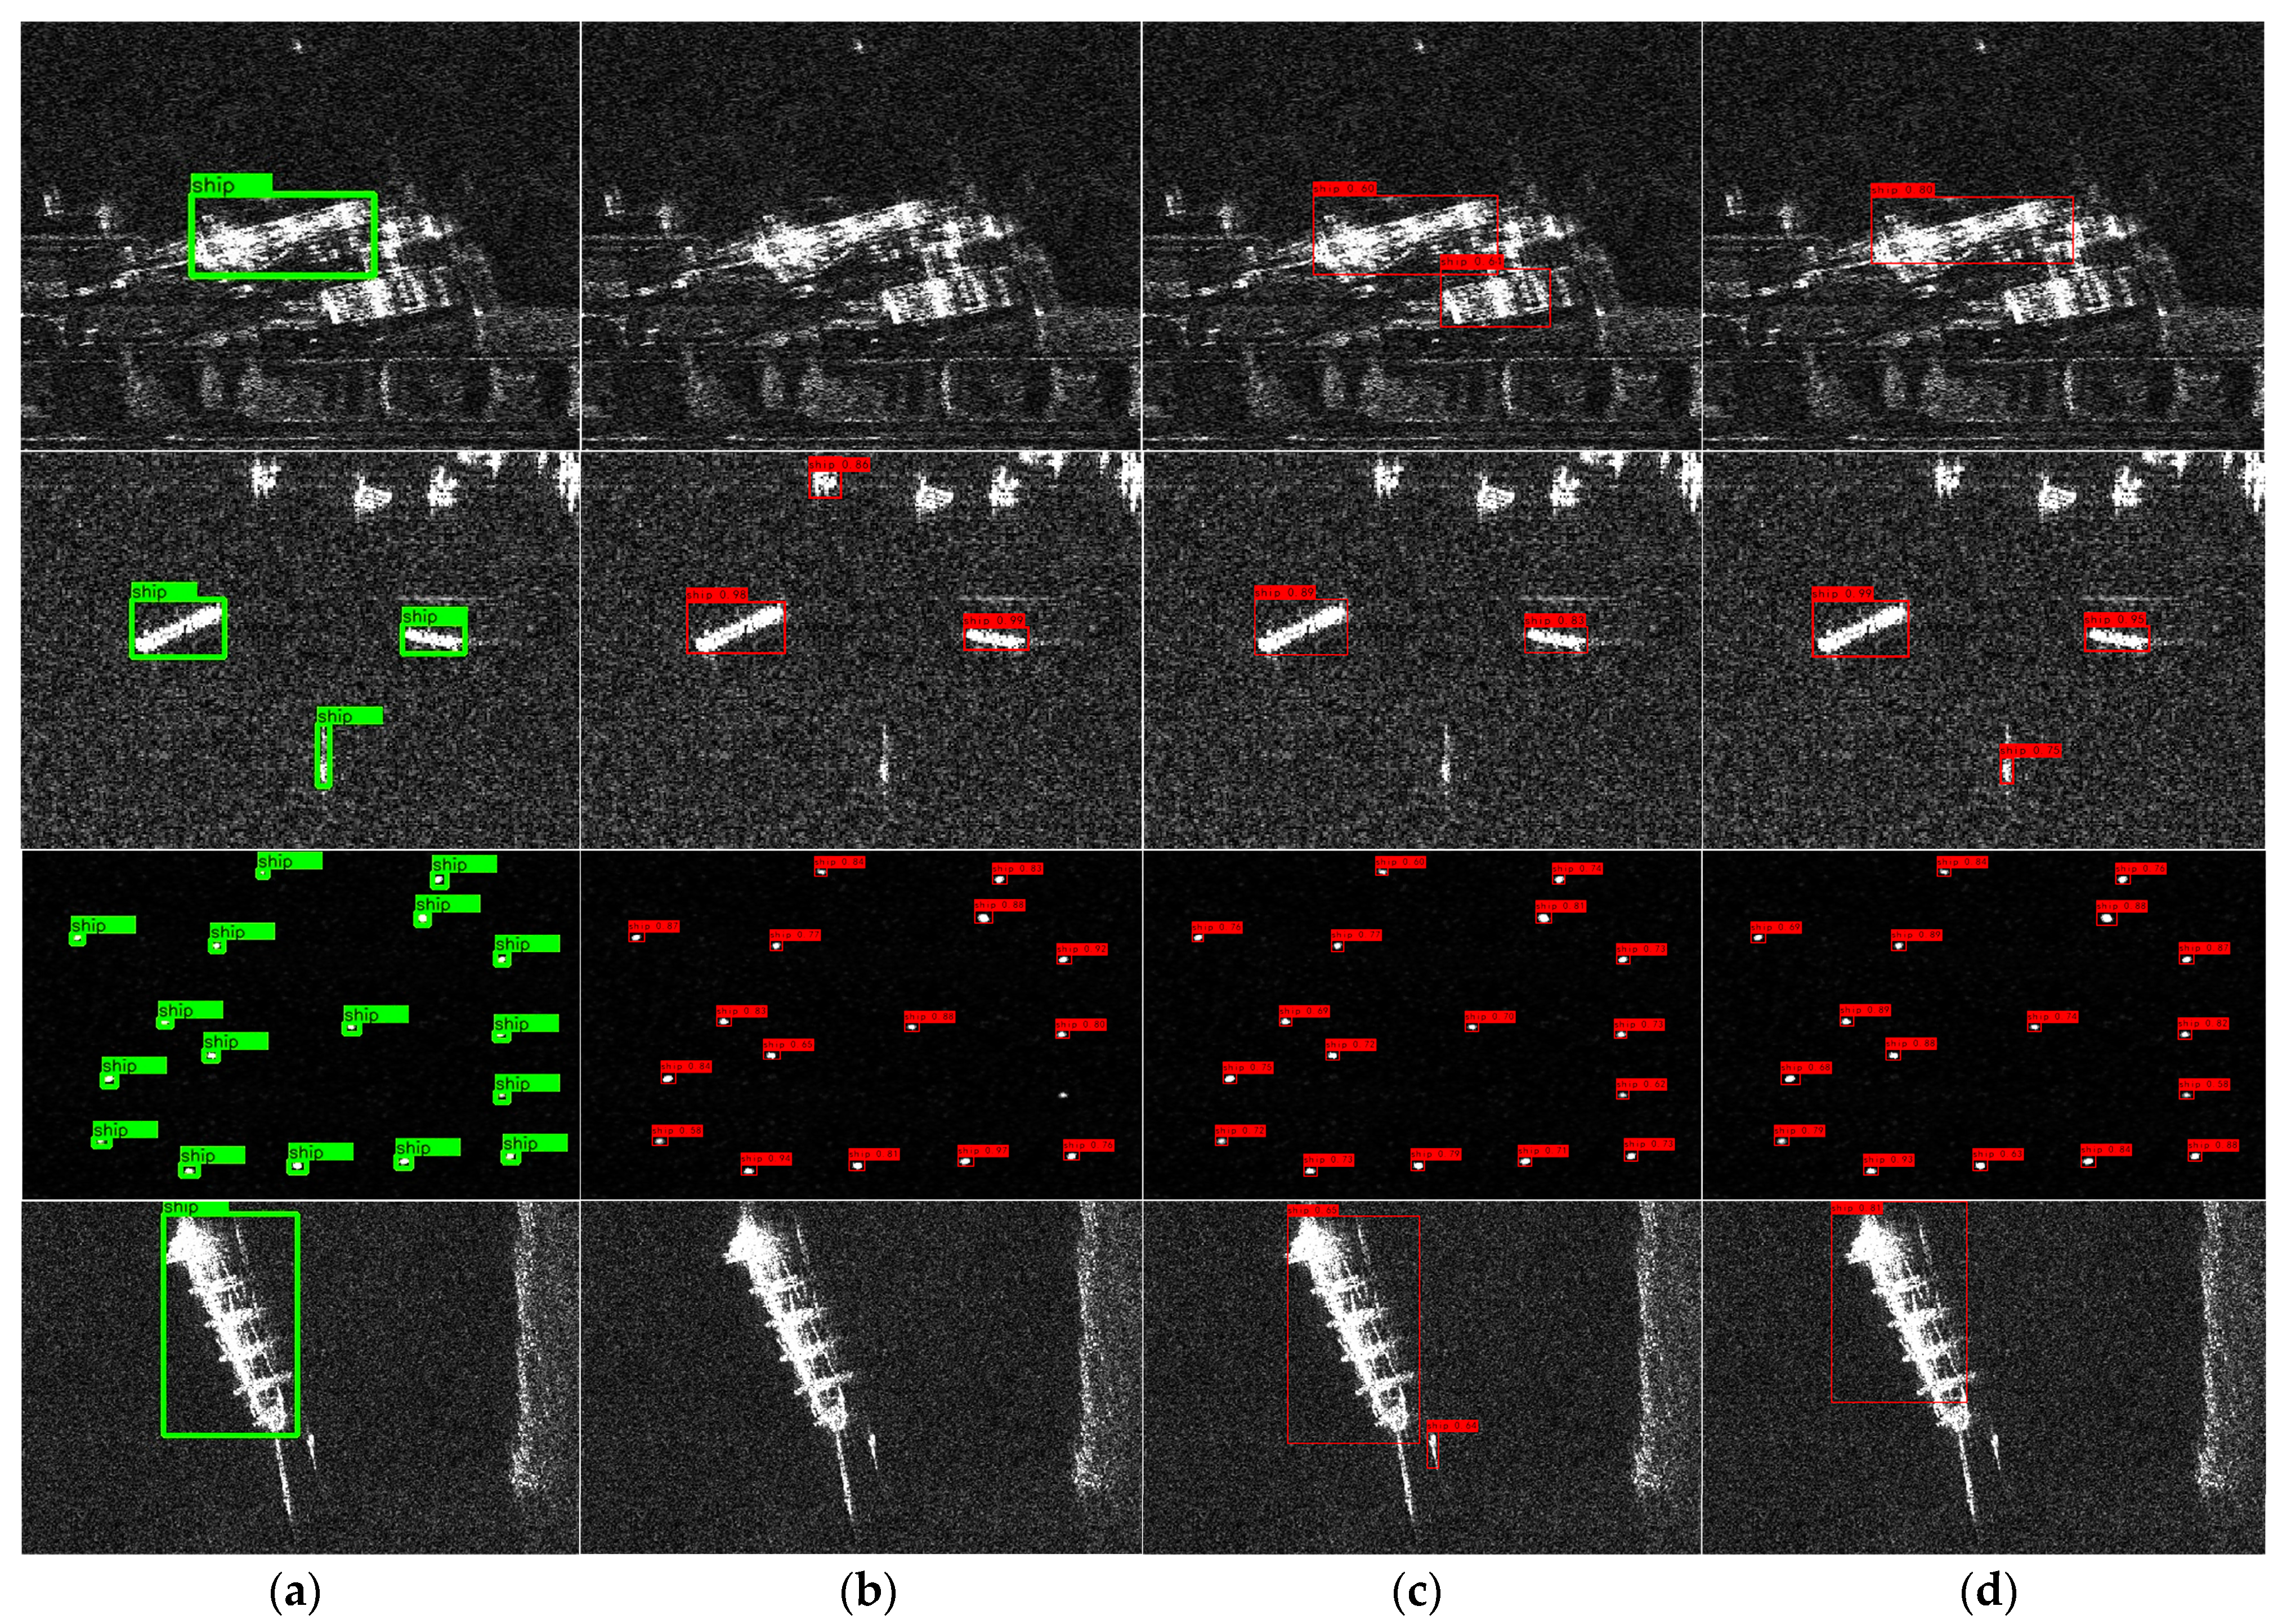
In order to further verify the stronger robustness of PPA-Net compared with other ship detection models, we choose the other two detection models (YOLOV5, HR-SDNet) with good performance to make comparative tests with PPA-Net in four different scenarios. These four scenarios include ships affected by the coastal environment, ships affected by noise, dense small-scale ships, and sparse large-scale ships. The detection output is shown in Figure 11.

3.5.1. Detection of Near-Shore Ships

As shown in Figure 13, in the first row of images, the impact of the coastal environment increases the difficulty of ship detection. HR-SDNet did not detect the ship. Although YOLOV5 identified the ship, there was such a false inspection that the coast was mistaken for a ship. In addition, for the detected ships, YOLOv5 achieved a confidence score of 0.6, while PPA-Net achieved 0.8.

3.5.2. Ship Detection Affected by Noise

As shown in Figure 13, in the second row of images, ships are not easy to detect due to the influence of noise. We can see that neither HR-SDNet nor YOLOV5 detected the ship at the bottom of the image and that HR-SDNet mistook the shore at the top of the image for a ship. Our proposed PPA-Net correctly identified the ship with a confidence of 0.75.

3.5.3. Multi-Scale Ship Detection

As shown in Figure 13, in the third and fourth rows’ images, we verified the ship detection model’s detection effect on small and large ships, respectively. In the third-row image, there are 17 ships, while HR-SDNet only identifies 16 ships. Both YOLOV5 and our proposed PPA-Net correctly detected the ships in the image. However, in terms of detection confidence, PPA-Net typically achieves a confidence level of around 0.9, while YOLOV5 achieves around 0.7. In the fourth row of images, HR-SDNet did not recognize the ship due to the large size of the ship, while YOLOV5 had a false detection.

4. Discussion

This study proposes two novel modules, PPAM and AFBM, for improving the performance of the SAR ship detection model. Our experiments on the SSDD dataset demonstrate that these two modules outperform commonly used attention and feature fusion modules. First, we evaluate the superiority of PPAM by comparing it with SE, ECA, and CBAM. The results show that PPAM achieves 1.25–1.88% higher ship detection accuracy than SE, ECA, and CBAM. Furthermore, the improvement of PPAM over ECA can be attributed to the pooling operation that suppresses the impact of noise on weight generation. This finding confirms the previously mentioned issue that noise can affect weight generation in attention mechanisms. However, compared with CBAM, the recall rate of PPAM decreases by 0.08% due to the potential damage to ship features caused by the introduction of pooling operation. Second, we evaluate the superiority of AFBM by comparing it with other commonly used feature fusion modules. The results show that AFBM achieves 1.41% and 2.56% higher ship detection accuracy than PANet and FPN, respectively. This advantage is due to the ability of AFBM to balance the semantic and positional information of ships through weighted feature fusion. However, the limitation of AFBM is the increased computational cost caused by using convolutional operations to automatically learn the contribution of different feature maps to the output features. Furthermore, through comparative experiments, we found that the improvement of the ship detection model can be better reflected in large-scale datasets because larger datasets provide a more diverse range of ship image variations, including changes in size, shape, and orientation. With more data, the model can better learn complex features and patterns that distinguish ships from backgrounds, which helps to improve the accuracy of the model.
In summary, our proposed PPAM and AFBM achieve state-of-the-art performance in SAR ship detection. Although they have limitations compared with commonly used attention and feature fusion modules, they have more significant advantages. Our future work will focus on optimizing these modules to address their limitations and further improve the performance of ship detection models.
5. Conclusions

This paper introduces a robust ship detection model, named PPA-Net, to improve SAR ship detection. Specifically, considering the influence of noise and background information on ship detection, PPAM is designed and added to the backbone of the ship detection model to reduce the influence of background noise and complex background on ship detection. Different from previous attention modules, the structural design of PPAM takes into account the influence of background information on weight generation. Next, we proposed the AFBM module, which adopts the weighted feature fusion method to make the neural network better balance the location information and semantic information in feature fusion. Finally, the ASPP module is introduced to enhance the detection ability of multi-scale ships. Experimental results show that our PPA-Net performs better than previous ship detection models. In addition, since the addition of multiple modules in PPA-Net may increase the computational cost of the ship detection model, our future research will focus on the lightweight design of the ship detection model.

Author Contributions

Conceptualization, H.Z.; Data curation, H.Z.; Funding acquisition, Y.D.; Methodology, H.Z.; Project administration, G.T., C.C., W.Z. and Y.D.; Resources, H.Z., C.C. and W.Z.; Software, H.Z.; Supervision, G.T., C.C., W.Z., S.W., Y.W. and Y.D.; Validation, H.Z., C.C. and W.Z.; Writing—original draft, H.Z.; Writing—review and editing, H.Z., C.C. and W.Z.; All authors have read and agreed to the published version of the manuscript.

Funding

This research was supported in part by the Guangdong Science and Technology Program under grant 2021A1515011854 and the Guangdong Science and Technology Program under grant 2022A1515011707.

Data Availability Statement

The data and code have been published at: https://github.com/mrzhao158/ship-detection.

Acknowledgments

The authors would like to thank the funding body for the grant.

Conflicts of Interest

The authors declare no conflict of interest.

References

  1. Kumaravel, P.; Mohan, S.; Arivudaiyanambi, J.; Venkatakrishnan, H.N. A Simplified Framework for the Detection of Intracranial Hemorrhage in CT Brain Images Using Deep Learning. Curr. Med. Imaging 2021, 17, 1226–1236. [Google Scholar] [CrossRef] [PubMed]
  2. Sepehri, A.; Vandchali, H.R.; Siddiqui, A.W.; Montewka, J. The impact of shipping 4.0 on controlling shipping accidents: A systematic literature review. Ocean Eng. 2022, 243, 110162. [Google Scholar] [CrossRef]
  3. Elmi, Z.; Singh, P.; Meriga, V.K.; Goniewicz, K.; Borowska-Stefańska, M.; Wiśniewski, S.; Dulebenets, M.A. Uncertainties in liner shipping and ship schedule recovery: A state-of-the-art review. J. Mar. Sci. Eng. 2022, 10, 563. [Google Scholar] [CrossRef]
  4. Freeman, A.; Zink, M.; Caro, E.; Moreira, A.; Veilleux, L.; Werner, M. The legacy of the SIR-C/X-SAR radar system: 25 years on. Remote Sens. Environ. 2019, 231, 111255. [Google Scholar] [CrossRef]
  5. Zhou, L.; Yu, H.; Lan, Y. Artificial intelligence in interferometric synthetic aperture radar phase unwrapping: A review. IEEE Geosci. Remote Sens. Mag. 2021, 9, 10–28. [Google Scholar] [CrossRef]
  6. Huang, L.; Pena, B.; Liu, Y.; Anderlini, E. Machine learning in sustainable ship design and operation: A review. Ocean Eng. 2022, 266, 112907. [Google Scholar] [CrossRef]
  7. Zhang, L.; Gao, G.; Chen, C.; Gao, S.; Yao, L. Compact polarimetric synthetic aperture radar for target detection: A review. IEEE Geosci. Remote Sens. Mag. 2022, 10, 115–152. [Google Scholar] [CrossRef]
  8. Liu, C.; Chen, Z.X.; Yun, S.H.A.O.; Chen, J.S.; Hasi, T.; PAN, H.Z. Research advances of SAR remote sensing for agriculture applications: A review. J. Integr. Agric. 2019, 18, 506–525. [Google Scholar] [CrossRef]
  9. Yang, M.; Guo, C.; Zhong, H.; Yin, H. A curvature-based saliency method for ship detection in SAR images. IEEE Geosci. Remote Sens. Lett. 2020, 18, 1590–1594. [Google Scholar] [CrossRef]
  10. Zhang, C.; Gao, G.; Zhang, L.; Chen, C.; Gao, S.; Yao, L.; Bai, Q.; Gou, S. A novel full-polarization SAR image ship detector based on scattering mechanisms and wave polarization anisotropy. ISPRS J. Photogramm. Remote Sens. 2022, 190, 129–143. [Google Scholar] [CrossRef]
  11. Wang, X.; Chen, C.; Pan, Z.; Pan, Z. Fast and automatic ship detection for SAR imagery based on multiscale contrast measure. IEEE Geosci. Remote Sens. Lett. 2019, 16, 1834–1838. [Google Scholar] [CrossRef]
  12. Kuttikkad, S.; Chellappa, R. Non-Gaussian CFAR techniques for target detection in high resolution SAR images. Proc. ICIP 1994, 1, 910–914. [Google Scholar]
  13. Hofele, F.X. An innovative CFAR algorithm. In Proceedings of the 2001 CIE International Conference on Radar, Beijing, China, 15–18 October 2001; pp. 329–333. [Google Scholar]
  14. Novak, L.M.; Hesse, S.R. On the performance of order-statistics CFAR detectors. In Proceedings of the IEEE 25th Asilomar Conference on Signals, Systems & Computer, Pacific Grove, CA, USA, 4–6 November 1991; Volume 2, pp. 835–840. [Google Scholar]
  15. di Bisceglie, M.; Galdi, C. CFAR detection of extended objects in high-resolution SAR images. IEEE Trans. Geosci. Remote Sens. 2005, 43, 833–843. [Google Scholar] [CrossRef]
  16. Liu, M.; Chen, S.; Lu, F.; Xing, M.; Wei, J. Realizing Target Detection in SAR Images Based on Multiscale Superpixel Fusion. Sensors 2021, 21, 1643. [Google Scholar] [CrossRef]
  17. Wang, X.; Chen, C.; Pan, Z.; Pan, Z. Superpixel-based LCM detector for faint ships hidden in strong noise background SAR imagery. IEEE Geosci. Remote Sens. Lett. 2018, 16, 417–421. [Google Scholar] [CrossRef]
  18. Li, T.; Liu, Z.; Ran, L.; Xie, R. Target detection by exploiting superpixel-level statistical dissimilarity for SAR imagery. IEEE Geosci. Remote Sens. Lett. 2018, 15, 562–566. [Google Scholar] [CrossRef]
  19. Yang, R.; Pan, Z.; Jia, X.; Zhang, L.; Deng, Y. A Novel CNN-Based Detector for Ship Detection Based on Rotatable Bounding Box in SAR Images. IEEE J. Sel. Top. Appl. Earth Obs. Remote Sens. 2021, 14, 1938–1958. [Google Scholar] [CrossRef]
  20. Martinez-Diaz, Y.; Nicolas-Diaz, M.; Mendez-Vazquez, H.; Luevano, L.S.; Chang, L.; Gonzalez-Mendoza, M.; Sucar, L.E. Benchmarking lightweight face architectures on specific face recognition scenarios. Artif. Intell. Rev. 2021, 54, 6201–6244. [Google Scholar] [CrossRef]
  21. Viola, J.; Chen, Y.Q.; Wang, J. FaultFace: Deep convolutional generative adversarial network (DCGAN) based ball-bearing failure detection method. Inf. Sci. 2021, 542, 195–211. [Google Scholar] [CrossRef]
  22. Xun, Y.; Qin, J.; Liu, J. Deep Learning Enhanced Driving Behavior Evaluation Based on Vehicle-Edge-Cloud Architecture. IEEE Trans. Veh. Technol. 2021, 70, 6172–6177. [Google Scholar] [CrossRef]
  23. Tang, G.; Zhuge, Y.; Claramunt, C.; Wang, Y.; Men, S. N-Yolo: A SAR ship detection using noise-classifying and complete-target extraction. Remote Sens. 2021, 13, 871. [Google Scholar] [CrossRef]
  24. Tang, G.; Zhao, H.; Claramunt, C.; Men, S. FLNet: A Near-shore Ship Detection Method Based on Image Enhancement Technology. Remote Sens. 2022, 14, 4857. [Google Scholar] [CrossRef]
  25. Ma, C.; Chen, L.; Yong, J.H. AU R-CNN: Encoding expert prior knowledge into R-CNN for action unit detection. Neurocomputing 2019, 355, 35–47. [Google Scholar] [CrossRef]
  26. Girshick, R. Fast R-CNN. In Proceedings of the 2015 IEEE International Conference on Computer Vision (ICCV), Santiago, Chile, 1–18 December 2015; pp. 1440–1448. [Google Scholar] [CrossRef]
  27. Ding, X.; Li, Q.; Cheng, Y.; Wang, J.; Bian, W.; Jie, B. Local keypoint-based Faster R-CNN. Appl. Intell. 2020, 50, 3007–3022. [Google Scholar] [CrossRef]
  28. Li, J.L.; Huo, Q.S.; Xing, J. Multiobject Detection Algorithm Based on Adaptive Default Box Mechanism. Complexity 2020, 2020, 5763476. [Google Scholar] [CrossRef]
  29. Yoshida, T.; Ouchi, K. Detection of Ships Cruising in the Azimuth Direction Using Spotlight SAR Images with a Deep Learning Method. Remote Sens. 2022, 14, 4691. [Google Scholar] [CrossRef]
  30. Tang, G.; Liu, S.; Fujino, I.; Claramunt, C.; Wang, Y.; Men, S. H-YOLO: A Single-Shot Ship Detection Approach Based on Region of Interest Preselected Network. Remote Sens. 2020, 12, 4192. [Google Scholar] [CrossRef]
  31. Shi, P.; Qi, Q.; Qin, Y.; Scott, P.J.; Jiang, X. Intersecting Machining Feature Localization and Recognition via Single Shot Multibox Detector. IEEE Trans. Ind. Inform. 2021, 17, 3292–3302. [Google Scholar] [CrossRef]
  32. Hu, J.; Shen, L.; Sun, G. Squeeze-and-excitation networks. In Proceedings of the IEEE Conference on Computer Vision and Pattern Recognition, Salt Lake City, UT, USA, 18–23 June 2018; pp. 7132–7141. [Google Scholar]
  33. Woo, S.; Park, J.; Lee, J.Y.; Kweon, I.S. Cbam: Convolutional block attention module. In Proceedings of the European Conference on Computer VISION (ECCV), Munich, Germany, 8–14 September 2018; pp. 3–19. [Google Scholar]
  34. Wang, Q.; Wu, B.; Zhu, P.; Li, P.; Zuo, W.; Hu, Q. ECA-Net: Efficient Channel Attention for Deep Convolutional Neural Networks. In Proceedings of the 2020 IEEE/CVF Conference on Computer Vision and Pattern Recognition (CVPR), Seattle, Washington, DC, USA, 14–19 June 2020. [Google Scholar]
  35. Lin, T.Y.; Dollár, P.; Girshick, R.; He, K.; Hariharan, B.; Belongie, S. Feature pyramid networks for object detection. In Proceedings of the IEEE Conference on Computer Vision and Pattern Recognition, Honolulu, HI, USA, 21–26 July 2017; pp. 2117–2125. [Google Scholar]
  36. Wang, K.; Liew, J.H.; Zou, Y.; Zhou, D.; Feng, J. Panet: Few-shot image semantic segmentation with prototype alignment. In Proceedings of the IEEE/CVF International Conference on Computer Vision, Seoul, Republic of Korea, 27 October–2 November 2019; pp. 9197–9206. [Google Scholar]
  37. Bochkovskiy, A.; Wang, C.Y.; Liao HY, M. YOLOv4: Optimal speed and a acuracy of object detection. In Proceedings of the IEEE Conference on Computer Vision and Pattern Recognition, Seattle, WA, USA, 13–19 June 2020; pp. 198–215. [Google Scholar]
  38. Li, Z.; Peng, C.; Yu, G.; Zhang, X.; Deng, Y.; Sun, J. Detnet: A backbone network for object detection. arXiv 2018, arXiv:1804.06215. [Google Scholar]
  39. Chen, L.C.; Papandreou, G.; Kokkinos, I.; Murphy, K.; Yuille, A.L. Deeplab: Semantic image segmentation with deep convolutional nets, atrous convolution, and fully connected crfs. IEEE Trans. Pattern Anal. Mach. Intell. 2017, 40, 834–848. [Google Scholar] [CrossRef]
  40. Lu, C.; Li, W. Ship classification in high-resolution SAR images via transfer learning with small training dataset. Sensors 2018, 19, 63. [Google Scholar] [CrossRef] [PubMed]
  41. Rostami, M.; Kolouri, S.; Eaton, E.; Kim, K. Deep transfer learning for few-shot SAR image classification. Remote Sens. 2019, 11, 1374. [Google Scholar] [CrossRef]
  42. Zhang, H.; Zhang, X.; Meng, G.; Guo, C.; Jiang, Z. Few-Shot Multi-Class Ship Detection in Remote Sensing Images Using Attention Feature Map and Multi-Relation Detector. Remote Sens. 2022, 14, 2790. [Google Scholar] [CrossRef]
  43. Truong, T.N.; Do Ngoc, T.; Quang, B.N.; Le Tran, S. Combining Multi-Threshold Saliency with Transfer Learning for Ship Detection and Information Extraction from Optical Satellite Images. In Proceedings of the 2019 IEEE 14th International Conference on Intelligent Systems and Knowledge Engineering (ISKE), Dalian, China, 14–16 November 2019; pp. 974–980. [Google Scholar]
  44. Zhang, T.; Zhang, X.; Li, J.; Xu, X.; Wang, B.; Zhan, X.; Xu, Y.; Ke, X.; Zeng, T.; Su, H.; et al. Sar ship detection dataset (ssdd): Official release and comprehensive data analysis. Remote Sens. 2021, 13, 3690. [Google Scholar] [CrossRef]
  45. Wei, S.; Zeng, X.; Qu, Q.; Wang, M.; Su, H.; Shi, J. HRSID: A high-resolution SAR images dataset for ship detection and instance segmentation. IEEE Access 2020, 8, 120234–120254. [Google Scholar] [CrossRef]
  46. Jin, K.; Chen, Y.; Xu, B.; Yin, J.; Wang, X.; Yang, J. A patch-to-pixel convolutional neural network for small ship detection with PolSAR images. IEEE Trans. Geosci. Remote Sens. 2020, 58, 6623–6638. [Google Scholar] [CrossRef]
  47. Ma, X.; Ji, K.; Xiong, B.; Zhang, L.; Feng, S.; Kuang, G. Light-YOLOv4: An Edge-Device Oriented Target Detection Method for Remote Sensing Images. IEEE J. Sel. Top. Appl. Earth Obs. Remote Sens. 2021, 14, 10808–10820. [Google Scholar] [CrossRef]
  48. Cui, Z.; Li, Q.; Cao, Z.; Liu, N. Dense attention pyramid networks for multi-scale ship detection in SAR images. IEEE Trans. Geosci. Remote Sens. 2019, 57, 8983–8997. [Google Scholar] [CrossRef]
  49. Zhang, T.; Zhang, X.; Shi, J.; Wei, S. HyperLi-Net: A hyper-light deep learning network for high-accurate and high-speed ship detection from synthetic aperture radar imagery. ISPRS J. Photogramm. Remote Sens. 2020, 167, 123–153. [Google Scholar] [CrossRef]
  50. Cui, Z.; Wang, X.; Liu, N.; Cao, Z.; Yang, J. Ship detection in large-scale SAR images via spatial shuffle-group enhance attention. IEEE Trans. Geosci. Remote Sens. 2020, 59, 379–391. [Google Scholar] [CrossRef]
  51. Yang, X.; Zhang, X.; Wang, N.; Gao, X. A Robust One-Stage Detector for Multiscale Ship Detection with Complex Background in Massive SAR Images. IEEE Trans. Geosci. Remote Sens. 2021, 60, 5217712. [Google Scholar] [CrossRef]
  52. Li, Q.; Mou, L.; Liu, Q.; Wang, Y.; Zhu, X.X. HSF-Net: Multiscale deep feature embedding for ship detection in optical remote sensing imagery. IEEE Trans. Geosci. Remote Sens. 2018, 56, 7147–7161. [Google Scholar] [CrossRef]
  53. Zhu, M.; Hu, G.; Zhou, H.; Wang, S. Multiscale Ship Detection Method in SAR Images Based on Information Compensation and Feature Enhancement. IEEE Trans. Geosci. Remote Sens. 2022, 60, 1–13. [Google Scholar] [CrossRef]
  54. Zhang, T.; Zhang, X.; Ke, X. Quad-FPN: A novel quad feature pyramid network for SAR ship detection. Remote Sens. 2021, 13, 2771. [Google Scholar] [CrossRef]
  55. Gao, S.; Liu, J.M.; Miao, Y.H.; He, Z.J. A High-Effective Implementation of Ship Detector for SAR Images. IEEE Geosci. Remote Sens. Lett. 2021, 19, 1–5. [Google Scholar] [CrossRef]
  56. Lin, T.Y.; Maire, M.; Belongie, S.; Hays, J.; Perona, P.; Ramanan, D.; Dollár, P.; Zitnick, C.L. Microsoft coco: Common objects in context. In Proceedings of the Computer Vision–ECCV 2014: 13th European Conference, Zurich, Switzerland, 6–12 September 2014; Part V 13. Springer International Publishing: Berlin/Heidelberg, Germany, 2014; pp. 740–755. [Google Scholar]
Figure 1. Overall structure of our proposed method.
Remotesensing 15 02855 g001
Figure 2. PPAM architecture details. The M: 5 × 5 and M: 9 × 9 are the pooling layers with pooling kernels of 5 × 5 and 9 × 9, respectively. GAP is the global average pooling. Conv is a one-dimensional convolutional layer with kernel size K. Add is the addition of the eigenvalues at the same position of the feature map generated by the parallel structure. S is the sigmoid activation function.
Remotesensing 15 02855 g002
Figure 3. Background information suppression principle. (a) The effect of two different information integration methods in channels containing only ship features. (b) The effect of two different information integration methods in channels containing only background features. GAP: global average pooling, MP3 × 3: maximum pooling with a 3 × 3 core.
Remotesensing 15 02855 g003
Figure 4. The working principle of FPN and PANet.
Remotesensing 15 02855 g004
Figure 5. Comparison of two different feature fusion methods. (a) Feature fusion in PANet and FPN. (b) Adaptive weighted feature fusion method in AFBM.
Remotesensing 15 02855 g005
Figure 6. ASPP structures.
Remotesensing 15 02855 g006
Figure 7. DSC operation.
Remotesensing 15 02855 g007
Figure 8. Some SAR images in SSDD.
Remotesensing 15 02855 g008
Figure 9. Some SAR images in HRSID.
Remotesensing 15 02855 g009
Figure 10. PPAM evaluation. (a) YOLOV4. (b) Ship detection model added into PPAM.
Remotesensing 15 02855 g010
Figure 11. Verifying the effects of ASPP. (a) YOLOV4. (b) Ship detection model added to ASPP.
Remotesensing 15 02855 g011
Figure 12. AFBM evaluation. (a) YOLOV4. (b) Add ship detection model of AFBM.
Remotesensing 15 02855 g012
Figure 13. Ship detection results of different methods. (a) The real position of the ship in the SAR image. (b) Ship detection effect of HR-SDNet in SAR image. (c) Ship detection effect of YOLO V5 in SAR image. (d) Ship detection effect of PPA-Net in SAR image.
Remotesensing 15 02855 g013
Table 1. Statistics of SSDD and HRSID.
DatasetsSize of Ships (num)Size of Images (Pixels)Images
(Num)
SmallMediumLargeHeightWidth
SSDD152993576190~526214~6681160
HRSID924273883218008005604
Table 2. Experimental results of the proposed modules on SSDD DATASE. The ✓ indicates the addition of the corresponding module.
PPAMASPPAFBMAPPRF1
90.23%90.56%83.47%0.87
94.08%95.30%86.02%0.90
93.63%92.51%85.11%0.88
94.73%93.00%86.26%0.90
94.81%95.05%90.42%0.92
94.42%95.87%88.55%0.92
93.93%92.37%87.64%0.90
95.19%95.22%91.22%0.93
Table 3. The results of experiments on SSDD datasets after adding different attention modules into the backbone of PPA-Net.
ModelAPPRF1
PPAM94.08%95.30%86.02%0.90
CBAM92.20%93.56%86.10%0.89
ECA92.83%92.34%84.98%0.88
SE92.75%92.25%85.13%0.89
Table 4. The results of experiments on the SSDD dataset after adding different feature fusion modules to PPA-Net.
ModelAPPRF1
AFBM94.73%93.00%86.26%0.90
PANet93.32%90.04%85.22%0.89
FPN92.08%92.25%84.65%0.89
Table 5. Comparison of detection effects with other advanced ship detection models on SSDD.
ModelAPPRF1
PPA-Net95.19%95.22%91.22%0.93
YOLOV492.19%92.86%84.35%0.88
YOLOV592.93%90.08%86.64%0.88
HR-SDNet93.74%94.04%90.21%0.92
DetNet92.68%93.54%89.90%0.89
Table 6. Comparison of detection effects with other advanced ship detection models on HRSID.
ModelAPPRF1
PPA-Net89.27%90.34%88.20%0.89
YOLOV481.71%85.90%76.30%0.81
YOLOV585.93%85.66%85.54%0.84
HR-SDNet86.65%88.65%86.64%0.87
DetNet83.21%84.31%80.64%0.82
Table 7. Three rounds of comparison with other ship detection models on SSDD dataset.
Model123AverageStandard Deviation
PPA-Net95.34%94.63%94.93%94.97%0.29%
YOLOV492.13%90.34%91.65%91.37%0.76%
YOLOV592.99%92.12%92.34%92.48%0.37%
HR-SDNet93.76%92.54%93.01%93.10%0.50%
DetNet92.73%91.68%91.72%92.04%0.49%
Table 8. Multi-scale Ship Detection Performance Evaluation.
ModelAP [IOU = 0.50:0.95]AR [IOU = 0.50:0.95]
SmallMediumLargeSmallMediumLarge
PPA-Net0.5180.5420.4280.5760.6320.556
YOLOV40.4000.5170.2360.5030.5850.536
YOLOV50.4320.5100.2580.5110.5890.541
HR-SDNet0.4550.5200.3000.5340.5840.539
DetNet0.4310.5210.2240.5230.5760.532
Disclaimer/Publisher’s Note: The statements, opinions and data contained in all publications are solely those of the individual author(s) and contributor(s) and not of MDPI and/or the editor(s). MDPI and/or the editor(s) disclaim responsibility for any injury to people or property resulting from any ideas, methods, instructions or products referred to in the content.