Article

Geometry and Topology Reconstruction of BIM Wall Objects from Photogrammetric Meshes and Laser Point Clouds

1
Nantong Key Laboratory of Spatial Information Technology R&D and Application, College of Geographic Science, Nantong University, Nantong 226019, China
2
Key Laboratory of Urban Land Resources Monitoring and Simulation, Ministry of Natural Resources, Shenzhen 518034, China
3
Key Laboratory of Virtual Geographic Environment, Ministry of Education, Nanjing Normal University, Nanjing 210046, China
4
Institute of Environment and Development, Guangdong Academy of Social Sciences, Guangzhou 510635, China
5
School of Resource and Environmental Sciences (SRES), Wuhan University, Wuhan 430079, China
*
Author to whom correspondence should be addressed.
Remote Sens. 2023, 15(11), 2856; https://doi.org/10.3390/rs15112856
Submission received: 14 April 2023 / Revised: 26 May 2023 / Accepted: 29 May 2023 / Published: 31 May 2023

Abstract

:
As the foundation for digitalization, building information modeling (BIM) technology has been widely used in the field of architecture, engineering, construction, and facility management (AEC/FM). Unmanned aerial vehicle (UAV) oblique photogrammetry and laser scanning have become increasingly popular data acquisition techniques for surveying buildings and providing original data for BIM modeling. However, the geometric and topological reconstruction of solid walls, which are among the most important architectural structures in BIM, is still a challenging undertaking. Due to noise and missing data in 3D point clouds, current research mostly focuses on segmenting wall planar surfaces from unstructured 3D point clouds and fitting the plane parameters without considering the thickness or 3D shape of the wall. Point clouds acquired only from the indoor space are insufficient for modeling exterior walls. It is also important to maintain the topological relationships between wall objects to meet the needs of complex BIM modeling. Therefore, in this study, a geometry and topology modeling method is proposed for solid walls in BIM based on photogrammetric meshes and laser point clouds. The method uses a kinetic space-partitioning algorithm to generate the building footprint and indoor floor plan. It classifies interior and exterior wall segments and infers parallel line segments to extract wall centerlines. The topological relationships are reconstructed and maintained to build wall objects with consistency. Experimental results on two datasets, including both photogrammetric meshes and indoor laser point clouds, exhibit more than 90% completeness and correctness, as well as centimeter-level accuracy of the wall surfaces.

1. Introduction

With the arrival of Industry 4.0 [1], the architecture, engineering, construction, and facility management (AEC/FM) industry has begun to transform to informatization, digitalization and intelligence. Using building information modeling (BIM) technology to promote productivity has increasingly attracted the attention of industries and enterprises [2,3]. In recent years, unmanned aerial vehicle (UAV) oblique photogrammetry and laser scanning technology have been continuously developed and widely used for BIM modeling in the field of AEC/FM [4]. UAVs have the characteristics of a low cost and high efficiency. Terrestrial laser scanning (TLS) has the characteristics of a noncontact approach, high sampling rate, high accuracy, high resolution, and panoramic scanning; such characteristics can significantly save time and reduce costs [5]. Many applications in the field of remote sensing can be solved by incorporating methodologies from the fields of photogrammetry and laser scanning [6,7].
BIM is a rich object-based parametric model. BIM modeling usually comprises three parts: geometric modeling, semantic modeling, and topological relationship modeling [3,8,9]. However, the current research on BIM modeling from laser point clouds is highly dependent on human interaction, which is time-consuming and laborious [10]. The laser point clouds obtained are usually unstructured and lack semantic information. They contain noise and suffer from shadowing from nearby objects. Due to the incomplete point cloud data caused by occlusion, the high density and magnanimity of point clouds, the complex structure of buildings, the staggered space, and the diversity of functions, significant challenges to the automatic extraction of geometric elements of building point clouds may occur [11]. Solid walls are one of the most important building structures in BIM [12]. Most existing studies focus on the plane segmentation and fitting of the plane parameters of the wall surface from the unstructured 3D point cloud, ignoring the occupied space surrounded by the boundary surface (usually shown as a pair of parallel walls) and the topological relationship between the wall objects [13]. In addition, most current studies usually use only a single data source [5,14,15,16,17,18], for example, indoor 3D point clouds [17,18], which cannot provide sufficient information to estimate the thickness of exterior walls and thus cannot meet the needs of BIM modeling for complex buildings. Both laser point clouds and pictures are essential data sources for BIM wall reconstruction, and their individual benefits should be merged to increase information availability.
In this study, a BIM solid wall modeling method based on oblique photogrammetric meshes and laser point cloud is proposed. The contributions of this study are two-fold: (1) A kinetic space partition algorithm to generate building footprint and indoor floor plan. It classifies interior and exterior wall segments and infers parallel line segments to extract wall centerlines; (2) A topology reconstruction method that reconstructs and maintains the topological relationship of detected wall elements is used to build BIM wall objects with topological consistency.

2. Related Works

In the AEC/FM field, the scan-to-BIM method using laser scanning technology has become increasingly popular. However, laser scanning suffers from shadowing from nearby objects. Moreover, relying only on indoor 3D point clouds cannot provide sufficient information to estimate the thickness of exterior walls. UAVs are relatively inexpensive, allowing for rapid surveys over infrastructure projects where required [6]. They can scan inaccessible objects not visible from the ground, such as roof tops. Therefore, a full and complete dataset can now be achieved due to their mobile nature. UAVs acquire data from the air using a vertical or oblique angle of view and suffer much less from shadowing from nearby objects. UAVs are perfect to be utilized in the BIM modeling workflow because they are ideal for scanning the external features of buildings due to their speed and maneuverability. The photogrammetric data can then be merged with laser scan data collected for the building internals to produce complete data of the whole building, inside and outside. Freimuth and Konig [14] used UAVs for the automated creation of images and point cloud data of particular construction objects. Alshawabkeh et al. [19] integrated a laser scanner and photogrammetry for heritage BIM enhancement. It has become a tendency to fuse multisource data for scanning to BIM modeling.

2.1. BIM Elements Detection

The current research on the reconstruction of BIM models based on 3D point clouds mainly focuses on the classification of building scenes and the extraction of structural elements, both of which usually rely on the assumption of good sampling of building components. Sanchez and Zakhor [20] used point cloud data and detected building interior planes. The method first uses the principal component analysis (PCA) algorithm to divide the interior points into ceilings, floors, walls and other small building structures and uses the random sampling consistency (RANSAC) to fit the detected plane primitives.
Romero-Jarén and Arranz [21] proposed an automatic segmentation and classification method for point clouds. It generates the surfaces of building elements, including floors, ceilings, walls, columns, etc. Coudron et al. [22] proposed using depth learning to enhance scene semantics and extract the plane structure from the point cloud. These methods mainly fit plane surface models. When there is obvious clutter and occlusion in the indoor environment, the extracted plane will have redundancy, fragmentation, and topology errors [23]. Therefore, many scholars use the cellar nature of indoor space (i.e., room) as knowledge to help reconstruct the building structure and space and reconstruct the wall surface model through space partitioning and room reconstruction [23,24,25]. These methods usually first extract wall lines or planes, build a 2D/3D cell complex, use the graph-cut optimization algorithm to solve the energy optimization function, semantically label the cell complex, build a 3D model of the room, and reconstruct the wall surface geometry.

2.2. Geometry and Topology Reconstruction

The problem of solid wall modeling is not only the geometry fitting of the wall surface. The wall solid also needs to be inferred from the extracted boundary surface (usually represented as a parallel wall). Therefore, Zhou and Li [26] proposed a line-feature method based on constrained least squares to achieve the reconstruction of interior walls. This method builds a solid-wall model by fitting parallel surfaces in the point cloud. Fotsing et al. [27] proposed a voxel-based solid-wall detection method from point clouds, which uses voxel morphological transformation to identify the space occupied by the wall. Tran et al. [28] proposed an indoor 3D modeling method based on shape grammar, which uses simple elements and applies the grammar rules controlled by the generation process iteratively to derive the 3D model of a complex environment. This method can reconstruct the indoor navigation space and its topological relationship and can generate parametric 3D models with a high geometric accuracy, rich semantic content, and BIM standards. Jung et al. [18] proposed extracting the projected parallel line of the wall in a two-dimensional Cartesian coordinate system using the constrained least squares method, dividing the solid wall into an interior wall and an exterior wall, and building the BIM wall model. However, this method does not further build the topological relationship of the solid walls [29]. From the existing research, BIM solid wall modeling includes the following general steps: point cloud segmentation and semantic classification, geometric element fitting, and the parameter extraction of wall solids. Bassier and Vergauwen [17] proposed an unsupervised wall-modeling method when the input point cloud has been segmented according to the semantics of a solid wall. This method proposes four connection types: the intersection, orthogonal, blended, and direct connection to restore the complete wall structure. Their research [30] further proposed a connection evaluation framework for building the topological relationship between walls.
Solid wall modeling methods can be classified as room-based methods and wall-based methods [17]. The simple method of inferring wall solid object parameters based on wall geometry extraction will encounter difficulty in environments with a large number of occlusions. The wall-based method does not consider architectural space and can only build wall objects. Due to the occlusion of indoor objects and missing data in point clouds, it is difficult to ensure the topological consistency of the building model. The room-based method considers the cellar characteristics of the room as a priori knowledge and can meet the modeling requirements in the case of missing point cloud data on the wall. At the same time, the method based on space partitioning to generate cell complexes can ensure topological consistency. Many scholars have studied methods based on space partitioning and optimizing cell complexes [9,25,31,32]. Some scholars limit the building space to the 2.5D hypothesis [32] or adopt the stricter Manhattan world assumption [33]. Other scholars deal with 3D modeling problems by putting forward implicit assumptions on input data as prior knowledge. Ochmann et al. [25] proposed a global optimization method to construct a wall entity by using wall elements as the adjacent area between adjacent reconstruction rooms while maintaining a reasonable connection between all wall elements. However, this method requires that each room contains at least one scanning station. Wang et al. [31] first used the wall line to divide the two-dimensional space, marked the dissected cell as indoor and outdoor labels, and determined walls by searching the adjacent edge of the remaining cell. Tang et al. [34] used deep learning to classify indoor 3D point clouds, determined the semantics of indoor space based on morphological methods, determined the value of cells in cell complexes using classification semantics, and extracted the parameter information of wall objects to achieve the construction of a BIM model. Because the definition of wall entities surrounded by boundary surfaces was not strictly considered, the extraction of solid wall parameters was inaccurate.
Above all, the as-built world can be captured by UAVs and laser scanning, which can then be used as part of the scan-to-BIM workflow. Extracting wall object parameter information from oblique photographic models and laser point clouds can meet the needs of solid wall modeling. The existing wall surface modeling method based on cell complexes can be expanded to meet the wall solid modeling requirements under the condition of noise and missing data. The topology between wall objects is not taken into account in most current studies, which highlights the need for additional research on topological reconstruction between wall objects.

3. Methods

The input of this study is a photogrammetric mesh and 3D laser point cloud, which are pre-aligned accurately. There are two methods for the coordinate registration of the UAV photogrammetric model and 3D laser point cloud: (1) using control points to improve the accuracy of UAV photogrammetry and laser scanning point clouds, respectively, and ensuring that the two are in the same coordinate system; and (2) using control points to improve the accuracy of the UAV image and selecting marker points from the UAV image as control points to improve the accuracy of the indoor laser point cloud. The basic idea of both methods is to transfer external spatial reference information into indoor space. Obtaining real-world scene data with a high precision is necessary for BIM modeling in the ACE field. The measurement coordinate system in this study adopts the Transverse Mercator projection [35], and the central longitude is the central longitude of the research area. The outdoor UAV photogrammetric model and the indoor laser scanning point cloud are in the same coordinate system. The input laser point cloud completely covered the ceiling area of the building interior, which is easy to meet for most laser scanners.
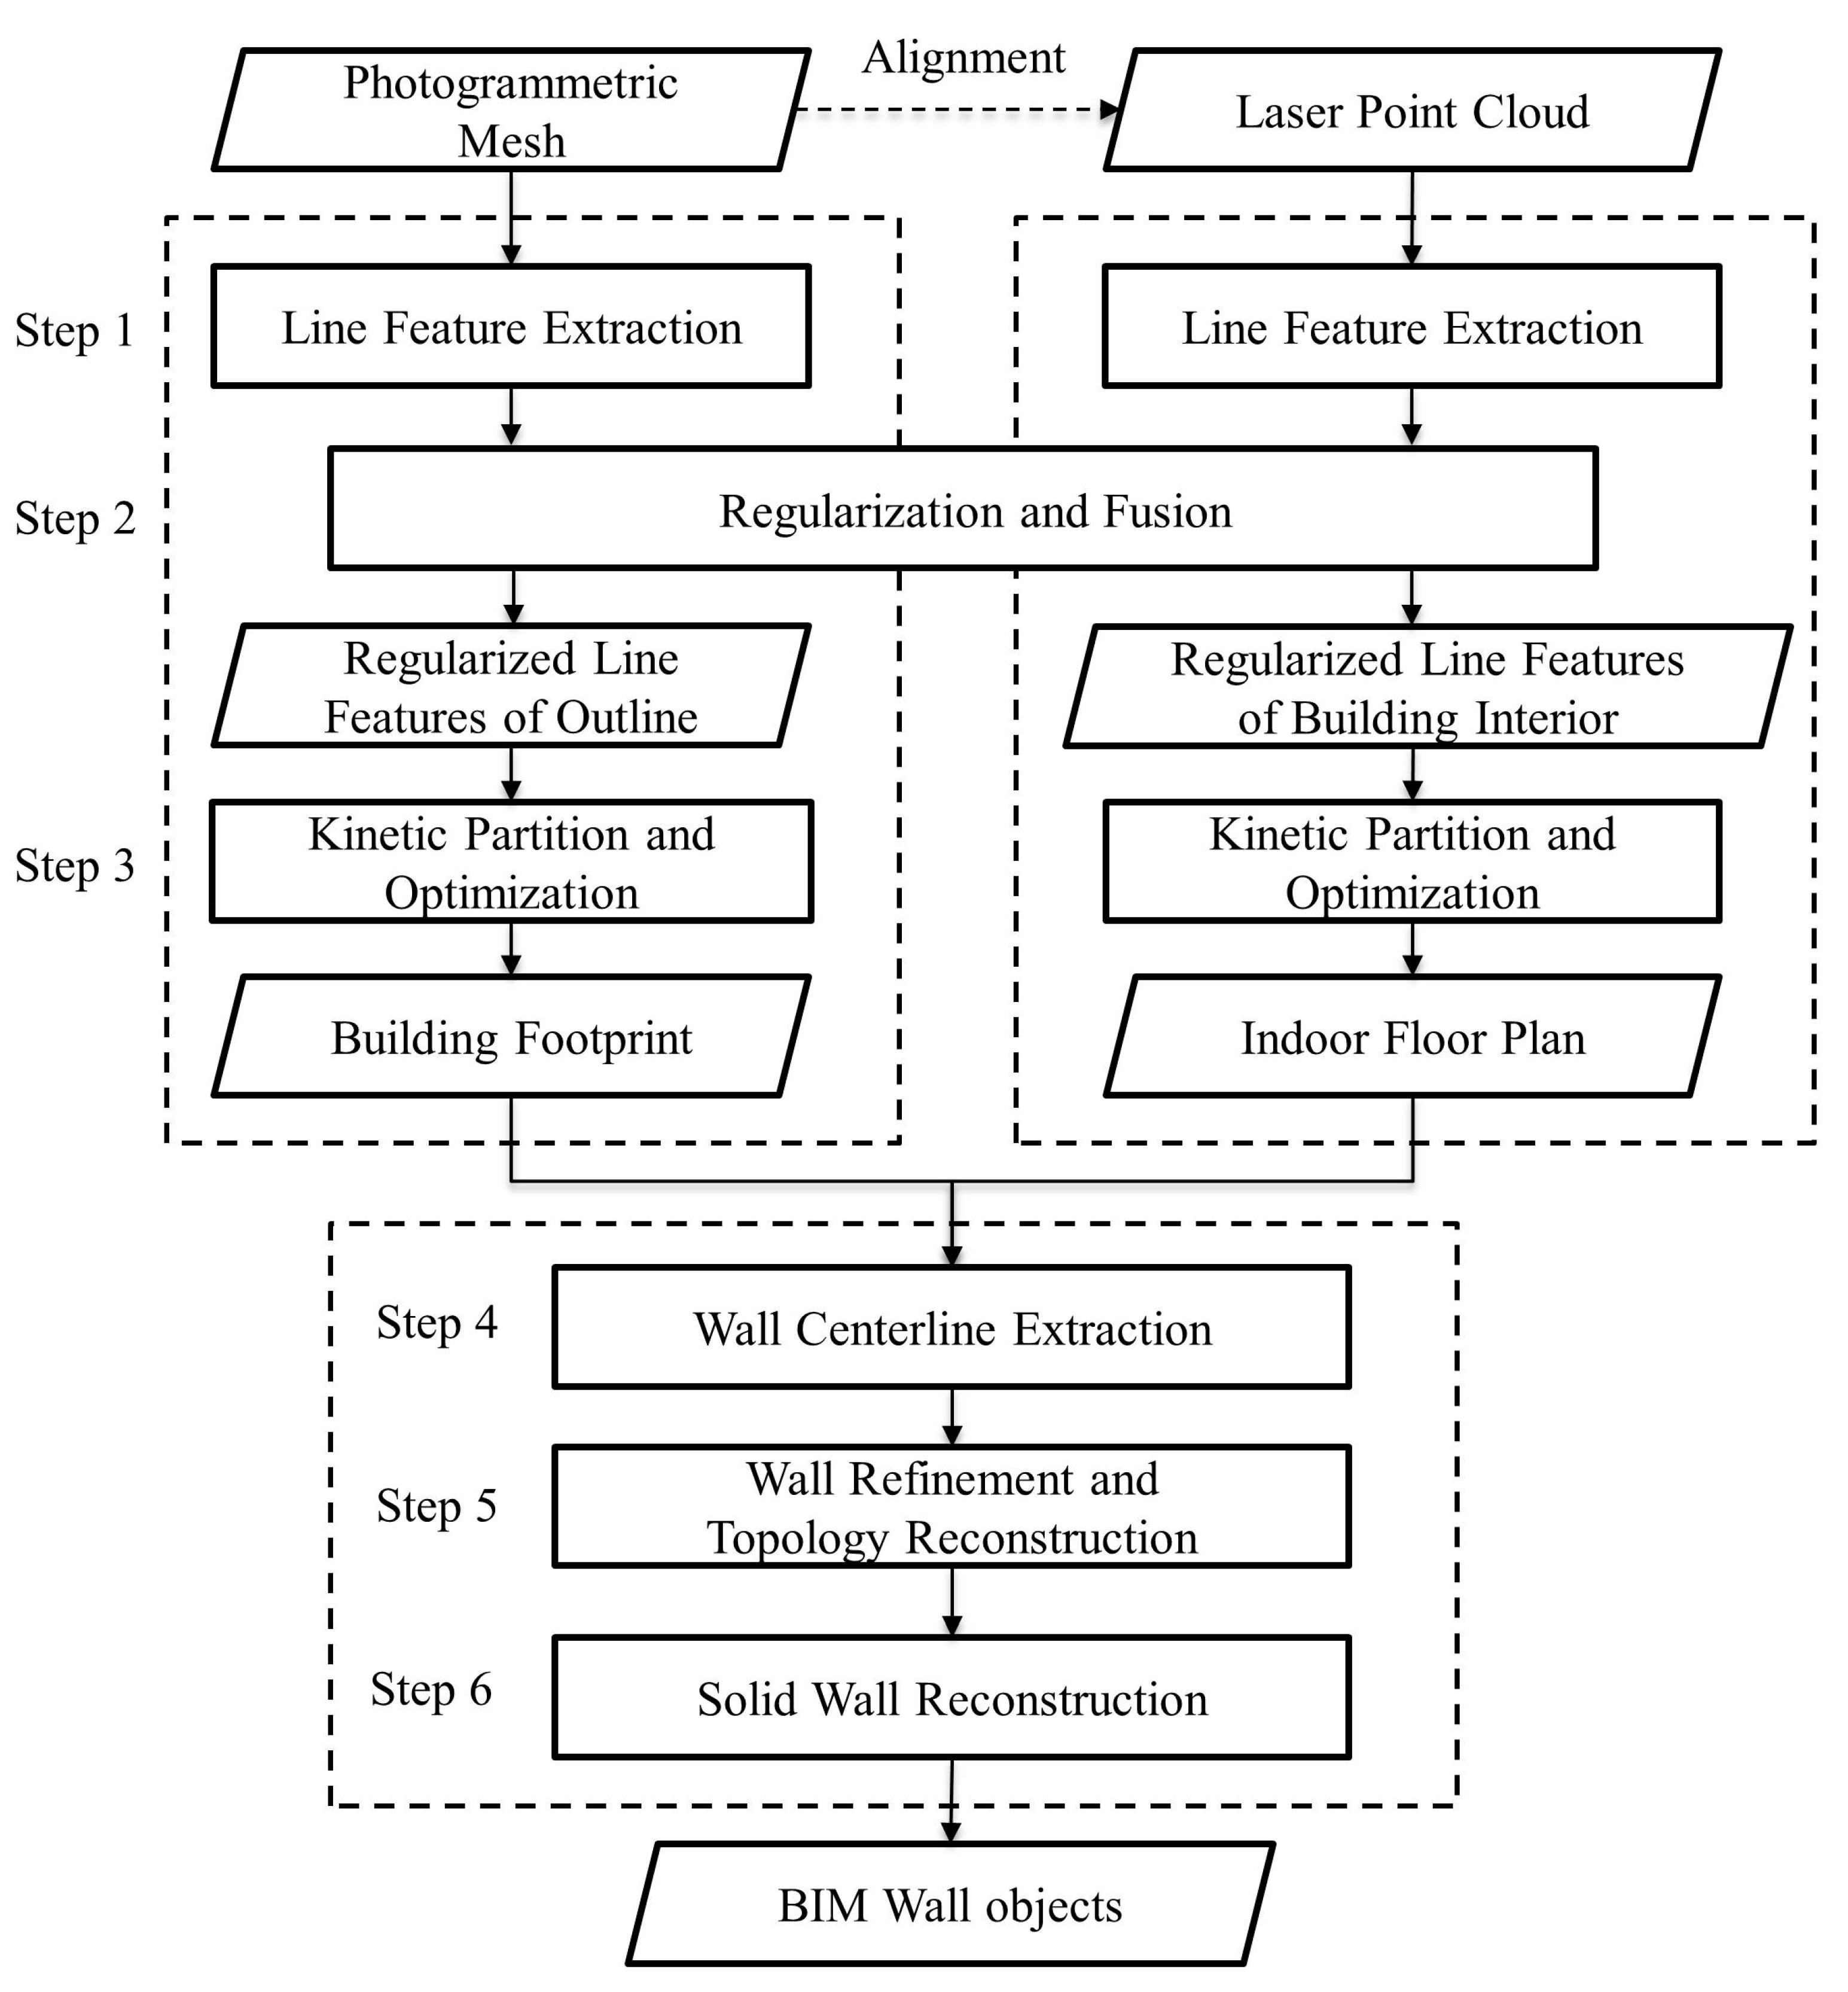
The flowchart of the proposed method is shown in Figure 1. It contains six steps: (1) line feature extraction, (2) regularization and fusion, (3) kinetic space partitioning and optimization, (4) wall centerline extraction, (5) wall refinement and topology reconstruction, and (6) solid wall reconstruction.

3.1. Line Feature Extraction

First, the contour-based line extraction method [36,37] is used to extract line features from the oblique photogrammetric surface mesh and 3D laser point cloud. For the photogrammetric mesh model, the relative ground elevation hs of the cutting plane is given along the Z axis direction. The intersection of the triangle in the mesh and the cutting plane is used to obtain the intersection line, and the linear segment features of the building outline are clustered using the region growth algorithm.
For the input 3D point cloud data, along the Z axis, the given slice thickness is σ s . The input point cloud is segmented by a set of parallel planes, and the layered point cloud is projected onto the corresponding reference plane to form a contour point cloud slice. For a layered point cloud, its middle position is defined as the projection reference plane of the layer, and all data points in the layer are projected to the reference plane to form a point cloud slice P′. Then, line features are extracted from the segmented slice point cloud P′. The efficiency of the direct point-based calculation is low, while rasterization can not only improve the efficiency of the calculation but also ensure sufficient accuracy when the pixel size is sufficiently small. Common image edge-detection algorithms (such as the LSD algorithm [32]) use gradient information to calculate the edge information. However, for the rasterized point cloud slice, the centerline of the slice cannot be accurately extracted using edge gradient information, which will lead to a reduction in the accuracy of the extracted line feature. Therefore, in this study, a line feature detection algorithm based on eigenvector calculations (E-LSD) is proposed. This algorithm can accurately extract slice line features by replacing the gradient direction with the eigenvector direction. This method uses a small pixel size to ensure the geometric accuracy of the extracted line segment (usually the pixel size is set to 0.01–0.02 m). Algorithm 1 is a line segment detection algorithm based on the eigenvector proposed in this paper. The algorithm adopts the same region growing and line fitting strategy based on rectangle estimation as LSD algorithm [32], and the angle threshold θ s used in the region growing algorithm is usually an empirical value. Due to the existence of measure errors of direction vector, the angle threshold usually adopts 10 to 30 degrees.
Algorithm 1. E-LSD
input: point cloud P τ .
output: list of rectangles.
M occ ; // 3D occupancy probability grid
P′ ; // 2D slice point cloud
   P = ProjectTo 2 D P τ ; // set the z value to 0 for each point
   M occ = 2D_OPG( P ); // calculate 2D coordinates of occupied and free pixels in OPG
  Status(allpixels in M occ ) = NotUsed;
  DensityAndLinearity(allpixels);
  for each ( p allpixels )
  if Status(p) = NotUsed then
  region = RegionGrow( p , θ s , Status );
  Rect = RectApprox(region);
  end if
  end for

3.2. Regularization and Fusion

Due to noise and missing data in the point cloud, the line features extracted from the oblique photographic mesh and point cloud may contain a significant number of redundant and broken lines. In addition, the extracted line features do not take into account the constraint that the surface of a wall typically appears as a pair of parallel faces. Therefore, in this paper, the line feature regularization method [38] is used to jointly regularize the two types of line features; then, the two types of line features are separately fused. With the combination of the line features of the building outline and line features of the building interior, parallel constraints are first added, and then the extracted redundant lines and broken lines are fused to reduce the data amount of extracting line features. The polar coordinates are used to represent linear segments; taking the x-axis as the polar axis and denoting the quadrant angle of each line segment as x i   , the relative angle between Line Segment L i   and Line Segment L j in Neighbor M i is α ij . Let I i   denote the quadrant angle of Line Segment L i   and let I i denote the quadrant angle after reorientation; then, the quantity to be added to the initial orientation is Δ x i = I i   I i ,   Δ x i θ max , θ max , and the object function for line-segment reorientation is:
U Δ x = 1 λ D x + λ V   x
D Δ x = 1 n i = 1 n x i   x i θ m a x 2
V Δ x = i = 1 n j > i θ i j   x i   x i   x j   + x j 4 θ m a x
when α ij approaches 0° or 180°, θ ij   = α ij . Approximately parallel line segments are corrected to become strictly parallel through V x . By Parameter λ 0 , 1 is a weight coefficient balancing the contributions of D x and V x , and its default value is 0.8. The U x objective function is minimized by solving the convex quadratic programming.
Continuing with the realignment of line segments, the expression of the straight line is still represented by a polar coordinate. With Δ x i d max , d max denoting the translation to be added to Line Segment i along its orthogonal vector, the formulations of D x and V x in Equation (1) are as follows:
D Δ x = 1 n i = 1 n x i   x i d m a x 2
V Δ x = i = 1 n j > i d i j   x i   x i   x j   + x j 4 d m a x
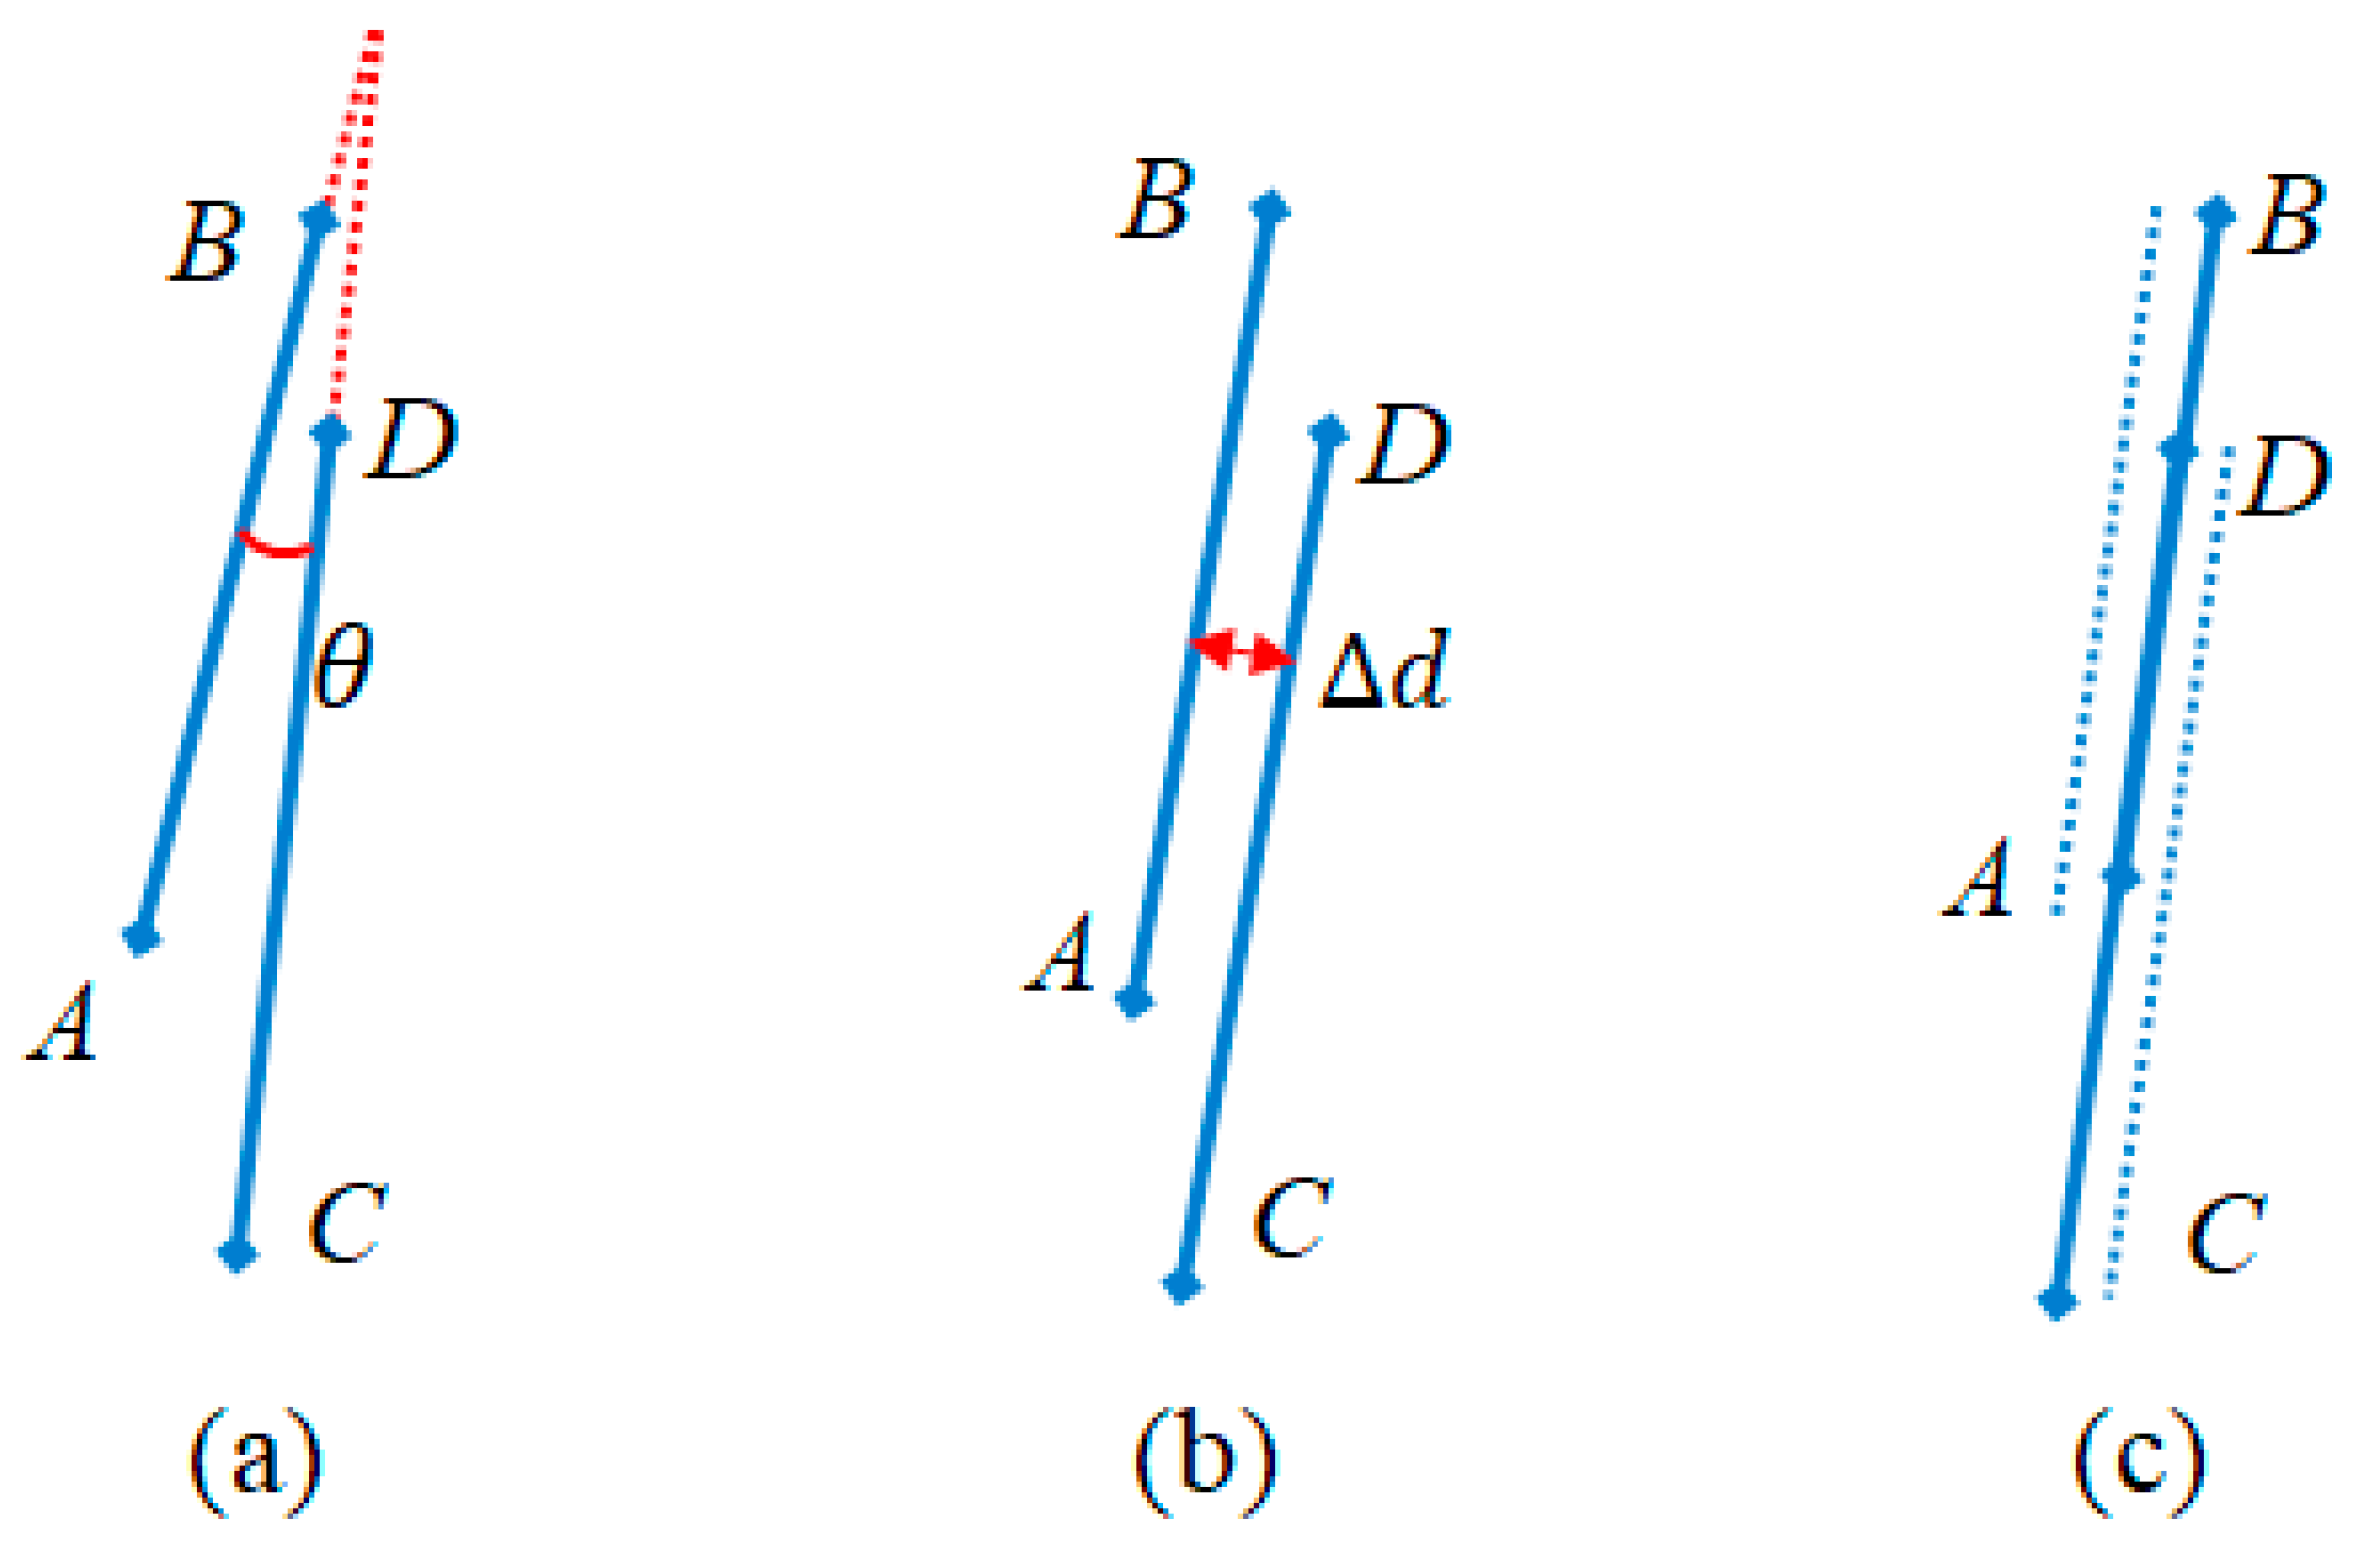
After reorientation and realignment, a new line-segment collection L = L 1 , L 2 , , L n is obtained. An example for line segment reorientation, realignment and line segment fusion is shown in Figure 2.

3.3. Kinetic Partitioning and Optimization

Architecture space partitioning and optimization mainly includes three parts: (1) voxel-based semantic classification of indoor space, (2) kinetic space partitioning, and (3) graph cut-based optimization.
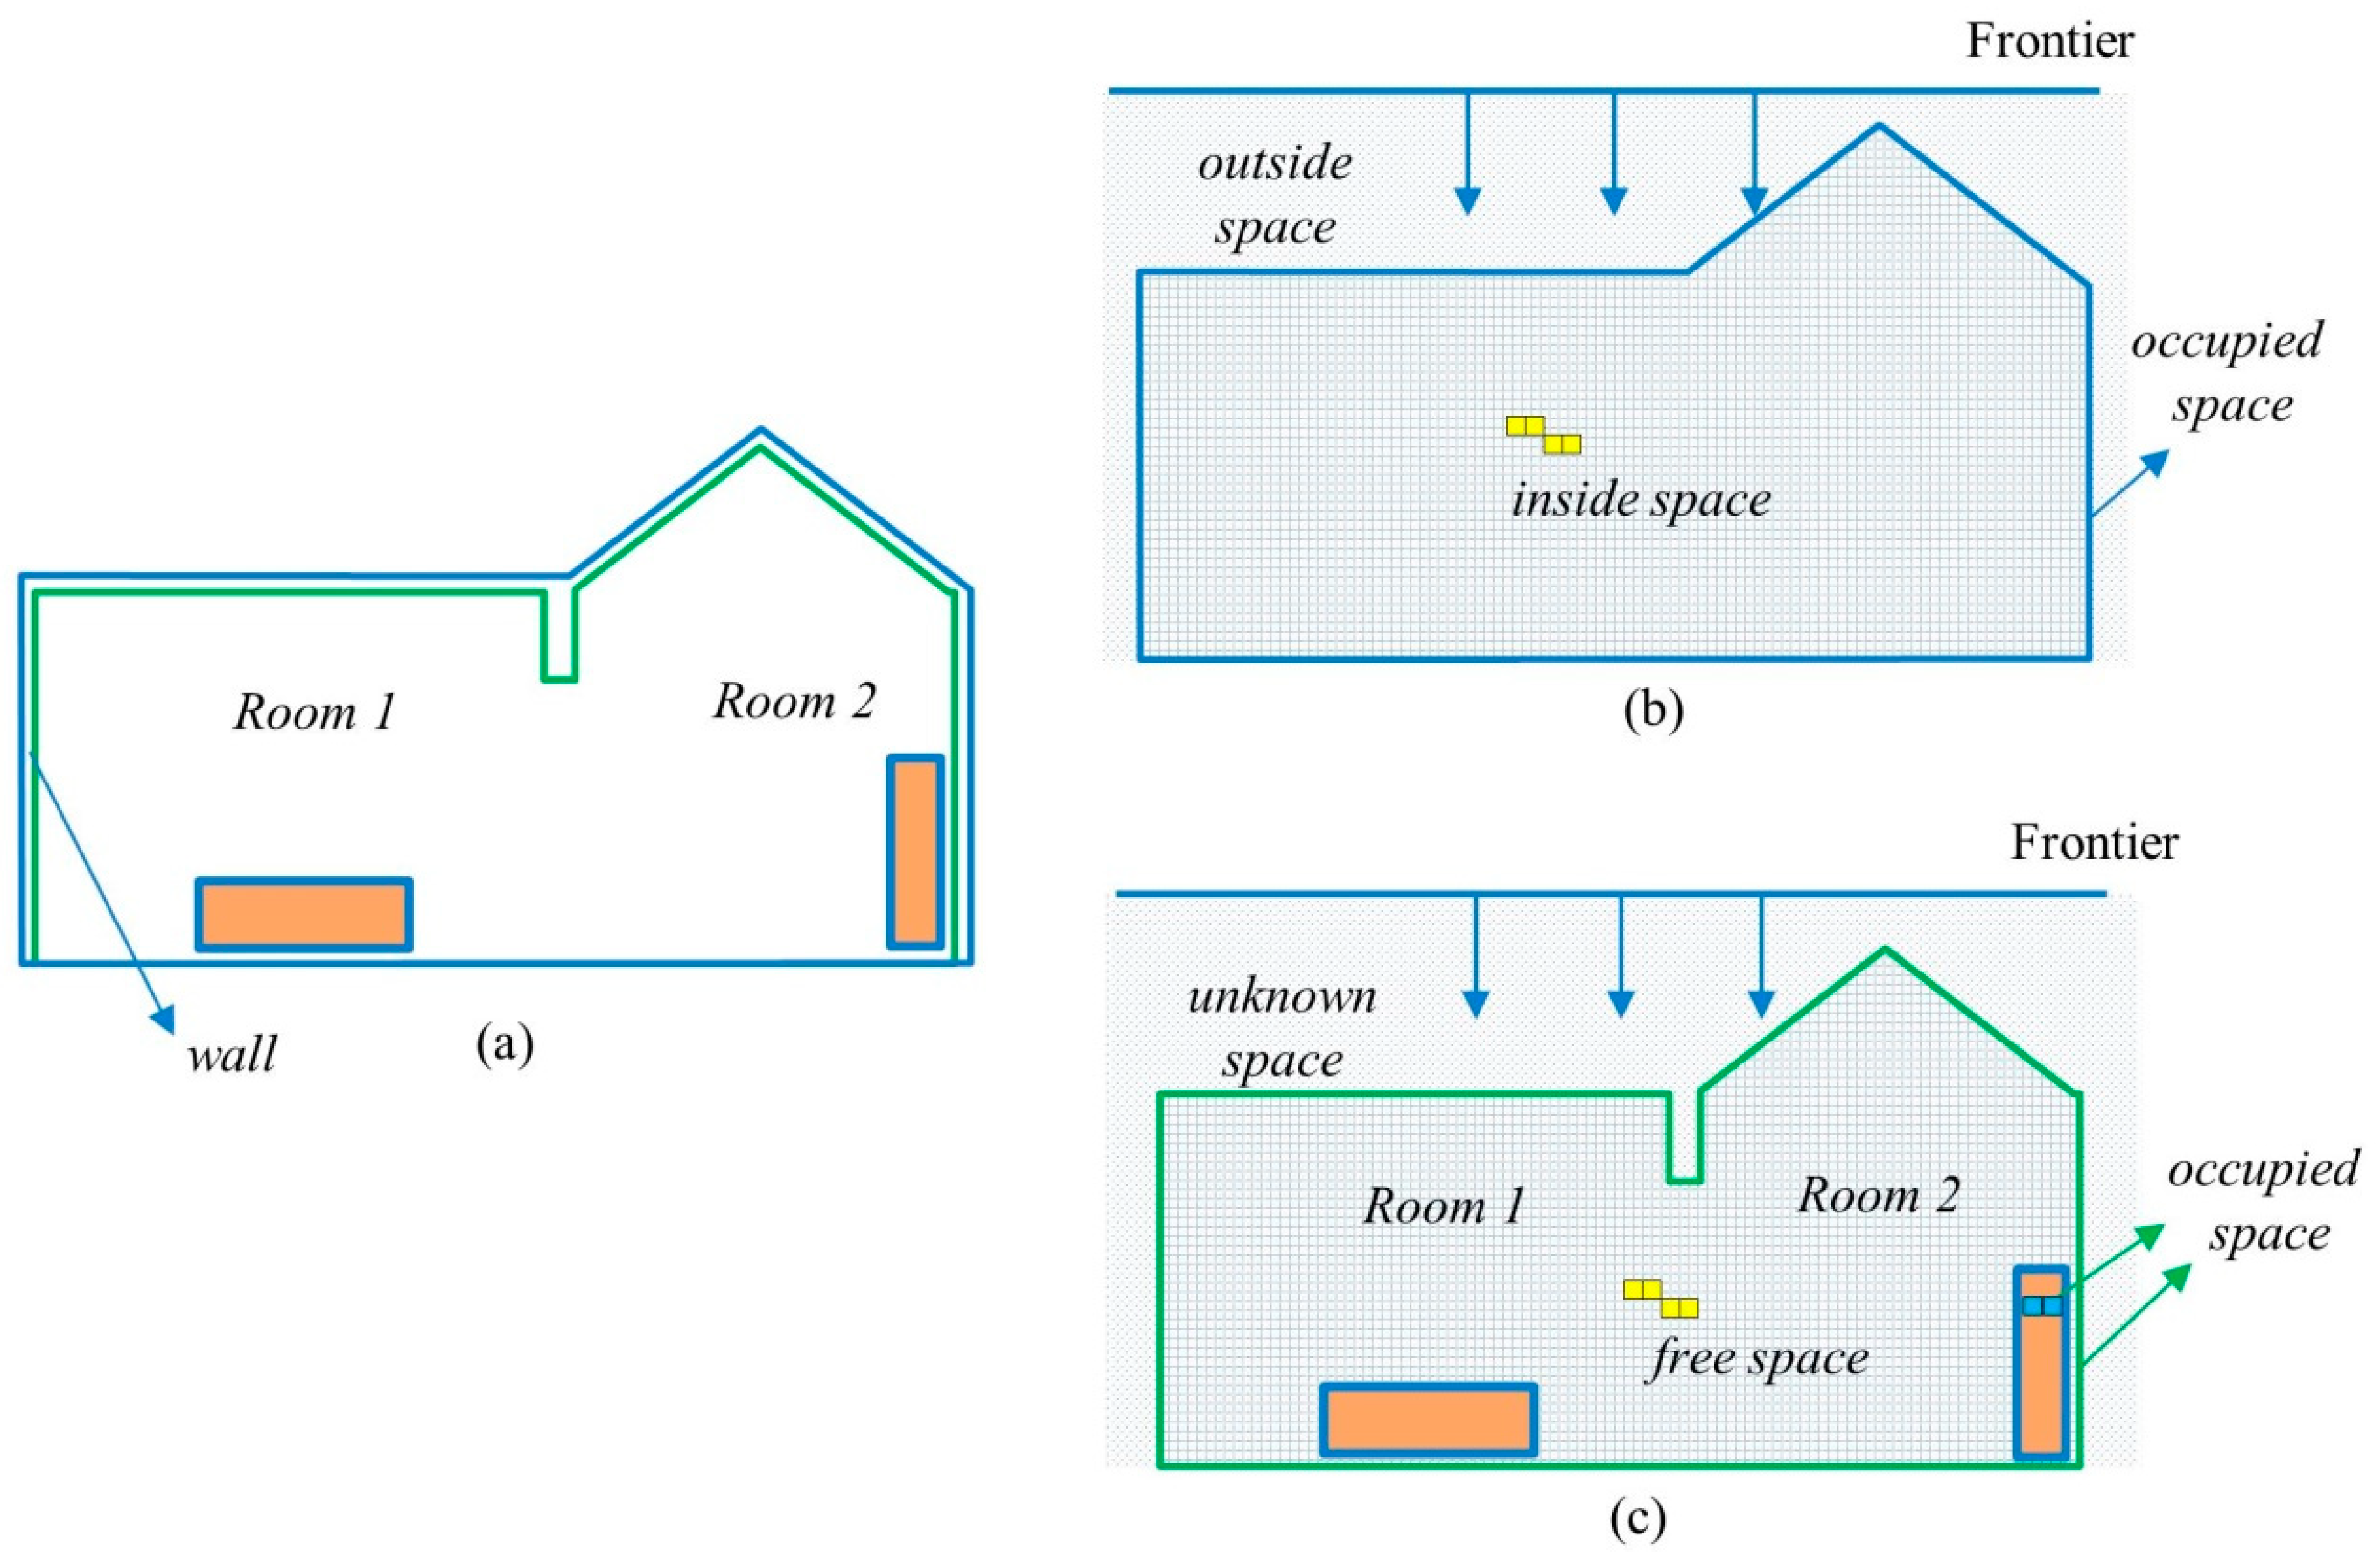
The voxel-based semantic segmentation of indoor space first initializes the discrete 3D occupancy probability grid (OPG) and sets the value of each voxel as free. Then, the voxels containing the points are marked as occupied values. The last step is to mark the unknown area. The algorithm initializes the boundary (the maximum value of the point cloud elevation range), sets each voxel as unknown, and traverses the voxels layer by layer according to the z-axis direction. When the voxel value of the current layer in the occupancy probability grid is the same as that of the previous layer, the value is marked as unknown; if the voxel value of the current layer is different from that of the previous layer, the traversal stops. This marks all unknown areas. As shown in Figure 3, the returned occupancy probability grid contains Svoxel = {Free = 0, Occupied = 1, Unknown = −1}. Then, the 3D room segmentation method [11] utilizes the volumetric representation and sphere packing of indoor space to separate free indoor space. Similarly, the occupancy probability grid for photogrammetric mesh contains Svoxel = {Inside = 0, Occupied = 1, Outside = −1}. The Algorithm 2 is used to refine the classification of inside space. The function 3D_OPG calculates the evidence that each voxel is occupied, free, or of unknown status. The function VDB_EDT is an implementation of a distance transform algorithm; M edt represents the distance from each grid voxel to the closest obstacle. The SpherePacking function packs the indoor space with a set of compact spheres to form rooms as separated connected components. Each connected component is treated as an initial seed room region and the wavefront growing algorithm is used to mark unlabeled voxels to obtain the final classification for inside space or indoor free space.
Algorithm 2 Semantic Labeling of Inside Space or Indoor Free Space
input: P: photogrammetric mesh or indoor laser point cloud; s voxel : the voxel size of the grid map; δ overlap : overlap ratio threshold for two spheres; r : minimum room volume threshold
output: M label : voxel-based grid with semantic labels
M opg ; // 3D occupancy probability grid
M edt ; // grid for Euclidean distance transform (EDT)
M seed ; //initial seed regions
M label ; // inside space or indoor free space
(1)
M opg = 3D_OPG P , s voxel ;
(2)
M edt = VDB_EDT M occupied ; // EDT
(3)
R = SpherePacking M edt ,   δ overlap ;
(4)
M seed = InitialSeedRoom M edt ,   R ,   r ;
(5)
M label = WavefrontGrowing M seed ;
After the regularization and fusion steps are performed, the building outline segment and interior line segments are regularized jointly, and the two regularized segment sets are then fused separately. The building outline line and interior line segments are used as inputs for the kinetic space partitioning algorithm. A comparison between kinetic space partitioning and the traditional space partitioning algorithm has previously been discussed in the papers [39,40]. The algorithm based on kinetic space partitioning has obvious advantages over the traditional two-dimensional space partitioning method. The kinetic space partition algorithm is faster, and the constructed cell complex is simpler.
The kinetic space partitioning algorithm achieves the partitioning of the building topological space, thus transforming building space modeling into a problem of labeling the cell complex (Figure 4). The cell complex is expressed by the graph G = 〈V, E〉. With the source point s and sink point t, the node V corresponds to the polygon element of the cell complex, the undirected edge E corresponds to the adjacency relationship of the cells, and each cell is marked as free and non-free. Cut C of Graph G can divide Node V into two disjoint subsets A and B. The cost of Cut C = A ,   B is defined as the sum of the weights of all edges on the connecting boundary of two subsets A and B. The minimum cut is the cut with the lowest cost among all cuts of Graph G. The energy function is defined as:
E = W n + W t
where W n is the weight between vertex nodes and W t is the weight between a vertex and Terminals s and t.
W n = p , q V w p , q = p , q V e c p c q 2 2 δ 2
where p and q are adjacent cells, w p , q is the weight between p and q , and c p is the value of Cell p . Therefore, Equation (7) can be interpreted as a discontinuity penalty between Cells p and q . If p and q are more similar, then w p , q is larger. In contrast, if the difference between p and q is greater, then w p , q is smaller and close to 0. The two cells with large value gaps have very small weights, so they are the cells that need to be divided. After completing the cell-complex marking, the cell units are merged with the same label to obtain Polygon Q1 of the building outline and the indoor floor plan Q2.

3.4. Wall Centerline Extraction

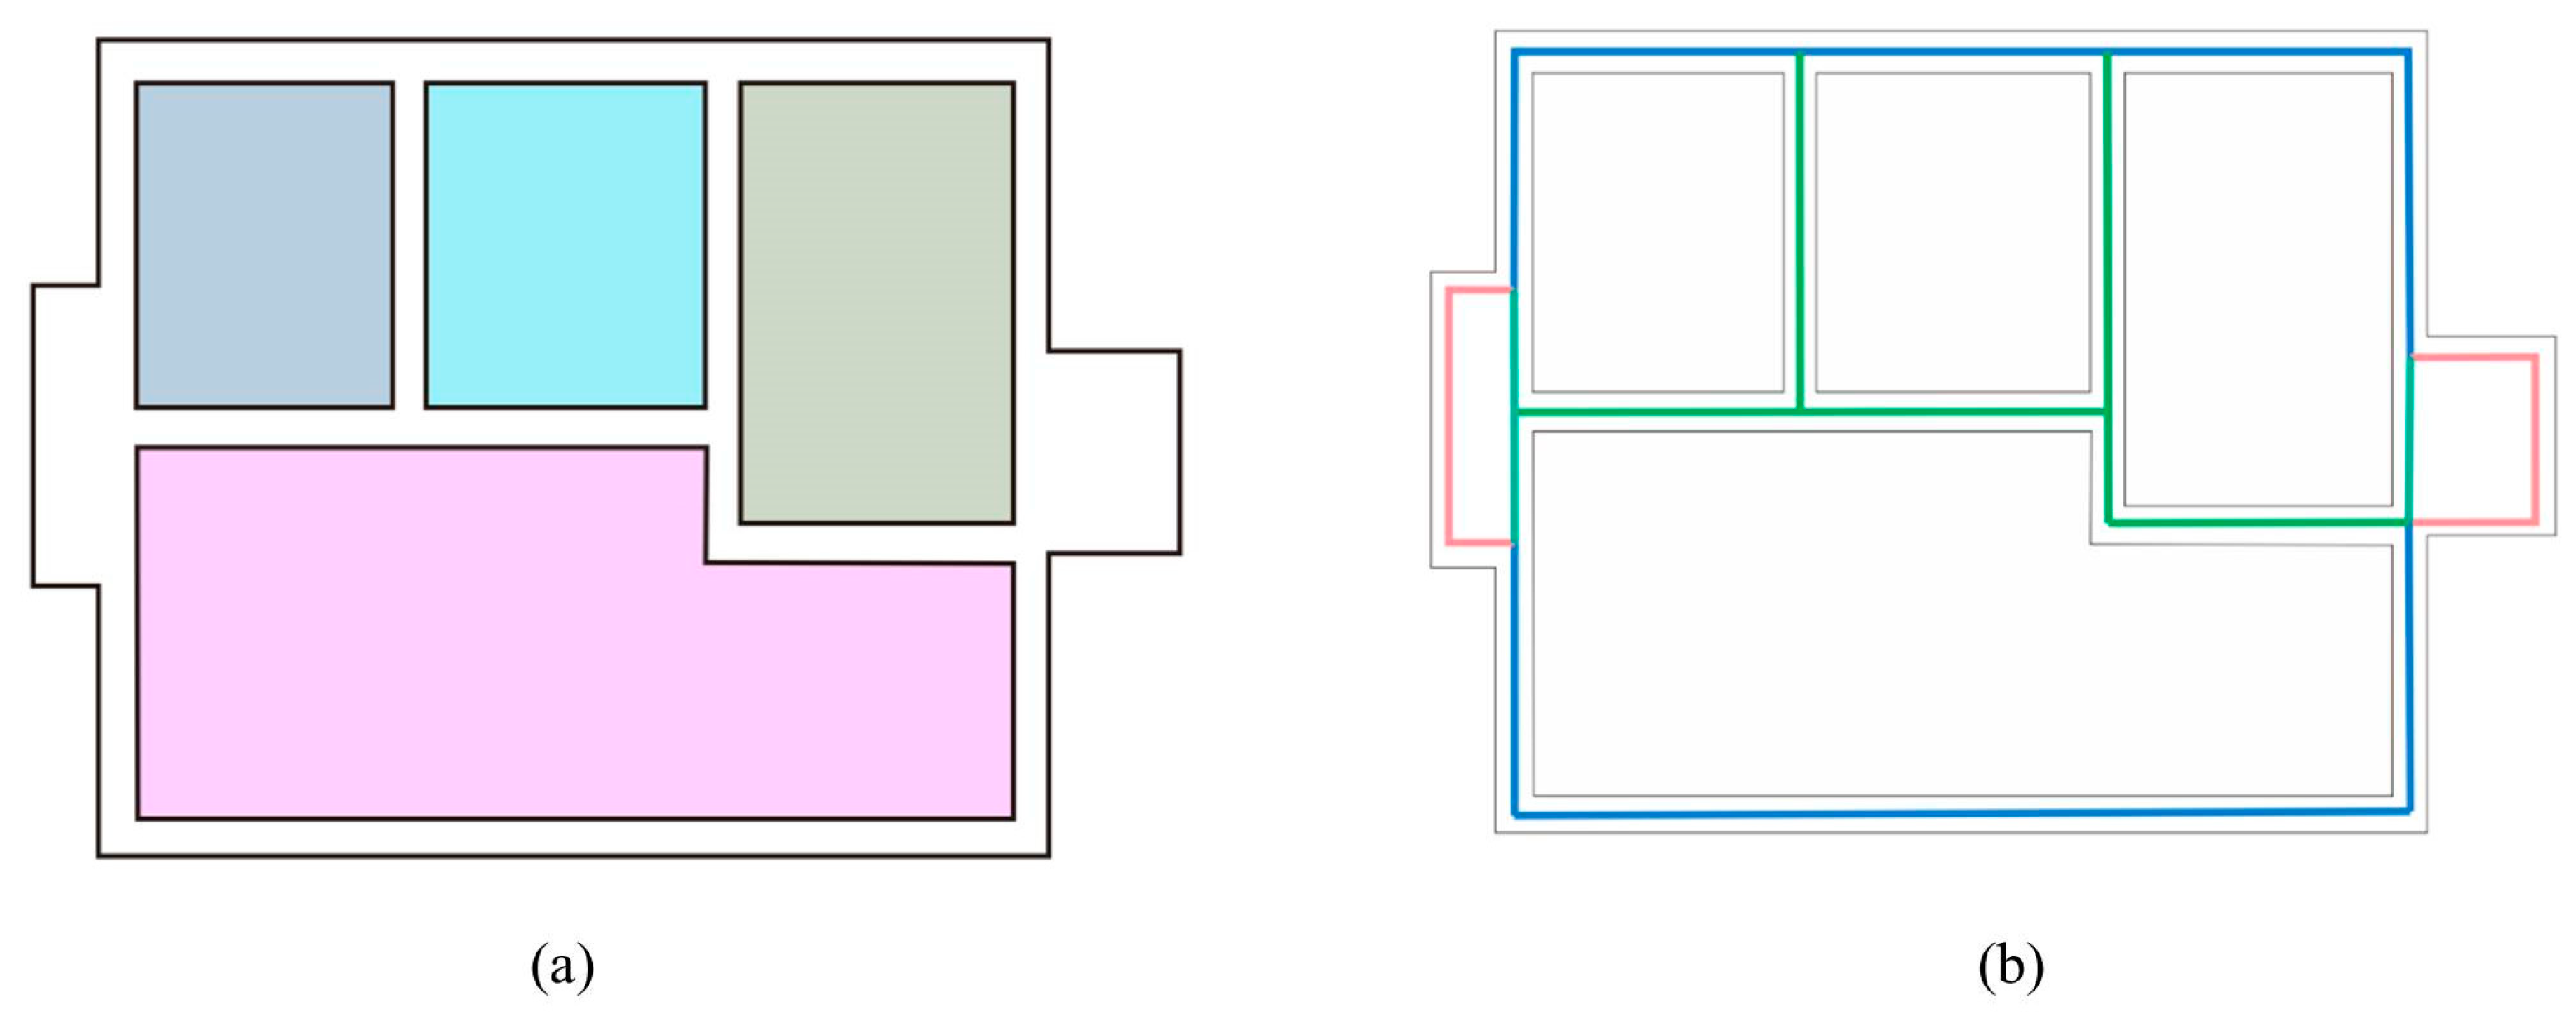
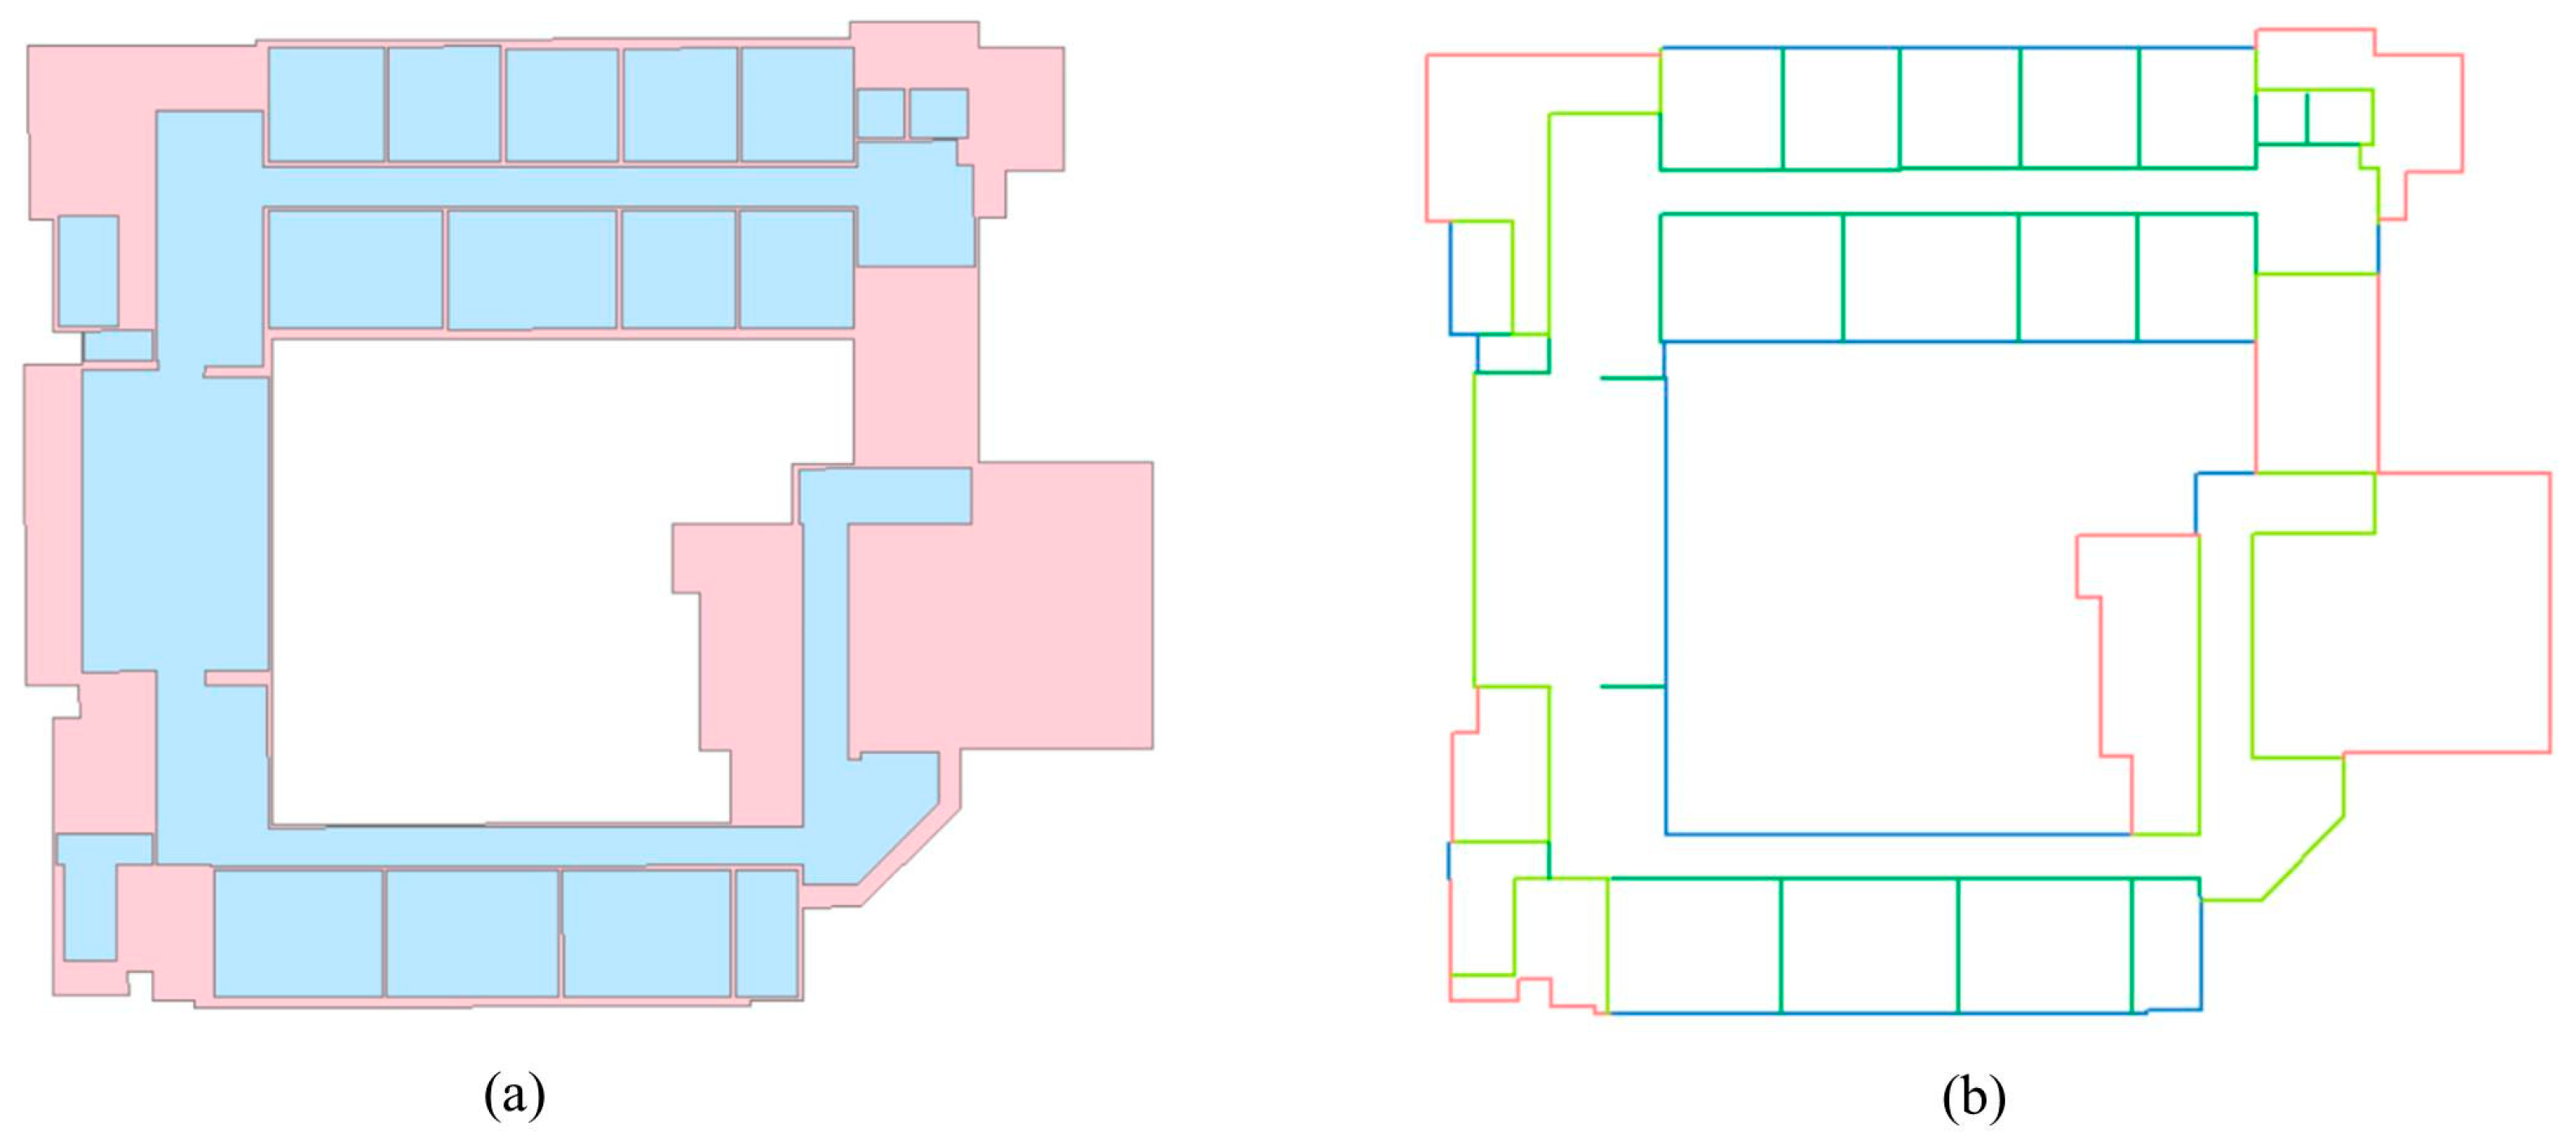
In this step, the building footprint Q1 and indoor floor plan Q2 are taken as inputs. We search the wall line segments in Q2 that are parallel to the line segments in Q1 with distances less than ε. The wall line segments in Q2 are classified as exterior walls and interior walls. The wall line segments in Q2 are broken when the line contains both exterior and interior parts. All the wall lines in Q2 adjacent to the outside of Q1 are extracted as exterior wall line segments, and the rest are used as interior wall line segments. To extract the wall centerline, the parallel line pairs are extracted, and the interior wall centerlines are then extracted. The algorithm calculates the middle points of all wall line segments, and constructs Delaunay triangulation (DT) for the middle point set. For each line segment i, the nearest neighbor of each line segment is obtained by searching the neighbor points in DT, and then the nearest neighborhood Mi is constructed. We denote the angle between Line Segment i and Line Segment j as θ . If the angle is less than θ m a x and the distance between Line Segment i and Line Segment j is less than the threshold ε , the two line segments are parallel. For a straight wall, the centerline of the interior wall can be calculated using the median of the vertical intercept in the straight-line equation. The thickness of each wall is estimated by calculating the orthogonal distance between two parallel lines (Figure 5). If the outline of Q1 has no adjacent line segments in Q2, the most common thickness among the exterior walls is used for it.
For the case in which only an indoor laser point cloud is available, the user inputs the thickness of the exterior walls for modeling. Because the thickness of the exterior wall components cannot be determined from single exterior wall surface line segments, the exterior wall thickness t 1 is assumed to be the most common exterior wall thickness. A dilate operator is performed for Q2 to obtain building footprint Q1. The wall line segments in Q2 are classified as exterior walls and interior walls. The centerlines of the exterior walls and interior walls are extracted by searching the parallel line pairs and calculating the median of the vertical intercept of the straight-line equation.

3.5. Wall Refinement and Topology Reconstruction

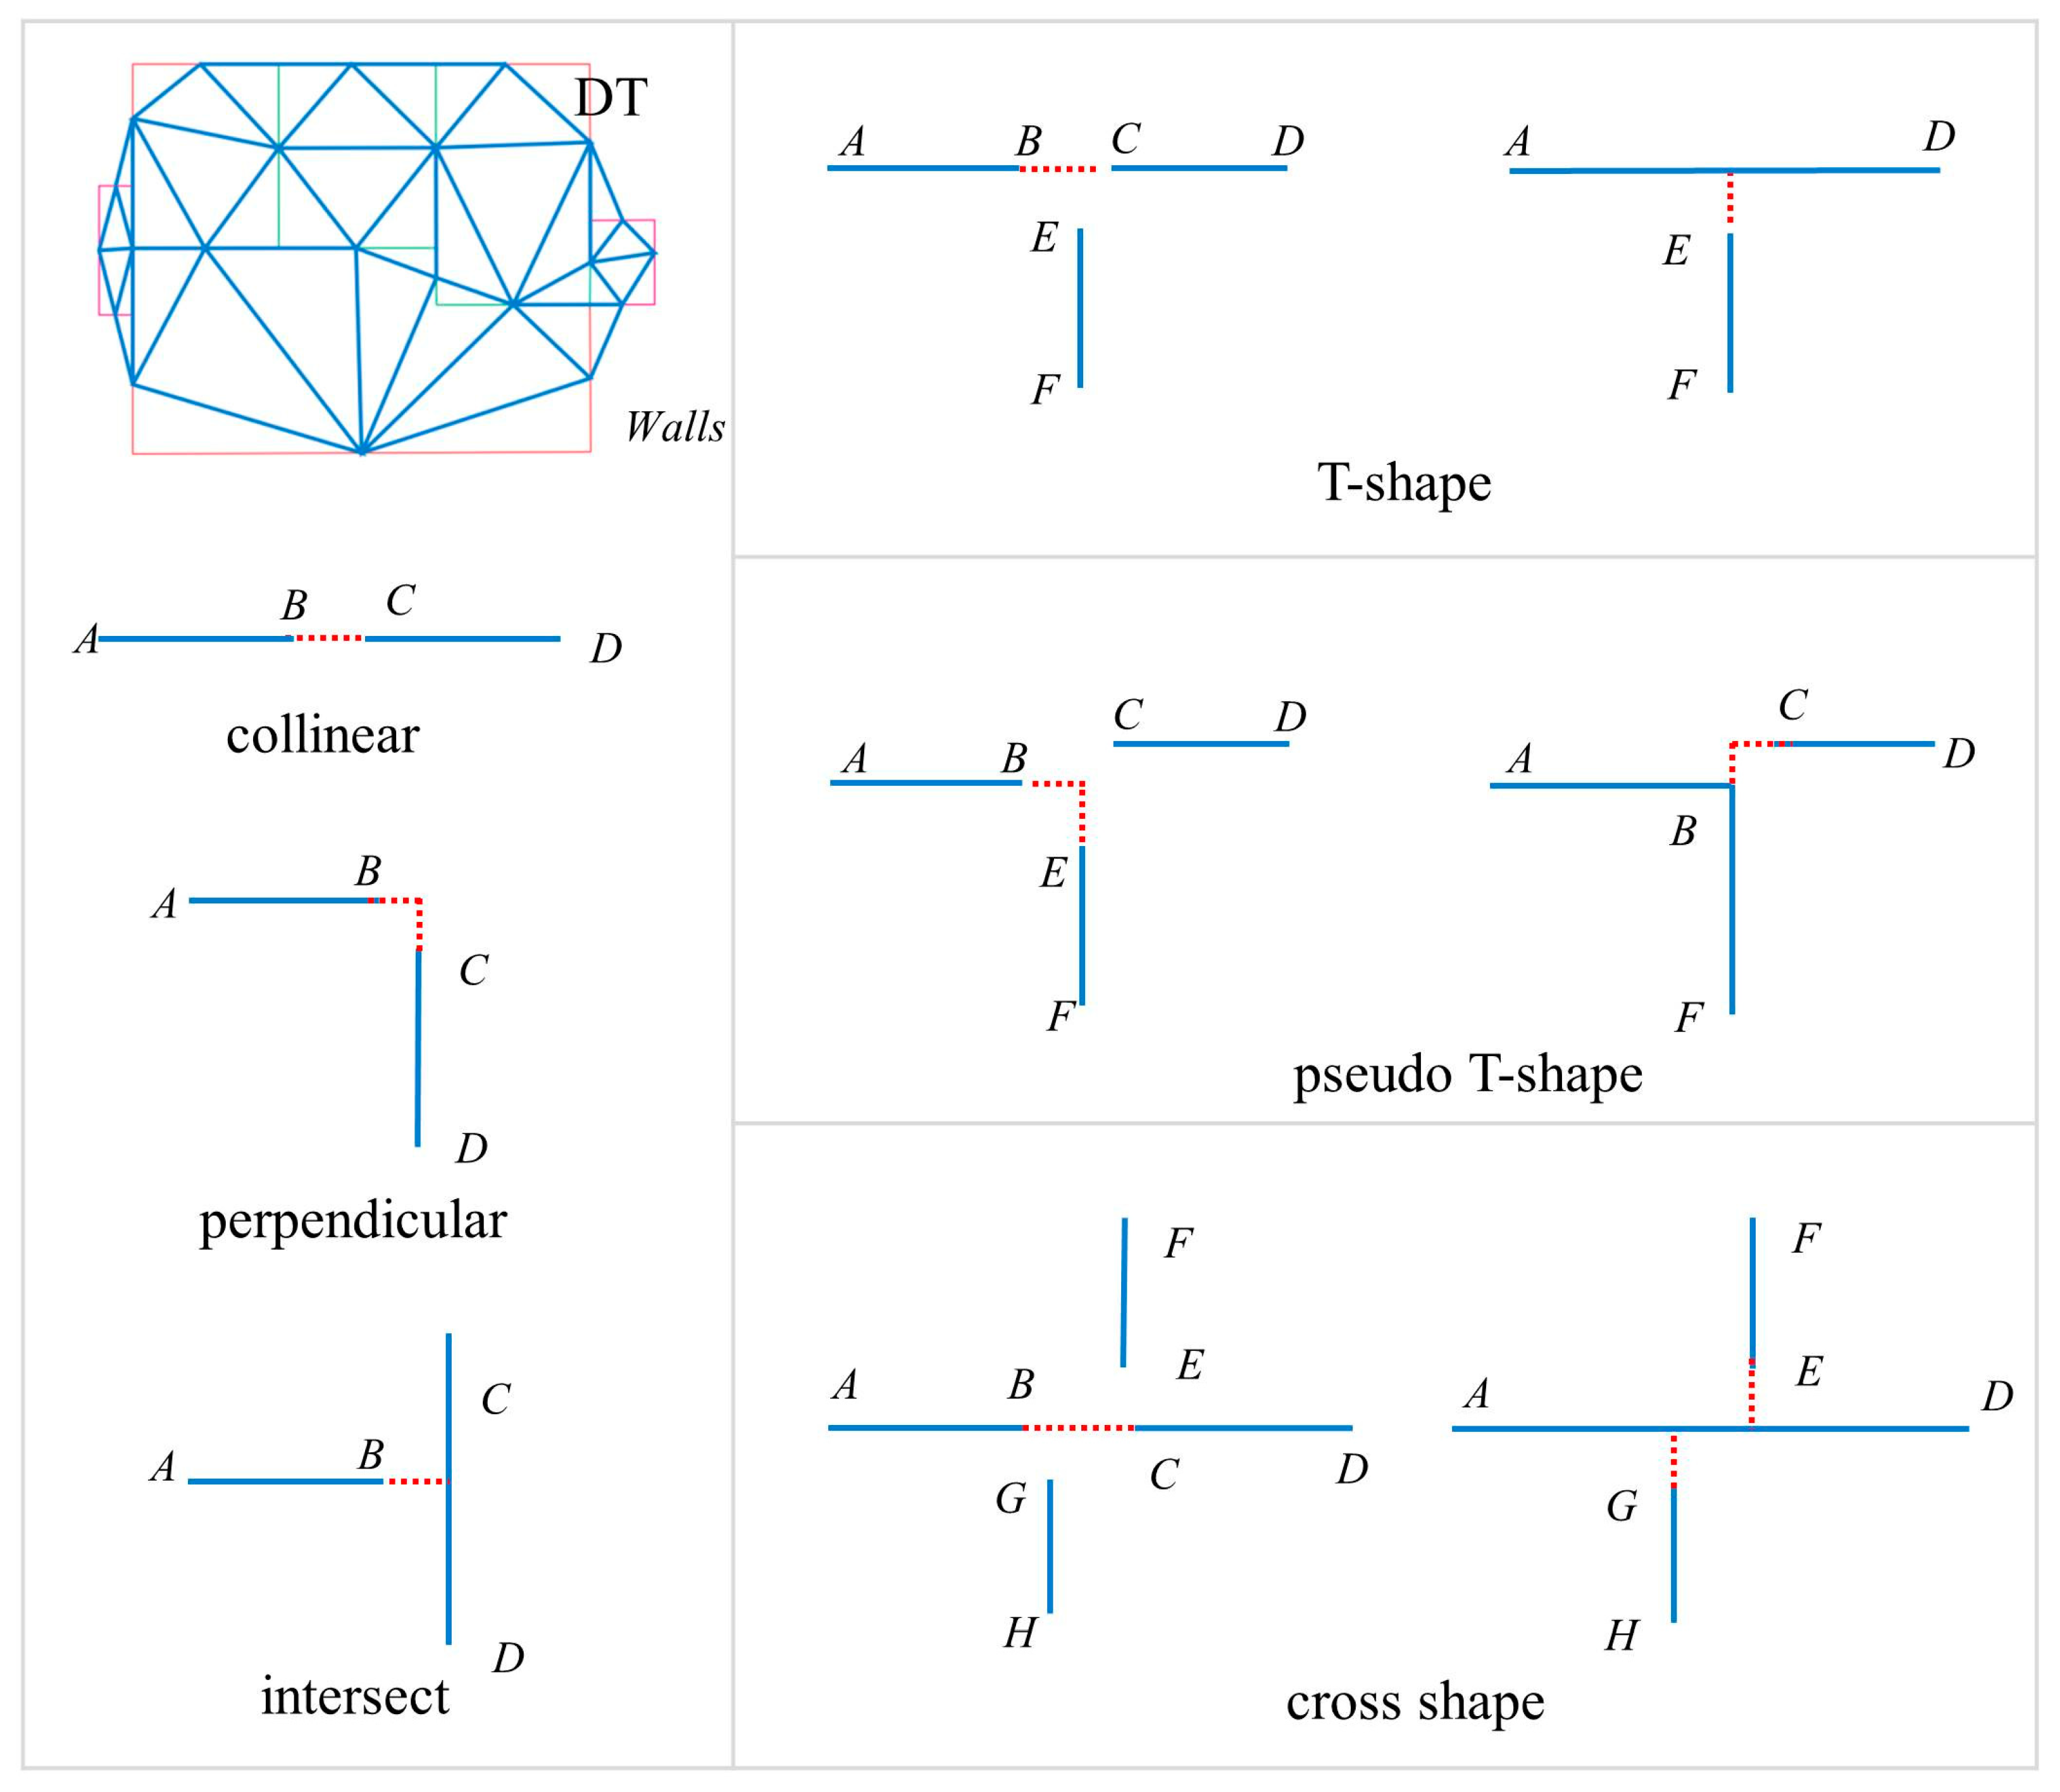
Because this method depends on the unit characteristics of the interior space, the same wall may be divided into different sections because it adjoins multiple rooms. The cases where the wall centerline needs to be merged are divided into three cases: adjacent and collinear, vertical, and intersecting. As shown in Figure 6, the walls with “T”, pseudo “T”, and the cross shapes in space are merged according to the primary and secondary principles to obtain the final wall object centerline parameters. The specific method is as follows: the center points of all wall centerline segments are obtained, and the DT is constructed.
The centerline i of each wall segment is traversed, the nearest neighbor of each wall centerline is obtained by searching the neighbor points in the DT, and the nearest neighborhood Mi is constructed. For each line segment i, the angle between line segment i and its nearest neighbor j is calculated. If the angle is less than 5° and the distance between Line Segment i and Line Segment j is less than the threshold σ 1 , the two segments are merged. The neighborhood Mi is updated in this way until all segments have been processed.
The center points of all updated wall centerline segments are again obtained to build the DT. For each line segment i, the angle between line segment i and its nearest neighbor j is calculated. If the angle is 90° and the distance between the end points of Line Segment i and Line Segment j is less than the threshold σ 1 , then the two line segments are perpendicular. If the angle is less than 45° and the distance between the end points of Line Segment i and Line Segment j is less than the threshold σ 1 , then the two line segments are considered to intersect. The neighborhood Mi is updated until all segments have been processed.

3.6. Solid Wall Reconstruction

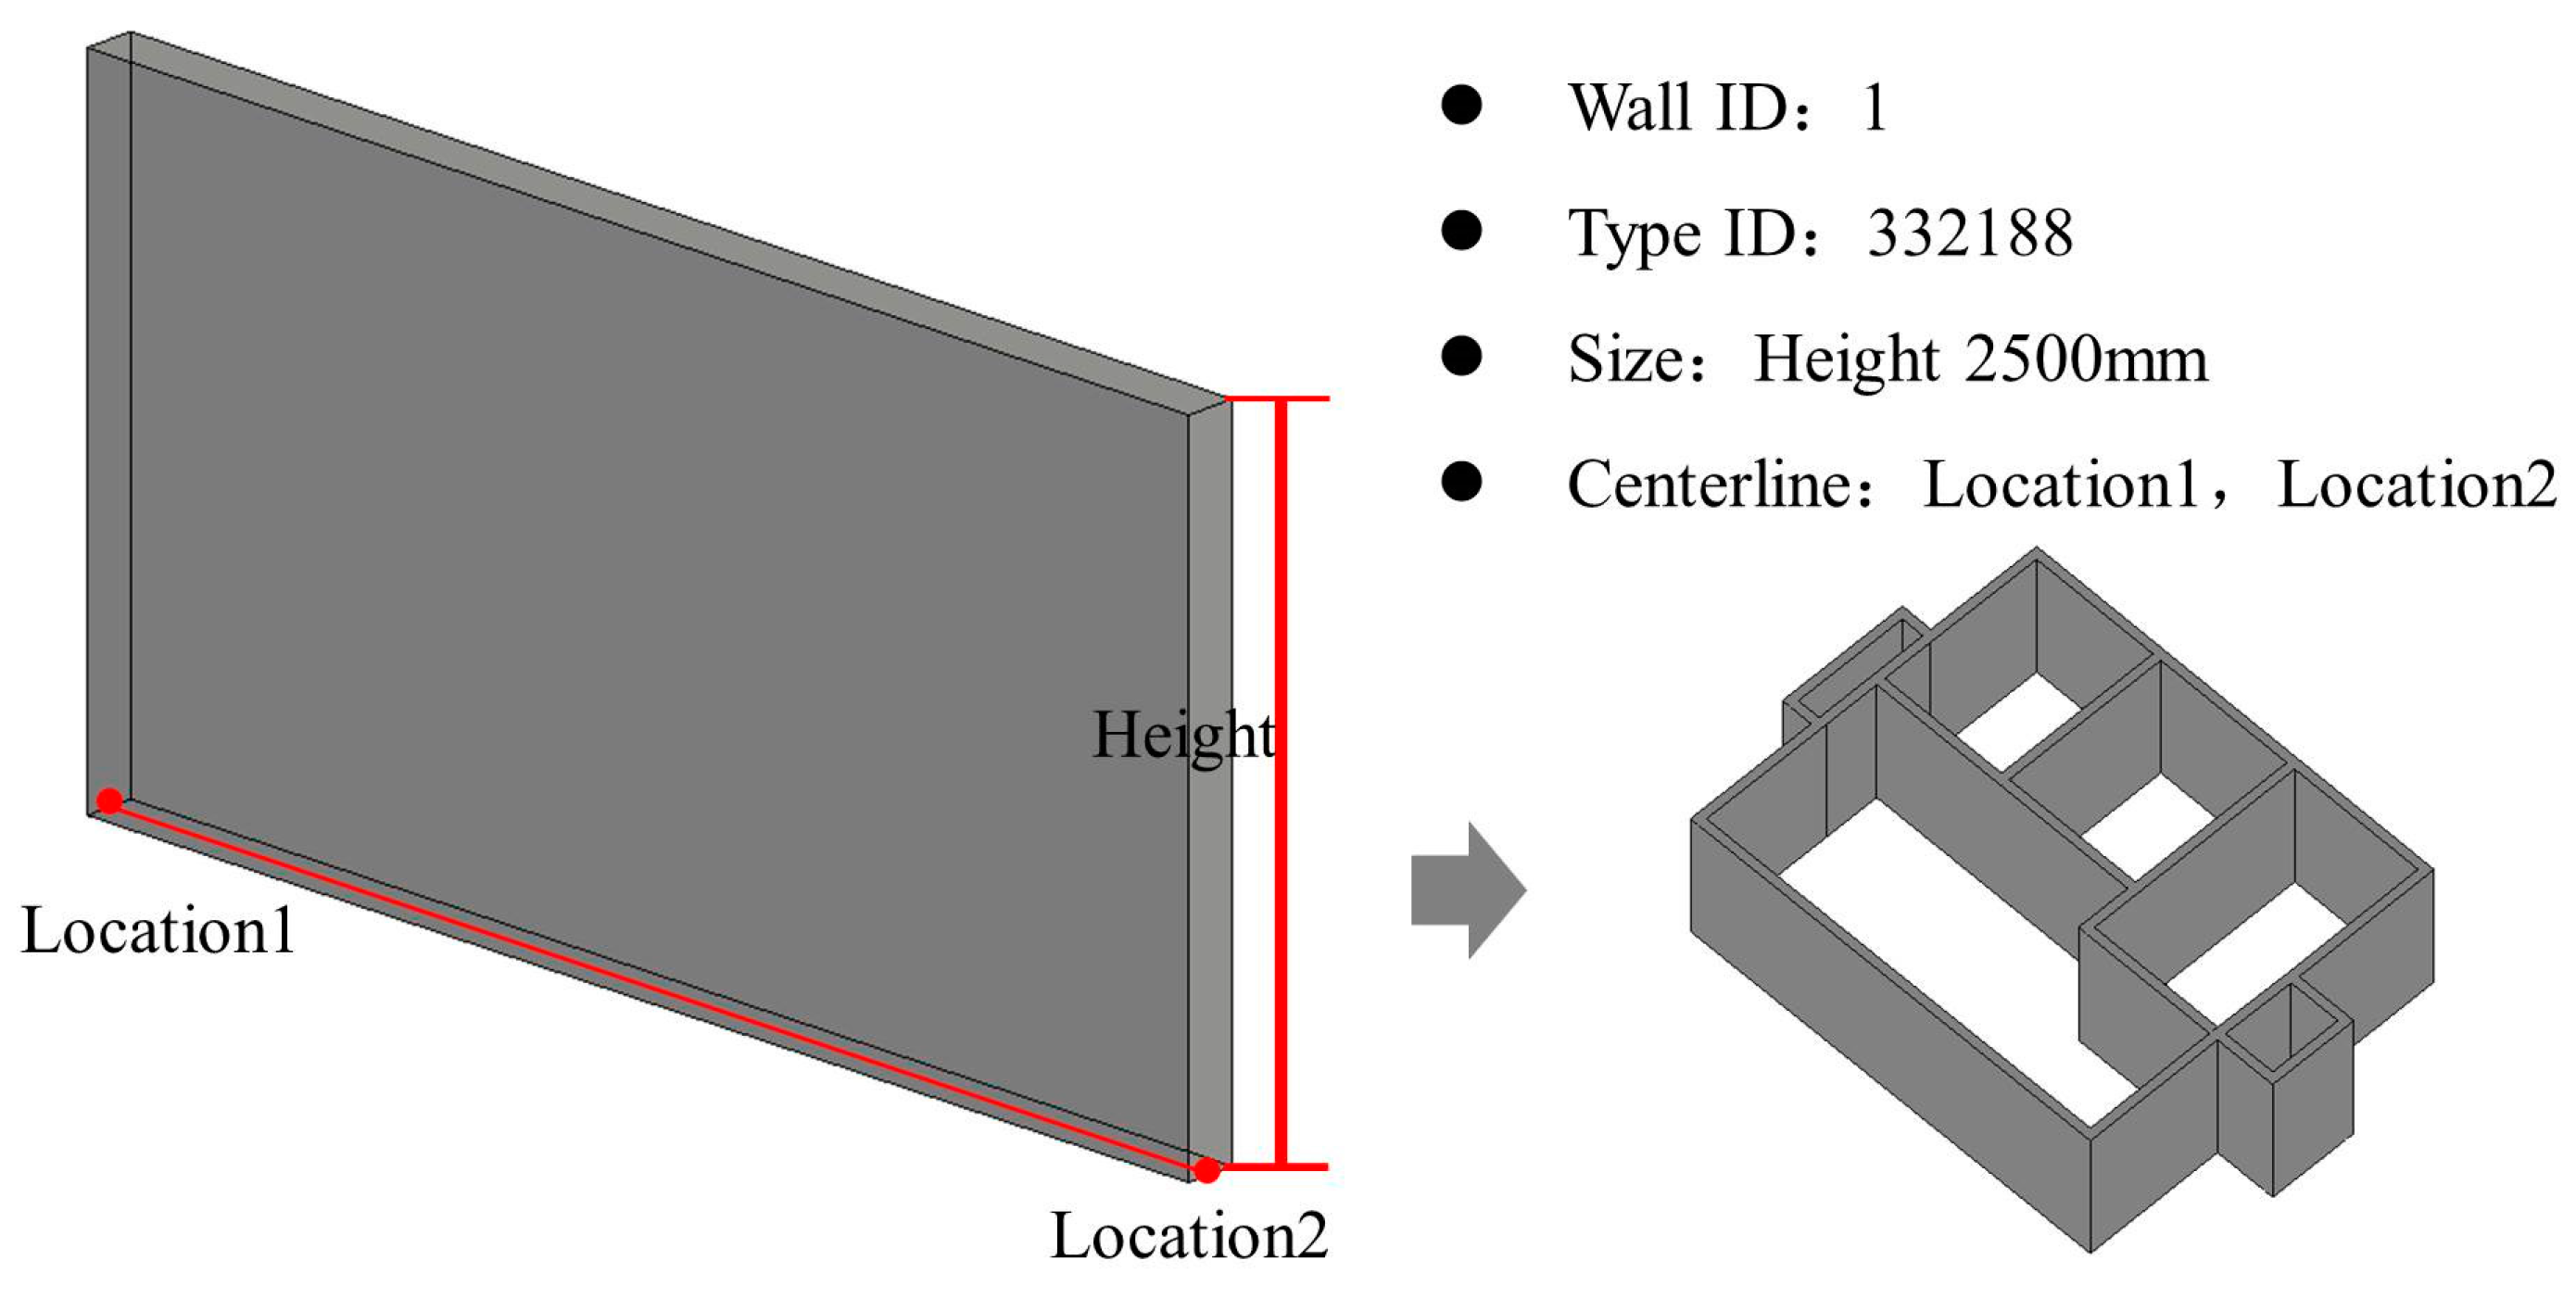
After topological reconstruction, the topological map of the wall centerline is still maintained. Wall reconstruction depends on the elevation, wall type, and height parameters (Figure 7). The wall elevation is detected based on the Z value of the floor. A histogram method [32] is used to obtain the Z value of floor, and the average height from floor to ceiling. The elevations of all walls are sorted, and the level set H is extracted by Gaussian clustering [41]. The wall type is characterized in accordance with the wall thickness, material, and other parameters. To build the BIM solid wall object, each wall centerline is traversed, and the corresponding wall type and level parameters are selected as the input to the parametric BIM wall generation function. The topological connections are built between the walls, and between the walls and rooms. Moreover, the required reference information is added. The room boundary surface parameters are adjusted, the associated wall objects are considered, and the room object is rebuilt accordingly.

4. Results

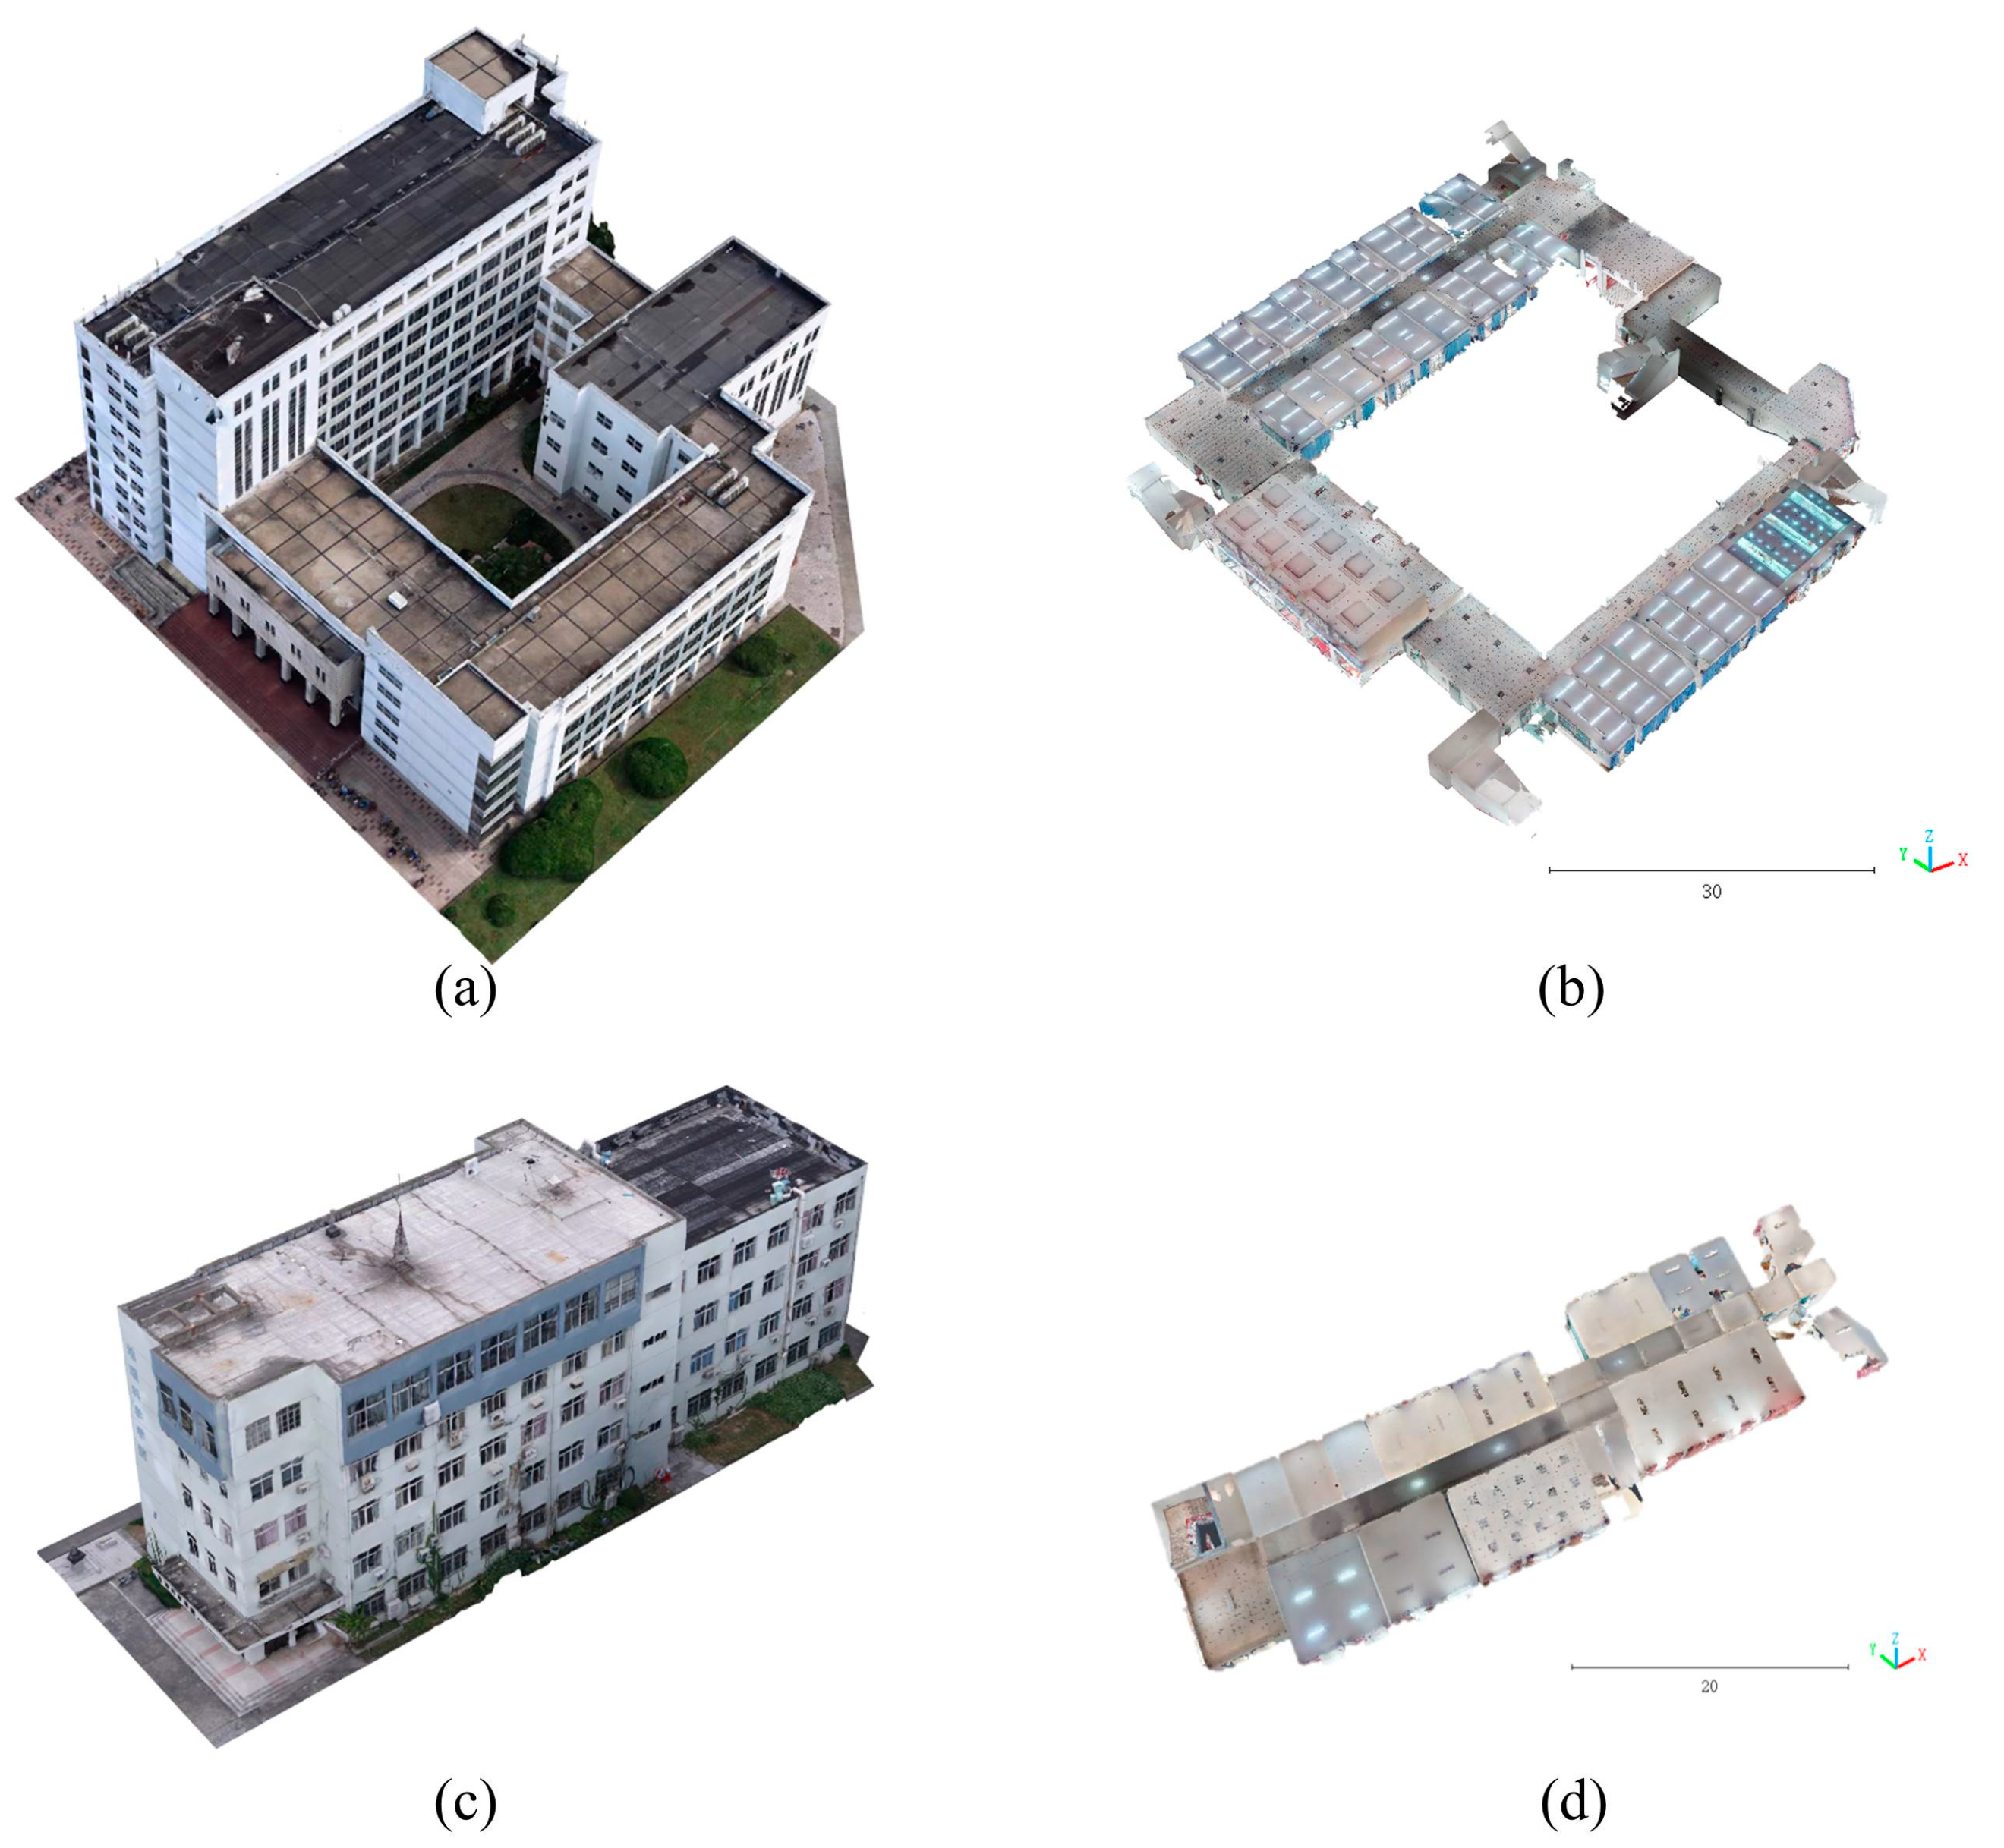
To verify the effectiveness of the proposed method, two real-world datasets were used for the experiment (Table 1). A DJI Phantom 4 RTK was used to capture UAV images of the building of interest from the air using an oblique angle of view. The control points were uniformly arranged in the survey area to ensure measurement accuracy. A Trimble TX8 scanner was used to obtain the laser scanning point cloud in an indoor environment, and targets are used to assist the registration of adjacent stations. A total station was used to capture the targets’ coordinates in the indoor environment. To meet the needs of coordinate registration between the UAV photogrammetric meshes and laser scanning point clouds, a control point layout was designed for UAV photogrammetry and laser scanning in the same coordinate system. Because multiple floors can usually be separated into single floors for processing and the floors are similar, only one floor of laser point cloud data was used in the experiment (Figure 8). For both datasets, the flight altitude is approximately 50 m, the forward overlap rate is 80%, the side overlap rate is 70%, and the flight speed is 4 m/s. The ground resolution of the image is 0.02 m. The Trimble TX8 captures data at one million points per second with a typical scan. The original point clouds are subsampled with a minimal distance of 5 mm between two points. For Dataset A, 11 photo-control points (5 as checkpoints) were set up and 6 target coordinates were captured. For Dataset B, nine photo-control points (four as checkpoints) were set up and six target coordinates were captured. For the photo-control point, CGS2000 coordinate system and Gauss three-dimensional zone projection were adopted; the central longitude is 121°, and the elevation system is the 1985 National Elevation Datum. The reference background solid walls of the datasets were manually obtained. The maximum-overlap metric was used to find the correspondences between the reference and the results. The reference model’s solid walls were modeled as cellular spaces to guarantee one-to-one correspondences, which is in line with the specification of the IndoorGML standard [42]. The completeness, correctness, and quality index are used to evaluate the accuracy of wall object detection:
C o m p l e t e n e s s = T P T P + F N
C o r r e c t n e s s = T P T P + F P
Q u a l i t y = T P T P + F N + F P
Here, the number of true positive ( TP ) refers to the number of solid walls detected in both the reference data and the reconstruction results. The number of false positive ( FP ) is the number of detected solid walls not found in the reference data. The number of false negatives ( FN ) is the number of undetected ground-truth solid walls. The accuracy of the wall surfaces is evaluated using M Acc [43,44], which is defined as:
M A c c = M e d π j T p i ,   i f   π j T p i r
where π j T p i is the vertical distance between Vertex p i in the source model and Plane π in the reference model; and r is the truncation threshold that is used to prevent the influence of an incomplete or inaccurate source model. To determine how far off the closest surfaces in the reference model are from the sample points representing the source surfaces, the Med function is used to compute the median Euclidean distance between them. Relatively high completeness and low correctness scores mean that the reconstructed models contain most of the elements that are present in the corresponding reference models but that they also include a considerable number of incorrect facets.
The algorithm in this study is implemented by using C++, Computational Geometry Algorithm Library (CGAL) [45] and CloudCompare [46]. The BIM object generation plug-in program is developed based on C# and Revit API. All experiments use an Intel Core i7-10750H CPU (2.60 Hz) and 32 GB RAM. Table 2 shows the input parameters for the experiment.
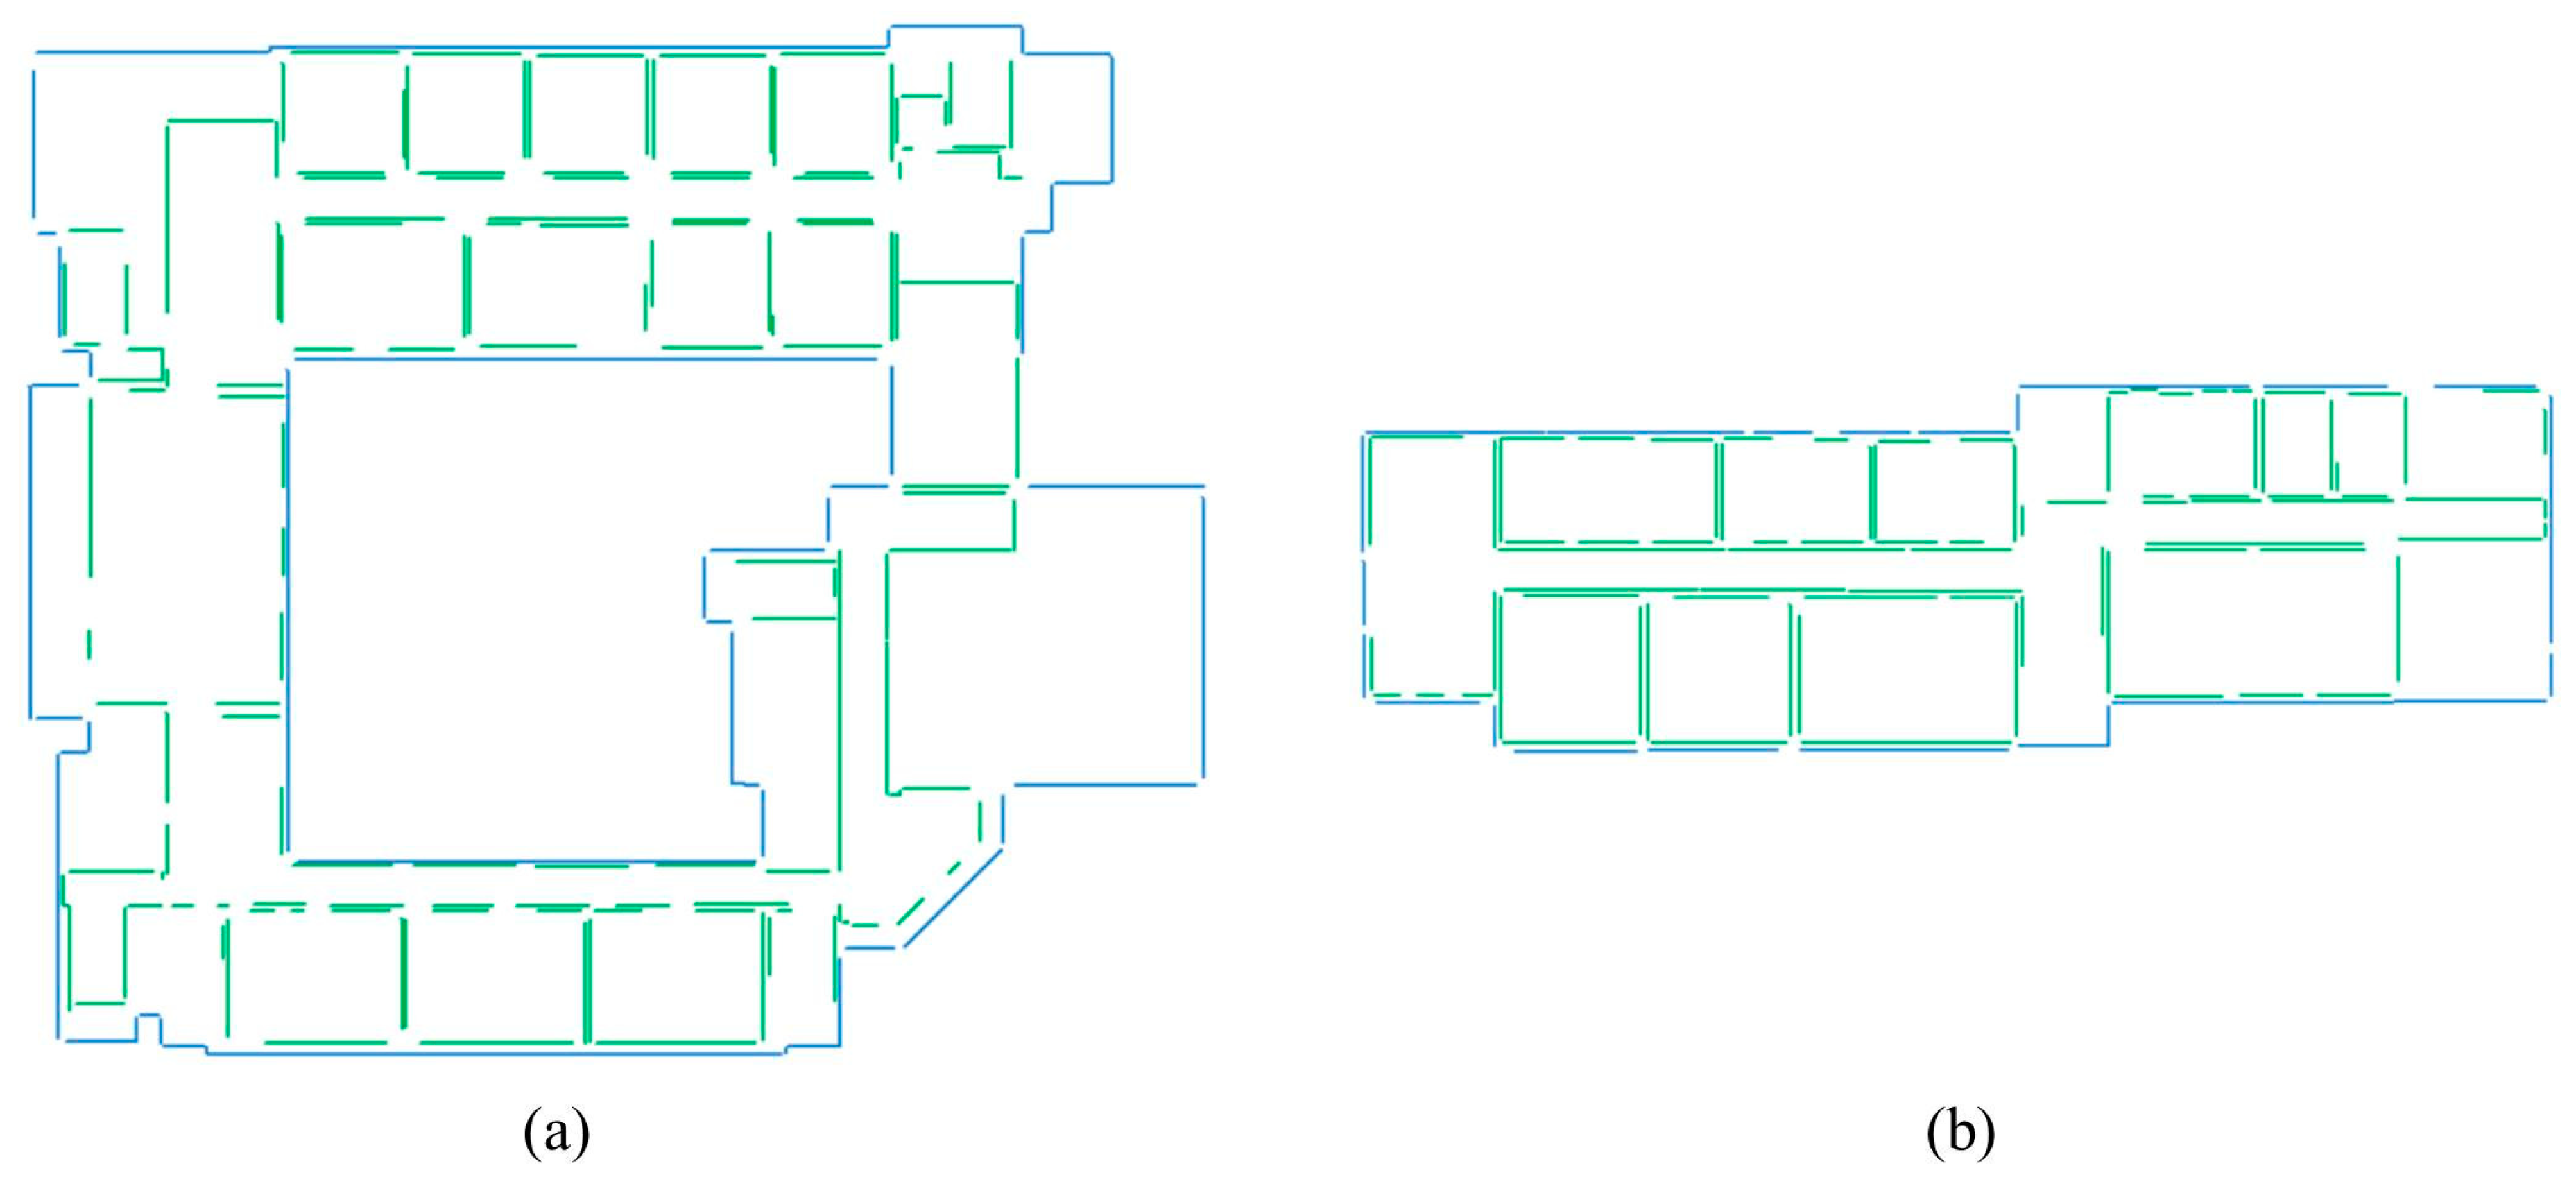
The line features of the UAV oblique photogrammetric mesh and laser scanning point cloud are extracted first. In Dataset A, the angle threshold is set to 22.5°, and the relative ground elevation is 2 m for mesh line feature extraction. To extract line features from the 3D point cloud, an image pixel size of 0.015 m and a slice thickness of 0.1 m were applied. Then, the extracted two types of the line-segment features are combined and regularized together with a parallel line fusion distance of 0.025 m and an angle threshold of 3°. The line features extracted by the mesh and indoor line features are fused separately to reduce broken lines and redundant parallel line segments with a distance threshold of 0.1 m. The extracted regular line-segment feature results are shown in Figure 9a.
To extract line features from photogrammetric mesh on Dataset B, an angle threshold of 22.5° and a relative ground elevation of 2 m were used. An image pixel size of 0.015 m and a slice thickness of 0.1 m were applied for line feature extraction from the 3D point cloud. Then, the extracted two types of line features are combined and regularized together. In the experiment, the parallel line fusion distance is set to 0.025 m, and the parallel line angle threshold is 3°. The line features extracted from the photogrammetric mesh and indoor point cloud are fused, and the distance threshold is 0.1 m. The extracted regular line feature results on Dataset B are shown in Figure 9b.
The voxel-based semantic segmentation of the indoor space was applied for both the photogrammetric mesh and indoor point cloud. On Dataset A, the voxel size is set to 0.25 m for the oblique photogrammetric mesh and 0.05 m for the indoor point cloud. For the input indoor laser scanning point cloud, the voxel setting of semantic markers is usually smaller than the wall thickness. However, too small of a voxel size will reduce the program execution efficiency.
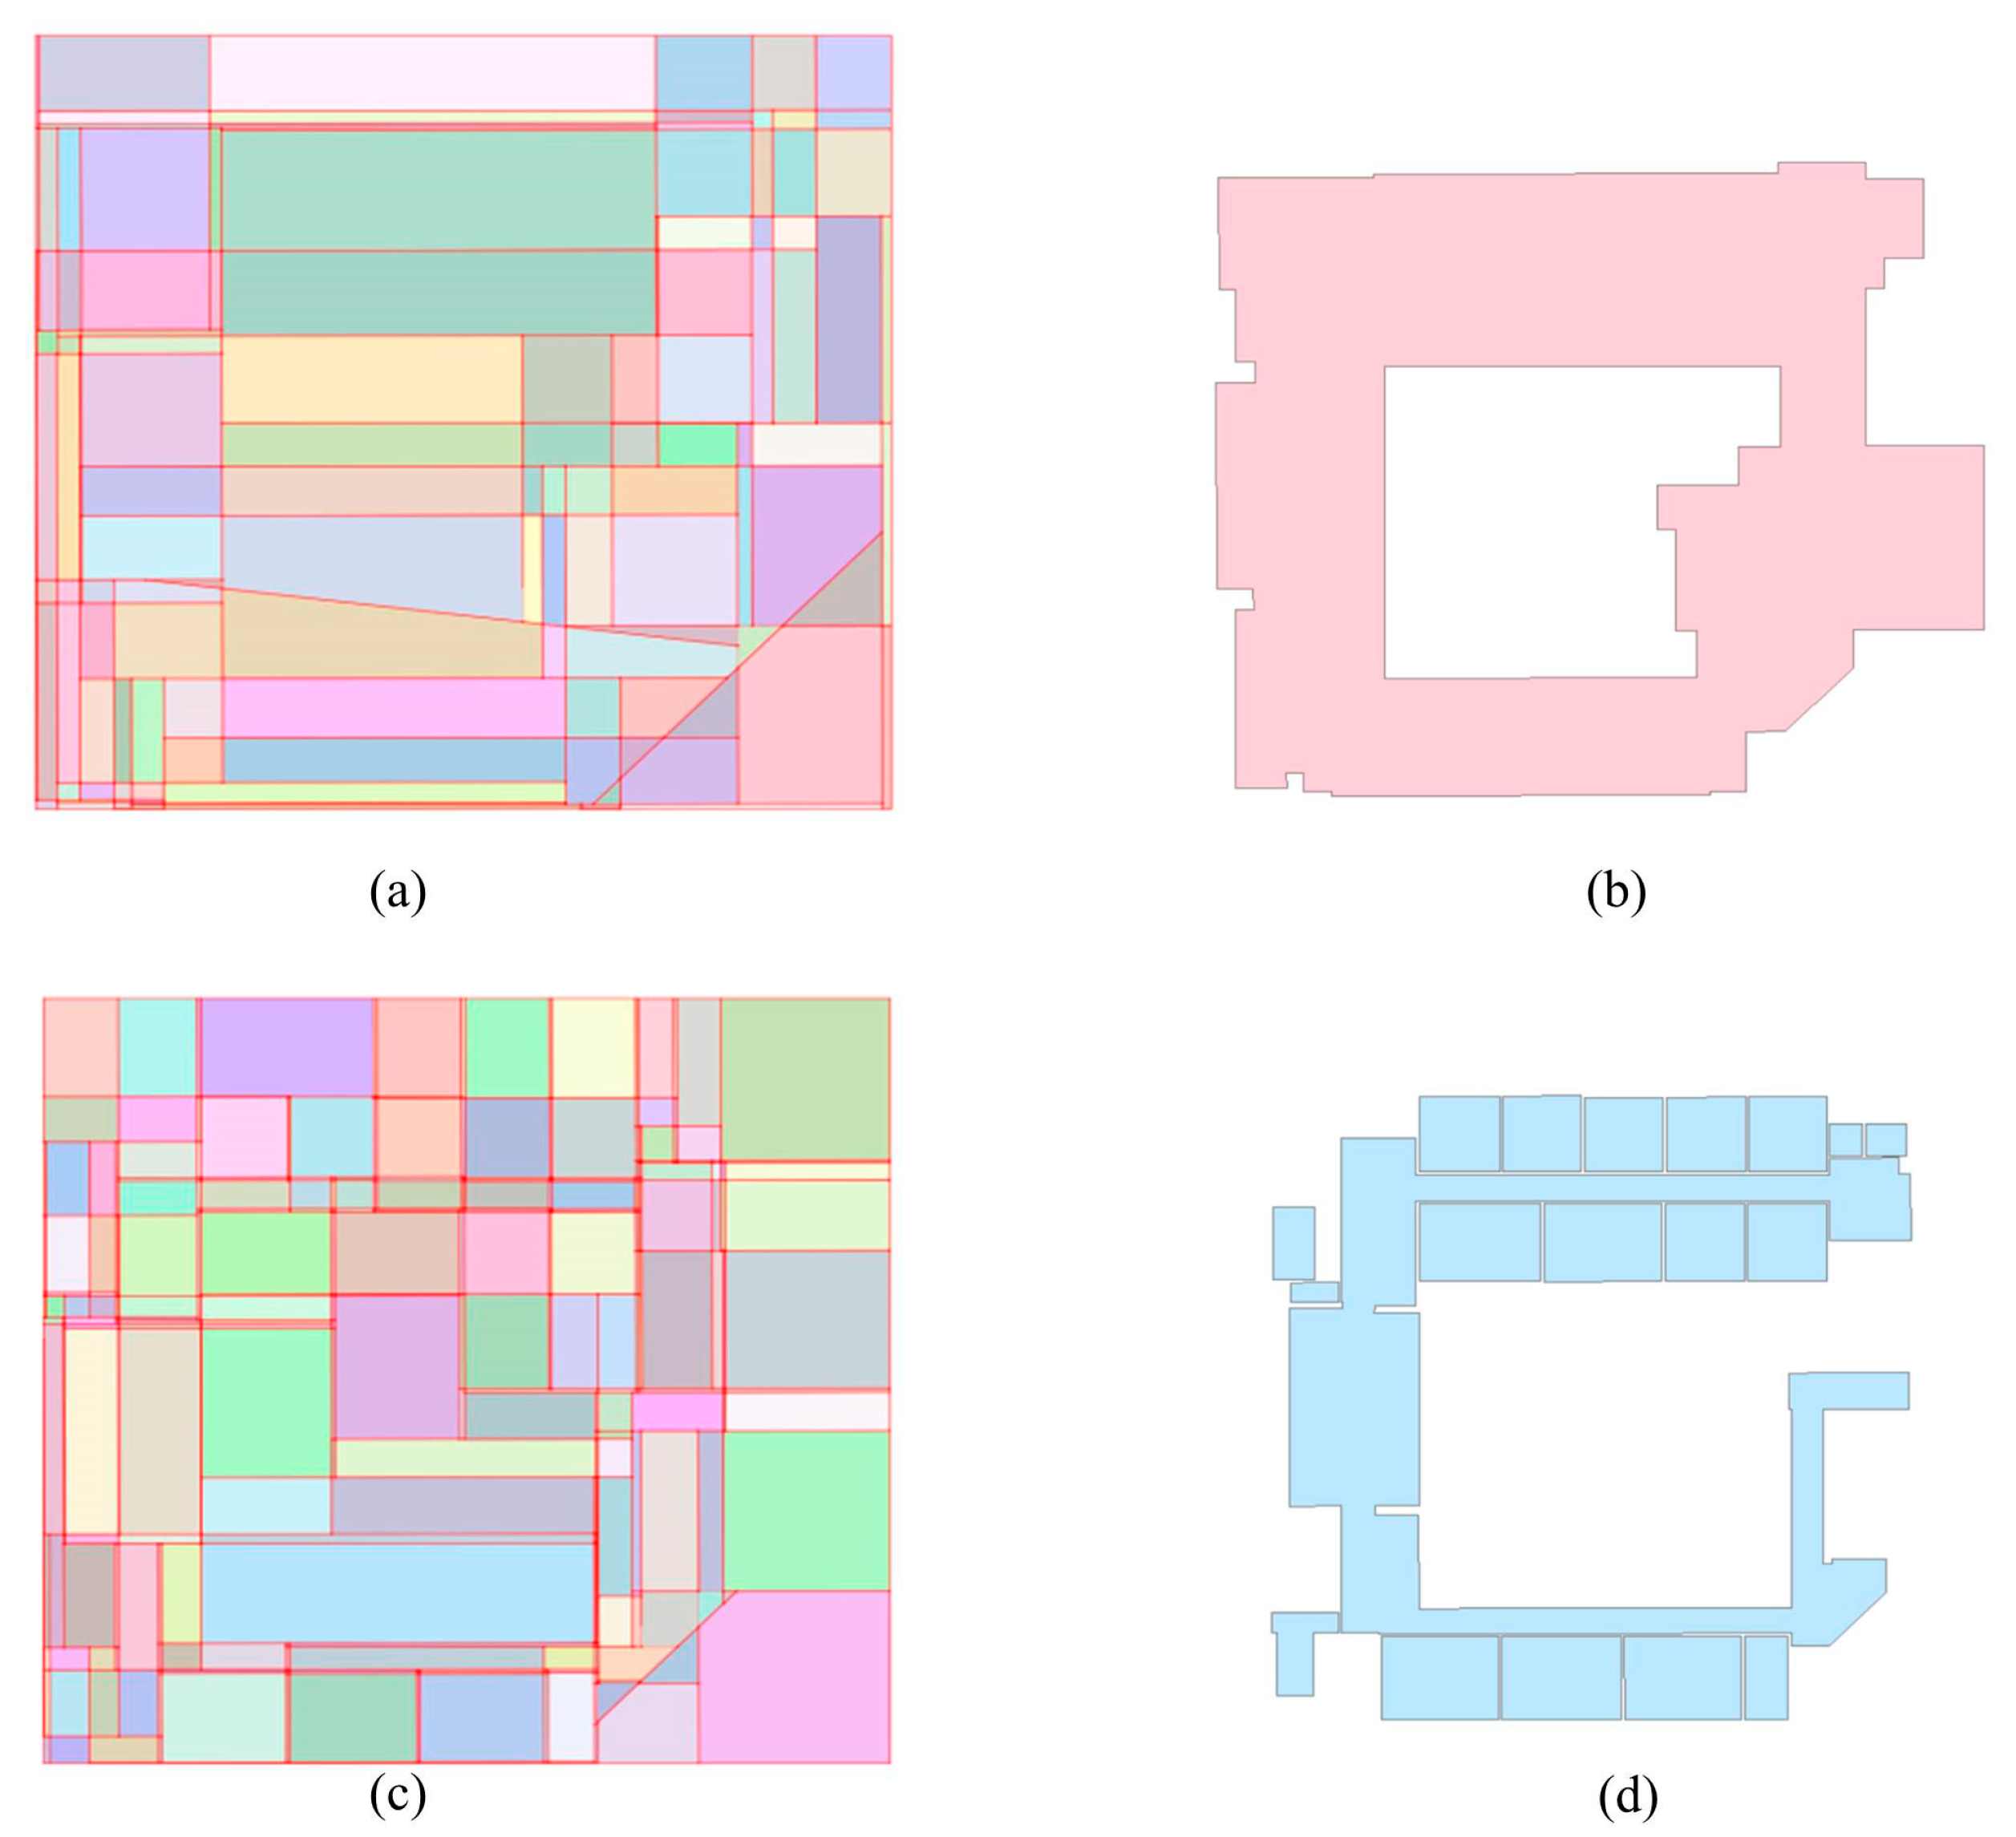
The kinetic space partitioning algorithm is used to carry out spatial partitioning of the regularized building outline features, and the results are shown in Figure 10a. The graph cut optimization algorithm is used to classify the cell complex, and the cells with the same semantic labels are merged to obtain the building footprint polygon. Similarly, the space partition algorithm is used to decompose the indoor space with regularized indoor line segments extracted from indoor point clouds. The resulting cell complex is shown in Figure 10c. The graph cut optimization algorithm is used to obtain the optimum floor plan, as shown in Figure 10d.
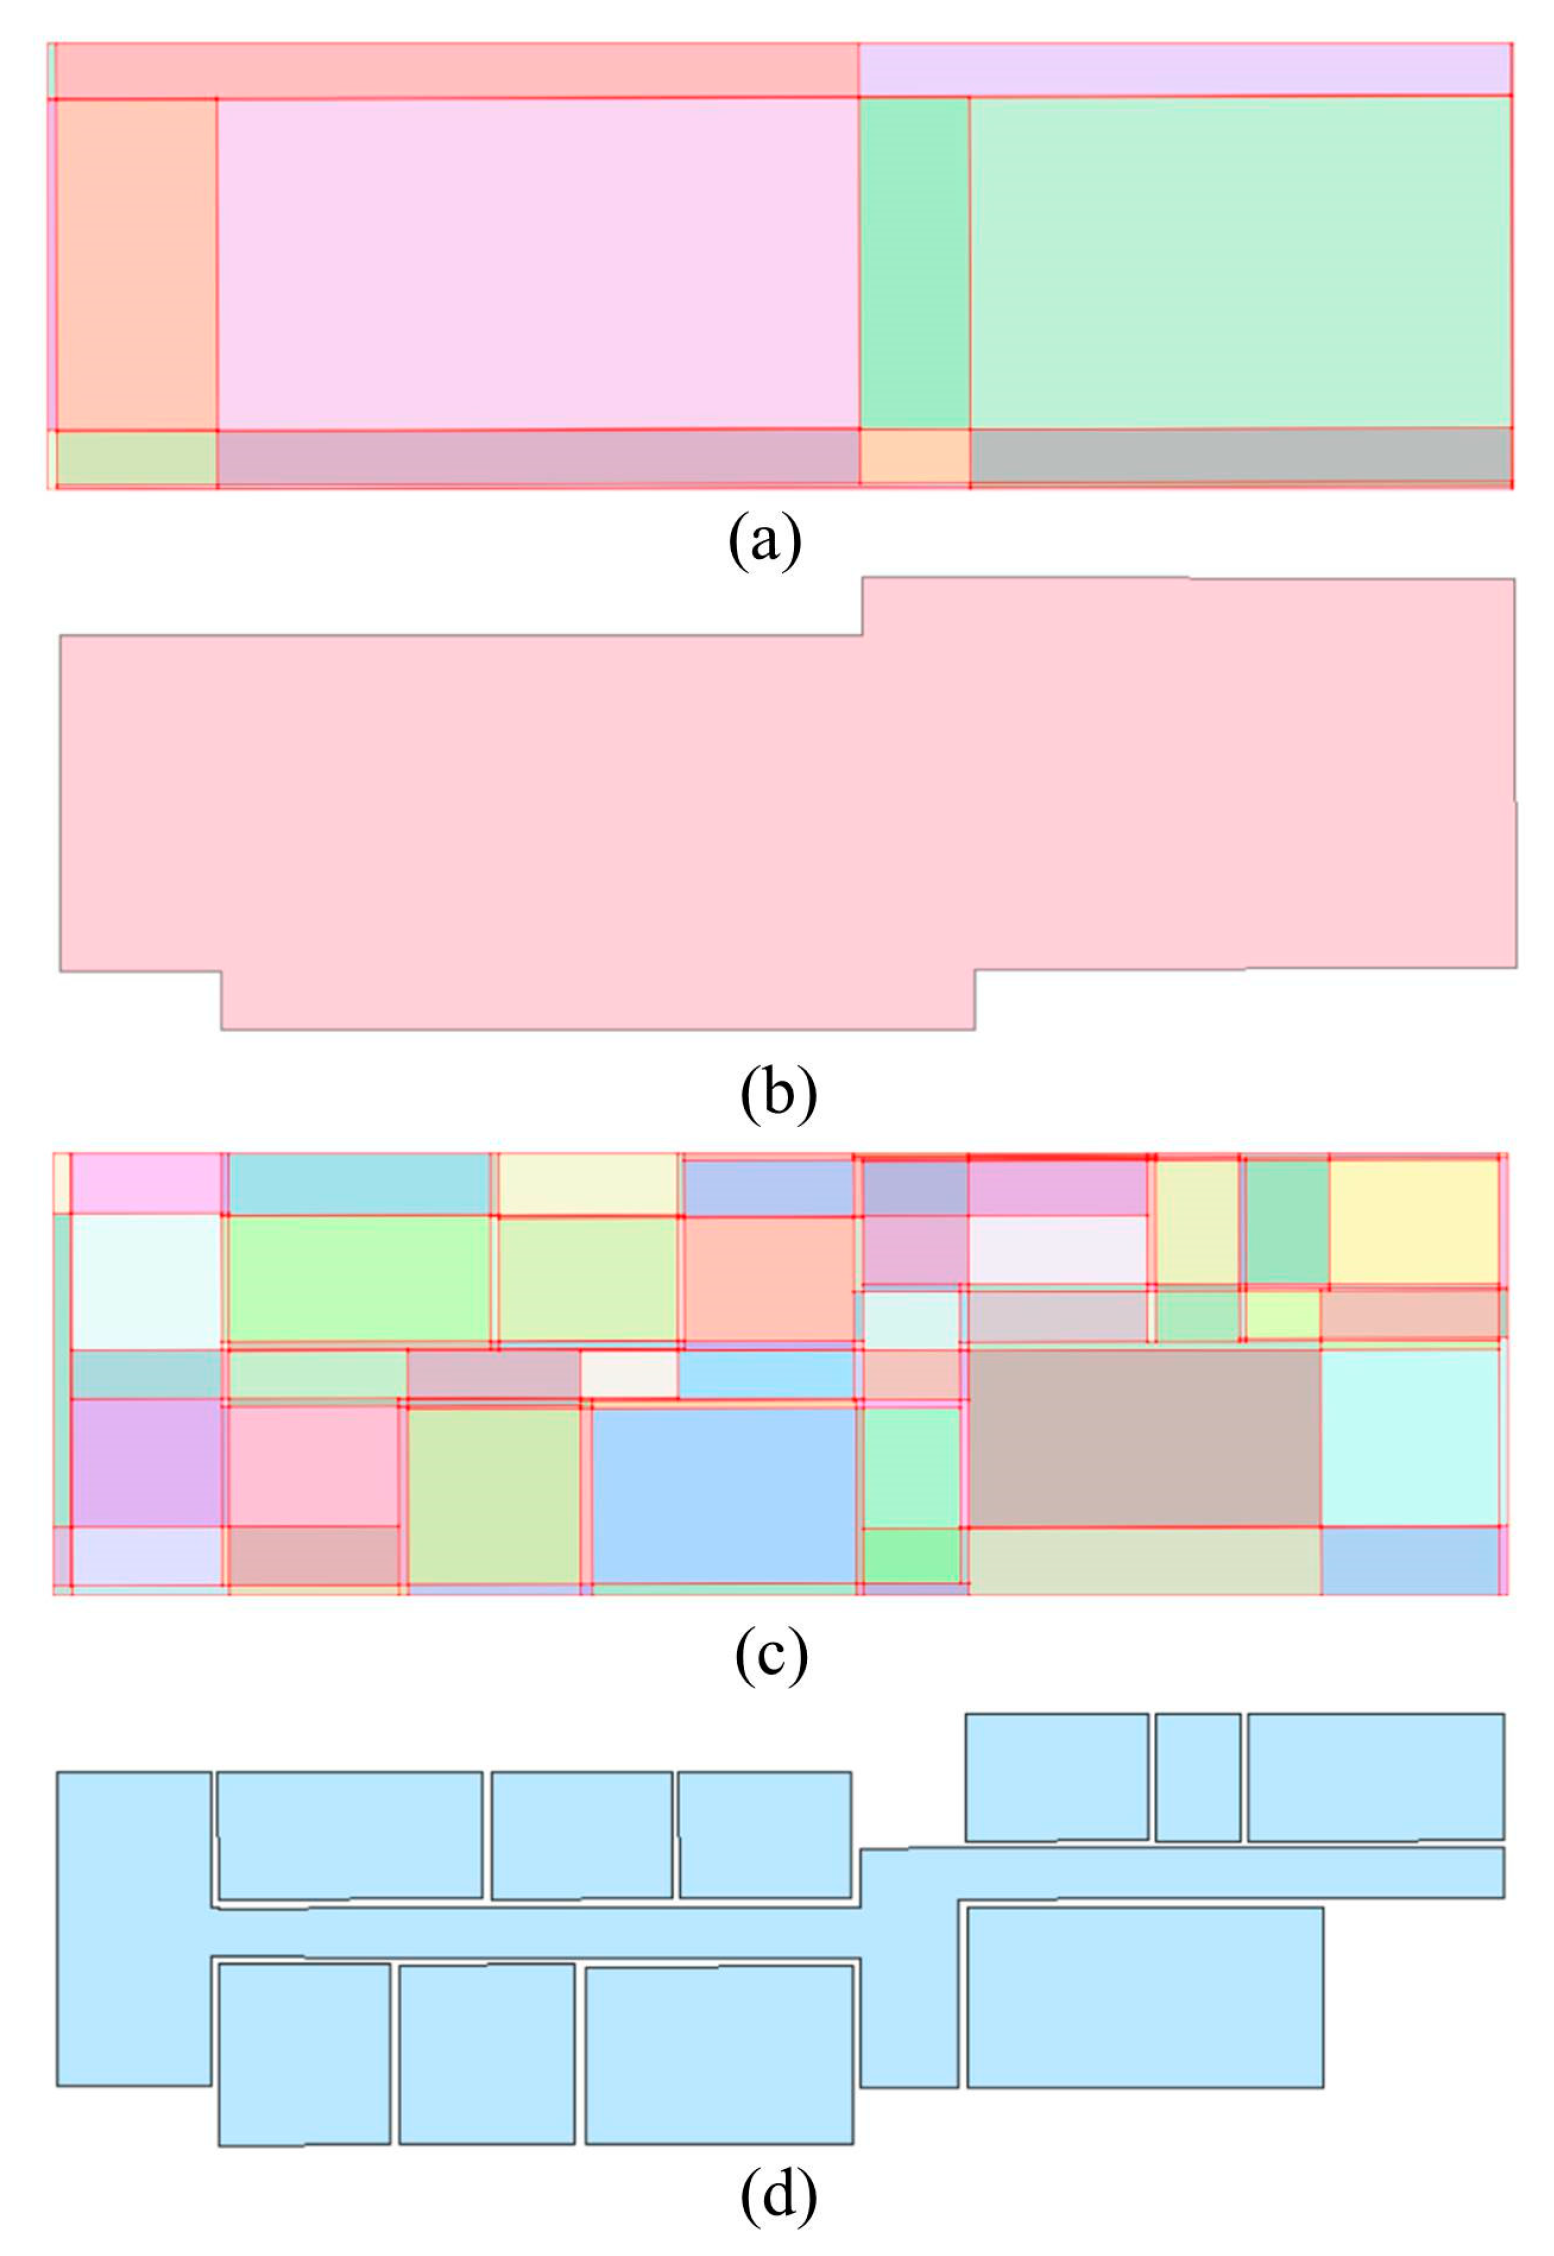
In Dataset B, the voxel size is set to 0.25 m for the oblique photogrammetric mesh and 0.05 m for the indoor point cloud. The resulting cell complex of the space partition result and building footprint are shown in Figure 11a,b. For the indoor laser scanning point cloud, the generated cell complex is shown in Figure 11c. The graph cut optimization algorithm classified the cell complex, and the resulting room floor plan is shown in Figure 11d.
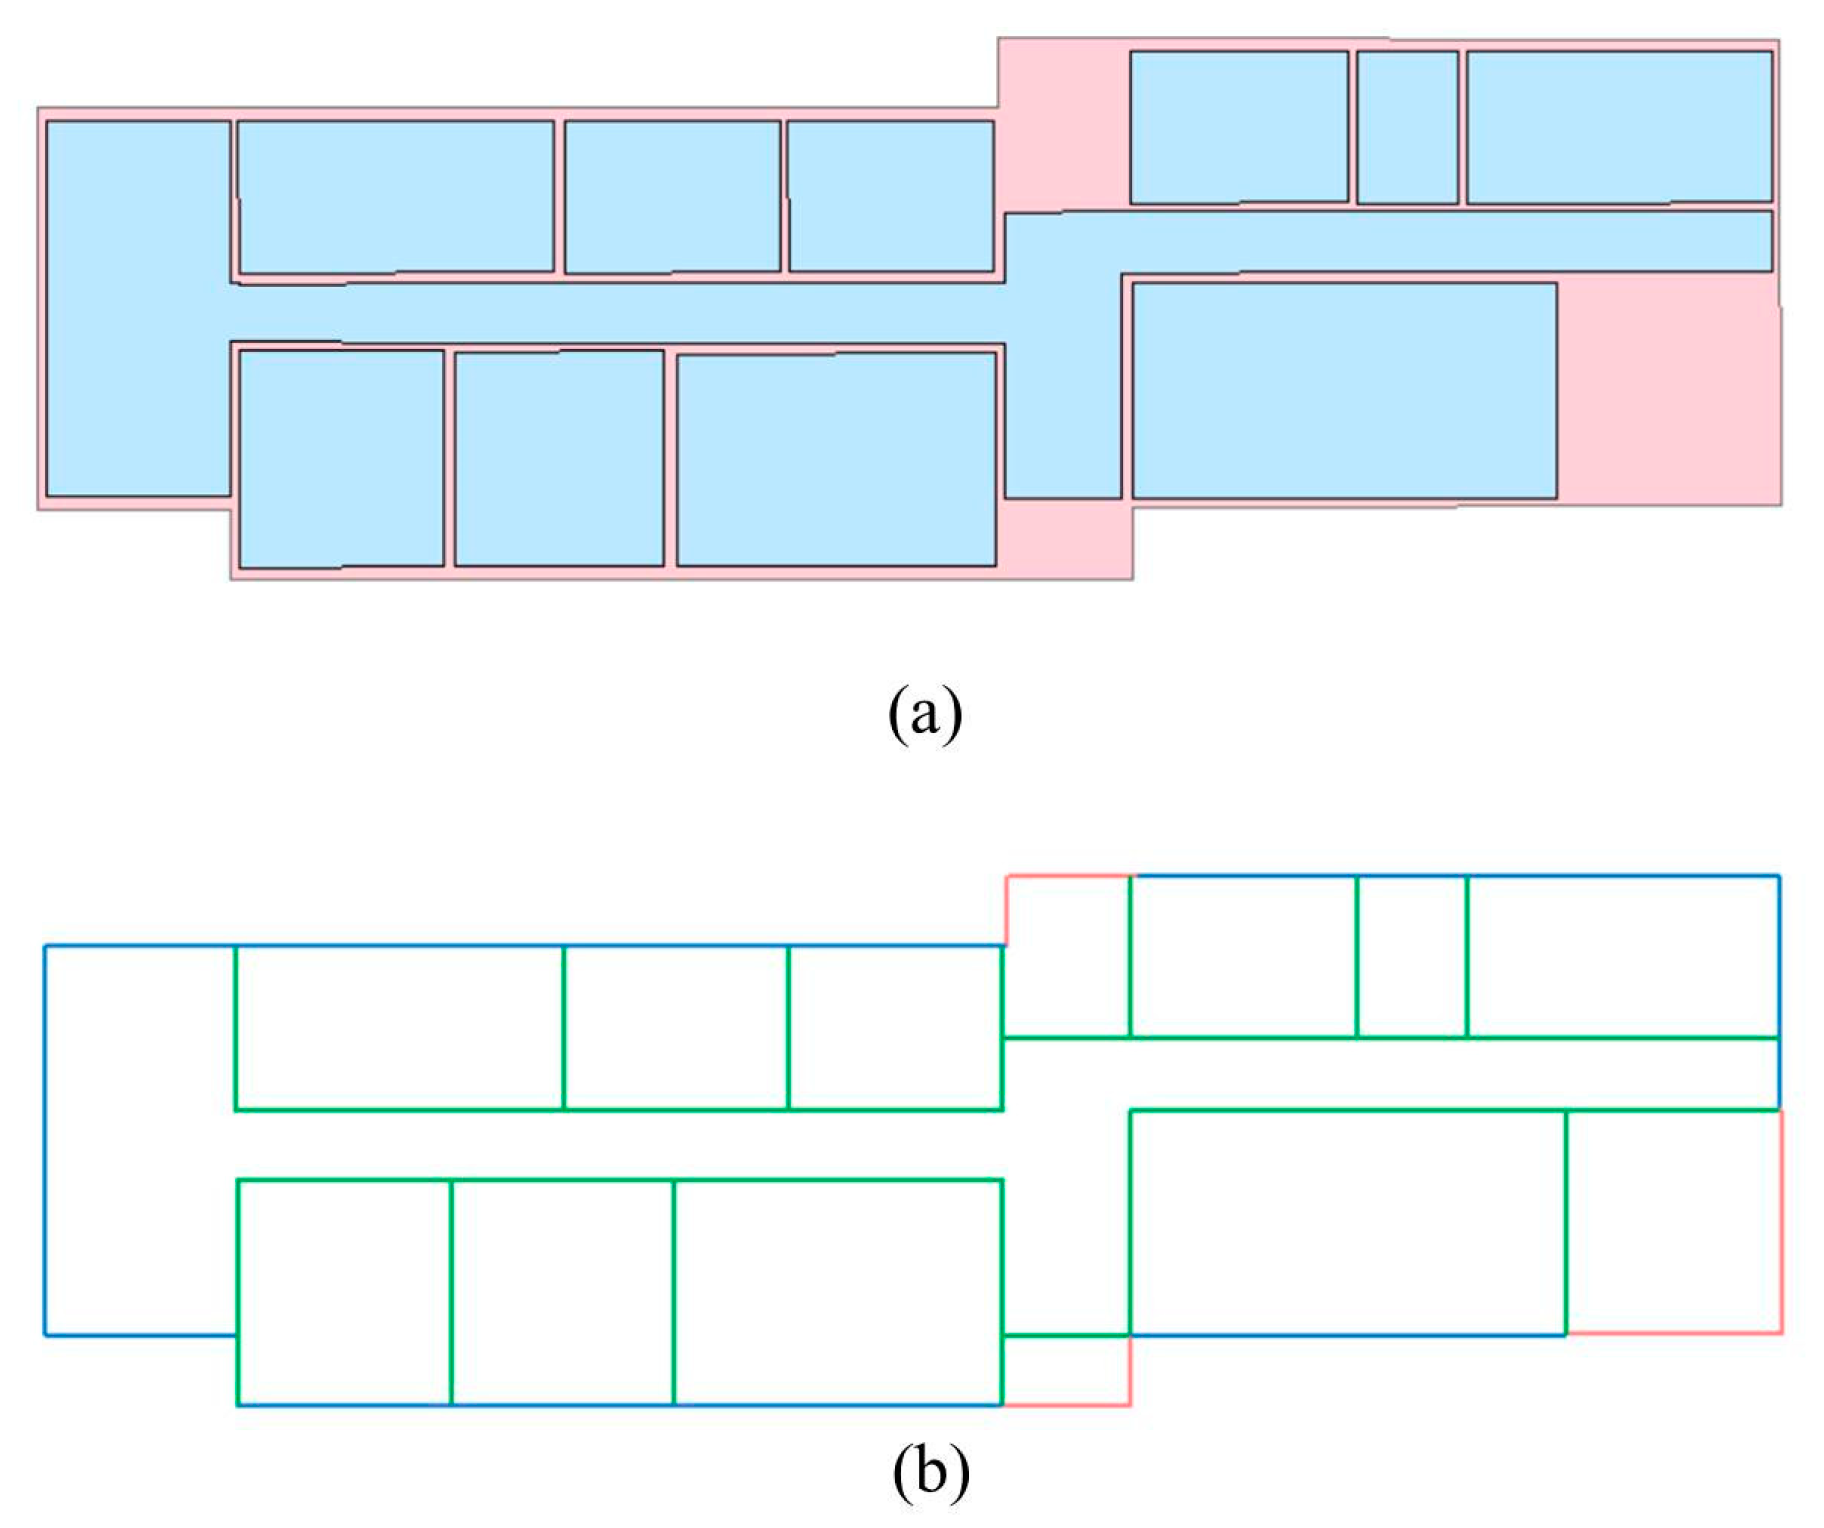
To extract wall centerlines, a search radius of 0.025 m is applied for Dataset A. It searches the line segments of the exterior walls from the indoor floor plan, as shown in the blue contour line in Figure 12b. The parallel lines were classified as exterior walls and interior walls. The extracted wall centerlines are shown in green in Figure 12b. The wall thickness parameters are then extracted from parallel line segments. The most common exterior wall thickness is used for single line segments, shown in pink. The histogram method is used to obtain the average height from the floor to the ceiling. Two peaks in the histogram correspond to the level and height of the wall. The building footprint generated from Dataset B overlapped with the indoor floor plan in Figure 13c, and the exterior wall centerlines extracted from Dataset B are colored blue in Figure 13b.
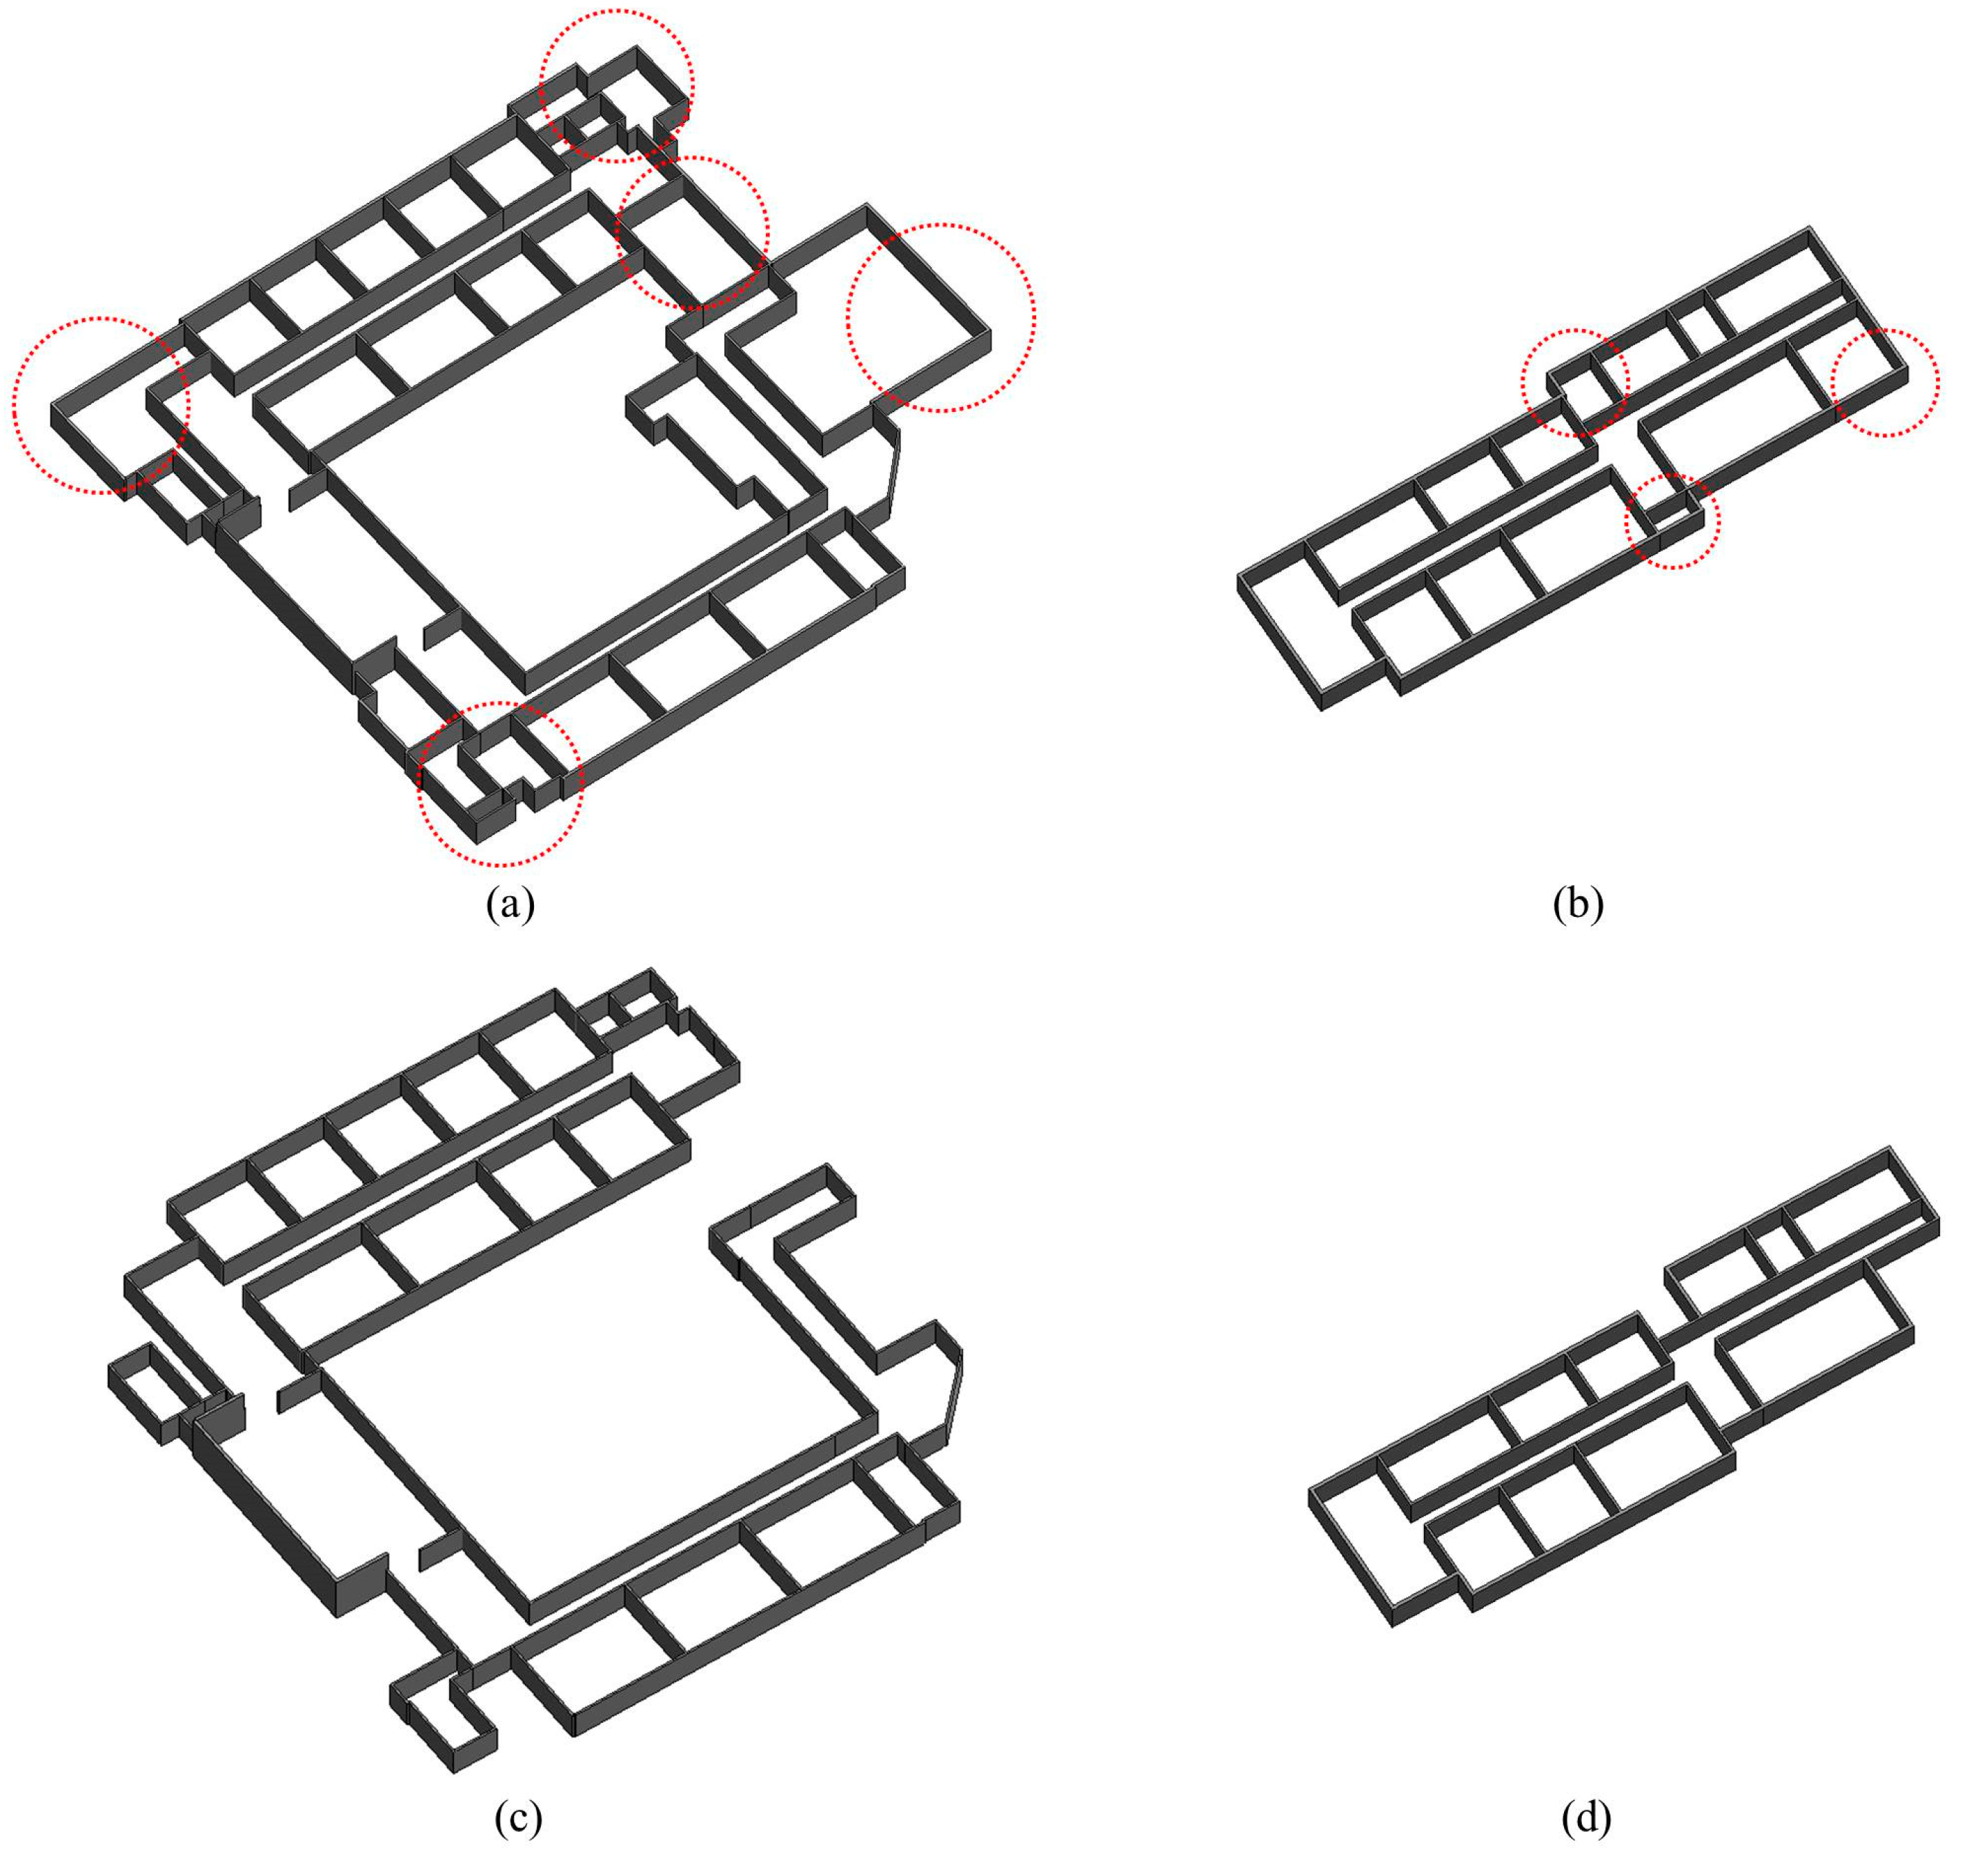
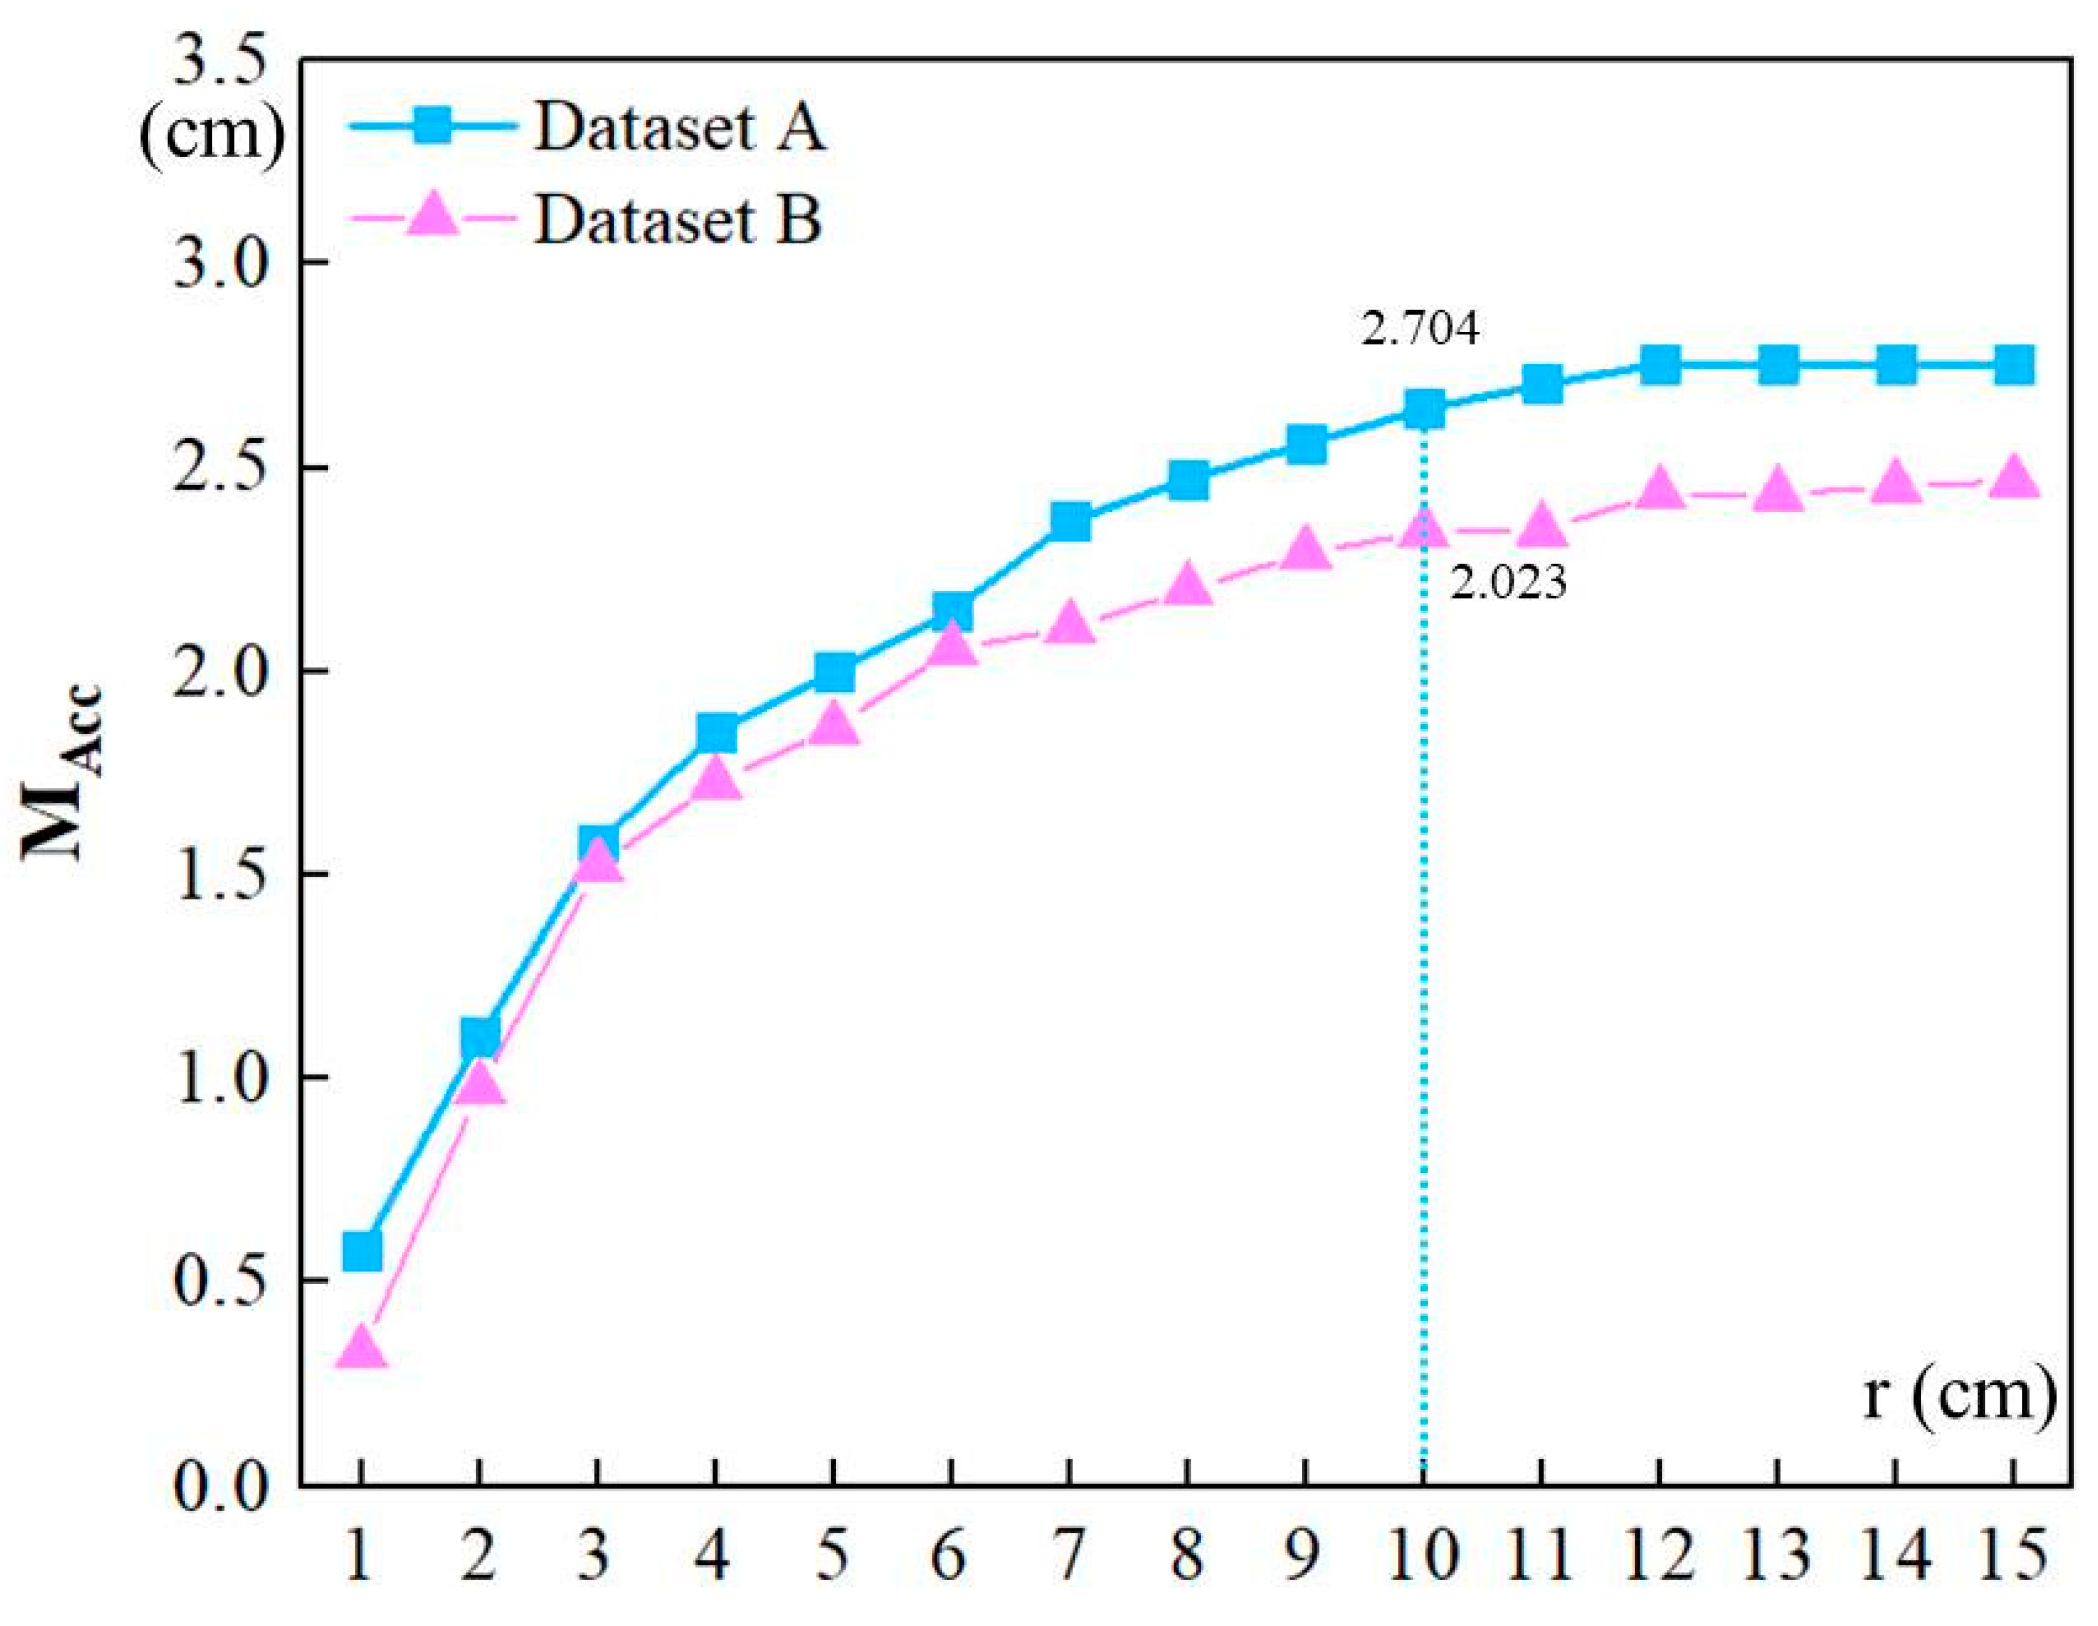
In Dataset A, a total of 51 exterior wall lines and 44 interior wall lines are in the background. The correctness of the exterior wall extraction is 98.0%, and the completeness is 96.2%. As seen in Table 3, the correctness and completeness in the experiment using both photogrammetric mesh and laser point clouds are significantly improved when compared with the experiment using a single laser point cloud data source. The wall surface accuracy (10 cm cutoff threshold) is 2.705 cm. The level set contains three levels, the wall thickness parameters were clustered, and five different wall types were built. The results of the experimental solid wall modeling are shown in Figure 14.
In Dataset B, a total of 10 exterior wall lines and 18 interior wall lines are in the background. Table 3 shows that the correctness of exterior wall extraction is 100%, and the completeness is 100%. The wall surface accuracy (10 cm cutoff threshold) is 2.023 cm (Figure 15). The level set contains only one level, and three wall types were generated. The external program for automatically building the BIM model is developed depending on the Revit API, and the BIM object is generated according to the wall parameters.

5. Discussion

In this study, the construction of BIM solid walls by the combination of UAV oblique photogrammetric models and laser point clouds is discussed. When only indoor laser point clouds are used, the buffer method can be used to determine the exterior wall of the building. However, it classifies many interior walls into exterior walls, resulting in reduced accuracy.
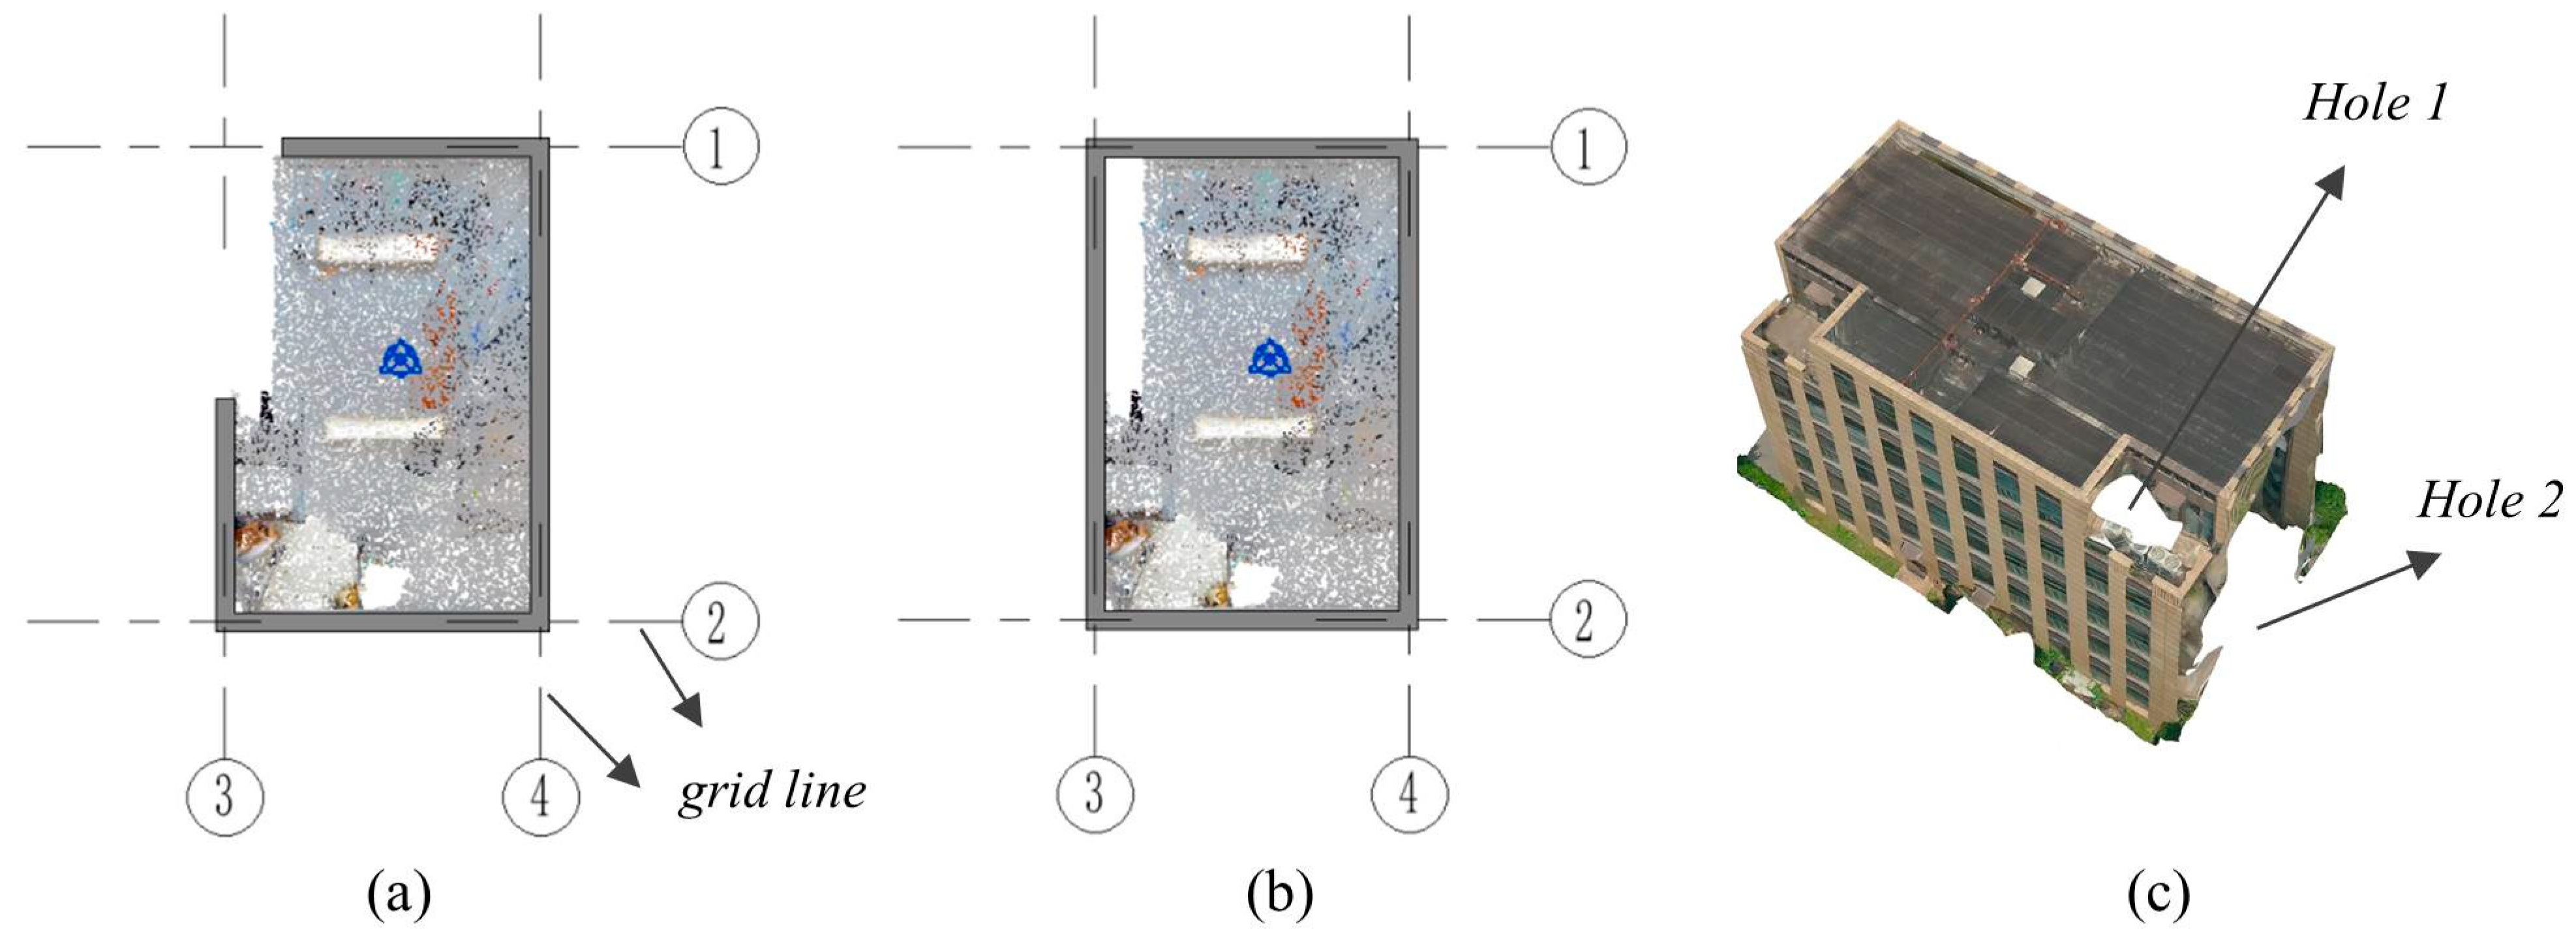
The proposed method has significant advantages in reconstructing buildings from point clouds with heavy occlusions and missing data. To illustrate this, a comparison of the reconstruction result of Bassier’s method [17] (Figure 16a) and the proposed method (Figure 16b) is presented. Bassier’s method is a wall-based method; it cannot ensure watertight modeling of room spaces. Our method has two basic demands for the input data sources. The kinetic space partitioning algorithm typically requires at least one observation from every wall to create proper cells. It can cope with photogrammetric mesh or point cloud data with holes distributed on the wall. However, if the holes are too big to ensure that at least one wall line segment can be extracted, the proposed method may fail. The other demand is that the roof of the photogrammetric mesh and the ceiling of the indoor point cloud must perfectly cover the region to be modeled. If holes exist in the roof or ceiling region (Figure 16c), the initial labeling information for the cell complex will be incorrect.
In the experiment, some rooms did not obtain the required data because they were not licensed. Therefore, this method compromises and uses the extracted wall thickness as the default value for these walls. BIM has strict requirements to achieve a high accuracy of the model, and the UAV photogrammetric mesh may not fulfill the requirement of BIM modeling in some cases. However, the proposed method provides a framework for BIM modeling by fusing different data sources. Moreover, the modeling of doors and windows are not further considered in this study. After building the BIM wall objects, the structural elements and topological relationships of doors and windows can be reconstructed.
6. Conclusions

In this study, a BIM solid wall modeling method based on both photogrammetric meshes and laser point clouds is proposed. This method extracts the centerline of a solid wall based on a kinetic space partitioning algorithm and morphological operation and constructs the geometric and topological associations of wall objects through wall fusion and topological reconstruction. A solid wall object is constructed by using the wall centerline, level, height and wall thickness. Experimental results exhibit more than 90% completeness and correctness for solid walls. The proposed method also achieves centimeter-level accuracy for the wall surface. The method can quickly construct the geometric and topological relationships of BIM solid walls and meet the needs of building mapping and building 3D reconstruction.
However, the proposed fusion method for photogrammetric meshes and laser point clouds is still a loosely coupled method. It would be ideal to have a faster and more compact technique. Further work will also address the modeling of the geometric and topological relationships of doors and windows.

Author Contributions

Conceptualization, J.Z.; Data curation, Y.P., F.Z. and Y.L.; Formal analysis, F.Z.; Funding acquisition, F.Y. and J.Z.; Investigation, Y.P., F.F. and Z.L.; Methodology, F.Y.; Project administration, J.Z.; Resources, F.Z. and Z.L.; Software, F.Y.; Supervision, L.L.; Visualization, F.F.; Writing—original draft, F.Y.; Writing—review & editing, Y.L. and L.L. All authors have read and agreed to the published version of the manuscript.

Funding

This work was supported by the Open Fund of Key Laboratory of Urban Land Resources Monitoring and Simulation, Ministry of Natural Resources (no. KF-2021-06-022), the National Natural Science Foundation of China (no. 42001322, 42001325), the Introduction Program of High-Level Innovation and Entrepreneurship Talents in Jiangsu Province (no. JSSCBS20211131), the Natural Science Foundation of Anhui Province (no. 2008085QD168), and the Key Lab of Virtual Geographic Environment Open Fund Project of the Ministry of Education (no. 2020VGE05).

Data Availability Statement

Not applicable.

Conflicts of Interest

The authors declare no conflict of interest.

References

  1. Bai, C.; Dallasega, P.; Orzes, G.; Sarkis, J. Industry 4.0 technologies assessment: A sustainability perspective. Int. J. Prod. Econ. 2020, 229, 107776. [Google Scholar] [CrossRef]
  2. Rocha, G.; Mateus, L. A Survey of Scan-to-BIM Practices in the AEC Industry—A Quantitative Analysis. ISPRS Int. J. Geo-Inf. 2021, 10, 564. [Google Scholar] [CrossRef]
  3. Tang, P.; Huber, D.; Akinci, B.; Lipman, R.; Lytle, A. Automatic reconstruction of as-built building information models from laser-scanned point clouds: A review of related techniques. Autom. Constr. 2010, 19, 829–843. [Google Scholar] [CrossRef]
  4. Wang, Q.; Guo, J.; Kim, M.-K. An Application Oriented Scan-to-BIM Framework. Remote Sens. 2019, 11, 365. [Google Scholar] [CrossRef]
  5. Meyer, T.; Brunn, A.; Stilla, U. Change detection for indoor construction progress monitoring based on BIM, point clouds and uncertainties. Autom. Constr. 2022, 141, 104442. [Google Scholar] [CrossRef]
  6. Rodriguez-Gonzalvez, P.; Gonzalez-Aguilera, D.; Lopez-Jimenez, G.; Picon-Cabrera, I. Image-based modeling of built environment from an unmanned aerial system. Autom. Constr. 2014, 48, 44–52. [Google Scholar] [CrossRef]
  7. Kang, Z.; Yang, J.; Yang, Z.; Cheng, S. A Review of Techniques for 3D Reconstruction of Indoor Environments. ISPRS Int. J. Geo-Inf. 2020, 9, 330. [Google Scholar] [CrossRef]
  8. Xue, F.; Wu, L.; Lu, W. Semantic enrichment of building and city information models: A ten-year review. Adv. Eng. Inform. 2021, 47, 101245. [Google Scholar] [CrossRef]
  9. Gourguechon, C.; Macher, H.; Landes, T. Automation of as-built bim creation from point cloud: An overview of research works focused on indoor environment. In Proceedings of the International Archives of the Photogrammetry, Remote Sensing and Spatial Information Sciences, XLIII-B2-2022, Nice, France, 6–11 June 2022; pp. 193–200. [Google Scholar] [CrossRef]
  10. Wang, C.; Cho, Y.K.; Kim, C. Automatic BIM component extraction from point clouds of existing buildings for sustainability applications. Autom. Constr. 2015, 56, 1–13. [Google Scholar] [CrossRef]
  11. Yang, F.; Li, Y.; Che, M.; Wang, S.; Wang, Y.; Zhang, J.; Cao, X.; Zhang, C. The Polygonal 3D Layout Reconstruction of an Indoor Environment via Voxel-Based Room Segmentation and Space Partition. ISPRS Int. J. Geo-Inf. 2022, 11, 530. [Google Scholar] [CrossRef]
  12. Thomson, C.; Boehm, J. Automatic Geometry Generation from Point Clouds for BIM. Remote Sens. 2015, 7, 11753–11775. [Google Scholar] [CrossRef]
  13. Liu, X.; Zhang, Y.; Ling, X.; Wan, Y.; Liu, L.; Li, Q. TopoLAP: Topology Recovery for Building Reconstruction by Deducing the Relationships between Linear and Planar Primitives. Remote Sens. 2019, 11, 1372. [Google Scholar] [CrossRef]
  14. Freimuth, H.; Konig, M. A Framework for Automated Acquisition and Processing of As-Built Data with Autonomous Unmanned Aerial Vehicles. Sensors 2019, 19, 4513. [Google Scholar] [CrossRef]
  15. Gao, T.; Akinci, B.; Ergan, S.; Garrett, J. An approach to combine progressively captured point clouds for BIM update. Adv. Eng. Inform. 2015, 29, 1001–1012. [Google Scholar] [CrossRef]
  16. Becker, S.; Peter, M.; Fritsch, D. Grammar-Supported 3d Indoor Reconstruction from Point Clouds for “as-Built” BIM. ISPRS Ann. Photogramm. Remote Sens. Spat. Inf. Sci. 2015, II-3/W4, 17–24. [Google Scholar] [CrossRef]
  17. Bassier, M.; Vergauwen, M. Unsupervised reconstruction of Building Information Modeling wall objects from point cloud data. Autom. Constr. 2020, 120, 103338. [Google Scholar] [CrossRef]
  18. Jung, J.; Stachniss, C.; Ju, S.; Heo, J. Automated 3D volumetric reconstruction of multiple-room building interiors for as-built BIM. Adv. Eng. Inform. 2018, 38, 811–825. [Google Scholar] [CrossRef]
  19. Alshawabkeh, Y.; Baik, A.; Miky, Y. Integration of Laser Scanner and Photogrammetry for Heritage BIM Enhancement. ISPRS Int. J. Geo-Inf. 2021, 10, 316. [Google Scholar] [CrossRef]
  20. Sanchez, V.; Zakhor, A. Planar 3D modeling of building interiors from point cloud data. In Proceedings of the 2012 19th IEEE International Conference on Image Processing, Orlando, FL, USA, 30 September–3 October 2012; pp. 1777–1780. [Google Scholar]
  21. Romero-Jarén, R.; Arranz, J.J. Automatic segmentation and classification of BIM elements from point clouds. Autom. Constr. 2021, 124, 103576. [Google Scholar] [CrossRef]
  22. Coudron, I.; Puttemans, S.; Goedemé, T.; Vandewalle, P. Semantic Extraction of Permanent Structures for the Reconstruction of Building Interiors from Point Clouds. Sensors 2020, 20, 6916. [Google Scholar] [CrossRef]
  23. Mura, C.; Mattausch, O.; Jaspe Villanueva, A.; Gobbetti, E.; Pajarola, R. Automatic room detection and reconstruction in cluttered indoor environments with complex room layouts. Comput. Graph. 2014, 44, 20–32. [Google Scholar] [CrossRef]
  24. Cui, Y.; Li, Q.; Yang, B.; Xiao, W.; Chen, C.; Dong, Z. Automatic 3-D Reconstruction of Indoor Environment with Mobile Laser Scanning Point Clouds. IEEE J. Sel. Top. Appl. Earth Obs. Remote Sens. 2019, 12, 3117–3130. [Google Scholar] [CrossRef]
  25. Ochmann, S.; Vock, R.; Wessel, R.; Klein, R. Automatic reconstruction of parametric building models from indoor point clouds. Comput. Graph. 2016, 54, 94–103. [Google Scholar] [CrossRef]
  26. Gang, Z.; Lin, L. 3D Point Clould Reconstruction of Walls Based on Constrained Least-Squares. Geomat. World 2021, 28, 26–33. [Google Scholar] [CrossRef]
  27. Fotsing, C.; Hahn, P.; Cunningham, D.; Bobda, C. Volumetric wall detection in unorganized indoor point clouds using continuous segments in 2D grids. Autom. Constr. 2022, 141, 104462. [Google Scholar] [CrossRef]
  28. Tran, H.; Khoshelham, K.; Kealy, A.; Díaz-Vilariño, L. Shape grammar approach to 3D modeling of indoor environments using point clouds. J. Comput. Civ. Eng. 2019, 33, 04018055. [Google Scholar] [CrossRef]
  29. Tran, H.; Khoshelham, K.; Kealy, A.; Díaz-Vilariño, L. Extracting Topological Relations between Indoor Spaces from Point Clouds. ISPRS Ann. Photogramm. Remote Sens. Spat. Inf. Sci. 2017, IV-2/W4, 401–406. [Google Scholar] [CrossRef]
  30. Bassier, M.; Vergauwen, M. Topology Reconstruction of BIM Wall Objects from Point Cloud Data. Remote Sens. 2020, 12, 1800. [Google Scholar] [CrossRef]
  31. Wang, R.; Xie, L.; Chen, D. Modeling Indoor Spaces using Decomposition and Reconstruction of Structural Elements. Photogramm. Eng. Remote Sens. 2017, 83, 827–841. [Google Scholar] [CrossRef]
  32. Yang, F.; Li, L.; Su, F.; Li, D.; Zhu, H.; Ying, S.; Zuo, X.; Tang, L. Semantic decomposition and recognition of indoor spaces with structural constraints for 3D indoor modelling. Autom. Constr. 2019, 106, 102913. [Google Scholar] [CrossRef]
  33. Armeni, I.; Sener, O.; Zamir, A.R.; Jiang, H.; Brilakis, I.; Fischer, M.; Savarese, S. 3D Semantic Parsing of Large-Scale Indoor Spaces. In Proceedings of the 2016 IEEE Conference on Computer Vision and Pattern Recognition (CVPR), Las Vegas, NV, USA, 27–30 June 2016; pp. 1534–1543. [Google Scholar]
  34. Tang, S.; Li, X.; Zheng, X.; Wu, B.; Wang, W.; Zhang, Y. BIM generation from 3D point clouds by combining 3D deep learning and improved morphological approach. Autom. Constr. 2022, 141, 104422. [Google Scholar] [CrossRef]
  35. Snyder, J.P. Map Projections: A Working Manual; USGS Publications: Washington, DC, USA, 1987. [Google Scholar]
  36. Wang, F.; Zhou, G.; Hu, H.; Wang, Y.; Fu, B.; Li, S.; Xie, J. Reconstruction of LoD-2 Building Models Guided by Façade Structures from Oblique Photogrammetric Point Cloud. Remote Sens. 2023, 15, 400. [Google Scholar] [CrossRef]
  37. Zhang, Y.; Zhang, C.; Chen, S.; Chen, X. Automatic Reconstruction of Building Façade Model from Photogrammetric Mesh Model. Remote Sens. 2021, 13, 3801. [Google Scholar] [CrossRef]
  38. Bauchet, J.-P.; Lafarge, F. KIPPI: KInetic Polygonal Partitioning of Images. In Proceedings of the IEEE Conference on Computer Vision and Pattern Recognition (CVPR), Salt Lake City, UT, USA, 18–23 June 2018. [Google Scholar]
  39. Fang, H.; Lafarge, F.; Pan, C.; Huang, H. Floorplan generation from 3D point clouds: A space partitioning approach. 2021. Isprs J. Photogramm. Remote Sens. 2021, 175, 44–55. [Google Scholar]
  40. Bauchet, J.-P.; Lafarge, F. Kinetic Shape Reconstruction. ACM Trans. Graph. 2020, 39, 44–55. [Google Scholar] [CrossRef]
  41. Oesau, S.; Lafarge, F.; Alliez, P. Planar Shape Detection and Regularization in Tandem. Comput. Graph. Forum 2016, 35, 203–215. [Google Scholar] [CrossRef]
  42. Kang, H.-K.; Li, K.-J. A Standard Indoor Spatial Data Model—OGC IndoorGML and Implementation Approaches. ISPRS Int. J. Geo-Inf. 2017, 6, 116. [Google Scholar] [CrossRef]
  43. Khoshelham, K.; Tran, H.; Acharya, D.; Vilariño, L.D.; Kang, Z.; Dalyot, S. Results of the ISPRS benchmark on indoor modelling. ISPRS Open J. Photogramm. Remote Sens. 2021, 2, 100008. [Google Scholar] [CrossRef]
  44. Tran, H.; Khoshelham, K.; Kealy, A. Geometric comparison and quality evaluation of 3D models of indoor environments. ISPRS J. Photogramm. Remote Sens. 2019, 149, 29–39. [Google Scholar] [CrossRef]
  45. CGAL. Computational Geometry Algorithms Library. 2023. Available online: http://www.cgal.org (accessed on 10 April 2023).
  46. Cloud Compare. 3D Point Cloud and Mesh Processing Software Open Source Project. 2023. Available online: http://www.cloudcompare.org/ (accessed on 10 April 2023).
Figure 1. Flowchart of the proposed method.
Remotesensing 15 02856 g001
Figure 2. Line segment reorientation (a) and realignment (b) and line segment fusion (c).
Remotesensing 15 02856 g002
Figure 3. Semantic labeling of inside space or indoor free space. (a) A building example. The building contains two rooms and some furniture. The wall is bounded with wall surfaces. (b) The outer surface of building separated the space into inside space and outside space. A frontier, which is determined by the maximum value of the mesh elevation range, helps the labeling of outside space. (c) The interior space of indoor environment is classified as free space, occupied and unknown space. A frontier helps the labeling of unknown space.
Remotesensing 15 02856 g003
Figure 4. (a) Outdoor oblique photography mesh inside space voxelization, (b) kinetic space partition overlay inside space semantics, (c) indoor free space voxelization, and (d) kinetic space partition overlay indoor free space semantics.
Remotesensing 15 02856 g004
Figure 5. Wall centerline extraction. (a) Building footprint overlap with the indoor floor plan, and (b) wall centerline extraction and classification of the exterior and interior walls colored in blue and green, respectively. The most common exterior wall thickness is used for wall centerline, colored in coral color.
Remotesensing 15 02856 g005
Figure 6. The topological reconstruction and the walls with “T”, pseudo “T”, and a cross shape in space are illustrated to be merged according to the primary and secondary principles.
Remotesensing 15 02856 g006
Figure 7. Reconstructed BIM wall objects.
Remotesensing 15 02856 g007
Figure 8. UAV photogrammetric meshes and laser scanning point clouds. (a) The UAV photogrammetric mesh of Dataset A, (b) the laser scanning point clouds of Dataset A, (c) the UAV photogrammetric mesh of Dataset B, and (d) the laser scanning point clouds of Dataset B.
Remotesensing 15 02856 g008
Figure 9. (a) Extracted line features for Dataset A; (b) extracted line features for Dataset B.
Remotesensing 15 02856 g009
Figure 10. (a) Generated cell complex using the line segments of the building outlines in Dataset A, (b) building footprint, (c) generated cell complex using the line segments detected from the indoor point cloud in Dataset A, and (d) generated indoor floor plan.
Remotesensing 15 02856 g010
Figure 11. (a) Generated cell complex using the line segments of the building outline in Dataset B, (b) building footprint polygon, (c) generated cell complex using the line segments detected from the indoor point cloud in Dataset B, and (d) generated indoor floor plan.
Remotesensing 15 02856 g011
Figure 12. (a) Building footprint overlap with the indoor floor plan of Dataset A, and (b) the detected line segments are classified as exterior (blue and pink) and interior (green) wall line segments; the pink line segments are exterior walls for which the most commonly wall thickness is used.
Remotesensing 15 02856 g012
Figure 13. (a) Building footprint overlap with the indoor floor plan of Dataset B and (b) detected line segments, classified as exterior and interior wall line segments.
Remotesensing 15 02856 g013
Figure 14. (a) Reconstructed BIM solid walls from both photogrammetric mesh and laser point clouds in Dataset A, (b) reconstructed BIM solid walls from both photogrammetric mesh and laser point clouds in Dataset B, (c) reconstructed BIM solid walls using indoor laser point clouds in Dataset A, and (d) reconstructed BIM solid walls from laser point clouds in Dataset B.
Remotesensing 15 02856 g014
Figure 15. Evaluation of the wall surfaces for Dataset A and Dataset B.
Remotesensing 15 02856 g015
Figure 16. (a) The wall reconstruction results of Bassier’s method [17]; (b) the wall reconstruction results of the proposed method; (c) unexpected holes in the photogrammetric mesh.
Remotesensing 15 02856 g016
Table 1. Detailed descriptions of the experimental datasets.
Test SiteTypeSize (m)PointsTrianglesAltitude
Dataset AMesh84.3 × 75.2 × 28.32.63 × 1057.03 × 10513.5 m
Point Cloud76.4 × 68.0 × 8.69.09 × 107-
Dataset BMesh62.8 × 18.5 × 22.31.17 × 1054.63 × 10513.4 m
Point Cloud56.8 × 17.6 × 4.52.81 × 107-
Table 2. Input parameters for the experiment.
ParametersDescriptionDataset ADataset B
Line Feature Extraction
θ s Angle threshold. (Mesh/Point Cloud)22.5°22.5°
h s Elevation relative to ground. (Mesh)2 m2 m
  s f Pixel size of image. (Point Cloud)0.015 m0.015 m
t Thickness of slice. (Point Cloud)0.1 m0.1 m
τ Number of points in voxel. (Point Cloud)55
Regularization and Fusion
θ m a x Parallel line angle threshold. (default 5°).
d m a x Parallel line fusion distance.0.025 m0.025 m
Δ L Broken lines distance threshold.0.1 m0.1 m
Kinetic Partition and Optimization
s voxel Voxel size of a grid map. (Mesh)0.25 m0.25 m
s voxel Voxel size of a grid map. (Point Cloud)0.05 m0.05 m
δ o v e r l a p The overlap ratio between two spheres.0.80.8
rTruncation threshold0.1 m0.1 m
Wall Centerline Extraction
ε Parallel line distance0.25 m0.25 m
t 1 User input wall thickness0.3 m0.3 m
Wall Refinement and Topology Reconstruction
σ 1 Search radius for neighbors0.25 m0.25 m
Table 3. Results of solid wall modeling.
ObjectsIndexesDataset ADataset A (Indoor Point Cloud Only)Dataset BDataset B (Indoor Point Cloud Only)
Exterior wall/interior wallBackground51/4451/4410/1810/18
Exterior wallTP/FP/FN 50/1/218/25/3310/0/08/6/2
Correctness98.0%41.9%100%57.1%
Completeness96.2%35.3%100%80.0%
Quality94.3%23.7%100%50.0%
Interior wallTP/FP/FN 43/3/126/3/1818/0/015/0/3
Correctness93.5%89.7%100%100.0%
Completeness97.7%59.1%100%83.3%
Quality91.5%55.3%100%83.3%
Wall surface M A c c @10 cm2.704 cm-2.023 cm-
LevelsNumber3-1-
Wall TypesNumber5-3-
Disclaimer/Publisher’s Note: The statements, opinions and data contained in all publications are solely those of the individual author(s) and contributor(s) and not of MDPI and/or the editor(s). MDPI and/or the editor(s) disclaim responsibility for any injury to people or property resulting from any ideas, methods, instructions or products referred to in the content.