Article

Warm Core and Deep Convection in Medicanes: A Passive Microwave-Based Investigation

1
National Research Council of Italy, Institute of Atmospheric Sciences and Climate (CNR-ISAC), 00133 Rome, Italy
2
Institute of Environmental Research and Sustainable Development, National Observatory of Athens, 15236 Athens, Greece
3
Data4Risk, 75015 Paris, France
4
LMD & LadHyX, CNRS, École Polytechnique, Institut Polytechnique de Paris, 91120 Palaiseau, France
*
Author to whom correspondence should be addressed.
Remote Sens. 2023, 15(11), 2838; https://doi.org/10.3390/rs15112838
Submission received: 15 March 2023 / Revised: 23 May 2023 / Accepted: 27 May 2023 / Published: 30 May 2023
(This article belongs to the Special Issue Remote Sensing of Extreme Weather Events: Monitoring and Modeling)

Abstract

:
Mediterranean hurricanes (Medicanes) are characterized by the presence of a quasi-cloud-free calm eye, spiral-like cloud bands, and strong winds around the vortex center. Typically, they reach a tropical-like cyclone (TLC) phase characterized by an axisymmetric warm core without frontal structures. Yet, some of them are not fully symmetrical, have a shallow warm-core structure, and a weak frontal activity. Finding a clear definition and potential classification of Medicanes based on their initiation and intensification processes, understanding the role of convection, and identifying the evolution to a TLC phase are all current research topics. In this study, passive microwave (PMW) measurements and products are used to characterize warm core (WC) and deep convection (DC) for six Medicanes that occurred between 2014 and 2021. A well-established methodology for tropical cyclones, based on PMW temperature sounding channels, is used to identify the WC while PMW diagnostic tools and products (e.g., cloud-top height (CTH) and ice water path (IWP)), combined with lightning data, are used for DC detection and characterization. The application of this methodology to Medicanes highlights the possibility to describe their WC depth, intensity, and symmetry and to identify the cyclone center. We also analyze to what extent the occurrence and characteristics of the WC are related to the Medicane’s intensity and DC development. The results show that Medicanes reaching full TLC phase are associated with deep and symmetric WCs, and that asymmetric DC features in the proximity of the center, and in higher CTH and IWP values, with scarce lighting activity. Medicanes that never develop to a fully TLC structure are associated with a shallower WC, weaker and more sparse DC activity, and lower CTHs and IWP values. Ultimately, this study illustrates the potential of PMW radiometry in providing insights into dynamic and thermodynamic processes associated with Medicanes’ WC characteristics and evolution to TLCs, thus contributing to the ongoing discussion about Medicanes’ definition.

Graphical Abstract

1. Introduction

A small fraction of Mediterranean cyclones present tropical-like characteristics, namely a cloud-free calm “eye”, spiraling cloud bands, and strong winds near the vortex center which may be associated with the absence of fronts, weak vertical wind shear, and a warm core (WC) with an axisymmetric structure. Yet, these characteristics are seldom detected simultaneously in most Mediterranean tropical-like cyclones (Medicanes). Furthermore, model-based diagnostics (e.g., [1]) reveal that some cyclones classified as Medicanes are not fully symmetrical, have shallow WC structure, and weak fronts. Medicanes also resemble polar lows, since both mesoscale weather systems share the same characteristics, such as high low-level relative vorticity, comparable size of a few hundred kilometers in diameter, and development within marine air masses with low static stability [2].
It has been suggested that Medicanes develop first as extratropical cyclones that undergo tropical-like transition [3] (eventually forming a WC [4]), meaning that they do not attain any fronts due to a lack of differing air masses. The WC can form either by a relatively warm-air mass that is transported to the center of the Medicane and it is cut off from the main flow [4,5] or the WC can be formed by convective activity close to the center of the cyclone due to strong diabatic heating [6,7]. There are still many questions about the physical and dynamical processes that determine Medicanes’ genesis, intensification, and possible evolution to the TLC phase. Medicanes’ definition and potential classification are topics of research of the European network for Mediterranean cyclones in weather and climate—MedCyclones COST Action [8].
Model-based diagnostics show the presence of a WC during the TLC phase (e.g., [6,9,10]), although in most cases the WC is confined to the lowest parts of the troposphere. In some other cases according to [11], low-level diabatic processes become important and strong vertical motions during deep convection (DC) events close to the Medicane’s center contribute to the intensification of the low-pressure system through latent heat release in moist ascent, thus warming the core of the Medicane in great vertical extent. The wind-induced surface heat exchange (WISHE) [12,13] mechanism has also been considered responsible for WC development in Medicanes, in analogy with tropical-cyclone theory. However, all systems tend to grow through the interaction of an upper-tropospheric potential vorticity (PV) streamer or a cut-off system within a low-level baroclinic area, as typically expected for extratropical cyclones (e.g., [14,15]). Nevertheless, different evolutions can be identified when baroclinic forcing and diabatic processes, including air–sea interactions and convection, may all play an important role in cyclone development [10,14].
Miglietta and Rotunno [16] show that sea–surface fluxes and/or condensation latent heating are fundamental to explain the intensification of cyclones. However, the importance and the spatial and temporal distribution of diabatic processes can differ among different cases. The authors proposed a classification of Medicanes depending on driving intensification mechanisms and suggested grouping them in three categories. When a large amount of energy is transferred from the ocean to the atmosphere in the area where a cyclone develops, the vortex is able to sustain itself in a barotropic environment and reach a TLC phase (Category A). Baroclinicity is relevant only in the initial stage, and, as for tropical cyclones, the WISHE theory can explain their intensification. For such Medicanes, the vertical thermodynamic structure, as well as the spatial and temporal distribution of DC and lightning activity are similar to that of tropical cyclones. In some other cases, they never develop to a fully tropical-like structure, and evolve in a baroclinic environment associated with an upper-level PV streamer in which the cyclone formed (Category B). In these cases, warm-air seclusion is sufficient to explain the presence of the WC [15]. Convection appears to be relevant to cyclogenesis and responsible for the rapid intensification of the system and becomes weak during the mature phase. In other cases, smaller-scale vortices develop within the circulation associated with a synoptic-scale cyclone, and tropical-like transition occurs after the interaction with an upper-level PV streamer associated with the large-scale cyclone (Category C) (e.g., [17,18]). Therefore, most cyclones might fit Category C. The authors of [14] identified the need to objectively quantify the relative contribution of baroclinic and diabatic processes to the development of Medicanes, showing that both play an important role in the mature stage of several known cases of Medicanes.
Deep convective clouds are crucial for the tropical transition phase and develop mainly during the intensification period, while lightning activity is mostly pronounced about one day before the maximum cyclone intensity [19,20]. While some Medicanes exhibit the presence of DC in the vicinity of the cyclone center, in most cases DC is far away from the center, most probably hindering the formation of a full-WC structure. In a recent study, Dafis et al. [21] used infrared and microwave satellite products, in conjunction with model reanalysis, to study the evolution of DC in nine Medicanes between 2005 and 2018. They found that only a fraction of these cyclones experienced long-lasting intense convective activity close to their centers, and that the convection is deeper and more intense prior to the Medicanes’ maximum intensity, as also shown for some cases in previous studies [19,22,23]. They also found that only DC in the upshear quadrants led to intensification periods, and that short-lived tropical-like structures develop only during symmetric convective activity. However, even in these cases, lightning activity in the proximity of the cyclone center is rarely observed during the TLC phase (see also [19,23,24,25]). During the early phases, when the storm is under the influence of baroclinic forcing (pre-TLC phase in the following), the majority of clouds show convective characteristics, and lightning activity takes place close to the cyclone center. As the cyclone deepens and the surface wind speed increases during its mature phase, the lightning activity decreases moving away from the center. Electrical activity is more likely in regions with substantial updraft, where mixed-phase regions occur with graupel, supercooled cloud water, and vapor-grown ice crystals in the charging zone, i.e., between −15° and −25 °C and results first from the gravitational separation of particles carrying different signs of charge, followed by differential advection of net charge regions [26]. Such conditions are clearly met during Medicanes’ pre-TLC phase but not during the TLC phase. This behavior agrees well with what has been observed in tropical cyclones (TC) [27,28], where the maximum frequency of lightning activity anticipates the deepening of the cyclones. As observed by Black and Hallett [27] in their study on electrification processes in TCs, even if charge separation occurs in multiple locations in the eyewall or in the rainbands, strong horizontal winds ensure that charged particles become widely dispersed in a relatively short time, thereby weakening both the horizontal and vertical gradients of charge, resulting in a lower probability of cloud electrification and chances of lightning. Some authors ([23,24]), have speculated that a similar mechanism is responsible for the lack of electrical activity observed during most Medicane TLC phases. However, observational evidence or modeling studies of such mechanisms have not yet been conducted.
Passive microwave (PMW) radiometers provide unique diagnostic tools to identify and describe Medicanes’ WCs, which are one of the key elements characterizing Medicanes, although they are not a sufficient condition to establish if a Medicane has reached its TLC phase. They also provide unique measurements to identify DC. WC depth and axisymmetry can be diagnosed using MW temperature sounding (54 GHz) channels. The approach has been developed and extensively applied to TCs [29] and several studies have demonstrated that PMW WC detection contributes to build well-established tools to improve tropical-cyclone analysis and forecasting [30]. Previous work using the satellite-borne Advanced Microwave Sounding Unit (AMSU) [31,32,33] and the Advanced Technology Microwave Sounder (ATMS) [34] have found that the strength of the WC is related to TC intensity, in particular the height of the WC generally increases with the TC intensity quantified in terms of minimum sea level pressure [35] and maximum sustained wind speed [36]. This is consistent with previous studies that demonstrated theoretically the importance of an upper-level WC in mature TCs ([12]). The applicability of PMW WC detection in Medicanes and its use as a diagnostic tool for studying Medicanes’ intensity or transition to TLC phase has never been explored. PMW high-frequency channels (i.e., ≧89 GHz) available in most radiometers can be used to infer DC occurrence, spatial extension, and intensity. Moreover, diagnostic tools and products based on PMW radiometry have been developed and provide information on precipitation [37,38,39,40] and cloud properties [41] which can be used to analyze Medicanes’ precipitation structures throughout their development and transition to TLC phase.
In this study, PMW radiometry is used to extract insights about Medicanes’ WC structure and associated cloud and DC properties. For the first time, a well- established methodology used for WC detection in TCs is applied to Medicanes. The goal is twofold: (1) explore the potentials of such methodology in describing Medicanes’ WC depth, symmetry, and intensity, highlighting the potentials of PMW radiometry in providing new insights into thermodynamic processes associated with Medicanes’ WC and (2) characterize DC (including cloud properties and lighting activity) within the WC and analyze how WC characteristics are related to DC properties. For this purpose, six previously documented Medicanes that developed between 2014 and 2021 are analyzed. Different cloud properties (e.g., cloud-top height -CTH and ice water path-IWP), DC features, and WC occurrence inferred or retrieved from PMW radiometry are analyzed in detail. The ultimate goal of this research is to contribute to the ongoing discussion about Medicanes’ definition and possible classification providing a satellite-based perspective on their formation processes and possible occurrence of the TLC phase.
In Section 2, the data and methodology used in this study are presented. Section 3 is dedicated to the analysis of one case study and of the results of the WC and DC. This is followed by the Discussion in Section 4, while the Conclusions and future perspectives are presented in Section 5.

2. Materials and Methods

In this study, six different Medicanes that occurred between 2014 and 2021 (affecting in most cases the coasts of southern Italy and Greece) are analyzed using PMW observations in conjunction with ground-based lightning detection network data to detect and analyze DC features in the presence of the WC. The six Medicanes and the start and end dates considered for the analysis of the satellite overpasses for each Medicane are listed in Table 1. The minimum mean sea-level pressure (MSLP) and some references to previous studies that have analyzed these Medicanes are also provided. The group for each Medicane according to the classification by [16] is also indicated. It is worth noting that the authors classify the cyclones based on whether they reach a milestone phase, thus, there is only one category for each Medicane. Such categorization is based on the cited previous articles and it was made possible after discussing these cases with the leading author of [16].

2.1. Passive Microwave Radiometer Observations

All overpasses available from seven operational cross-track scanning microwave radiometers are used: five Advanced Microwave Sounding Unit-A (AMSU-A)/Microwave Humidity Sounders (MHS) on board NOAA-18, NOAA-19, MetOp-A, MetOp-B and MetOp-C satellites, and two Advanced Technology Microwave Sounders (ATMS) on board Suomi NPP and NOAA-20 satellites. AMSU-A is equipped with 15 channels, 12 channels in the 54 GHz oxygen band for temperature sounding, and 3 additional window channels at 23.8, 31.4, and 89 GHz. MHS, designed for humidity sounding, has 3 channels in the 183.31 GHz water vapor absorption line, and 2 window channels at 89 GHz and 150 GHz. ATMS has 22 channels, ranging from 23 to 183 GHz, providing both temperature and humidity soundings. Specifically, ATMS channels 1–15 provide measurements at microwave frequencies below 60 GHz (13 in the 54 GHz oxygen absorption band), and channels 16–22 are located at higher microwave frequencies above 88 GHz, with 5 channels in the 183.31 GHz water vapor absorption band. The angular sampling changes with frequency are 2.2° for channels 3–16 (50.3–57.29 and 88.2 GHz), and 1.1° for channels 17–22 (165.5–183.3 GHz). The corresponding nadir resolutions are 31.64 km (compared to 48.6 km for AMSU), and 15.82 km (similar to MHS), respectively. ATMS has the great advantage of a wider swath (2600 vs. 2250 km of AMSU/MHS) that practically eliminates the orbital gaps.
Opaque channels (bands around 54 and 183 GHz) are designed to retrieve temperature and water vapor profiles due to their different sensitivity to specific layers of the atmosphere [47]. However, they are also affected by the presence of liquid and ice hydrometeors. Due to the differential penetration ability of radiation as a function of frequencies, clouds have a specific effect on a given channel if the sounded atmospheric layers are within the precipitating cloud (below the cloud top). Such a frequency dependent effect is due to emission by liquid droplets or rain and to the scattering by the ice hydrometeors present above the sensed atmospheric layer. In presence of DC, the predominant effect for channels peaking in the mid to upper troposphere is due to scattering by the ice hydrometeors in the upper levels, which tends to lower the brightness temperatures (TBs) measured at a given channel.
All AMSU/MHS and ATMS measured TBs are corrected for the limb effect due to the fact that the satellite scans a thicker layer in the atmosphere as the field of view departs from the nadir position. The limb effect causes a shift in the weighting function to a higher altitude at a larger field of view, leading to an artificial TB cooling (tropospheric channels) or warming (stratospheric channels), as shown in [48] (Figure 1). In this study the limb effect is managed through the application of different shallow neural networks, specifically designed and developed to correct this issue for the 54 GHz channels. Each neural network has a two-hidden-layer structure and uses as input variables all the 54 GHz channels, excluding the channel that needs to be corrected.

2.2. Lightning Data

The World Wide Lightning Location Network (WWLLN) consists of ground-based sensors providing lightning locations in real time and globally by measuring the time of group arrival of very low frequency (VLF) radiation produced by lightning discharges [49,50]. Currently, the network counts 70 detectors around the world and is managed by the University of Washington. The reliability of lightning data recorded by WWLLN in characterizing tropical cyclones and convective systems has been demonstrated in different works. The authors of [51,52] found that regions with higher lightning occurrence during Atlantic and western Pacific tropical cyclones were the rainband and the eyewall. Furthermore, they observed a lightning outbreak in the eyewall region prior or during most major intensity changes, with an increase of cloud-to-ground (CG) strokes in the inner core in correspondence of cyclone weakening. On the other hand, [53] investigated the detection efficiency of the network at global scale applying a methodology which exploited the energy variation of strokes. They found a high detection efficiency (around 80%) between −30°N and +30°N even if the number of working stations was lower than the actual number. The author of [54] compared WWLLN with the lightning imaging sensor (LIS) on board the Tropical Rainfall Measuring Mission satellite (TRMM), highlighting that WWLLN detected more strokes over ocean and more cloud-to-ground strokes.
In the following, WWLLN strokes registered within 15 min (±7.5 min) around each ATMS or AMSU/MHS overpass are considered in the analysis focusing mainly on their relative location with respect to the Medicane WC.

2.3. Warm-Core Detection

The WC is one of the key elements characterizing Medicanes. It is identified using the AMSU/MHS and ATMS 54 GHz oxygen absorption band channels typically used for temperature sounding. Similarly to what is done for TCs [29], the WC identification is based on the analysis of the TB warm anomaly measured in these channels. A positive TB anomaly indicates the warm temperature anomaly associated with the WC. In particular, Ch 6(7) (54.4 GHz), Ch 7(8) (54.94 GHz), and Ch 8(9) (55.5 GHz) for AMSU/MHS(ATMS), are used. For these channels the maximum contribution to the upwelling microwave radiation sensed by the radiometer (i.e., the peak of the weighting function) derives from the atmospheric layers at approximately 400, 350, and 200 hPa (the actual peak pressure level depends on the local temperature and water vapor conditions, while dependence on the scan angle is reduced by limb effect correction). In these channels the surface precipitation has a reduced impact on the measured TBs which is sensitive to mid- and upper-troposphere temperature variations. However, in the presence of DC, the scattering by mixed-phase or solid hydrometeors in the upper levels may lower the measured TB at a given channel and decrease the magnitude of the WC signal. This is especially problematic when the WC temperature anomaly is weak. The scattering effect, which is mostly pronounced in the channels whose weighting functions are lower in the atmosphere (AMSU-A Ch. 6, or ATMS Ch. 7) where the presence of scatterers predominates, has been taken into account and corrected using the approach of [55].
In this study, the methodology applied to TCs is applied for the first time to identify and characterize the WC of six Medicanes that occurred between 2014 and 2021. The TB anomaly is computed as the difference of the measured TB in each pixel minus the mean TB computed over a 7° × 7° area (land/coast pixels are not included) around the minimum MSLP. Figure 1 summarizes the process to calculate the TB anomaly. The TB measured at 54.4 GHz (as well as at 54.94 and 55.5 GHz) (Figure 1a) is corrected for scattering by applying the methodology developed by [55] for TCs. The result of this correction is depicted by the TB field shown in Figure 1b, where the 7° × 7° area considered (dotted square) for the calculation of the mean TB is also reported. The difference between the TB calculated after the scattering correction for each pixel over sea (Figure 1b) and the mean TB, leads to the TB anomaly field reported in Figure 1c.
Figure 1. Example of the TB anomaly calculation process for the 54.4 GHz frequency channel: panel (a) shows the measured TB, panel and (b) is the same as panel (a) but after the application of the scattering correction methodology [55]. The dotted area is the 7° × 7° area centered around the minimum MSLP considered for mean TB. Panel (c) shows the TB anomaly.
Remotesensing 15 02838 g001
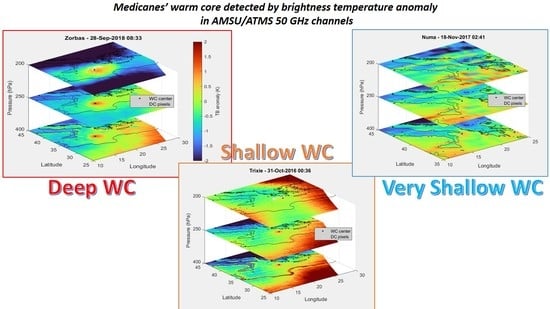
The presence of the warm TB anomaly for the different channels and its steady position in the different channels (as the height increases), indicates the depth of the WC and its barotropic structure. Strength and depth are the two most common variables characterizing the WC. The occurrence of a nearly isolated WC around the cyclone center is identified by visual inspection of the corrected TB anomaly. Different characteristics of the WC anomaly are delineated, such as its intensity (magnitude of maximum TB anomaly), size (area of positive TB anomaly), symmetry (round shape of the positive TB anomaly), and depth. Three depth categories are defined in this study based on visual inspection of the TB anomaly in Ch. 6(7), 7(8), and 8(9) of AMSU(ATMS): very shallow if WC is visible only in Ch.6(7), shallow if it is visible in Ch. 6(7) and 7(8), and deep if it is also visible in Ch. 6(7), 7(8), and 8(9). Such characteristics vary across the different Medicanes analyzed, and throughout each Medicane’s life cycle.
All AMSU/MHS and ATMS overpasses available within the time frame indicated for each Medicane in Table 1 are considered and only the overpasses with a well-defined WC are analyzed in detail. The characteristics of the TB warm anomaly may provide an indication of the dominant dynamical processes during the Medicanes’ life cycle (e.g., latent heat release and stratospheric air intrusion). The TB warm anomaly is also used to identify the WC center. To this purpose, the TB anomaly maps at 54.4 GHz (i.e., Ch. 6 and Ch. 7 for AMSU and ATMS, respectively) are re-gridded to a common higher resolution grid at 0.01° spacing (to avoid issues related to the variable spatial resolution along the radiometer scan). The cyclone center is identified by convolving a 5 × 5-pixel area centered in each grid point and taking the one with the maximum TB anomaly. The WC center position is also compared to the minimum MSLP position identified using the European ReAnalysis version5 (ERA5) dataset [56] provided by the European Center for Medium-Range Weather Forecast (ECMWF) at 0.25° resolution.

2.4. Deep Convection Detection

For all overpasses where the WC presence is identified, DC is analyzed in terms of occurrence, strength, and position with respect to the WC center using PMW-based proxies and methods. The lightning data is used as an additional source of information. The author of [54] derived methods to detect deep convective clouds and convective overshooting using TB differences in the three MHS 183.31 GHz water vapor absorption band channels. For these channels, TB depression increases as the frequency moves away from the center of the absorption band. Therefore, the radiation at 183.31 ± 7 GHz can penetrate deeper into the cloud and therefore it is subject to larger scattering from mid and low cloud layers; the 183.31 ± 1 GHz channel primarily responds to DC with large high-density ice particles in the upper atmosphere. These different responses of the three 183.31 GHz channels suggested the possibility of analyzing the vertical distribution of hydrometeors (see [57] for further details).The authors of [48,58] have further analyzed and assessed the use of these 183.31 GHz TB differences together with AMSU-A channels to detect DC, upper-level disturbances, and areas of significant precipitation in the Mediterranean region. In the present study the [57] (H2005) methodology, applied also to the ATMS corresponding channels, is used for DC detection.
Window channels around 88 GHz are mostly affected by the scattering of heavily rimed and large ice hydrometeors and are useful in delineating the convective cores within the clouds. The minimum TBs at these frequencies are a very good proxy of updraft strength, since they are associated with the presence of large ice particles in the mid/upper cloud layers. The window channels at higher frequency channels (150–157 GHz), as well as the 183.31 GHz water vapor band channels, are sensitive to smaller sized ice particles due to their shorter wavelength and this facilitates the identification of ice in the upper layers often associated with stratiform precipitation.

2.5. Deep Convection Properties

In order to get a deeper understanding of detected deep convective clouds, ice water path (IWP), and cloud-top height (CTH) are also included in the analysis. The DEEPSTORM (DEEP moiSt aTmospheric cOnvection from micRowave radioMeter) algorithm [41,59] relies on a machine learning approach to retrieve IWP and CTH using passive microwave radiometry. Specifically, it trains a gradient boosting and neural network to estimate IWP and CTH using PMW TBs and viewing angle together with ERA5 humidity, temperature, and ground elevation as inputs. DEEPSTORM parameters are fitted to four radiometer types including MHS and ATMS. Evaluation against Cloud Profiling Radar (CRP) measurements shows that DEEPSTORM is better at retrieving IWP greater than 0.5 kg m−2 and CTH above 2000 m. In this study DEEPSTORM outputs have been extracted during the lifetime of each Medicane for every available overpass.

3. Results

3.1. Case Study: Ianos

As an illustration of a Medicane’s WC TB anomaly, and the associated cloud properties (DC occurrence, IWP, CTH, and strokes) one MetOp-B AMSU/MHS overpass capturing Medicane Ianos during its TLC phase on 17 September 2020 at 08:35 UTC is analyzed in detail (Figure 2 and Figure 3). During its phase of maximum intensity on September 17–18, torrential rainfall and severe wind gusts affected the western coasts of Greece and the Ionian islands. Ianos has been identified as the most intense Medicane ever recorded by [44], with tropical-like features (low-level vortex, deep WC, and axisymmetry) during the mature phase [10].
Figure 2 shows TB imagery at 89 and 183 ± 7 GHz (top panels) and the corresponding estimates of CTH and IWP (bottom panels). In the top panels, DC pixels, identified with the H2005 approach are also shown, while the WWLLN strokes detected within 15 min around the time of the overpass are superimposed to the CTH image. DC is detected at the north-west of the cyclone center, mostly within a 100 km radius, and over the Calabrian coast in southern Italy; it corresponds to the areas of TBs at 183 ± 7 GHz below 220 K. The two regions, however, are characterized by different TB signatures at 89 GHz and 183 ± 7 GHz, and different lightning activity, a clear indication of different microphysical processes. The lack of a strong scattering signal at 89 GHz and the hardly visible strokes in the proximity of the cyclone center suggest the presence of rimed ice particles (graupel), limited in size, which are blown away by a strong horizontal wind in slanted trajectories in the inner rainband, limiting the possibility of electrification processes and lightning activity. Electrical activity occurs over the Calabrian coast, where a substantial updraft favors the growth of graupel to a larger size (indicated by the lower TBs at 89 GHz) and where gravitational charge separation and electrification processes can take place (see also [24]). On the other hand, the stronger scattering signal at 183 ± 7 GHz around the cyclone center indicates the presence of larger amounts of ice and deeper clouds than over the Calabrian coast. In the bottom panels, CTH distribution indicates a closed-eye cyclone, which is well centered around the location of the WC center (black open circle) (note that the position of the ERA5 minimum MSLP (black cross) does not correspond to the cyclone center). Shallow clouds (CTH < 6 km) are visible in the southern region around the center (likely characterized by warm rain processes (see also [24]), while deep clouds with CTH > 12 km are observed in the regions associated with DC. The deepest clouds (CTH > 13 km) are found in the vicinity of the cyclone center, where the highest IWP values are found, reaching a peak (around 6 kg m−2) (note that only significant IWP values above 0.4 kg m−2 are shown), and where no WWLLN strokes are registered. From Figure 2 the lack of symmetry in the cloud distribution around the cyclone center is evident. It is also evident that lightning data alone are not a good proxy for DC and their occurrence is more related to the scattering signal at 89 GHz than to the CTH or IWP. This finding is in line with several studies reporting no (or very weak) lightning activity within 200 km from the cyclone center during Medicanes’ mature phases [19,20], although DC features are often observed also in the proximity of the cyclone center during this phase [21,24].
Figure 2. MetOp-B AMSU-A/MHS overpass on 17 September 2020 at 08:35 UTC. Top panels: MHS TBs at 89 GHz (a) and 183.31 ± 7 GHz (b). Black dots indicate the deep convection pixels as identified by H2005. Bottom panels: Cloud-top height (c) and IWP (d) estimated by DEEPSTORM (uncertain estimates for CTH (<2.5 km) and IWP (<0.4 kg m−2) are displayed in gray). Black stars in panel (c) indicate WWLNN strokes measured 15 min (±7.5 min) around the time of the overpass. The black circle indicates the 100 km radius area around the WC center (identified by the small black open circle), while the black “x” indicates the location of the minimum MSLP from ERA5.
Remotesensing 15 02838 g002
Figure 3 shows a TB anomaly derived from AMSU-A measurements at Ch. 6, 7, and 8. In this phase a nearly axisymmetric WC is visible for Ch. 6 and 7. Although a correction for the cloud contribution to the upwelling MW signal has been applied, the cloud signature is still visible in Ch. 6 as a cold TB anomaly due to the scattering by ice particles in the areas of larger TB depression at 89 GHz (Figure 2) (more visible over the Calabrian coast than in correspondence with the main rainband). At Ch. 8, the TB warm anomaly is still visible but without an axisymmetric structure. At this frequency, the TB field is affected by the upper troposphere thermal field, by the tropopause height, which usually increases moving north to south, and by the possible presence of troughs associated with stratospheric intrusion [48]. This is confirmed by the negative anomaly south of 36°N due to the negative gradient of atmospheric temperature around 200 hPa moving north to south (not shown). The WC is not centered around the position of the ERA5 minimum MSLP (black x), which is shifted to the west with respect to the WC center (small black circle). This confirms the shift of the position of the ERA5 minimum MSLP with respect to the cyclone center identified by the CTH in Figure 2. Such inconsistency is due to three main factors: the uncertainty in the WC center definition linked to the low spatial resolution of the AMSU-A 50 GHz channels, especially at the edge of the radiometer swath and possible mismatch with ERA5 regular grid; the fact that the channel used for the WC center location peaks around 400 hPa; and possible model bias in the reanalysis. The WC anomaly seems to be very well defined and it is classified as a deep WC (warm anomaly visible at all three channels). It is worth noting the alignment in Ch. 6 and Ch. 7, consistently with the barotropic structure, which is a clear indication of Ianos’ TLC phase. It is worth noting that the deep well-defined WC observed for Ianos in all three channels is a rare feature (see Section 3.2).
Figure 3. MetOp-B AMSU-A/MHS overpass on 17 September 2020 at 08:35 UTC. AMSU-A limb-corrected TB anomaly for channels 6 (a), 7 (b), and 8 (c) with scattering correction. The black x indicates the position of ERA5 minimum MSLP, while the black circle indicates the 100 km radius circle around the warm-core center position (small black circle).
Remotesensing 15 02838 g003
As an example of a WC classified as shallow, Figure 4 refers to a different phase during Ianos’ development, about 8 h before the overpass shown in Figure 3. It shows the TB anomaly measured at ATMS NOAA 20 Ch. 7, 8 and 9. At this earlier stage, the WC is well defined only at lower levels (i.e., ATMS Ch. 7 and 8). The different classification of the WC lies in the TB anomaly structure visible at Ch. 9, which reveals the presence of a deep trough to the west of the cyclone center. This intense shallow WC structure evidences that in the earlier phases the barotropic nature of the system is limited to the lower levels, with a significant alignment of the TB anomaly signal at Ch. 7 and 8, while Ch. 9 reveals the stratospheric air intrusion, which might have favored the formation of the deep WC at a later stage (Figure 3).

3.2. Very Shallow, Shallow, or Deep Warm Cores

The analysis illustrated in Section 3.1 has been applied to all studied Medicanes. In particular, Figure 5 reports the TB anomaly map for the other five Medicanes analyzed in this study. From top to bottom, each row refers to a Medicane in the temporal order in which they occurred (i.e., Qendresa, Trixie, Numa, Zorbas, and Apollo), while the three columns from left to right report the TB anomaly at 54.4, 54.94, and 55.5 GHz, respectively. Figure 5 aims to give an overview of the different WC structures that can be detected by AMSU and ATMS overpasses, although during each Medicane lifetime the WC structure may change in size, intensity, and depth. While the considered overpass for Qendresa and Zorbas shows a deep WC, a shallow WC has been detected for Trixie and Apollo. On the other hand, Numa shows a very shallow WC. The WC structure is very similar for Qendresa and Zorbas (both characterized by deep WCs) both in terms of TB anomaly maximum and WC shape (i.e., the 1 K isoline is limited in the 100 km radius in all cases). The WC structure is also in agreement with Ianos (Figure 3). At the same time, Trixie and Apollo show the same WC structure, with a clear warm area at 54.4 and 54.94 GHz channels, while this feature is not visible at 55.5 GHz channel. The Numa overpass is one of the very few cases where a very shallow WC has been detected and it is characterized by a very weak warming area visible only at 54.4 GHz channel.
Table 2 summarizes the main characteristics inferred from the analysis of all the overpasses where a well-defined, isolated WC (very shallow, shallow, or deep) was observed. For each Medicane, the approximate maximum duration of the WC (i.e., time interval between the first and the last overpass showing a well-defined WC) and the number of overpasses for the different WC types is reported. Moreover, Table 2 reports the lowest, highest, and mean value of the TB anomaly maximum (ΔTBmax) measured (which identifies the WC center), the number of overpasses where strokes and DC were found around the WC center (within 100 km), and the number of strokes and the percentage of DC area in each case. The last column reports the minimum, maximum, and mean distance of the WC center from the ERA5 minimum MSLP (in km).
Only Ianos and Zorbas show a persistent deep WC structure (captured by 59% of the overpasses with WC in Ianos and by 73% of overpasses in Zorbas), although they both show some weaker phases with shallow WC structures during their lifetime. Their WCs last for 41 h and 36 h, respectively, and the highest ΔTBmax among the six Medicanes is registered for Ianos (1.41 K on average, with peaks over 2 K). DC occurring in the proximity of the WC is visible only in 40–60% of the available overpasses during the deep WC phase, with higher occurrence for Ianos (covering 15% of the 100 km radius area in four overpasses) than for Zorbas (covering 9% of the 100 km radius area in five overpasses). Nevertheless, for these overpasses, lightning strokes close to the cyclone center are very few: 8 for Ianos and 18 for Zorbas. During their shallow WC phase, DC is more likely (detected in 90% of the overpasses), and for Zorbas it is associated with the most intense lightning activity (63 strokes). A shallow WC is observed also for Apollo (nine overpasses, max duration 21 h) and Qendresa (four overpasses, max duration 9 h), with mean ΔTBmax comparable to Zorbas (although Apollo shows larger variability with a peak at 1.64 K), very few strokes registered only for Qendresa (9) and rare occurrences of DC for both. Numa is characterized by both very shallow (i.e., weak warm TB anomaly visible only in Ch. 6) and shallow (TB anomaly visible in Ch. 6 and 7) WC phases. The lightning activity is almost absent throughout these phases, while DC is observed only during the very beginning of the shallow WC phase. Numa shows the lowest ΔTBmax among all Medicanes (mean around 0.6 K). Finally, Trixie is characterized by a very shallow (visible only in Ch. 6), and weak (mean ΔTBmax around 0.9 K) WC phase (only for four scattered overpasses), and both the lightning activity and DC are more intense than for the other cases (except for Ianos and Zorbas). Overall, lightning activity (DC) in the proximity of the cyclone center is observed only in 38% (58%) of the available overpasses in presence of a WC.
It is worth noting that in all cases there are very few strokes registered compared to what is observed during the Medicanes’ development phases (not shown, see also [19,23,24,44]) or at larger distances from the WC centers (as seen in Figure 2). This is quite evident, for example for Ianos and Zorbas in the presence of a deep WC. Some authors have suggested that, similarly to TCs, strong horizontal winds during the mature phase might inhibit cloud electrification processes [24].
As shown in Figure 2, Figure 3 and Figure 4, the distance of the cyclone center from the ERA minimum MSLP position is noticeable. In the last column in Table 2, the distance (minimum, maximum and mean values) of the WC center (defined on the basis of the warm TB anomaly) from the ERA5 minimum MSLP (in km) is provided. The deviation from the reanalysis can vary significantly for each case (from few km to tens of km), and it is comparable to ERA 5 grid spacing in most cases, while the largest differences are found for Ianos (55.8 km) and Zorbas (62.1 km). However, as it will be discussed in Section 4, it must be pointed out that the WC center position may be affected by some uncertainty due to the cross-track radiometer low and variable spatial resolution across the scan.

3.3. Deep Convection Characteristics

In order to further highlight the relationship between WC occurrence and DC characteristics, Figure 6 presents several DC and cloud features in the proximity of the cyclone center in presence of the WC (i.e., for all the overpasses relative to each Medicane reported in Table 2). The distribution of the parameters is shown for all pixels within 100 km from the WC center. For CTH, IWP, and the TB measured at 89 GHz (which is a good proxy of updraft strength) it is split between DC and no-DC pixels.
Figure 6a shows a feature common to the analyzed Medicanes (except Qendresa): the DC pixels are quite far from the WC center (e.g., the 25th percentile of the distribution is always higher than 50 km, with a peak close to 80 km for Apollo). The two most intense Medicanes (Zorbas and Ianos) show a quite wide distribution, with a limited number of DC pixels detected at 20 km or less distance from the WC center. Looking at the distributions, we can infer that the DC can occur rarely at very close distance from the WC center (except for the few DC pixels found for Qendresa), the median values are typically around 70–90 km from the center (except for Apollo) and distance shows a large variability (except for the few DC pixels of Apollo and Qendresa). Such variability is an indication that baroclinic forcing might have a large share on Medicanes’ intensification [60] and that DC away from the cyclone center might be related to the large-scale ascent and to the presence of weak frontal activity. It is worth noting, that such distance is not meant to be a definition of the Medicane’s eye, since the WC occurs also when the closed eye is not yet visible. However, according to [61], the size of the eye in TCs is mostly less than 60 km in radius (although it shows some variability). Our observations show a larger (on average) distance of DC from the WC center than in TCs. Trixie and Apollo show relatively high CTH and IWP compared to the weaker Medicanes (Numa or Qendresa) especially in the presence of DC (median CTH around 11–12 km, and median IWP around 4–5 kg m−2), with DC occurring at larger distances from the cyclone center (on average) compared to the other Medicanes (Figure 6a). Numa shows slightly lower IWP and CTH values on average for DC cases, and Qendresa presents the lowest values (CTH < 10 km and IWP < 4 kg m−2). It must be noted that for Qendresa the DC activity is very limited (only seven pixels for one satellite overpass) and it is found very close to the cyclone center. Zorbas shows comparable median values of IWP to Apollo and Trixie but with larger variability, also due to the presence of both shallow and deep WC phases, reaching peaks around 6 kg m−2 for DC cases. It also has larger values of CTH (mean around 12 km) for DC pixels. Ianos stands out with respect to the other Medicanes in terms of both IWP and CTH (median around 5 kg m−2 and 13 km respectively for DC pixels) which show the largest variability with peaks above 9 kg m−2 and 14 km respectively for DC pixels. It is worth noting that the IWP values for no-DC observations do not show significant variability (mean values ranging between 2 and 2.5 kg m−2) compared to the DC observations (mean values ranging between 3.7 and 5.2 kg m−2). The TB at 89 GHz, which can be used as proxy of the intensity of convection, does not show very low values on average compared to typical deep convective systems (as shown in Figure 2) or to Medicanes in early development stages (see also [23,24]); this is compatible with the scarce lightning activity observed in most cases in presence of the WC (Table 2). For Zorbas and Ianos the TB at 89 GHz shows the largest variability with lowest values around 210 K and 180 K, respectively, which is another indication of the severity of these two Medicanes (Ianos in particular) with respect to the others (lowest values > 220 K).
Figure 6. Overview of deep convection and cloud features for all six Medicanes in presence of a warm core within 100 km from the WC center: box plots of the distance of DC pixels from WC center (a), CTH (b), IWP (c), and TB at 89 GHz (d) split between deep-convection (DC) and no deep-convection (no-DC) pixels.
Remotesensing 15 02838 g006
In Figure 7 we aimed to investigate the spatial distribution of IWP around Medicanes’ centers during WC lifetime to notably identify quadrants with highest IWP probability. Thus, we built the composite distribution of the IWP for DC and no-DC pixels around the WC center for all six Medicanes. The distribution is affected by the different duration of the WC and different number of overpasses available for each Medicane (see Table 2) (e.g., there are fewer ice cloud observations available for Trixie and Qendresa, especially compared to Ianos or Zorbas). In general, no-DC observations (on the left of each subplot pair), which account for 74% of the dataset, are associated with lower IWP (mean IWP = 2.2 kg m−2), while DC observations on the right (which account for 26% of the dataset) are associated with higher IWP (mean IWP = 4.5 kg m−2). A limited number of DC pixels are observed in proximity to the WC center, except for Apollo and Trixie. The IWP values and spatial distribution found for the different Medicanes are consistent with the analysis carried out before, with Ianos and Zorbas being characterized by the largest values (up to 9 kg m−2 for Ianos) and highest occurrence, while lower DC occurrence and IWP values are found for Numa Trixie, Apollo and Qendresa. No-DC observations do not show significant variability of IWP values compared to the DC observations (as shown in Figure 6), but their spatial distribution varies significantly among the different Medicanes. We can notice that the actual cyclone center is quite well defined for most Medicanes (in particular for Ianos, Apollo, and Numa), and an ice-free (IWP < 1 kg m−2) region within 0.5° is visible more or less in the region of the closed eye. As pointed out before, there is some uncertainty in the WC center definition, due to the low and variable spatial resolution of the 54 GHz channels (especially for the overpasses capturing the Medicanes at the edge of the swath). This is quite evident for Zorbas, where the closed-eye (i.e., ice-free in this case) region at the center is not well defined. A nearly circular distribution of no-DC ice clouds characterizes all Medicanes, although it may be affected by the low number of overpasses as for Qendresa and Trixie, or by the presence of low level clouds (IWP < 1 kg m−2) as in the southern sector of Ianos, as observed in [24]. The distribution of DC is more similar for Medicanes with deep WC (Ianos and Zorbas, recorded as the most intense Medicanes), where it is more asymmetric, mostly located in the north-west quadrant, while it is more scattered and azimuthally symmetric for Medicanes with weaker WCs.

3.4. Variables’ Importance in Defining the Warm Core

In this last section, we evaluated the relationship between WC occurrence and type (very shallow, shallow, or deep) and several input variables. For this purpose, we used a machine learning algorithm able to identify such relationships, either direct or indirect. Specifically, we trained a random forest [62] algorithm to detect WC occurrence and type using the following input variables: TBs at 54.4 GHz, 54.94 GHz, and 55.5 GHz (Ch. 6(7), Ch. 7(8), and Ch. 8(9) for AMSU(ATMS)), TBs at 89 GHz, and IWP, CTH, and strokes number and DC occurrence within 100 km from the storm center. This approach allows the identification of all input variables related to WC occurrence and WC type while evaluating the strength of the relationship with the so-called “variable importance” [62]. A variable with high variable importance indicates that it is strongly used by the random forest model and, as such, is strongly related to the target variable (i.e., WC occurrence or type). A random variable has been added in the algorithm as an input variable to distinguish between variables that are significantly (or not) related to WC occurrence or type. It is worth noting that this machine learning tool cannot be used for prediction as we have only a limited amount of data in our training database. In addition, the algorithm uses a pixel-by-pixel method while a predictive method should consider 2- or 3D structures of the patterns.
Figure 8 shows the input variables selected by the algorithm as related to the WC occurrence (top panel) and WC type (bottom panel) (from the most relevant to the least relevant).
As expected, Figure 8 highlights the strong relationship between TBs in the temperature sounding channels and WC occurrence and type. However, while TB at 54.94 GHz (Ch. 7(8)) is found to be the most important variable for WC occurrence, TB at 55.5 GHz (Ch. 8(9)) is better at discriminating between shallow and deep WCs. This result is intuitive since lower frequencies probe deeper in the atmosphere and are able to detect shallower WC occurrence (see Figure 3). On the other hand, as shown in Figure 3 and Figure 4, TB 55.5 GHz is essential for distinguishing between shallow and deep WCs. It must also be highlighted that CTH is more important to discriminate between WC types than for detecting WC occurrence. Once again, this might be because this variable allows the identification of elevated clouds, which are a signature of deep WC. TB 89 GHz and IWP have a more marginal impact. This is likely because, as we showed previously (e.g., in Figure 2), areas with high ice content are not always associated with WC occurrence. Note that stroke number and DC occurrence have not been selected as significant in any case and thus have been deemed as unrelated to WC occurrence or type by the algorithm. As explained before, stroke occurrence is not a good indicator of WC occurrence or intensity, and this is confirmed here.

4. Discussion

In this paper, we argue that MW-based diagnostics of the WC which were originally developed for TC can also be applied to Medicanes, as highlighted in Section 3. In particular, the 54 GHz temperature sounding channels can provide useful information on the WC’s characteristics (cyclone center, depth, symmetry, and intensity). Moreover, the MW-based analysis of the cloud (IWP and CTH) and DC properties (occurrence, position, strength, and lightning activity) in the proximity of the cyclone center, combined with the evolution and characteristics of the WC, provides additional information to delineate Medicanes’ formation processes during their possible transition to the TLC phase. From the analysis of the six Medicanes presented in Section 3.2, it is evident that WC and DC characteristics vary significantly among them, thus making it difficult to identify common behaviors. This is in line with the current debate in the scientific community about finding a comprehensive definition for “Medicane” (see also [15]). For instance, persistent deep WC, i.e., a clear isolated round-shape positive TB anomaly region visible in all channels, was observed only for the two most intense cases (Ianos and Zorbas). In all other cases, a shallower WC was observed in both Ch. 6/7 and Ch. 7/8 and hardly ever only in Ch 6/7 (only in two overpasses for Numa, one for Qendresa, and one for Trixie at the early stages of their evolution).
The DC properties also highlight very interesting features. The distribution of the DC distance from the WC center (shown in Figure 6a), shows a limited spread because it refers only to the DC pixels within the 100 km radius and only to the overpasses with WC (where DC occurs rarely, see the low percentage values in Table 2). It also evidences that DC mostly occurs at the edge of the area considered. Such behavior is very different from what is usually observed for the overpasses with no WC, such as at the early development phases (not shown in this study) where DC activity is stronger and in close proximity to the cyclone center (see also [23,24]). The results suggest that the behavior of DC during the WC is highly variable. The median DC distance from the WC center (around 80 km) seems to be consistent with [63], where the composite of ERA5 precipitation distribution for 59 Medicanes shows that it increases from the center to ~0.8° and then decreases. Our results seem different from what observed in most Mediterranean cyclones associated with heavy precipitation [60], where development of DC “is favored close to cyclone center (and towards their eastern side), most probably due to the system fronts”. Another important aspect is the lack of symmetry in DC distribution around the WC center which finds some correspondence with convection distribution in TCs. For example, [64] investigates the asymmetric distribution of convection in TCs over the western North Pacific during the period 2005–2012. The rear-left quadrant relative to TC motion shows the highest occurrence rate of convection, while the front-right quadrant has the lowest. In terms of intensity, weak convection is favored in the front-left of a TC at large distances, whereas strong convection is more likely to appear to the rear-right of a TC within a 300 km range. The authors of [65] analyzed TCs of hurricane strength showing the occurrence of an eyewall precipitation and updraft asymmetry whose maxima are located in the downshear and downshear-left regions.
It is worth noting that satellite-based WC and DC properties can provide further elements to identify different formation processes in Medicanes in support of model-based studies [14,16]. In those studies, different categories (or groups) of Medicanes have been identified based on the role of diabatic versus baroclinic processes in WC development. For example, it is clear that Ianos and Zorbas have very distinct features compared to the others. The PMW deep WC structure observed during their mature stage, with highest TB anomaly, is an indication that diabatic forcing might be much stronger in Ianos and Zorbas, which are associated with Category A Medicanes defined by [16] (see also Table 1), than it is for the other Medicanes. However, it is difficult to attribute the role of WISHE or upper-level dynamics. For example, [66] shows that at first, Zorbas on 27 September 2018, 12:00 UTC, was dependent on the upper-level dynamics, and was associated with a warm-air seclusion. At a later stage, on 28 September 2018, which is the time we have focused on here, before landfall in Greece, strong DC had eroded the upper-level PV streamer suggesting that the observed WC at upper levels is due to intense DC activity close to the cyclone center. It is worth noting that Ch. 8/9 can be very useful in revealing stratospheric intrusions and merging of the WC with upper-level troughs in the early or late phases of the Medicane’s development (as shown in Figure 4); this is consistent with previous studies where AMSU-A Ch.8 has been used for diagnostics of potential vorticity intrusions in the Mediterranean [48]. Figure 9, for example, shows the TB in Ch. 8 and Ch. 9 over a larger area (to possibly identify stratospheric intrusion) for the ATMS and AMSU-A/MHS overpasses shown in Figure 3 and Figure 4, respectively.
For the ATMS overpass (Figure 9a), when the WC is visible in the lower channels, a stratospheric warm-air intrusion is depicted by higher values of TB in Ch. 9 located north-west of the Medicane’s WC. Eight hours later the AMSU Ch. 8 reveals the transition to a fully tropical-like structure, with a deep WC system extending to the tropopause, as shown in Figure 3, but the upper-air trough has substantially weakened. In this case, a bottom-up WC development is probable (i.e., the upper-level trough has weakened but the WC has a clearer definition); however, we cannot exclude the possibility of stratospheric air intrusion given the absence of in situ observations.
A cut-off low transition to a WC system can be difficult to interpret with satellite data since the lowered tropopause and subsequent intrusion of warm stratospheric air in the upper channels can suggest an upper-level WC. In these cases, the transition to a TLC can often be seen in the lower AMSU/ATMS channels first in correspondence with DC near the inner core of the cyclone, which gradually warms the mid-troposphere through the release of latent heat. A TB warm-anomaly signal may continue to be detected in the AMSU upper channels during the detection of a low-level WC. According to [16], such a set-up may be associated with Category B Medicanes when baroclinicity is still present (evident by the upper-level trough detection) even at the mature Medicane phase. Eventually, increasing wind shear may erode the upper WC and the TB warm anomaly may disappear from Ch. 8/9, although lower channels may continue to depict the Medicane WC. Our findings suggest that such behavior seems to correspond to Medicanes Apollo and Trixie, which exhibit a similar shallow WC structure with scarce DC activity, at the furthest distance (on average) from the WC center among the analyzed Medicanes. They also show similar cloud properties (in terms of CTH and IWP) (Table 2 and Figure 5, Figure 6 and Figure 7). On the other hand, Qendresa and Numa show distinct features with respect to the other two. Numa remained almost stationary over the Ionian Sea for 36 h [1,23] and shows a long-lasting (21 h) but very weak shallow WC structure (limited in size and with the lowest TB anomaly among all analyzed cases), and weak DC activity in proximity to the WC center. Qendresa is very intense in terms of minimum MSLP, although our analysis shows weak and very limited DC activity during the WC phase (low CTH and IWP in Figure 6), with very few DC pixels found only within the deep WC (shown in Figure 5). This seems to be consistent with [42] who found that the upper-level dynamics play an important role in cyclone development. According to [1], Qendresa never developed an upper-level warm core, but is nevertheless widely recognized as a Medicane (e.g., [18]). Qendresa’s WC and DC characteristics that are highlighted in this study, including the deep WC shown in Figure 5, suggest that it could have originated from a warm-air seclusion (see [4]).
MW-based diagnostics can be used also to track Medicanes (e.g., the cyclone center position). In some of the analyzed cases, the WC center position determined from the maximum TB anomaly is positioned within or near the area of minimum CTH at the center and some deviations with respect to the ERA5 minimum MSLP are observed often (Figure 2, Figure 3 and Figure 4, and last column in Table 2). However, there are some important limitations to be considered in the usage of the (limb-corrected) TB anomaly derived from 54 GHz channels for WC detection and characterization. One is the low and variable spatial resolution (as pointed out in Section 3), and the other is contamination due to precipitation on the measured TBs, in particular the cooling effect due to the scattering by the ice hydrometeors in correspondence with convective clouds. In this study, such cooling effects on TBs have been corrected using correction parameters that have been derived from tropical-cyclone climatology [55] but, as seen in Figure 3, they are not always completely eliminated in the presence of strong scattering. Moreover, due to the low spatial resolution, which varies across the radiometer’s swath, the WC may be undersampled, especially on the edges of the swath. In this case, the TB anomaly (which can be used as a proxy of the Medicane intensity) is underestimated, and the WC center position may be affected by large uncertainty (at least of the field-of-view (FOV) size). The use of high-frequency channels or the CTH (as shown in Figure 2), or ASCAT surface winds when available, provide further elements to verify to what extent the WC center corresponds to the cyclone center.

5. Conclusions

In this study, we used PMW measurements together with ancillary data, such as lightning stroke occurrences, to shed a new light on six Medicanes that developed between 2014 and 2021. Specifically, we focused on WC and DC occurrence and characteristics to better understand dynamics and thermodynamics within Medicanes. First, we applied a methodology, originally developed for TCs, which is able to identify and characterize WC using the 54 GHz oxygen absorption band observations. Results highlight the possibility to describe WC depth, intensity, and symmetry using this approach. For instance, we show that only Ianos and Zorbas (and marginally Qendresa) were associated with a deep WC structure. We expanded the Medicane analysis focusing on DC-related cloud properties including CTH, IWP, and lightning activity. Hence, we show that IWP ranges, on average, between 3.5 and 5 kg m−2 in DC while being around 2 kg m−2 outside the DC cluster. CTH shows significant variability among Medicanes ranging from 10 to 13 km in DC (between 8.5 and 11.5 km outside convective clouds). The six Medicanes are characterized by scarce lightning activity and a weak scattering signal at 89 GHz in the WC region, also in the presence of DC, with high CTH and large IWP, indicating the possibility that strong horizontal winds inhibit the growth of large-size rimed particles, as well as gravitational charge separation and electrification processes, as suggested by [24]. We also investigated the relationship between WC characteristics and DC behavior. Firstly, we analyzed DC properties within a 100 km radius from the WC center and then we built a temporal composite of IWP around each Medicane center in order to highlight potentially favored quadrants for heavy DC development. Even if north-western quadrants have the most intense DC activity (with IWP values above 9 kg m−2) for the two most intense Medicanes, i.e., Ianos and Zorbas, no final conclusion can be drawn on a privileged region for intense convective development. This analysis also revealed that cyclone centers, deduced from the WC TB anomaly, are well defined with ice-free central regions. In the last section of results, we went a step further into the WC–DC relationship as we used a machine learning model to identify the variables, among TB, IWP, CTH, stroke number, and DC occurrence, that are the most effective to detect WC and to discriminate between shallow and deep WCs. Therefore, we computed so-called variable importance and showed the high impact of temperature sounding channels for characterizing WC with TB at 54.94 GHz (Ch. 7(8)) being the most effective for detecting WC and TB at 55.5 GHz (Ch. 8(9)) being the best for distinguishing between shallow and deep WC.
This study also aims at contributing to our understanding of the connection of DC (i.e., the intensity and asymmetry in the radial distribution) to WC structure. The two Medicanes with predominant deep WCs, Ianos and Zorbas, exhibit an asymmetric but deep and intense convection, while in other cases (mostly shallow or very shallow WC) an azimuthally symmetric and weak convection is observed. As shown in a previous study [17], the distribution (symmetry and distance from the center) and intensity of DC activity in the storm plays an important (but not exclusive) role in Medicanes intensification. Our study shows that during the WC phase in Medicanes categorized as Category A (Table 1), DC is more intense (although much weaker than during the early development phase), asymmetrically distributed around the WC center, and found in close proximity to the WC center. On the other hand, in the other four Medicanes, which are categorized as Category B (Table 1), DC is weaker, rare, and hardly found in proximity to the WC center. These four Medicanes show a large variability in WC and DC characteristics. Trixie and Apollo exhibit a similar shallow WC structure with scarce DC activity, at the furthest distance (on average) from the WC center; Numa shows the weakest and most shallow WC structure, although weak DC activity is found in proximity to the WC center; Qendresa, which is very intense in terms of minimum MSLP, shows mostly shallow WC and almost absent DC activity (found only during the brief deep WC phase).
This study shows, for the first time, the relationship of WC to DC in the Mediterranean from an observational perspective. A more extensive study will be carried out in the future to analyze the changes in Medicanes’ DC activities before, during, and after the WC phase and to explore more in-depth differences and analogies with Mediterranean cyclones’ climatology. In this regard, analogies with TCs could be further investigated in the future. Rogers et al. [65] analyzed rapid intensity change (RIC) in TCs in relation to the occurrence of DC with respect to the dynamically significant vortex structure (as depicted by the radius of maximum wind (RMW)). The authors found that for intensifying TCs the peak in the distribution of DC was preferentially located inside the RMW, at close distances from the storm center, whereas for steady-state TCs the DC was primarily located outside the RMW. An extensive study based on satellite-based surface winds, WC, and DC diagnostics would be useful to assess if similar behavior is observed in Medicanes, although baroclinic forcing might have a large share on the intensification and on the DC location.
The PMW-based diagnostics of the WC, associated DC, and cloud features presented in this study offer important information about the nature of cyclones and their possible transition to the TLC phase. Such satellite-based information can be exploited to provide insights about the different Medicanes’ driving formation mechanisms and can contribute to the current debate in the scientific community on their definition and classification based on the relative importance of baroclinic and diabatic processes [11,12]. Analyzing the evolution of the WC exploiting the different satellite overpasses available, it is possible to capture the transition to a fully tropical-like structure (Category A), or a persistent warm-anomaly signal in upper channels (Ch.8/9) during the detection of a low-level WC (Category B), or the merging with a pre-existing baroclinic system (Category C) (case not analyzed in the present article). PMW radiometers can also be effectively used for surface rainfall estimation associated with precipitation systems over the Mediterranean Sea including Medicanes (see for example [67,68]). A detailed and extended analysis of PMW-based precipitation estimates in relation to WC and DC properties will be carried out in the future to gain insights about the role of diabatic processes in Medicanes’ WC development and transition to TLC phase.
This study represents the first step towards an automated PMW-based identification of WC features (depth, symmetry, and intensity) which, associated with DC and cloud properties diagnostics, could be used for tracking Medicanes’ (and more generally Mediterranean WC cyclones’) center positions, as well as their formation and evolution processes, integrating the information available from NWP models. To this purpose the scattering correction procedure and the WC center detection presented in this study will be refined using machine learning approaches trained on large datasets of Mediterranean cyclones.
It is worth noting that all current operational PMW radiometers (AMSU/MHS on board NOAA and MetOp satellites, and ATMS on board SNPP and JPSS series satellite) as well as the future European MetOp-SG MWS and MWI radiometers, are equipped with 54 GHz band temperature sounding channels to be used for WC detection, and with high frequency channels for DC and cloud properties diagnostics. The availability of a large number of operational satellites (eight at the moment) and the wide swath (around 2500 km for cross-track scanning radiometers) ensure a very good spatial and temporal coverage over the Mediterranean area. These radiometers can be exploited in the future towards the development of satellite-based tracking and intensity estimation of Medicanes in a operational setting (similarly to what is done for TC, [30]), possibly combining the MW-based products with the Meteosat Third Generation (MTG) VIS/IR and lightning measurements (which will be soon available) to enhance tracking methods, especially when the WC is of limited size.

Author Contributions

Conceptualization, G.P. and L.P.D.; methodology, G.P., L.P.D. and J.-F.R.; software, L.P.D., J.-F.R., P.S. and D.C.; formal analysis, G.P., L.P.D., J.-F.R. and S.D. (Stavros Dafis); investigation, G.P., L.P.D., J.-F.R. and S.D. (Stavros Dafis); data curation, P.S. and D.C.; writing—original draft preparation, G.P., L.P.D., J.-F.R. and S.D. (Stavros Dafis); writing—review and editing, G.P., L.P.D., J.-F.R., S.D. (Stavros Dafis), D.C. and P.S.; visualization, L.P.D. and J.-F.R.; and supervision, S.D. (Stefano Dietrich). All authors have read and agreed to the published version of the manuscript.

Funding

This research was partially supported by the EUMETSAT Satellite Application Facility for Hydrology and Water Management (H SAF) Third Continuous Development and Operation Phase (CDOP-3). H-SAF Agreement H-SAF_CDOP-3 Prot. 0001479 28-03-2107.

Data Availability Statement

The DEEPSTORM dataset is available through the French national center for Atmospheric data and services AERIS (www.aeris-data.fr, accessed on 27 April 2023). AMSU and ATMS data are provided by the NOAA CLASS facility www.avl.class.noaa.gov/ (last access 9 March 2023).

Acknowledgments

This article was partially based upon work from COST Action CA19109 MedCyclones; European Network for Mediterranean cyclones in weather and climate, supported by COST—European Cooperation in Science and Technology (www.cost.eu, accessed on 3 May 2023). This work was also supported by the Direction Général de l’Armement (PRECIPCLOUD-SAT project). The authors express their sincere gratitude to the Reviewers for the detailed comments and suggestion during the review process and to Marcello Miglietta for the useful discussions. The authors wish to thank the World-Wide Lightning Location Network (http://wwlln.net, accessed on 10 March 2023), a collaboration among over 50 universities and institutions, for providing the lightning location data used in this paper. The authors express their sincere gratitude to Derrick Herndon and Chris Velden (CIMSS/SSEC Madison, WI, USA) for the fruitful scientific discussions and interactions during this work.

Conflicts of Interest

The authors declare no conflict of interest. The funders had no role in the design of the study; in the collection, analyses, or interpretation of data; in the writing of the manuscript; or in the decision to publish the results.

References

  1. Di Muzio, E.; Riemer, M.; Fink, A.H.; Maier-Gerber, M. Assessing the Predictability of Medicanes in ECMWF Ensemble Forecasts Using an Object-based Approach. Q. J. R. Meteorol. Soc. 2019, 145, 1202–1217. [Google Scholar] [CrossRef]
  2. Stoll, P.J. A Global Climatology of Polar Lows Investigated for Local Differences and Wind-Shear Environments. Weather Clim. Dyn. 2022, 3, 483–504. [Google Scholar] [CrossRef]
  3. Davis, C.A.; Bosart, L.F. Baroclinically Induced Tropical Cyclogenesis. Mon. Weather Rev. 2003, 131, 2730–2747. [Google Scholar] [CrossRef]
  4. Mazza, E.; Ulbrich, U.; Klein, R. The Tropical Transition of the October 1996 Medicane in the Western Mediterranean Sea: A Warm Seclusion Event. Mon. Weather Rev. 2017, 145, 2575–2595. [Google Scholar] [CrossRef]
  5. Fita, L.; Flaounas, E. Medicanes as Subtropical Cyclones: The December 2005 Case from the Perspective of Surface Pressure Tendency Diagnostics and Atmospheric Water Budget. Q. J. R. Meteorol. Soc. 2018, 144, 1028–1044. [Google Scholar] [CrossRef]
  6. Moscatello, A.; Miglietta, M.M.; Rotunno, R. Numerical Analysis of a Mediterranean “Hurricane” over Southeastern Italy. Mon. Weather Rev. 2008, 136, 4373–4397. [Google Scholar] [CrossRef]
  7. McTaggart-Cowan, R.; Galarneau, T.J.; Bosart, L.F.; Milbrandt, J.A. Development and Tropical Transition of an Alpine Lee Cyclone. Part I: Case Analysis and Evaluation of Numerical Guidance. Mon. Weather Rev. 2010, 138, 2281–2307. [Google Scholar] [CrossRef]
  8. Hatzaki, M.; Flaounas, E.; Davolio, S.; Pantillon, F.; Patlakas, P.; Raveh-Rubin, S.; Hochman, A.; Kushta, J.; Khodayar, S.; Dafis, S.; et al. MedCyclones: Working Together toward Understanding Mediterranean Cyclones. Bull. Am. Meteorol. Soc. 2023, 104, E480–E487. [Google Scholar] [CrossRef]
  9. Fita, L.; Romero, R.; Ramis, C. Intercomparison of Intense Cyclogenesis Events over the Mediterranean Basin Based on Baroclinic and Diabatic Influences. Adv. Geosci. 2006, 7, 333–342. [Google Scholar] [CrossRef]
  10. Comellas Prat, A.; Federico, S.; Torcasio, R.C.; D’Adderio, L.P.; Dietrich, S.; Panegrossi, G. Evaluation of the Sensitivity of Medicane Ianos to Model Microphysics and Initial Conditions Using Satellite Measurements. Remote Sens. 2021, 13, 4984. [Google Scholar] [CrossRef]
  11. Miglietta, M.M.; Cerrai, D.; Laviola, S.; Cattani, E.; Levizzani, V. Potential Vorticity Patterns in Mediterranean “Hurricanes”. Geophys. Res. Lett. 2017, 44, 2537–2545. [Google Scholar] [CrossRef]
  12. Emanuel An Air-Sea Interaction Theory for Tropical Cyclones. Part I: Steady-State Maintenance. J. Atmos. Sci. 1986, 43, 585–605. [CrossRef]
  13. Rotunno, R.; Emanuel, K.A. An Air–Sea Interaction Theory for Tropical Cyclones. Part II: Evolutionary Study Using a Nonhydrostatic Axisymmetric Numerical Model. J. Atmos. Sci. 1987, 44, 542–561. [Google Scholar] [CrossRef]
  14. Flaounas, E.; Gray, S.L.; Teubler, F. A Process-Based Anatomy of Mediterranean Cyclones: From Baroclinic Lows to Tropical-like Systems. Weather Clim. Dyn. 2021, 2, 255–279. [Google Scholar] [CrossRef]
  15. Flaounas, E.; Davolio, S.; Raveh-Rubin, S.; Pantillon, F.; Miglietta, M.M.; Gaertner, M.A.; Hatzaki, M.; Homar, V.; Khodayar, S.; Korres, G.; et al. Mediterranean Cyclones: Current Knowledge and Open Questions on Dynamics, Prediction, Climatology and Impacts. Weather Clim. Dyn. 2022, 3, 173–208. [Google Scholar] [CrossRef]
  16. Miglietta, M.M.; Rotunno, R. Development Mechanisms for Mediterranean Tropical-like Cyclones (Medicanes). Q. J. R. Meteorol. Soc. 2019, 145, 1444–1460. [Google Scholar] [CrossRef]
  17. Chaboureau, J.-P.; Pantillon, F.; Lambert, D.; Richard, E.; Claud, C. Tropical Transition of a Mediterranean Storm by Jet Crossing: Tropical Transition of a Mediterranean Storm by Jet Crossing. Q. J. R. Meteorol. Soc. 2012, 138, 596–611. [Google Scholar] [CrossRef]
  18. Cioni, G.; Malguzzi, P.; Buzzi, A. Thermal Structure and Dynamical Precursor of a Mediterranean Tropical-like Cyclone: Thermal Structure and Precursor of a MTLC. Q. J. R. Meteorol. Soc. 2016, 142, 1757–1766. [Google Scholar] [CrossRef]
  19. Miglietta, M.M.; Laviola, S.; Malvaldi, A.; Conte, D.; Levizzani, V.; Price, C. Analysis of Tropical-like Cyclones over the Mediterranean Sea through a Combined Modeling and Satellite Approach: TLC ANALYSIS THROUGH A COMBINED APPROACH. Geophys. Res. Lett. 2013, 40, 2400–2405. [Google Scholar] [CrossRef]
  20. Dafis, S.; Rysman, J.; Claud, C.; Flaounas, E. Remote Sensing of Deep Convection within a Tropical-like Cyclone over the Mediterranean Sea. Atmos. Sci. Lett. 2018, 19, e823. [Google Scholar] [CrossRef]
  21. Dafis, S.; Claud, C.; Kotroni, V.; Lagouvardos, K.; Rysman, J. Insights into the Convective Evolution of Mediterranean Tropical-like Cyclones. Q. J. R. Meteorol. Soc. 2020, 146, 4147–4169. [Google Scholar] [CrossRef]
  22. Claud, C.; Alhammoud, B.; Funatsu, B.M.; Chaboureau, J.-P. Mediterranean Hurricanes: Large-Scale Environment and Convective and Precipitating Areas from Satellite Microwave Observations. Nat. Hazards Earth Syst. Sci. 2010, 10, 2199–2213. [Google Scholar] [CrossRef]
  23. Marra, A.C.; Federico, S.; Montopoli, M.; Avolio, E.; Baldini, L.; Casella, D.; D’Adderio, L.P.; Dietrich, S.; Sanò, P.; Torcasio, R.C.; et al. The Precipitation Structure of the Mediterranean Tropical-Like Cyclone Numa: Analysis of GPM Observations and Numerical Weather Prediction Model Simulations. Remote Sens. 2019, 11, 1690. [Google Scholar] [CrossRef]
  24. D’Adderio, L.P.; Casella, D.; Dietrich, S.; Sanò, P.; Panegrossi, G. GPM-CO Observations of Medicane Ianos: Comparative Analysis of Precipitation Structure between Development and Mature Phase. Atmos. Res. 2022, 273, 106174. [Google Scholar] [CrossRef]
  25. Listowski, C.; Forestier, E.; Dafis, S.; Farges, T.; De Carlo, M.; Grimaldi, F.; Le Pichon, A.; Vergoz, J.; Heinrich, P.; Claud, C. Remote Monitoring of Mediterranean Hurricanes Using Infrasound. Remote Sens. 2022, 14, 6162. [Google Scholar] [CrossRef]
  26. Willis, P.T.; Hallett, J.; Black, R.A.; Hendricks, W. An Aircraft Study of Rapid Precipitation Development and Electrification in a Growing Convective Cloud. Atmos. Res. 1994, 33, 1–24. [Google Scholar] [CrossRef]
  27. Black, R.A.; Hallett, J. Electrification of the Hurricane. J. Atmos. Sci. 1999, 56, 2004–2028. [Google Scholar] [CrossRef]
  28. Price, C.; Asfur, M.; Yair, Y. Maximum Hurricane Intensity Preceded by Increase in Lightning Frequency. Nat. Geosci. 2009, 2, 329–332. [Google Scholar] [CrossRef]
  29. Brueske, K.F.; Velden, C.S. Satellite-Based Tropical Cyclone Intensity Estimation Using the NOAA-KLM Series Advanced Microwave Sounding Unit (AMSU). Mon. Weather Rev. 2003, 131, 687–697. [Google Scholar] [CrossRef]
  30. Velden, C.S.; Herndon, D. A Consensus Approach for Estimating Tropical Cyclone Intensity from Meteorological Satellites: SATCON. Weather Forecast. 2020, 35, 1645–1662. [Google Scholar] [CrossRef]
  31. Kidder, S.Q.; Goldberg, M.D.; Zehr, R.M.; DeMaria, M.; Purdom, J.F.W.; Velden, C.S.; Grody, N.C.; Kusselson, S.J. Satellite Analysis of Tropical Cyclones Using the Advanced Microwave Sounding Unit (AMSU). Bull. Am. Meteorol. Soc. 2000, 81, 1241–1259. [Google Scholar] [CrossRef]
  32. Demuth, J.L.; DeMaria, M.; Knaff, J.A.; Vonder Haar, T.H. Evaluation of Advanced Microwave Sounding Unit Tropical-Cyclone Intensity and Size Estimation Algorithms. J. Appl. Meteorol. 2004, 43, 282–296. [Google Scholar] [CrossRef]
  33. Herndon, D.; Velden, C.S. Upgrades to the UW-CIMSS AMSU-Based Tropical Cyclone Intensity Estimation Algorithm. In Proceedings of the 26th Conf. on Hurricanes and Tropical Meteorology, Miami, FL, USA, 2–7 May 2004. [Google Scholar]
  34. Zhu, T.; Weng, F. Hurricane Sandy Warm-Core Structure Observed from Advanced Technology Microwave Sounder: ATMS-DERIVED TROPICAL CYCLONE WARM CORES. Geophys. Res. Lett. 2013, 40, 3325–3330. [Google Scholar] [CrossRef]
  35. Zhang, D.-L.; Chen, H. Importance of the Upper-Level Warm Core in the Rapid Intensification of a Tropical Cyclone: RAPID INTENSIFICATION OF HURRICANE. Geophys. Res. Lett. 2012, 39, L02806. [Google Scholar] [CrossRef]
  36. Zhang, J.A.; Nolan, D.S.; Rogers, R.F.; Tallapragada, V. Evaluating the Impact of Improvements in the Boundary Layer Parameterization on Hurricane Intensity and Structure Forecasts in HWRF. Mon. Weather Rev. 2015, 143, 3136–3155. [Google Scholar] [CrossRef]
  37. Sanò, P.; Panegrossi, G.; Casella, D.; Di Paola, F.; Milani, L.; Mugnai, A.; Petracca, M.; Dietrich, S. The Passive Microwave Neural Network Precipitation Retrieval (PNPR) Algorithm for AMSU/MHS Observations: Description and Application to European Case Studies. Atmos. Meas. Tech. 2015, 8, 837–857. [Google Scholar] [CrossRef]
  38. Sanò, P.; Panegrossi, G.; Casella, D.; Marra, A.; D’Adderio, L.; Rysman, J.; Dietrich, S. The Passive Microwave Neural Network Precipitation Retrieval (PNPR) Algorithm for the CONICAL Scanning Global Microwave Imager (GMI) Radiometer. Remote Sens. 2018, 10, 1122. [Google Scholar] [CrossRef]
  39. Kummerow, C.D. Introduction to Passive Microwave Retrieval Methods. In Satellite Precipitation Measurement; Levizzani, V., Kidd, C., Kirschbaum, D.B., Kummerow, C.D., Nakamura, K., Turk, F.J., Eds.; Advances in Global Change Research; Springer International Publishing: Cham, Switzerland, 2020; Volume 67, pp. 123–140. ISBN 978-3-030-24567-2. [Google Scholar]
  40. Kidd, C.; Matsui, T.; Ringerud, S. Precipitation Retrievals from Passive Microwave Cross-Track Sensors: The Precipitation Retrieval and Profiling Scheme. Remote Sens. 2021, 13, 947. [Google Scholar] [CrossRef]
  41. Rysman, J.-F.; Claud, C.; Dafis, S. Global Monitoring of Deep Convection Using Passive Microwave Observations. Atmos. Res. 2021, 247, 105244. [Google Scholar] [CrossRef]
  42. Carrió, D.S.; Homar, V.; Jansa, A.; Romero, R.; Picornell, M.A. Tropicalization Process of the 7 November 2014 Mediterranean Cyclone: Numerical Sensitivity Study. Atmos. Res. 2017, 197, 300–312. [Google Scholar] [CrossRef]
  43. Kouroutzoglou, J.; Samos, I.; Flocas, H.A.; Hatzaki, M.; Lamaris, C.; Mamara, A.; Emmannouil, A. Analysis of the Transition of an Explosive Cyclone to a Mediterranean Tropical-like Cyclone. Atmosphere 2021, 12, 1438. [Google Scholar] [CrossRef]
  44. Lagouvardos, K.; Karagiannidis, A.; Dafis, S.; Kalimeris, A.; Kotroni, V. Ianos—A Hurricane in the Mediterranean. Bull. Am. Meteorol. Soc. 2022, 103, E1621–E1636. [Google Scholar] [CrossRef]
  45. Lagasio, M.; Fagugli, G.; Ferraris, L.; Fiori, E.; Gabellani, S.; Masi, R.; Mazzarella, V.; Milelli, M.; Parodi, A.; Pignone, F.; et al. A Complete Meteo/Hydro/Hydraulic Chain Application to Support Early Warning and Monitoring Systems: The Apollo Medicane Use Case. Remote Sens. 2022, 14, 6348. [Google Scholar] [CrossRef]
  46. Borzì, A.M.; Minio, V.; Cannavò, F.; Cavallaro, A.; D’Amico, S.; Gauci, A.; De Plaen, R.; Lecocq, T.; Nardone, G.; Orasi, A.; et al. Monitoring Extreme Meteo-Marine Events in the Mediterranean Area Using the Microseism (Medicane Apollo Case Study). Sci. Rep. 2022, 12, 21363. [Google Scholar] [CrossRef] [PubMed]
  47. Staelin, D.H.; Chen, F.W. Precipitation Observations near 54 and 183 GHz Using the NOAA-15 Satellite. IEEE Trans. Geosci. Remote Sens. 2000, 38, 2322–2332. [Google Scholar] [CrossRef]
  48. Funatsu, B.M.; Claud, C.; Chaboureau, J.-P. Potential of Advanced Microwave Sounding Unit to Identify Precipitating Systems and Associated Upper-Level Features in the Mediterranean Region: Case Studies. J. Geophys. Res. 2007, 112. [Google Scholar] [CrossRef]
  49. Dowden, R.; Holzworth, R.; Rodger, C.; Lichtenberger, J.; Thomson, N.; Jacobson, A.; Lay, E.; Brundell, J.; Lyons, T.; O’Keefe, S.; et al. World-Wide Lightning Location Using VLF Propagation in the Earth-Ionosphere Waveguide. IEEE Antennas Propag. Mag. 2008, 50, 40–60. [Google Scholar] [CrossRef]
  50. Rodger, C.J.; Brundell, J.B.; Dowden, R.L. Location Accuracy of VLF World-Wide Lightning Location (WWLL) Network: Post-Algorithm Upgrade. Ann. Geophys. 2005, 23, 277–290. [Google Scholar] [CrossRef]
  51. Thomas, J.N.; Solorzano, N.N.; Cummer, S.A.; Holzworth, R.H. Polarity and Energetics of Inner Core Lightning in Three Intense North Atlantic Hurricanes: HURRICANE INNER CORE LIGHTNING. J. Geophys. Res. 2010, 115. [Google Scholar] [CrossRef]
  52. Solorzano, N.N.; Thomas, J.N.; Holzworth, R.H. Global Studies of Tropical Cyclones Using the World Wide Lightning Location Network; USGS: Denver, CO, USA, 2008. [Google Scholar]
  53. Hutchins, M.L.; Holzworth, R.H.; Brundell, J.B.; Rodger, C.J. Relative Detection Efficiency of the World Wide Lightning Location Network: RELATIVE DETECTION EFFICIENCY OF WWLLN. Radio Sci. 2012, 47. [Google Scholar] [CrossRef]
  54. Bürgesser, R.E. Assessment of the World Wide Lightning Location Network (WWLLN) Detection Efficiency by Comparison to the Lightning Imaging Sensor (LIS): WWLLN Detection Efficiency Relative to LIS. Q. J. R. Meteorol. Soc. 2017, 143, 2809–2817. [Google Scholar] [CrossRef]
  55. Wacker, R.S. Correcting for Precipitation Effects in Satellite- Based Passive Microwave Tropical Cyclone Intensity Estimates. Ph.D. Dissertation, University of Wisconsin, Madison, WI, ISA, 2005. [Google Scholar]
  56. Hersbach, H.; Bell, B.; Berrisford, P.; Hirahara, S.; Horányi, A.; Muñoz-Sabater, J.; Nicolas, J.; Peubey, C.; Radu, R.; Schepers, D.; et al. The ERA5 Global Reanalysis. Q. J. R. Meteorol. Soc. 2020, 146, 1999–2049. [Google Scholar] [CrossRef]
  57. Hong, G. Detection of Tropical Deep Convective Clouds from AMSU-B Water Vapor Channels Measurements. J. Geophys. Res. 2005, 110. [Google Scholar] [CrossRef]
  58. Funatsu, B.M.; Claud, C.; Chaboureau, J.-P. Comparison between the Large-Scale Environments of Moderate and Intense Precipitating Systems in the Mediterranean Region. Mon. Weather Rev. 2009, 137, 3933–3959. [Google Scholar] [CrossRef]
  59. Rysman, J.-F.; Claud, C.; Dafis, S. A Machine Learning Algorithm for Retrieving Cloud Top Height With Passive Microwave Radiometry. IEEE Geosci. Remote Sens. Lett. 2022, 19, 4500605. [Google Scholar] [CrossRef]
  60. Flaounas, E.; Kotroni, V.; Lagouvardos, K.; Gray, S.L.; Rysman, J.-F.; Claud, C. Heavy Rainfall in Mediterranean Cyclones. Part I: Contribution of Deep Convection and Warm Conveyor Belt. Clim. Dyn. 2018, 50, 2935–2949. [Google Scholar] [CrossRef]
  61. Tsukada, T.; Horinouchi, T. Strong Relationship between Eye Radius and Radius of Maximum Wind of Tropical Cyclones. Mon. Weather Rev. 2023, 151, 569–588. [Google Scholar] [CrossRef]
  62. Breiman, L. Random Forests. Mach. Learn. 2001, 45, 5–32. [Google Scholar] [CrossRef]
  63. Zhang, Y.; Wu, K.; Zhang, J.; Zhang, F.; Xiao, H.; Wang, F.; Zhou, J.; Song, Y.; Peng, L. Estimating Rainfall with Multi-Resource Data over East Asia Based on Machine Learning. Remote Sens. 2021, 13, 3332. [Google Scholar] [CrossRef]
  64. Yang, L.; Fei, J.; Huang, X.; Cheng, X.; Yang, X.; Ding, J.; Shi, W. Asymmetric Distribution of Convection in Tropical Cyclones over the Western North Pacific Ocean. Adv. Atmos. Sci. 2016, 33, 1306–1321. [Google Scholar] [CrossRef]
  65. Rogers, R.; Reasor, P.; Lorsolo, S. Airborne Doppler Observations of the Inner-Core Structural Differences between Intensifying and Steady-State Tropical Cyclones. Mon. Weather Rev. 2013, 141, 2970–2991. [Google Scholar] [CrossRef]
  66. Portmann, R.; González-Alemán, J.J.; Sprenger, M.; Wernli, H. How an Uncertain Short-Wave Perturbation on the North Atlantic Wave Guide Affects the Forecast of an Intense Mediterranean Cyclone (Medicane Zorbas). Weather Clim. Dyn. 2020, 1, 597–615. [Google Scholar] [CrossRef]
  67. Panegrossi, G.; Casella, D.; Dietrich, S.; Marra, A.C.; Sano, P.; Mugnai, A.; Baldini, L.; Roberto, N.; Adirosi, E.; Cremonini, R.; et al. Use of the GPM Constellation for Monitoring Heavy Precipitation Events Over the Mediterranean Region. IEEE J. Sel. Top. Appl. Earth Obs. Remote Sens. 2016, 9, 2733–2753. [Google Scholar] [CrossRef]
  68. Panegrossi, G.; Marra, A.C.; Sanò, P.; Baldini, L.; Casella, D.; Porcù, F. Heavy Precipitation Systems in the Mediterranean Area: The Role of GPM. In Satellite Precipitation Measurement; Levizzani, V., Kidd, C., Kirschbaum, D.B., Kummerow, C.D., Nakamura, K., Turk, F.J., Eds.; Advances in Global Change Research; Springer International Publishing: Cham, Switzerland, 2020; Volume 69, pp. 819–841. ISBN 978-3-030-35797-9. [Google Scholar]
Figure 4. ATMS limb-corrected TB anomaly for channels 7 (a), 8 (b), 9 (c) with scattering correction, for the overpass on 17 September 2020 at 00:18 UTC. The black x indicates the position of ERA5 minimum MSLP, while the black circle indicates the 100 km radius circle around the WC center position (small black circle).
Remotesensing 15 02838 g004
Figure 5. From top to the bottom, first row: AMSU limb-corrected TB anomaly for channels 6 (54.4 GHz, left column), 7 (54.94 GHz, middle column), and 8 (55.5 GHz, right column) with scattering correction, for the overpass on 7 November 2014 at 19:55 UTC during Medicane Qendresa; second row: ATMS limb-corrected TB anomaly for channels 7 (54.4 GHz, left column), 8 (54.94 GHz, middle column), and 9 (55.5 GHz, right column) with scattering correction, for the overpass on 31 October 2016 at 00:38 UTC during Medicane Trixie; third row: AMSU limb-corrected TB anomaly for channels 6 (54.4 GHz, left column), 7 (54.94 GHz, middle column), and 8 (55.5 GHz, right column) with scattering correction, for the overpass on 18 November 2017 at 02:38 UTC during Medicane Numa; fourth row: AMSU limb-corrected TB anomaly for channels 6 (54.4 GHz, left column), 7 (54.94 GHz, middle column), and 8 (55.5 GHz, right column) with scattering correction, for the overpass on 28 September 2018 at 08:29 UTC during Medicane Zorbas; fifth row: ATMS limb-corrected TB anomaly for channels 7 (54.4 GHz, left column), 8 (54.94 GHz, middle column), and 9 (55.5 GHz, right column) with scattering correction, for the overpass on 29 October 2021 at 12:00 UTC during Medicane Apollo. The black x indicates the position of ERA5 minimum MSLP, while the black circle indicates the 100 km radius circle around the WC center position (small black circle).
Remotesensing 15 02838 g005
Figure 7. Composite position of ice clouds (IWP > 1 kg m−2) around the cyclone center defined by the position of the maximum TB anomaly separated between DC (right panels of each pair) and no-DC (left panels of each pair) pixels; the color of each dot provided in the colorbar corresponds to the value of the IWP estimated by the DEEPSTORM algorithm. The 100 km radius circle is also shown as reference.
Remotesensing 15 02838 g007
Figure 8. Variable importance for every variable significantly related to WC occurrence (top) and WC type (either shallow or deep) (bottom).
Remotesensing 15 02838 g008
Figure 9. Limb-corrected TBs for 55.5 GHz frequency channel (ATMS Ch. 9 (a) and AMSU-A Ch. 8 (b), respectively) relative to the Ianos overpasses on 17 September 2020 shown in Figure 4, at 00:18 UTC, and Figure 3, at 08:35 UTC, respectively. Note that Ch. 8/9 have weighting functions peaking around 200 hPa. The black x indicates the position of ERA5 minimum MSLP, while the black circle indicates the WC center position.
Remotesensing 15 02838 g009
Table 1. Synopsis of the six Medicanes considered in the study: Start and end date considered for the analysis of the satellite overpasses used in this study, Region (IS = Ionian Sea, SM = Southern Mediterranean, EM = Eastern Mediterranean), minimum MSLP (hPa) reached in the life cycle of the cyclone, and Group (as defined in [16]—see text for details).
Start Date (0000 UTC)End Date (23:59 UTC)RegionMinimum MSLP (hPa)GroupReferences
Qendresa06/11/1408/11/14SM986B[21,42]
Trixie28/10/1631/10/16SM EM1005B[1,21]
Numa16/11/1718/11/17SM IS1002B[21,23]
Zorbas27/09/1829/09/18SM IS997.6A[21,43]
Ianos16/09/2018/09/20IS984.3A[10,24,44]
Apollo28/10/2130/10/21SM999B[45,46]
Table 2. Analysis of the overpasses with warm cores: approximate maximum duration of warm cores (time interval between the first and the last overpass showing a well-defined WC), minimum, maximum, and mean of the maximum TB anomaly at WC center, number of overpasses for the different warm-core types; number of overpasses with strokes and number of strokes (within 100 km from the center); number of overpasses with deep convection and deep convection area (within 100 km); and minimum, maximum, and mean distance of the WC center from the ERA5 minimum MSLP (in km).
Dates and Max Duration (h) of Warm Cores Min/Mean/Max
WC Center maximumTB Anomaly at 54.4 GHz (K)
Number of Overpasses with Warm CoresNumber of Overpasses with Strokes within 100 km Radius (Number of Strokes)Number of Overpasses with DC within 100 km Radius (Percentage of DC Area)Min/Mean/Max Distance of WC Center from ERA5 Minimum MSLP (km)
ShallowDeep ShallowDeep ShallowDeep
Qendresa
(2014)
7/11
(9 h)
0.97/1.12/1.24413 (9)--1 (7.8)35.3/39.7/48.1
Trixie
(2016)
28–31/10
(2 h)
0.69/0.89/1.084 02 (16)-3 (8.2)-11.1/23.6/42.3
Numa
(2017)
17–18/11
(21 h)
0.39/0.63/0.82902 (3)-6 (6.8)-8.4/32.8/49.6
Zorbas
(2018)
28–29/09
(36 h)
0.57/1.03/1.403 83 (63)5 (18)3 (12.8)5 (9.0)12.8/46.3/62.1
Ianos
(2020)
16–18/09
(41 h)
1.03/1.41/2.077101 (1)4 (8)6 (12.6)4 (15.0)4.8/28.9/55.8
Apollo
(2021)
28–30/10
(21 h)
0.73/1.04/1.6490--4 (1.9)-11.8/23.0/47.1
Disclaimer/Publisher’s Note: The statements, opinions and data contained in all publications are solely those of the individual author(s) and contributor(s) and not of MDPI and/or the editor(s). MDPI and/or the editor(s) disclaim responsibility for any injury to people or property resulting from any ideas, methods, instructions or products referred to in the content.

