1. Introduction
The demand for human–computer interaction that provides great convenience to people’s lives is increasing with the development of information technology. Human behavior recognition research has gradually attracted attention, and indoor positioning methods based on RSSI signal processing are commonly used with low accuracy and availability. Indoor localization has gained wider attention for its convenience of providing locations for all kinds of location-based services. The demand for indoor positioning is imperative, for example, in supermarkets, airports, and nursing homes.
The Global Navigation Satellite System (GNSS) is the cornerstone for accurate location tracking and navigation in Location Based Services (LBS) [
1]. However, it is not typically available indoors because of signal fading in indoor conditions. The complexity and multilateral nature of the indoor environment limit the positioning accuracy due to several factors, such as multipath propagation and circuit delay. Numerous positioning technologies have been proposed and implemented, including Acoustic [
2], Bluetooth [
3], Wireless Fidelity (Wi-Fi) [
4,
5,
6], Ultra-wideband (UWB) [
7,
8], Visual [
9], geomagnetic field [
10,
11], and so on. Kalman Filter algorithms and Unscented Kalman Filter (UKF) improve localization accuracy for multi-sensor fusion [
12,
13,
14]. However, these methods generally require mobile phone devices or other wearable equipment, which would restrict their applications. As a result, device-free [
14] position techniques such as Wi-Fi Channel State Information (CSI) based passive position have attracted considerable attention. The CSI reveals a collection of fine-grained channel measurements describing the phase and amplitude of each subcarrier. The Wi-Fi CSI approach also outperforms other device-free positioning methods, such as Camera [
9] and Millimeter Wave (MMW) [
15], as it ensures user privacy and cost effectiveness. In recent years, privacy has become a major concern, given the rise of ubiquitous computing and mobile devices equipped with positioning systems. Wi-Fi position protects user privacy more effectively than passive Camera positioning. Furthermore, because the propagation distance of Millimeter Wave is limited due to its short wavelength, multiple devices must be deployed in passive positioning. Several Wi-Fi devices, such as routers, are a ubiquitous part of everyday life. Positioning based on Wi-Fi position costs less than MMW and can be more widely applied.
Non-line-of-sight (NLOS) and line-of-sight (LOS) phenomena greatly influence the accuracy of device-free positioning. In general, device-free localization using CSI can be divided into two categories: model-based [
16,
17,
18,
19,
20] and fingerprint-based [
21,
22,
23,
24,
25,
26,
27,
28,
29,
30,
31,
32,
33,
34,
35]. In model-based localization, Wu first designed a system leveraging CSI on commercial 802.11 n Wi-Fi and calculated locations based on trilateration [
36]. In LIFS [
37], Wang proposed an exact power fading model to obtain the indoor position under LOS condition. This system achieved an average error of 0.5 and 1.1 m in two scenes, respectively, but the error is larger in the case of NLOS. A dynamic-MUSIC algorithm [
38] was proposed to extract the target angle of arrival (AOA) from subtle reflection signals generated by the human body. However, the precision of this positioning method depends on the accuracy of the phase. Widar [
39] identified path length change rate components related to human movements and then achieved a user’s position and velocities. However, the accuracy of this study is greatly affected by the NLOS condition. Furthermore, the fingerprint position approach could be divided into three categories: K-nearest neighbor (KNN), Bayes, and neural network (NN) [
4,
24,
40,
41,
42]. Due to multipath signal effects, signal propagation is rather complex. It is hard to obtain a precise channel model. Hence, fingerprint-based approaches have gained critical attention [
43]. The fingerprint positioning method does not need to acknowledge the specific coordinates of the router. The approach of fingerprinting treats position as a classification problem, while determining the indoor position is actually a constant problem and can be addressed using regression techniques. However, the presence of noise in fingerprint data can lead to mismatching. The received energy decreases when a pedestrian is close to the router and blocks the CSI LOS signal. Currently, the signal is similar to the signal in the LOS condition.
The current challenges faced by the device-free positioning system include: (1) the existence of NLOS and LOS, which affects the accuracy of positioning due to signal reduction and abnormalities; and (2) device-free fingerprint mismatching under NLOS and LOS conditions. Therefore, there is an urgent need to improve positioning accuracy while ensuring robustness.
We propose a multi-pattern-based NLOS detection and fingerprint algorithm that can adapt to both LOS and NLOS conditions for passive indoor pedestrian positioning. In both the LOS and NLOS cases, the indoor positioning accuracy improved, thus enabling precise device-free positioning in two indoor scenarios. In summary, the main contributions to the literature are as follows:
We analyzed the signal propagation under the NLOS and LOS conditions and found that the device-free position error is different under NLOS and LOS conditions.
A new algorithm called SVM-NB (Support Vector Machine-Naive Bayes) was proposed, which combined the NLOS/LOS SVM detection and the Naive Bayes fingerprint system model. This approach effectively narrowed the search area and obtained accurate match results in the online localization stage. Compared to DeepFi, KNN, and Bayes methods, the high NLOS recognition rate of the SVM-NB algorithm determined the matching area more accurately.
We designed a Support Vector Machine model to detect the NLOS condition based on CSI amplitude. Our proposed NLOS detection method is more accurate than the Rician-K and Skewness NLOS detection methods.
The structure of the rest of this paper is as follows:
Section 2 discusses related works.
Section 3 introduces our proposed fusion of NLOS detection and Bayes fingerprint. In
Section 4, we present our experiments and analyze the results.
Section 5 summarizes our conclusions.
2. Related Work
Our work is closely related to prior studies on NLOS detection and indoor fingerprinting localization. NLOS propagation is a phenomenon that occurs when a signal is transmitted through multiple objects, resulting in degraded signal quality. Multipath fading is a leading cause of position error. Therefore, NLOS has led to the problem of position accuracy decline in the indoor environment. Some scholars have focused on detecting NLOS because NLOS greatly influences indoor positioning. NLOS identification and mitigation can contribute greatly to indoor localization, as NLOS constitutes the major challenge for Wi-Fi indoor ranging-based localization technologies. To our best knowledge, the earliest NLOS research appeared in the context of a UWB ranging system. The most helpful approach is distinguishing the NLOS/LOS using signal characteristics. SVM, NN, and Multilayer Perception (MLP) are employed to classify the NLOS/LOS signals. For example, Xu [
44] identified LOS signals by using Wi-Fi RTT data with an accuracy of 98%. If RSSI is too high or too low in a particular environment, this phenomenon is likely instructed under the LOS or NLOS condition [
45]. Zhuo [
46] utilized a machine learning technique to classify RSS NLOS signals. RSSI is an upper physical level that could not describe the multipath effect precisely. CSI provides a more detailed signal assessment than RSSI. The CSI can be obtained from an Orthogonal Frequency Division Multiplexing (OFDM) receiver to extract the channel response in the 802.11 a/g/n standard. Partially extracted, CSI reveals a collection of channel measurements describing the amplitudes and phases of each subcarrier. CSI can extract CSI information from 5300 [
47] and Atheros 9580 [
48]. Many scholars have used single or multiple parameters such as peak value, signal-to-noise ratio, and mean root square to identify NLOS information. In particular, Wu [
49] proposed PhaseU for Wi-Fi CSI LOS identification based on the Rician-K factor. This research concentrated on channel characteristics, especially in static settings, and attained a LOS detection accuracy of 93.09%. AmpN [
50] employed the K-Mean approach for the dynamic scenario and the BP NN algorithm for the static scenario. Under static conditions, it obtained overall LOS and NLOS detection rates of 94.2% and 97.6%, respectively. As a downside, these techniques rely on an exact, suitable identification threshold technique. Thus, model-based judging procedures were the main techniques chosen, which likewise lacked stability.
One of the most popular approaches for device-free placement is the fingerprint method. Horus [
51] employed a probabilistic technique for estimating location. Their algorithms established a quantitative relationship between indoor location and radio map. Nevertheless, it can be challenging to determine the complex relationship between indoor space coordinates precisely and received radio signals in large indoor spaces. Many of the subcarriers’ rich channel amplitude and phase information were underutilized. As a result, Wi-Fi indoor positioning technology relying on RSS values could produce subpar positioning results.
A probabilistic algorithm named Pilot was proposed [
52] to match the amplitude to the fingerprint database in the laboratory and hall with an error of less than 2 m. In another example, Song et al. [
28] proposed the KNN algorithm and the Euclidean distance for location estimation. More so, the FIFS [
53] system used weighted average CSI values on multiple antennas to improve the performance of RSS-based indoor fingerprinting methods. Meanwhile, deep learning offers a new model for fingerprinting. DeepFi [
21] was the first to generate fingerprints with a deep auto-encoder using CSI amplitudes. SWIM [
54] was investigated to learn from predictive fingerprint variations to environmental speed changes and reconstruct the original fingerprint to fit the speed scenario, such as the Mobile Ship Environment. FreeTrack [
55] was used to exploit deep neural networks (DNN) and particle filtering (PF) to enhance the device-free position. Particle filtering and pre-classification methods have been applied to passive positioning, and results show significant improvements. Yu et al. [
56] utilized quadratic discriminant analysis to classify databases and match locations. However, this system is sensitive to fingerprint classification results. Duan et al. [
29] proposed dynamic nearest neighbors to match the fingerprint database for indoor position. The CSI MIMO [
57] system combined the amplitude and phase information of CSI from each subcarrier for fingerprint identification, but the phase information was not calibrated.
From different perspectives, the abovementioned research teams have triggered the research trend of indoor human perception and positioning. Based on this information, we use the CSI signal to propose a method to achieve high-precision and high-robust positioning in a complex indoor environment. We propose a machine learning framework that leverages SVM and a Naive Bayes data fusion scheme to analyze signal propagation in both NLOS and LOS conditions, aiming to solve the problem. Our framework exploits NLOS detection to categorize data into NLOS and LOS. This allows us to utilize corresponding NLOS and LOS database classifiers to improve search accuracy during online localization, enhancing the performance and robustness of the device-free positioning system.
3. Method
This section introduces the principle of device-free positioning. It also describes our proposed system, including NLOS detection and fingerprint position method.
3.1. Principle of Device-Free Positioning
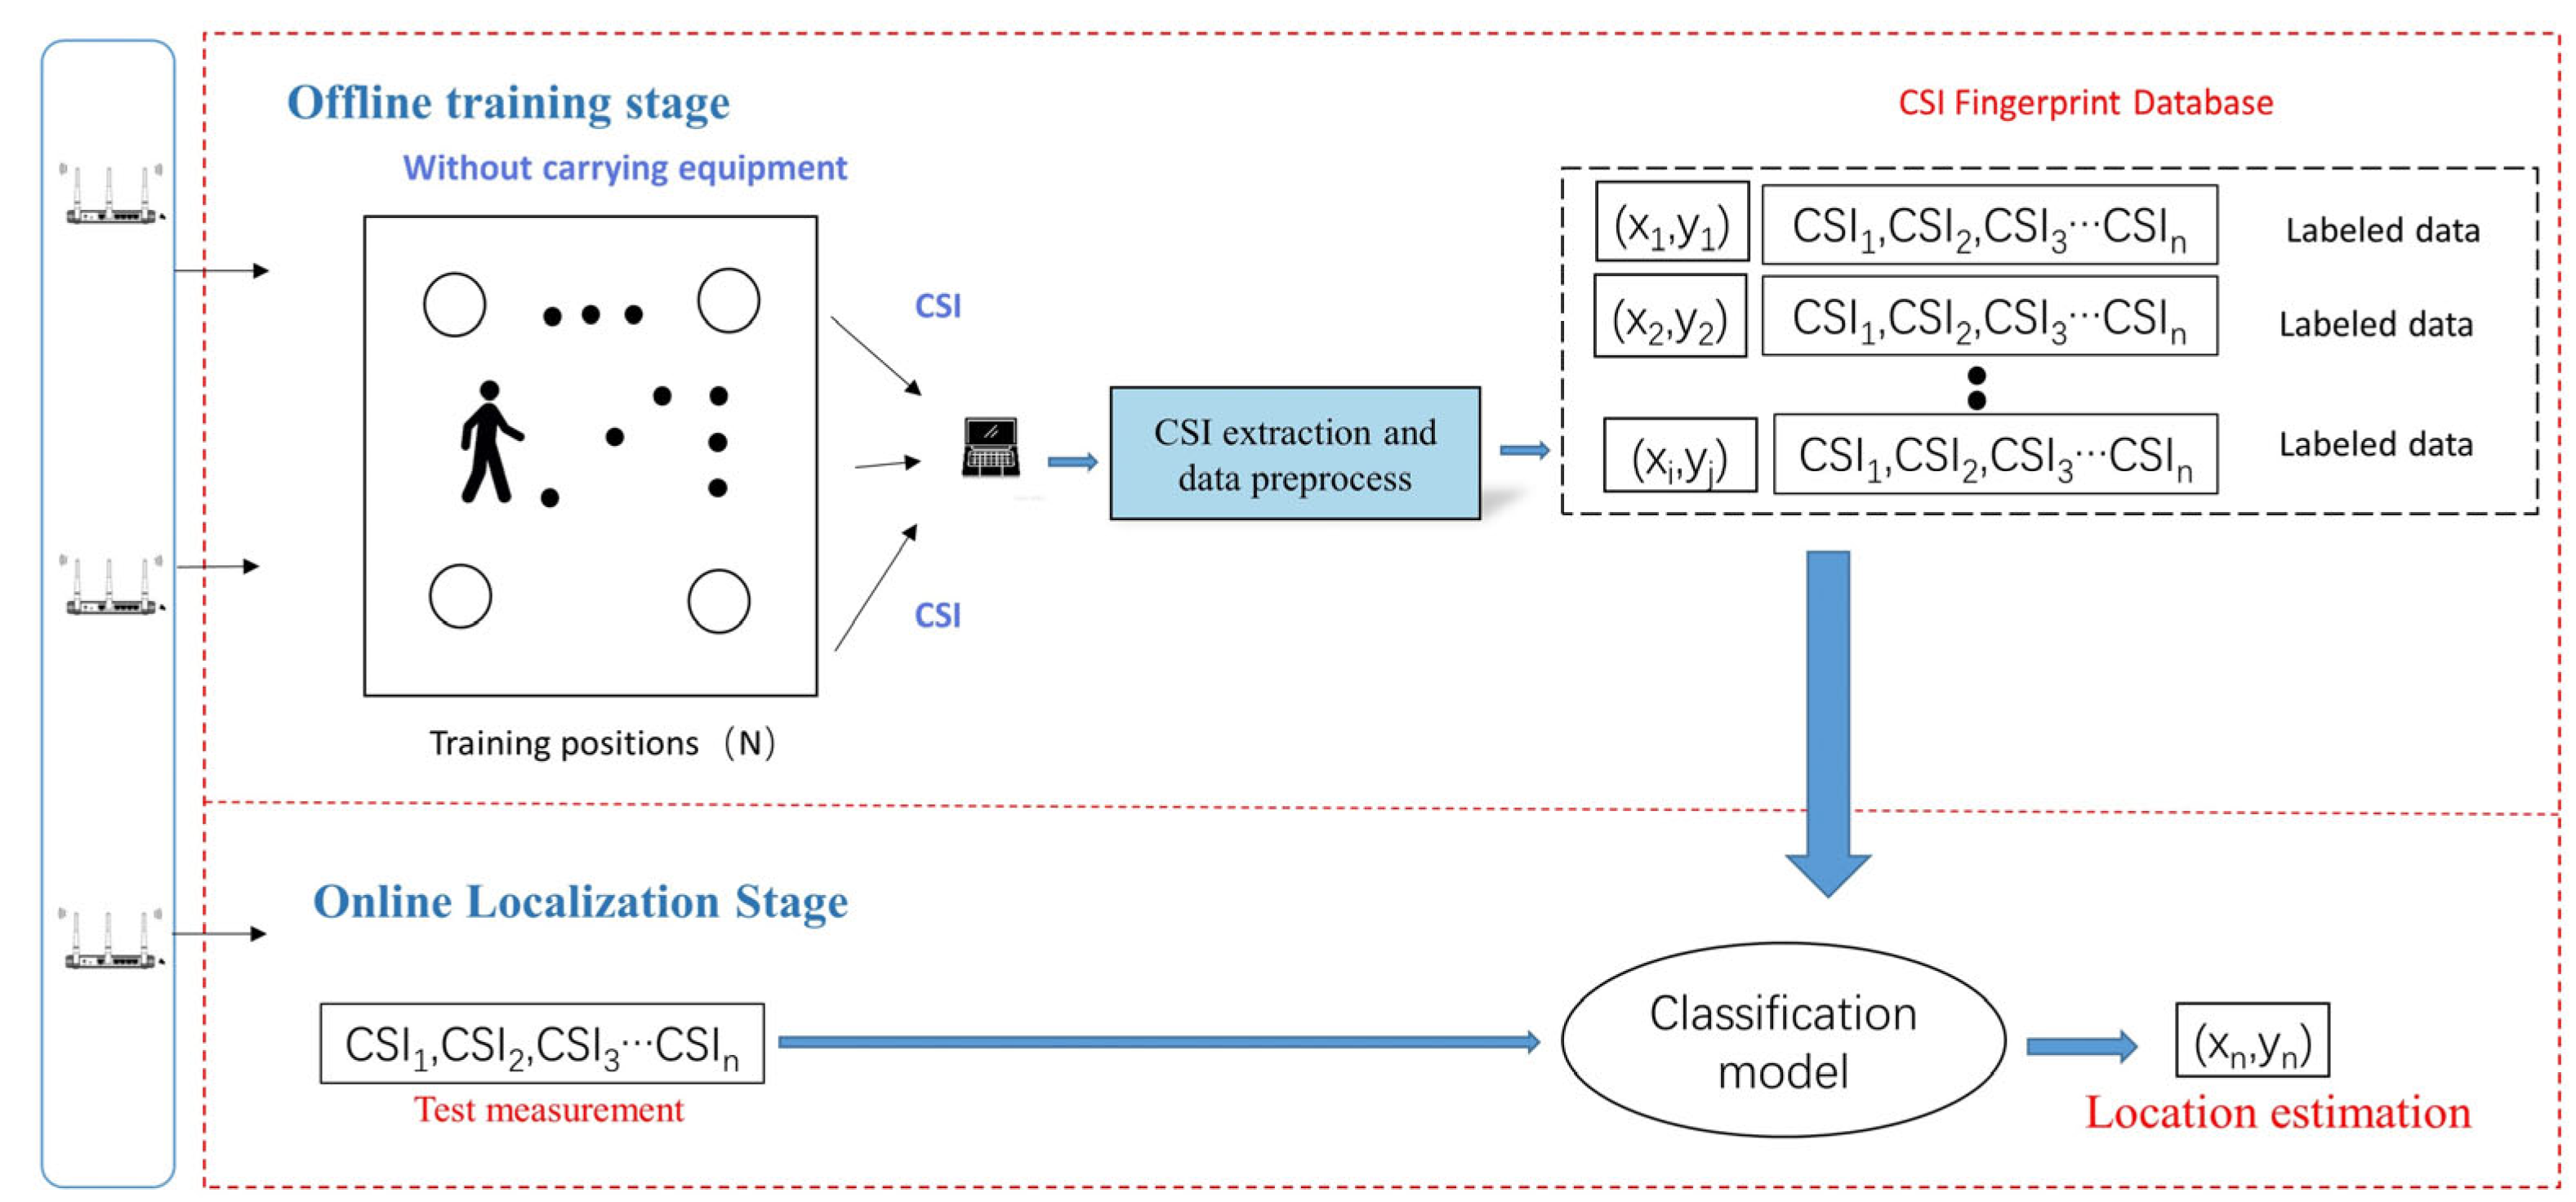
We present an overview of the device-free CSI fingerprint positioning system in
Figure 1. The method of positioning is known as device-free positioning because it can calculate the pedestrian location, and the pedestrian does not need to carry any device. The base principle is that when an object is present where wireless positioning is being performed in the area, the propagation of wireless signals can be affected through diffraction, refraction, and other phenomena. The wireless signals at different locations provide a means of estimating the object’s location. This allows us to place the transmitter and receiver of the Wi-Fi at a fixed location in the room and use it to capture the location of pedestrians in the room. The movement of the pedestrian brings about a difference in signal. CSI fingerprints are collected from various locations to achieve the scenario mentioned above by creating a database, which can be used to match real-time CSI fingerprints and estimate the location of the target. Thus, we can calculate the orientation of the pedestrian without the need to carry a device.
The amplitudes and phases of a subcarrier:
where
is the CSI at the subcarrier with central frequency
, and
denotes its amplitude.
denotes its phase.
The free space model shows that the received power by a receiver antenna separated from a radiating transmitter antenna is given by the Friis free space equation [
31]. P
t is the transmitted power,
Gt is the transmitter antenna gain,
λ is the wavelength in meters, and d is the distance from the transmitter to the receiver.
The components of x could include phase and amplitude. In this paper, we use amplitudes to represent the characteristics of CSI X. I represent number of subcarriers. During the offline phase, the equation for collecting Wi-Fi device signals x from a series of locations is expressed as follows:
The main Bayesian probability algorithm can be expressed as follows:
represent the probability that the test point is the reference point x when the CSI measurement is l. At the same time, random tree, KNN, and CNN can also be used for training and matching. These algorithms established a mathematical correlation between CSI signals and indoor location.
3.2. Overview of the Proposed Method
The signals in LOS and NLOS conditions are prone to mismatch. The signal attenuation and variation in the LOS condition are small even though people are far from the transmitter. However, people obscure the direct transmission path in the NLOS condition, and most of the received path is scattered at this point. Hence, the signal attenuation and variation are larger than in the LOS condition. Thus, NLOS and LOS have different positioning errors. We present an overview of the proposed device-free CSI fingerprint positioning system in
Figure 2.
Unlike the traditional methods, our method collects the CSI of each point and records NLOS and LOS conditions. We train to obtain an NLOS classifier based on training the CSI database under NLOS and LOS conditions. We can narrow the search area and obtain more accurate match results on the online localization stage by using NLOS detection.
Step 1: Pre-processing method is proposed to extract subcarriers from CSI measures and remove noises. The training data at every reference point are divided into NLOS and LOS conditions. The SVM algorithm trains the NLOS classification model. We construct the radio maps of NLOS and LOS at the reference point and build Bayesian probability models for NLOS and LOS conditions.
Step 2: In the online phase, the CSI data are pre-processed, and the NLOS and LOS judgments are made using the SVM algorithm. The results of these two matching algorithms are based on NLOS detection results. Therefore, NLOS detection is a cornerstone before the device-free positioning matching stage. Then, Naive Bayes fingerprint matching is performed using the corresponding NLOS and LOS fingerprint database. The results are obtained. Then, the mean is weighted to obtain the final localization results.
3.3. Signal Propagation
Radiofrequency propagation modes include absorption, reflection, scattering, refraction, diffraction, free space path loss, multipath phenomenon, attenuation, and gain. Given the scenario that the signal transmission paths deflected off the walls are ignored, the signal paths that bounce off the wall are not taken into account, and the power received by the receiver via the Wi-Fi transmission paths through the ceiling and ground can be represented as follows:
Figure 3 shows the observation of persons in various phases in the experimental setting. At the subsequent stage, information about the indoor person connecting the transmitter and receiver is gathered and trained into a detection model. At each location in the room, statistics are collected randomly in the third stage. The CSI in the room causes refraction and diffraction, which causes the received data under the physical model to deviate. As a result, different placements can indicate mixed results.
h1 and h2 denote the vertical distances from the transmitter-receiver link to the ceiling and floor, respectively. Pt denotes the transmitted power, Gt represents the transmitter antenna gain, λ is the wavelength measured in meters, and d refers to the distance from the transmitter to the receiver.
The presence of the target in this stationary setting results in numerous signal transmission paths that are disrupted with the human body. In line with the radar equation, the target’s impact on the received power is calculated as follows:
where
is the distance from the transmitter to the target, and
is the distance from the receiver to the target in the horizontal plane.
represents the height of the scattered points, and
is the height of the target people.
ELOS,
Eceil,
Efloor, Ewall, and
Esca represent the intensity magnitudes of
LOS, ceiling, floor, wall, and scattered signal transmission paths, respectively. The total
LOS condition received power
by the receiver can be calculated as follows:
ELOSblocked and
Epeople-sca represent the intensity magnitudes of signals through the body and people scattered. The total NLOS condition received power
by the receiver can be calculated as follows:
The NLOS condition occurs when the person is in the middle of the receiver, and the transmitter blocks the LOS sign. The cases of LOS condition and NLOS condition are illustrated in
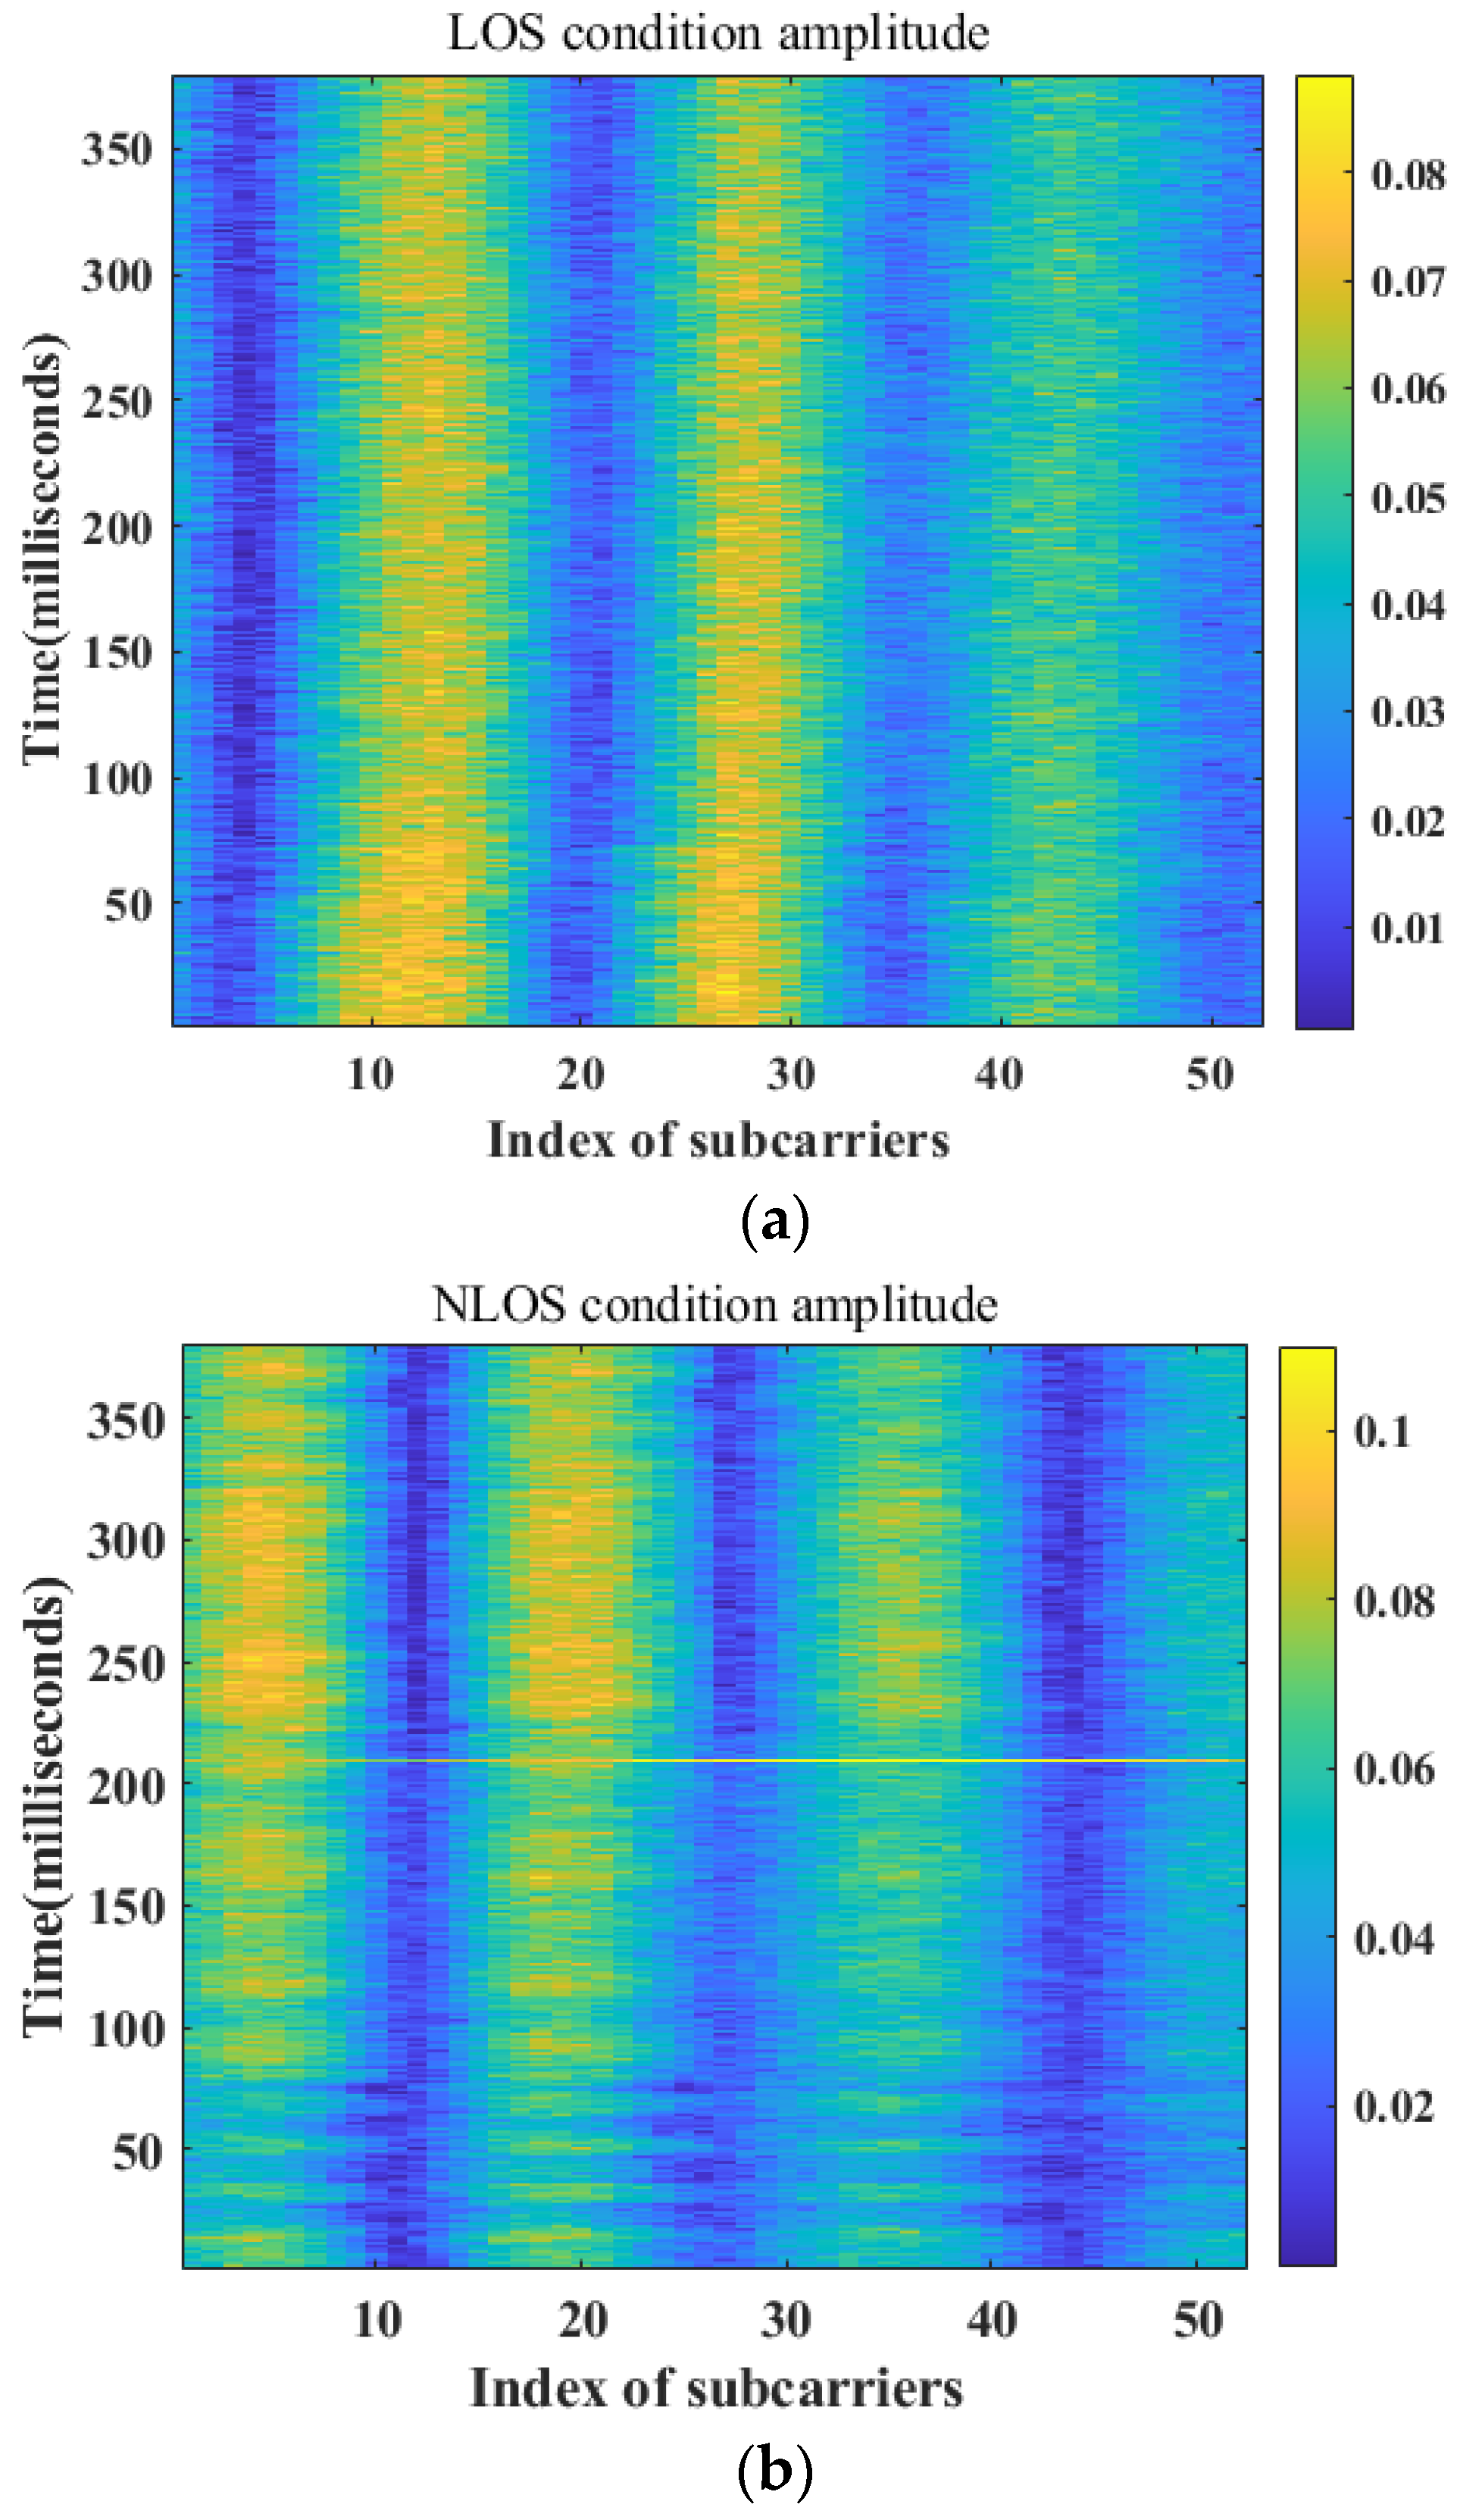
Figure 4. By contrast, the LOS condition occurs when the person is not between the receiver and the transmitter. The LOS condition amplitude tends to remain consistent. The amplitude can reflect the signal strength. The NLOS and LOS amplitudes are shown in
Figure 5. The scattering of the signal across the human body under NLOS and LOS conditions may be different. The amplitude in the LOS condition is stronger than that in the NLOS condition.
3.4. CSI NLOS and LOS Database Establishment
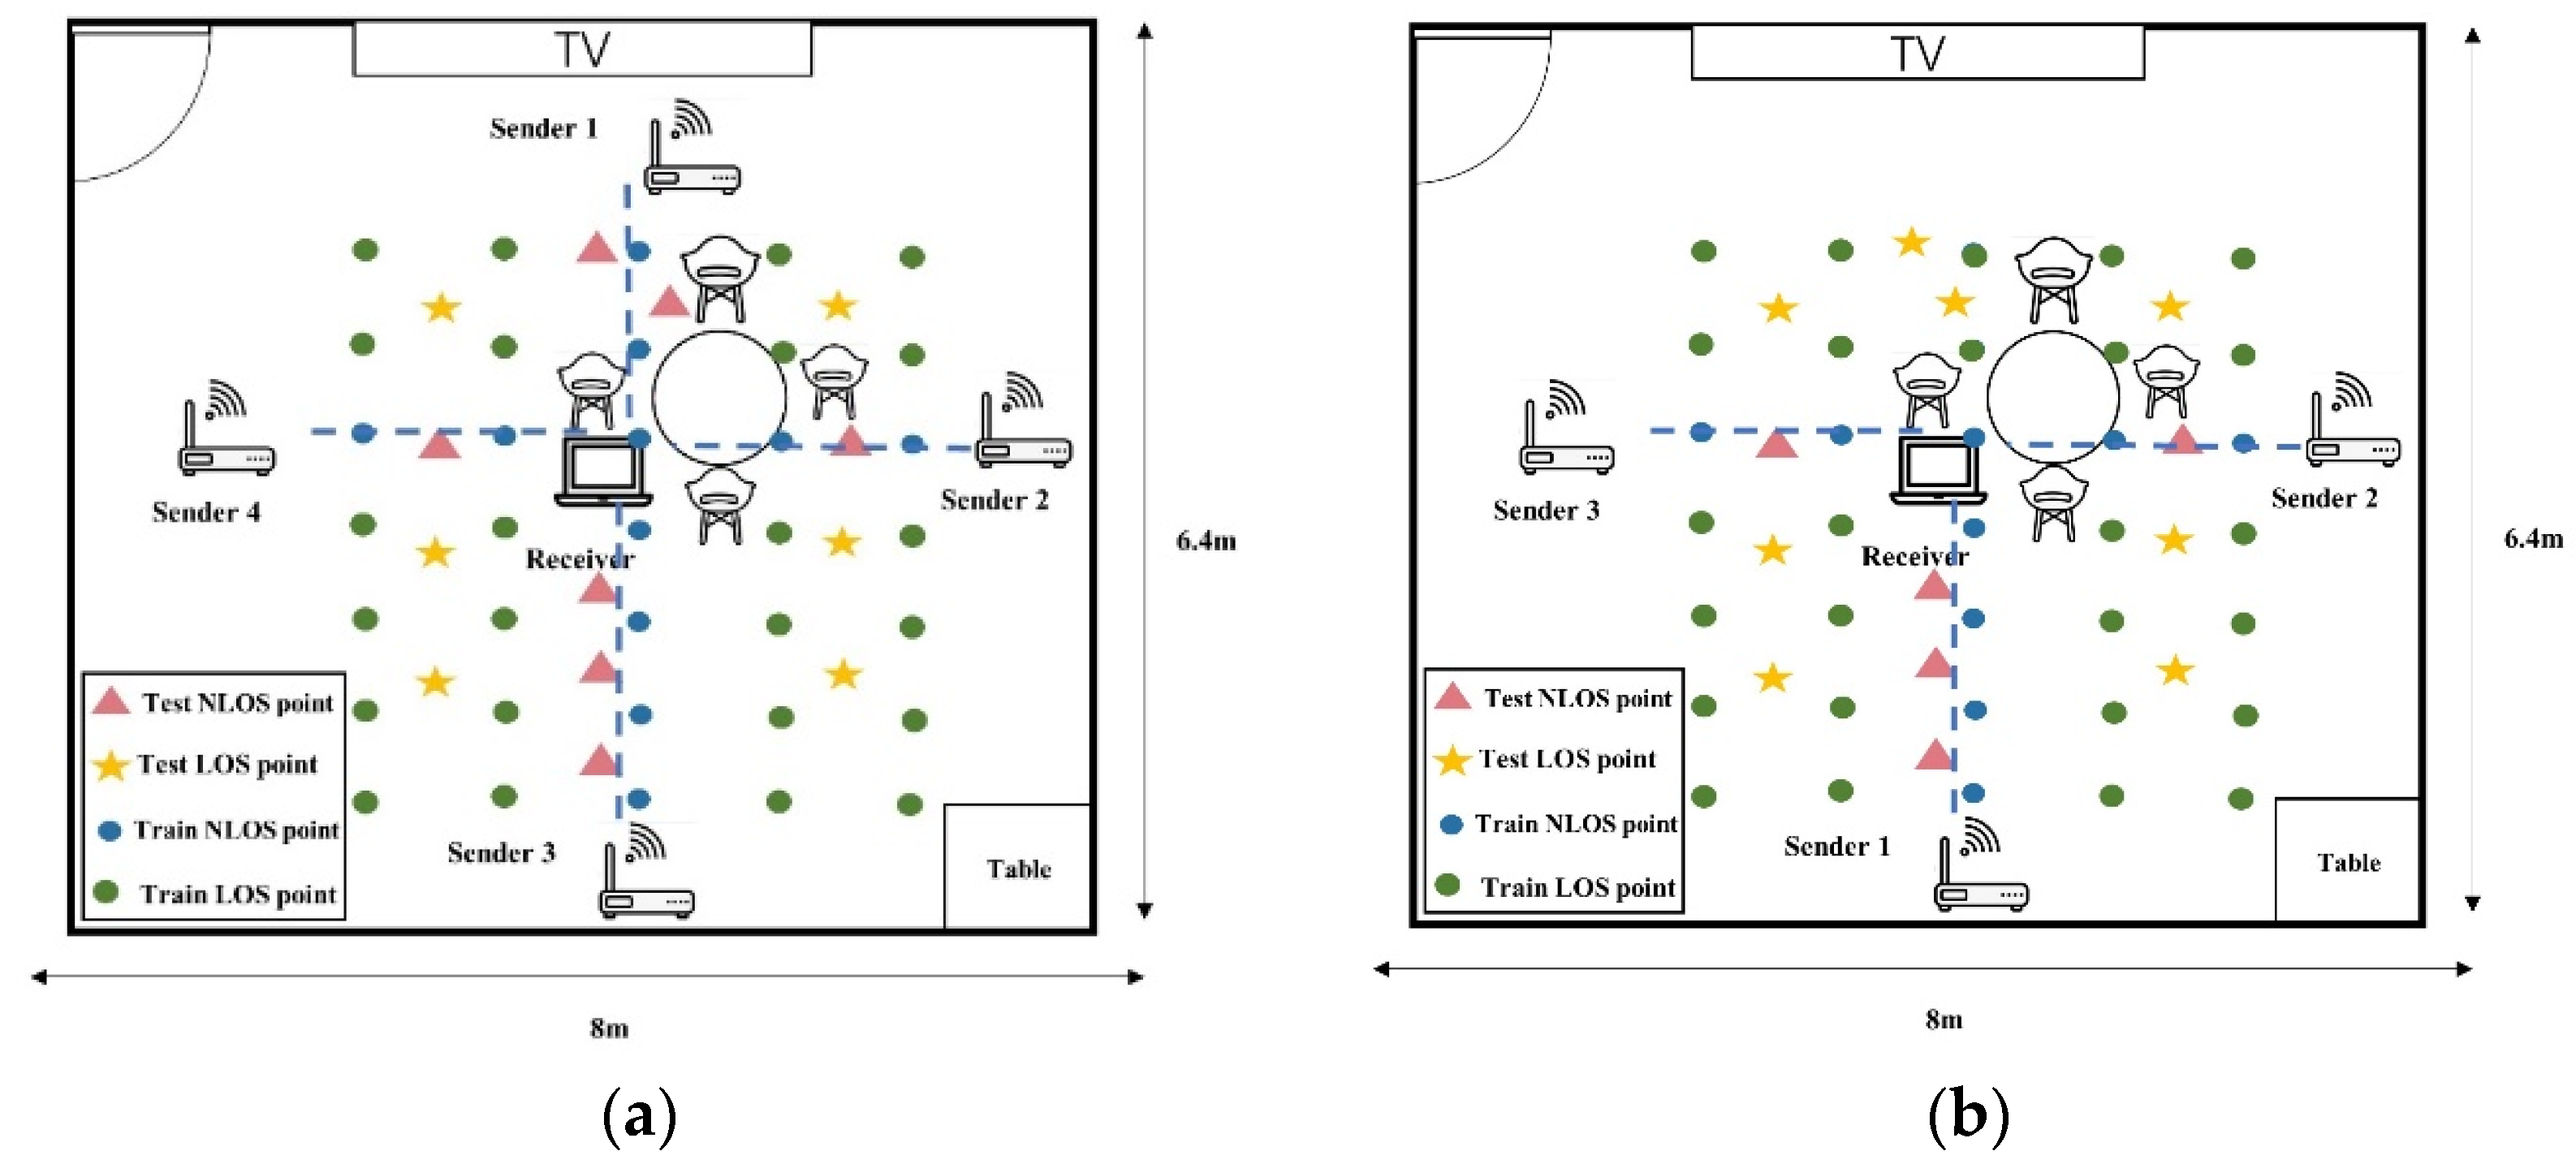
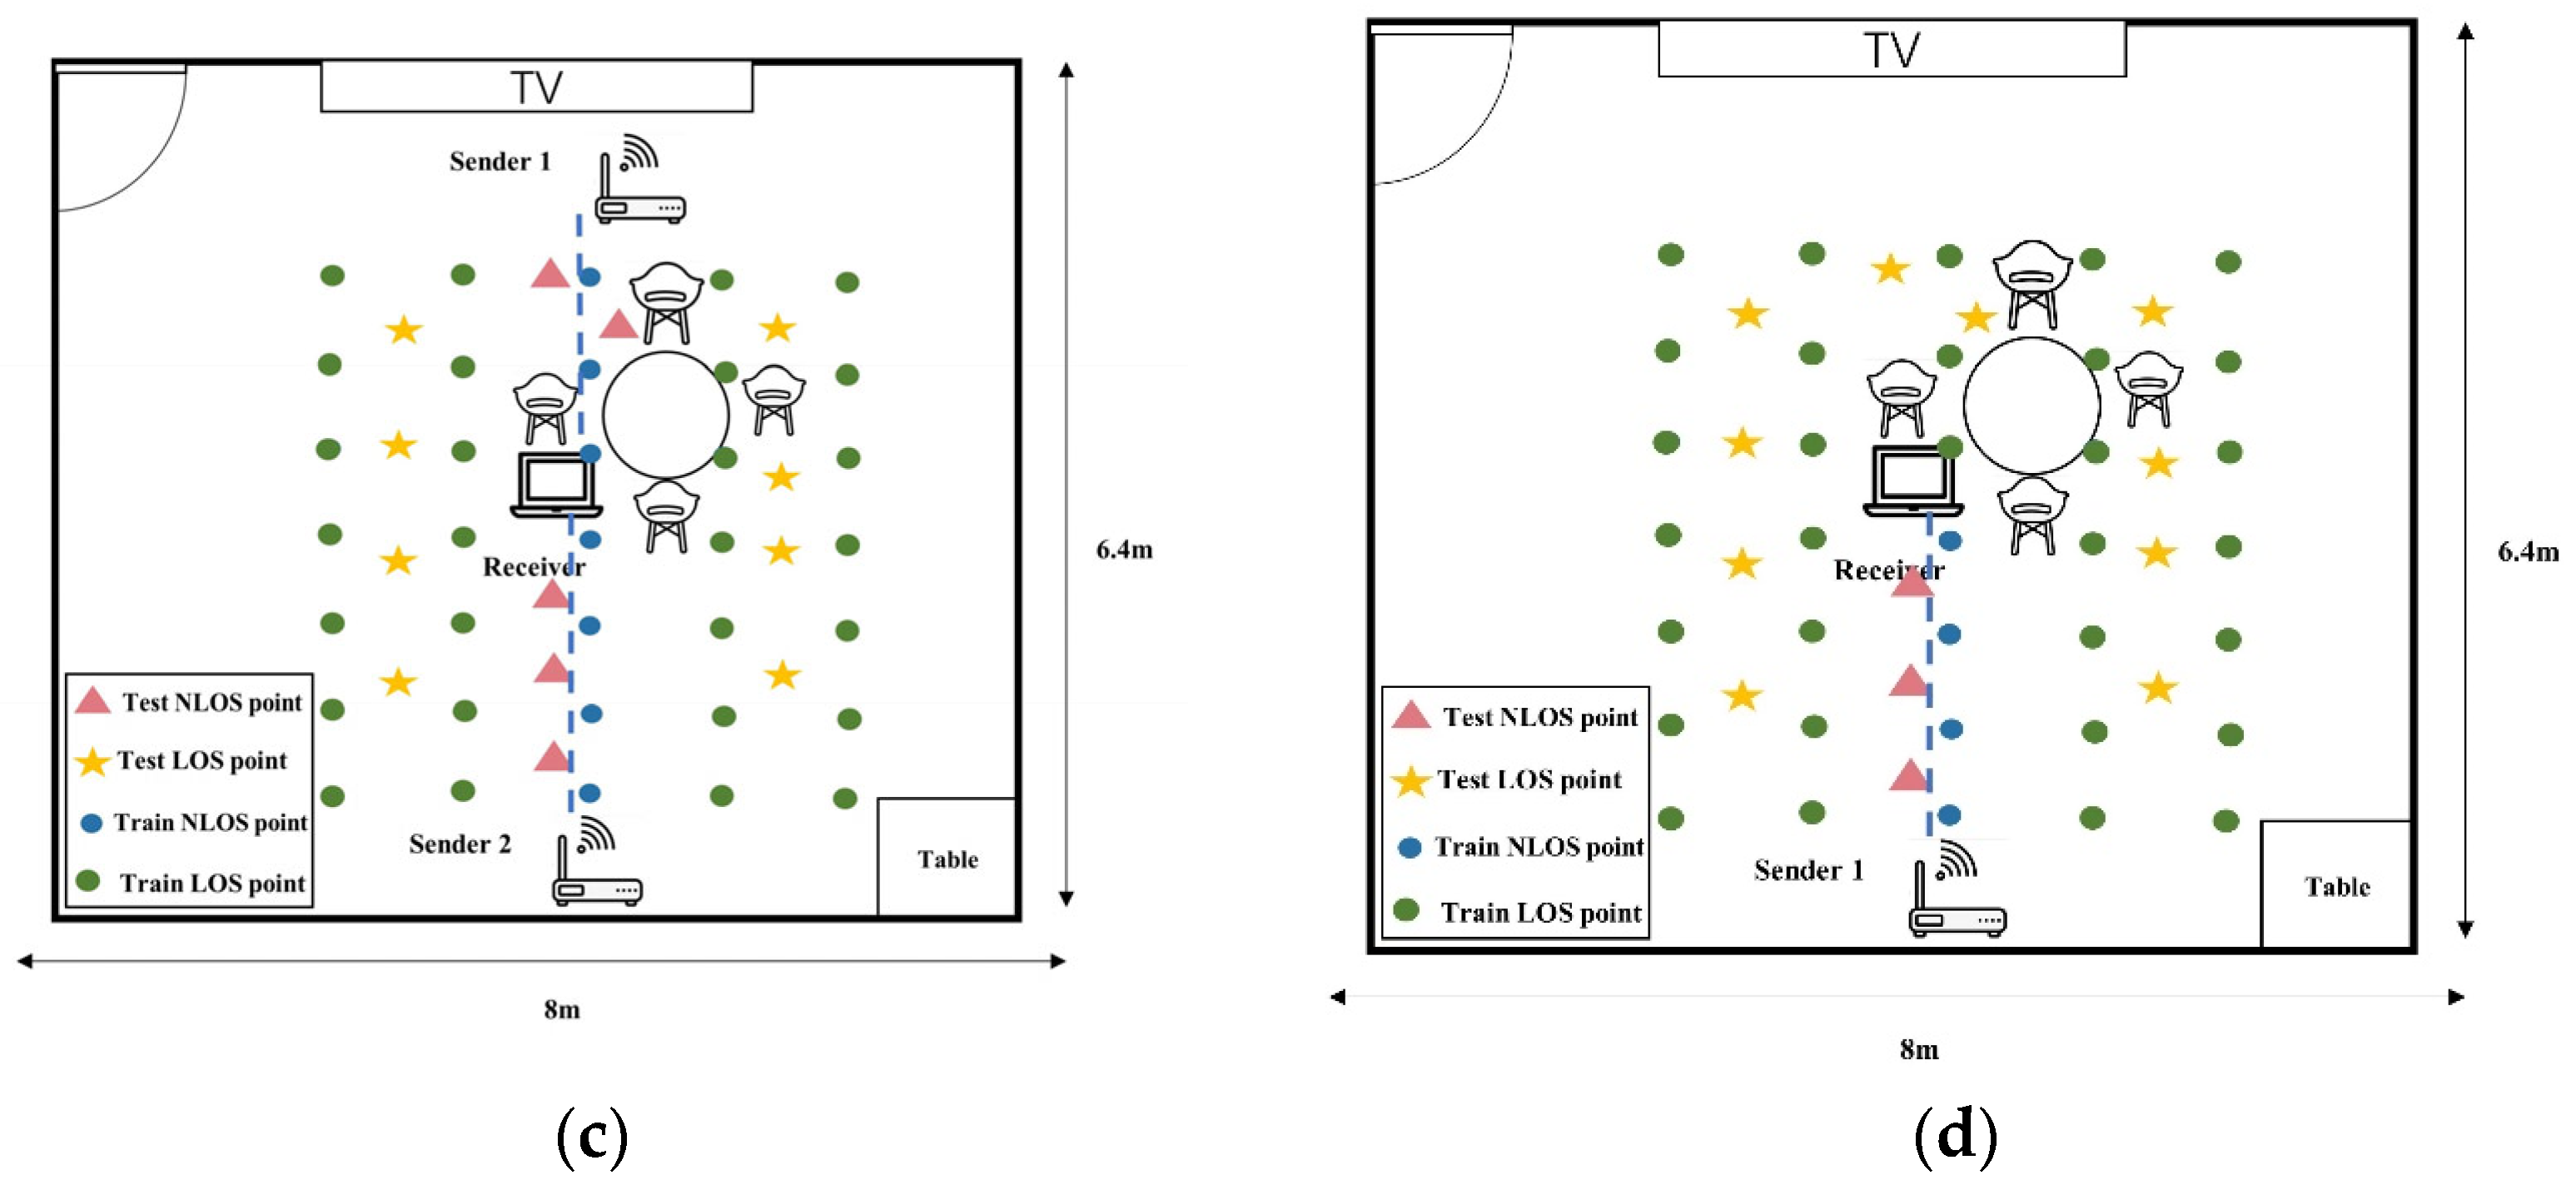
The training stage is divided into NLOS/LOS classification training and NLOS and LOS radio map for fingerprint matching. The NLOS condition and true coordinates of data are collected in the training set. We measure the CSI information at each NLOS transmission path. We construct an NLOS radio map using training CSI amplitude obtained under NLOS conditions. Similarly, a LOS radio map is constructed using training CSI amplitude obtained under LOS conditions. Two training settings for the device-free position are shown in
Figure 6.
The indoor area has increased, and we have reduced the potentially large errors from a single fingerprint database in large indoor areas by building NLOS and LOS fingerprint databases. We construct the fingerprint database under the LOS condition and NLOS NLOS condition. The accepted signal in the CSI LOS condition is , and the signal in the CSI NLOS condition is . In addition, we assume that the measured signals s received by access points at each reference point are all independent.
The accepted CSI signal is L. The posterior probability
and
of the measured signal occurring at the LOS condition reference point and NLOS condition reference point can be calculated using the following formula:
P(S|lm) represent the probability of lm occurring at point S. Hence, the conditional probability of CSI amplitude measures at each NLOS and LOS reference point can be estimated, NLOS and LOS condition maximum probability can be found using Formulas (10) and (11).
3.5. Online Localization
The localization part is divided into NLOS detection and fingerprint matching. The algorithm for NLOS detention is presented in
Section 3.6. The training sample belonging to NLOS is marked as number 1, whereas the one not belonging to NLOS is marked as number −1. Thus, the SVM classifier with NLOS/LOS is built in our experiment. Then, we calculate it using NLOS detection if it is on the NLOS transmission path. If it is LOS calculated,
is calculated; if not,
is calculated. The weighted average of routers is calculated to obtain the corresponding NLOS and LOS condition results. Equation (12) shows the position result
. The flow of the online location method is illustrated in Algorithm 1.
| Algorithm 1: Online Location based on NLOS detection
|
Input: n packet receptions from Wi-Fi CSI and b from SVM model;
Input: NLOS fingerprint database, LOS fingerprint database, number of ap N;
Output: estimated location P(x, y) of the target;
1: For i = 1: I
2: For j = 1: J
3: For n = 1: N//ap number
//Use Hampel fitting to remove noise, use the Min-max method to normalize the data
5: judged NLOS condition by the model SVM
6:
7: s.t.
8: Calculate
9 // this is LOS condition
10: Execute the value of
=
13:
=
15: end if
16: end for
17: end for
18: end for
19: for i = 1: N
20:
21: end for
22: return target point position P; |
3.6. NLOS Detection Method
We introduce the NLOS and LOS condition-matching algorithms in the above system. The results of these two matching algorithms are based on NLOS detection results. If the NLOS detection result is incorrect, the corresponding NLOS and LOS matching may bring position error. Therefore, NLOS detection is a cornerstone of the device-free positioning matching stage. This section introduces our NLOS detection algorithm.
The signals under NLOS conditions may contain much noise. The idea of device-free NLOS detection using CSI information is based on the fact that pedestrian presence at different locations affects the propagation paths of wireless signals from the sender to the receiver. Factors such as indoor pedestrians and complex environments contribute to the multipath effect. NLOS occurs when the person is in the middle of the receiver, and the transmitter blocks the LOS sign. In contrast, LOS does not occur when the person is not positioned directly between the receiver and transmitter, as illustrated in
Figure 7.
The signal transmission paths may be blocked by obstacles or people in device-free position. Thus, the arriving signal transmission path is delayed. Many theoretical models, such as the Rician-K factor, Skewness, and kurtosis, are designed to distinguish NLOS and LOS conditions. However, these models rely on precise channel profiles from dedicated channel sounders or require a long measurement period. The threshold method does not obtain perfect recognition results in our test environment.
Some methods are used for studying NLOS recognition. The training data are usually insufficient. Therefore, we design an NLOS detection method based on a classification with an SVM algorithm. The accuracy obtained using SVM may be better than other methods in the two-division classification.
In general, the subcarrier amplitude of CSI under the LOS condition is stronger than that under the NLOS condition. We use subcarrier amplitude as candidate features to train the classification. When a person is between the transmitting and receiving ends, the received CSI information is significantly different. Different methods have been proposed to classify the NLOS information. We compare the statistical methods and SVM in the 4.4 paragraph.
Two categories of CSI training data must be collected: (1) NLOS training samples, which generally occur when people are in the transmission and reception of linear transmission; and (2) LOS condition training data, which are collected with a human at the position under the scenario that generally occurs when people are not in the transmission and reception of linear transmission. Let
. The specific implementation of the SVM can be found as follows. Suppose the sample set has its category represented as (x
i, y
i) i = 1, 2, · · ·, n, y ∈−1,1, which are under the kinds NLOS and LOS labels. If the data is linearly separable, the support vector classifier seeks to discover the ideal hyperplane for classification. This hyperplane seeks to maximize the margin ω
T x + b = 0, subject to the slack variable ξ
i, which is used to regulate the distance between sample points, and the penalty coefficient c. ξ = (ξ
1, ξ
2, · · ·, ξ
n) comprise the slack variables for allowing some wrong results. The function expressions are as follows:
The method used to solve w and b that maximizes gamma, w, and b gamma is the Lagrangian operator method. We solve the above problem as a quadratic programming problem:
NLOS and LOS are not linearly separable in the real environment. Thus, a hyperplane that can partition them entirely and correctly may sometimes not exist. Therefore, we must regard the nonlinear problem as a high-dimensional feature space by kernel functions for linear classification and set convex quadratic programming constructs as a function to solve the problem. The function can be shown as follows:
where
represents the Lagrange multiplier, and
represents the kernel function. NLOS misclassification may lead to an increase in fingerprint localization errors in the online matching stage. Thus, the correct rate of NLOS in localization must be ensured, and the case of LOS recognition into NLOS must be minimized as much as possible. The reason is that the misrecognition rate of LOS affects the final indoor localization accuracy. Therefore, selecting the kernel function is crucial. A low LOS mismatch rate must be maintained when the kernel function is used. We compare different kernel parameters to find the most accurate point in the SVM algorithm. The radial basis function (RBF) kernel function is used in this study. The RBF formula is as follows:
4. Experiments and Discussion
In this section, we evaluate the proposed device-free position method and NLOS detection method on the two datasets. We conduct tests on the corridor and laboratory scenes.
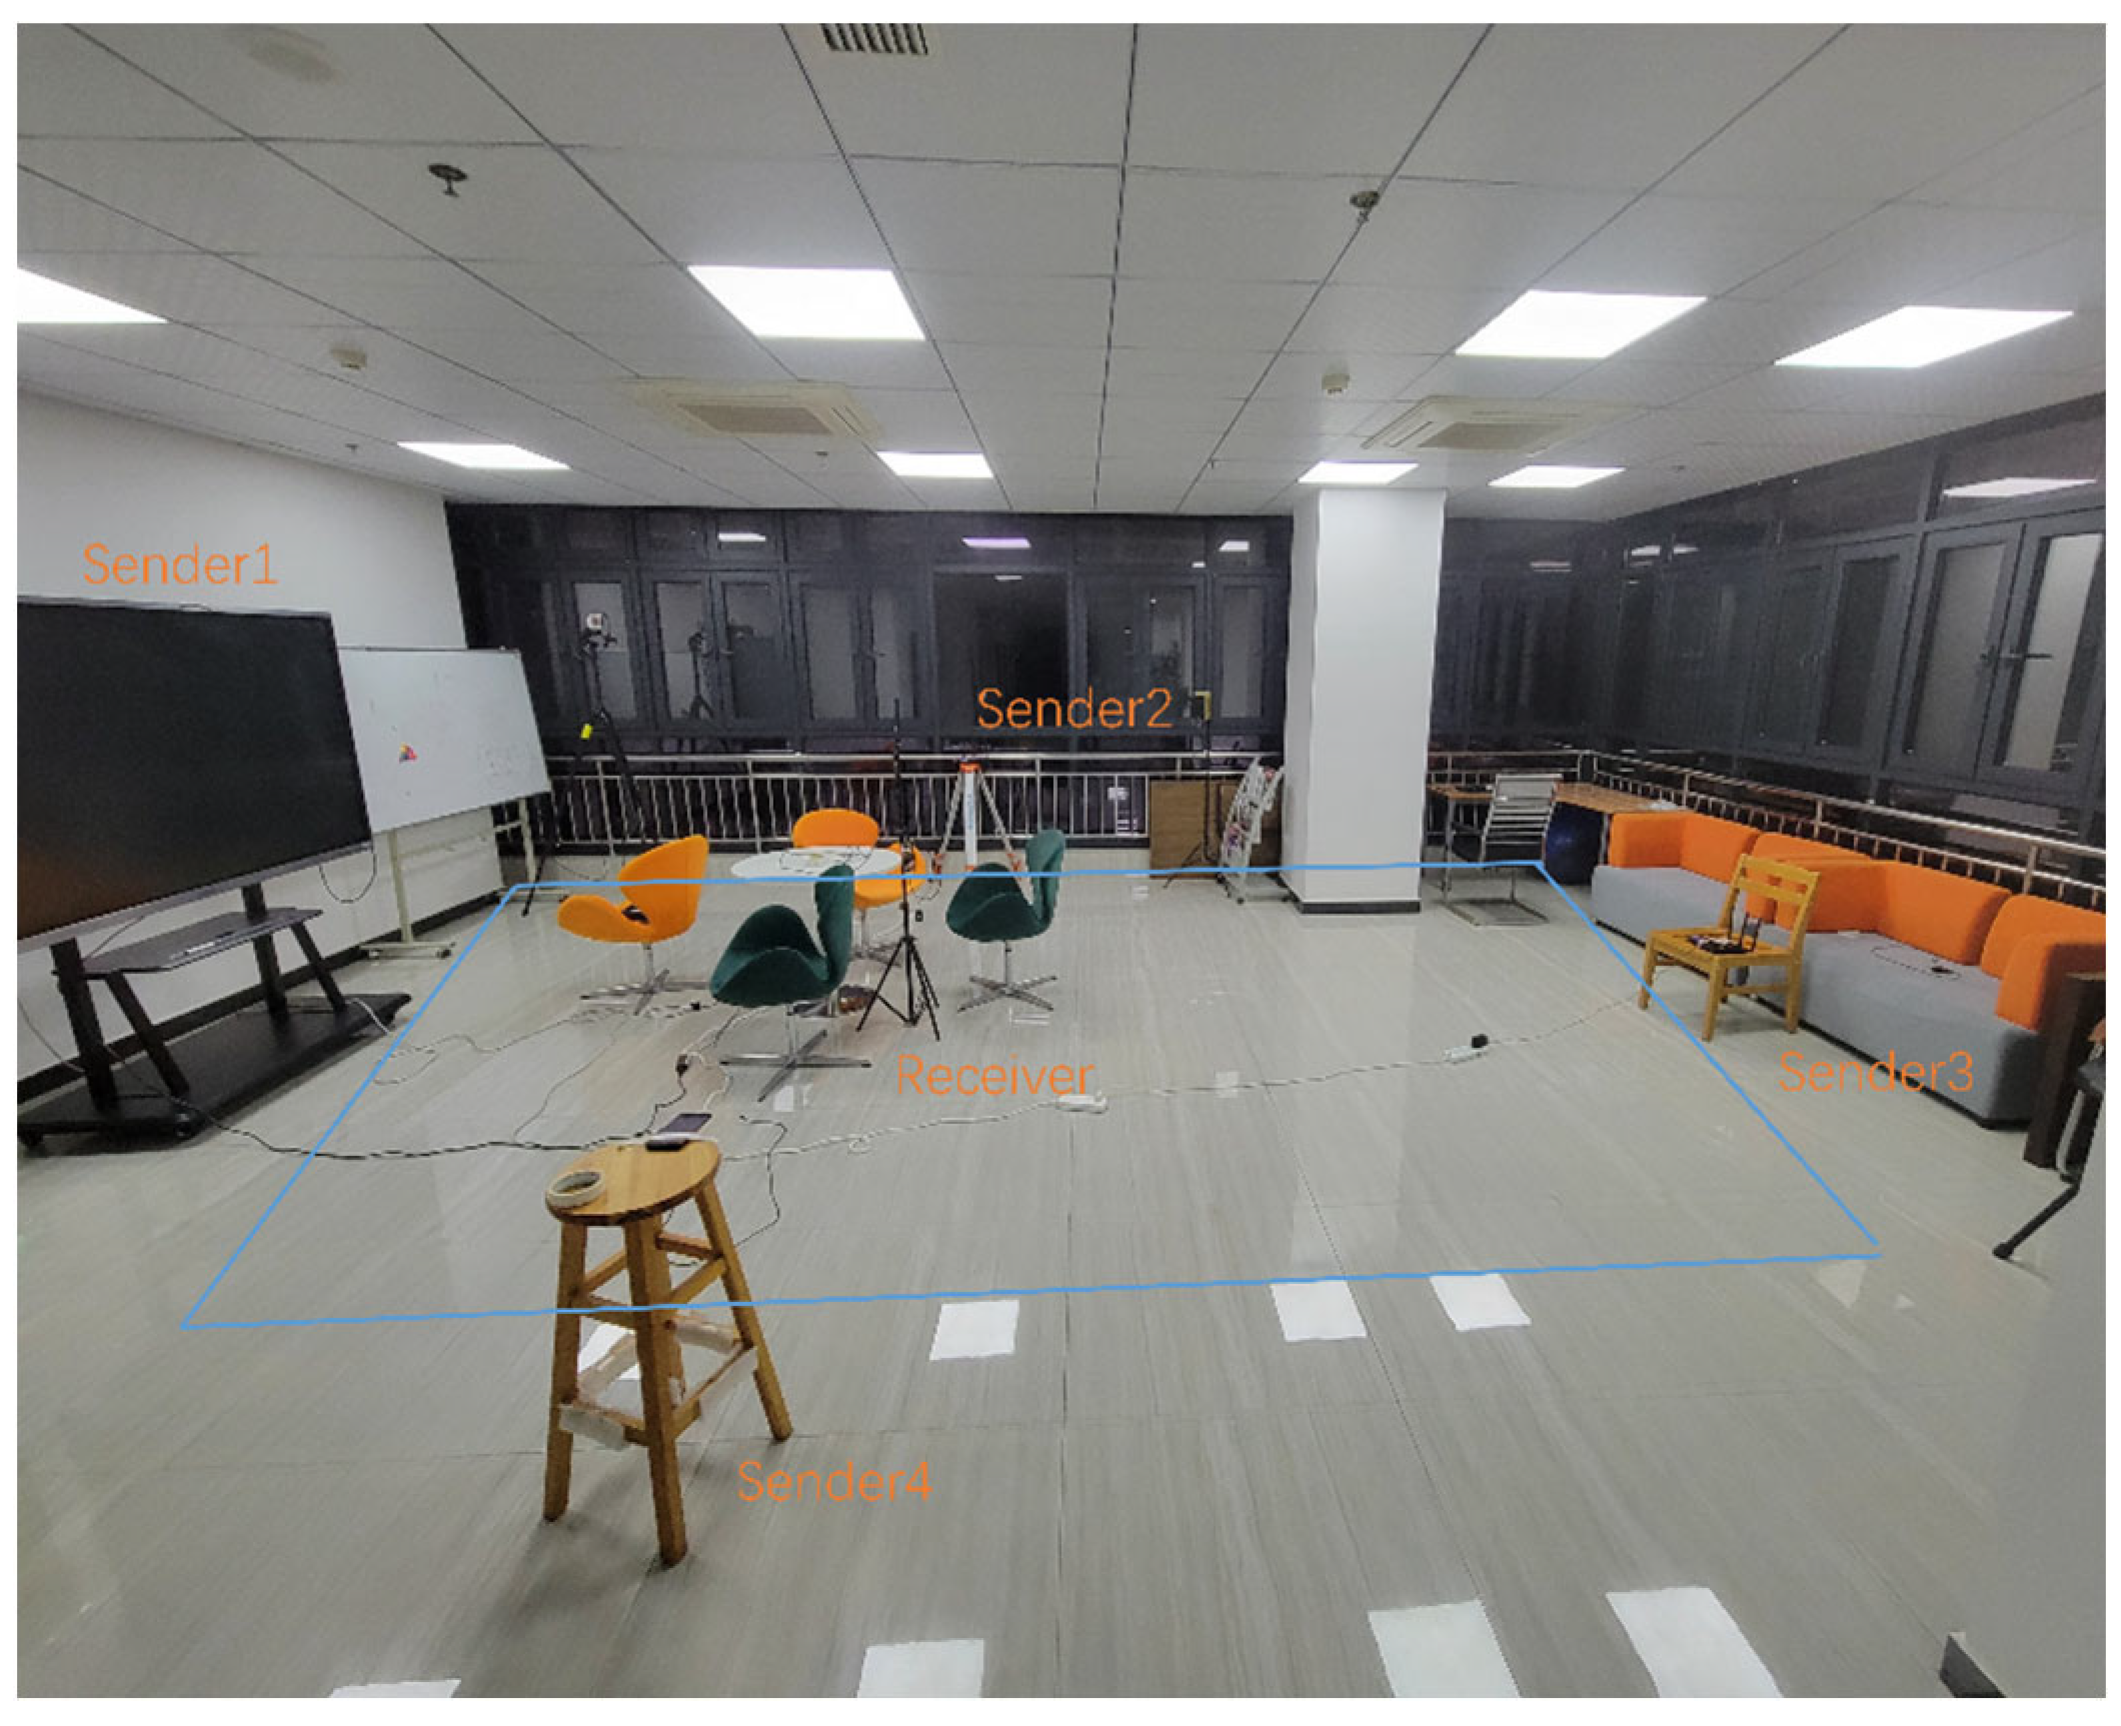
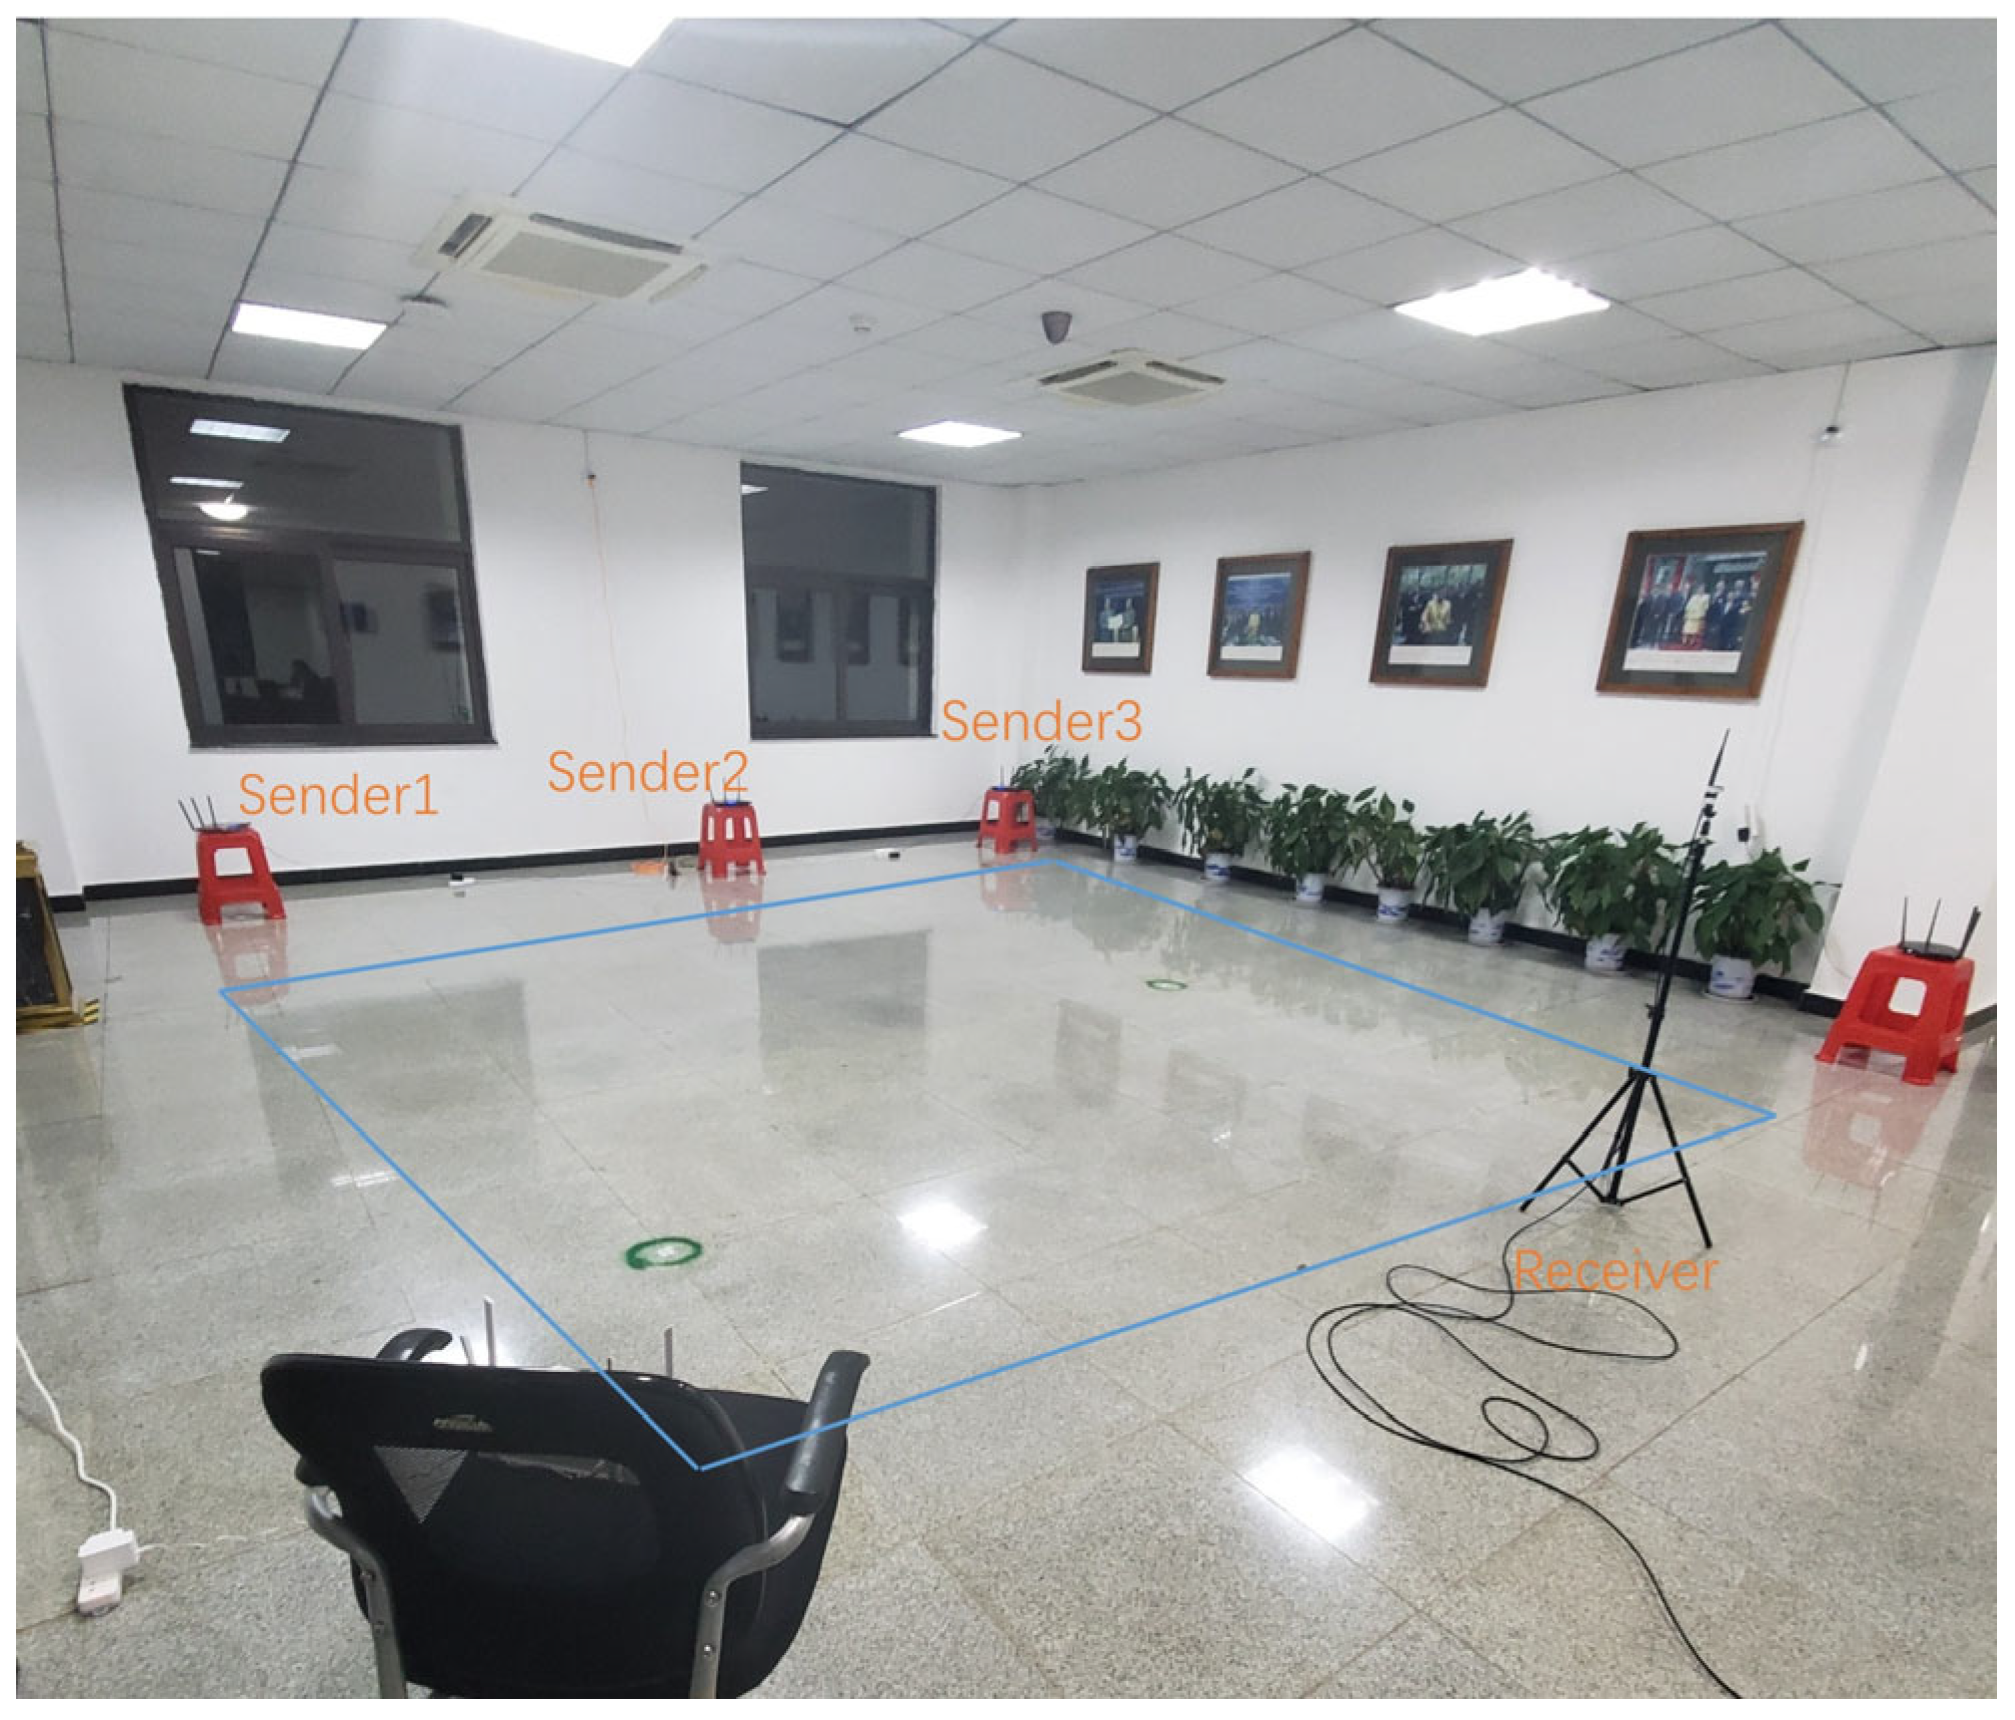
Figure 8 depicts the corridor environment in the Sirindhorn Research Center, a typical office setting, while
Figure 9 depicts the laboratory environment on the campus of Wuhan University. We compare the experiments with NLOS detection to those with the Bayes method without the NLOS detection method, in addition to the common methods of DeepFi, Bayes, and KNN. DeepFi is a representative CNN algorithm. These are common algorithms in device-free position.
The number of NLOS transmission paths may affect the position result due to the fingerprint matching area. Thus, we optimize and improve the experiment using an inaccessible number of transmitting ends. NLOS detection acts as a cornerstone before the device-free positioning matching stage. Finally, we provide the recognition accuracy of NLOS detection.
4.1. Experiment Setup
We set up 54 and 35 reference points in the corridor and laboratory scenes, respectively, to evaluate the performance of our system. Three TP-LINK WDR4310 wireless routers and Huawei MATE 20 are employed as transmitters operating at 5 GHz in the corridor scene. A total of 600 data are collected for each sampling point. The total laboratory area of this environment is 50
. The total area of the corridor environment is 72
. Two experiment intervals between every two reference points are 0.6 m. During the training phase, we collect CSI measurements from a man with a height of 1.75 m. We use Universal Software Radio Peripheral (USRP) N210 to receive CSI packets from the wireless router. Two detailed experiment information, such as training points under NLOS and LOS conditions and test points under NLOS and LOS conditions, are shown in
Figure 10.
We examine the similarity of the CSI features along with NLOS and LOS information. A major challenge in matching is how to distinguish each spot. Moreover, we collect people appearing in a straight line at the sending and receiver routers as an NLOS scenario, as shown in
Table 1.
4.2. Data Collecting
We utilize TP-Link WDR4310 routers equipped with multiple antennas as senders operating in IEEE802.11n at 5 GHz, while a USRP N210 with a single antenna is used as a receiver. We use a ThinkPad laptop T470P running Ubuntu 14.04LTS with the Gun Radio software to capture CSI data. We collect the CSI information under NLOS and LOS scenes with different numbers of subcarriers. The training part is divided into two parts. We define NLOS and LOS as NLOS information when a person is in the middle between the receiver and the transmitter. In LOS information, the person is not between the receiver and the transmitter. A total of 32,400 and 21,000 training samples are collected in the corridor and laboratory, respectively. Thus, 32% and 68% of training data are collected in the laboratory for NLOS conditions and LOS conditions, respectively. Moreover, 35% and 65% of training data are collected in the corridor for NLOS conditions and LOS conditions, respectively. A total of 5400 and 7800 test samples are collected in the corridor and laboratory, respectively. Thus, 53% and 47% of test data are collected in laboratory for NLOS conditions and LOS conditions, respectively. Moreover, 55% and 45% of test data are collected in the corridor for NLOS conditions and LOS conditions, respectively. In this study, we use SVM for classification. The laboratory scene has four routers, whereas the corridor scene has three routers.
4.3. Device-Free Positioning Experiment
We must collect the CSI in each reference point and each reference point to acquire the amplitude and location of CSI in the NLOS and LOS conditions and obtain the localization model. We use CSI amplitude as the training samples of NLOS and LOS data to construct Bayesian probability functions and obtain the Bayesian fingerprint localization model based on NLOS. Then, we combine the test data and the localization method above, test them in two scenes, and finally collect the localization results and errors. Evaluation Metrics: We mainly use the following metrics to evaluate the performance of our method. We present the average position accuracy and the accuracy of the Root mean squared error (RMSE) as evaluation metrics.
We compare the positioning performance of our algorithm with DeepFi [
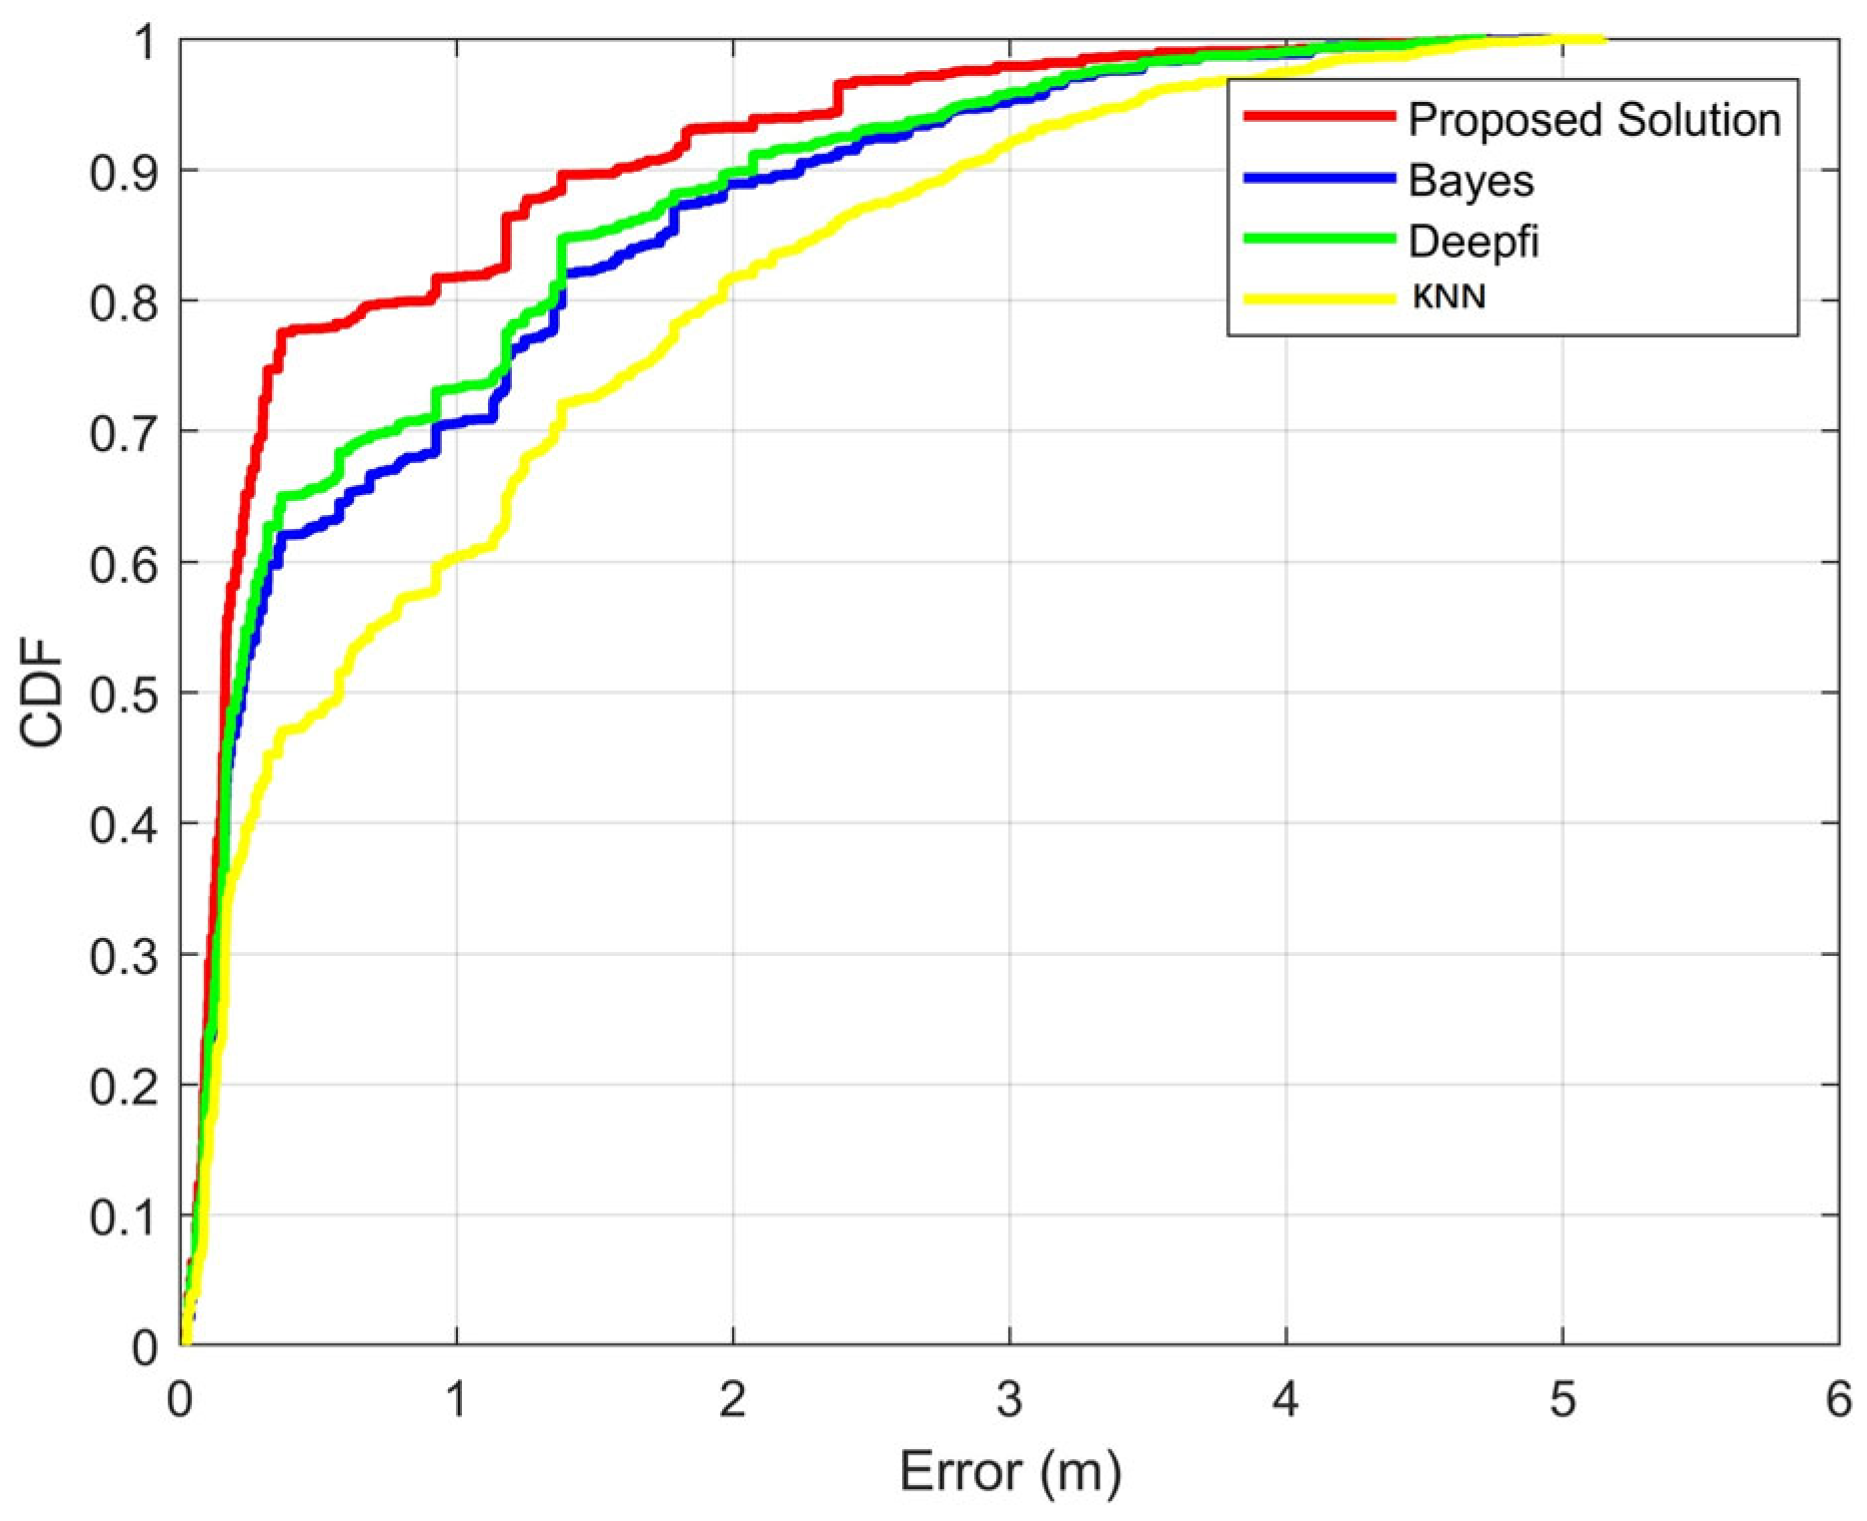
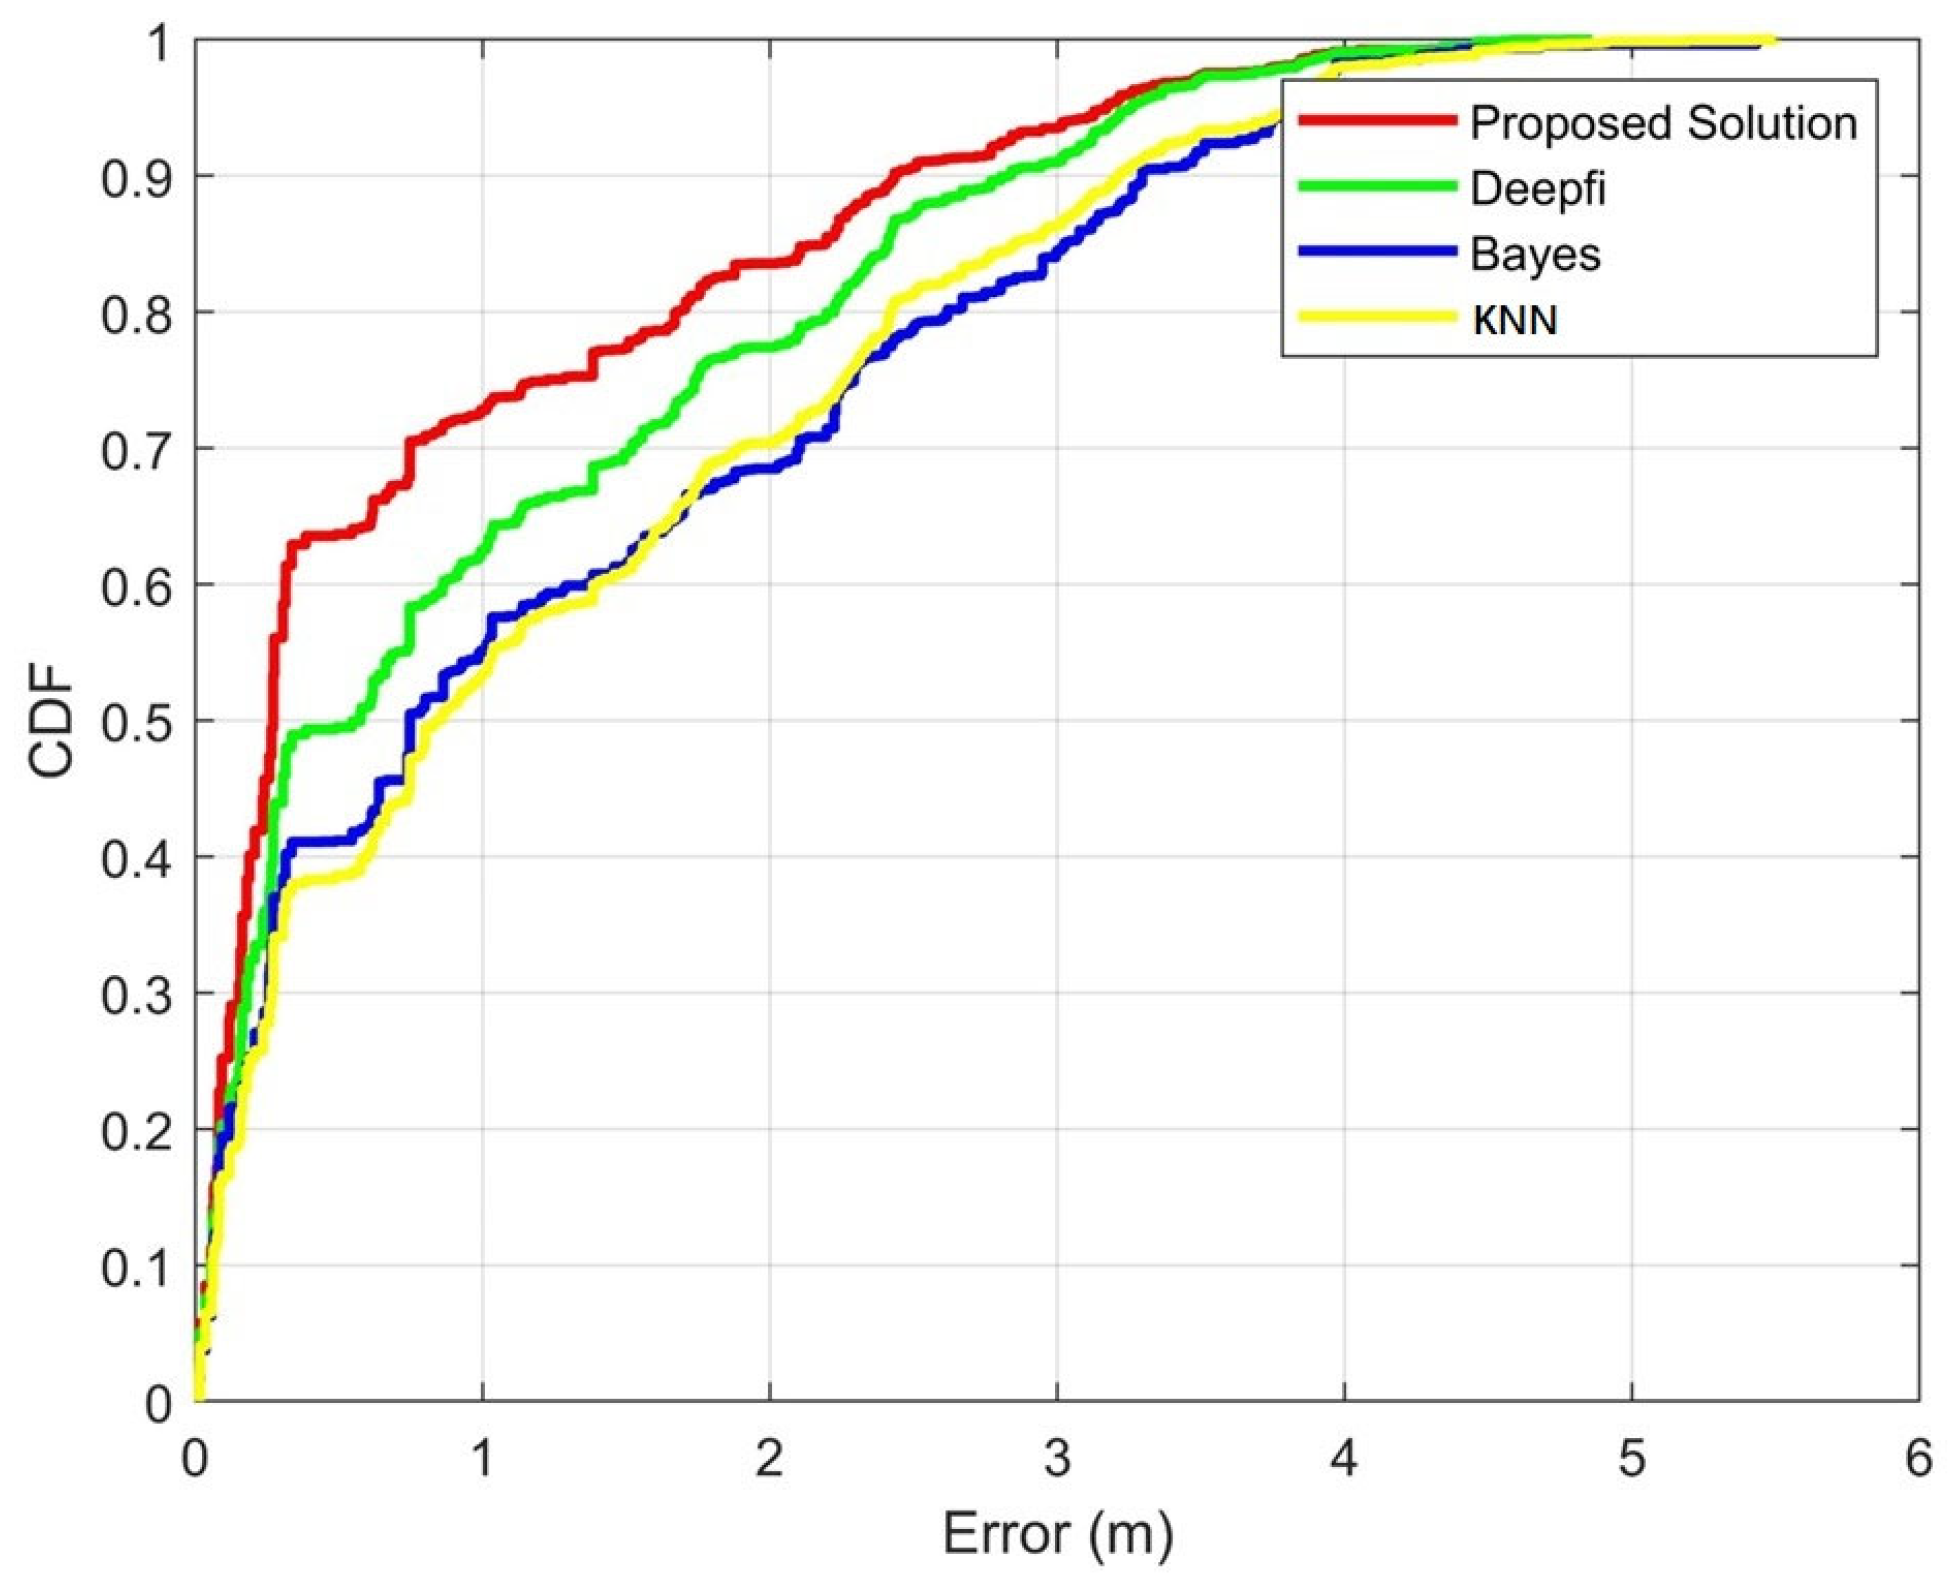
21], Bayes, and KNN algorithms to verify the overall positioning performance. We conduct two device-free experiments with the four solutions using the same datasets in the laboratory and corridor experiments. The Cumulative Distribution Function (CDF) position error in the two experimental environments can be seen in
Figure 11 and
Figure 12.
Figure 11 illustrates the error probability statistics of four device-free position algorithms in a laboratory scene. Specifically, the proposed algorithm has 82.5% of its position errors within 1 m, while the DeepFi algorithm has 72.4% of its position errors within 1 m, and the Bayes algorithm has 71.2%. Additionally, the KNN algorithm has 53% of its position errors within 1 m.
Figure 12 illustrates the error probability statistics of four device-free position algorithms in a corridor scene. The proposed algorithm achieves a positional error within 1 m for 75.5% of its results, which is higher than the DeepFi algorithm at 64.5%, the Bayes algorithm at 55.5%, and the KNN algorithm at 53.5%.
The results demonstrate that our proposed solution achieves superior localization accuracy compared to DeepFi, Bayes, and KNN, as shown in
Table 2. Specifically, our solution outperforms DeepFi and Bayes by 23.1% and 29.4%, respectively. In corridor environments, the proposed solution achieves an average localization error of 0.82 m and an RMSE of 1.02 m; in contrast, DeepFi, Bayes, and KNN achieve average errors of 1.01 m, 1.11 m, and 1.21 m, respectively, and RMSE errors of 1.19 m, 1.23 m, and 1.54 m, respectively. In laboratory environments, the proposed solution achieves an average localization error of 0.73 m and an RMSE of 0.95 m, whereas DeepFi, Bayes, and KNN achieve average errors of 0.95 m, 1.09 m, and 1.14 m, respectively, and RMSE errors of 1.03 m, 1.19 m, and 1.26 m, respectively. Our method shows significant improvement, primarily due to its ability to identify NLOS and employ an indoor localization method for both NLOS and LOS. The comparison results demonstrate the effectiveness of our SVM-NB algorithm for localization.
4.4. Impact of Position with NLOS Detection
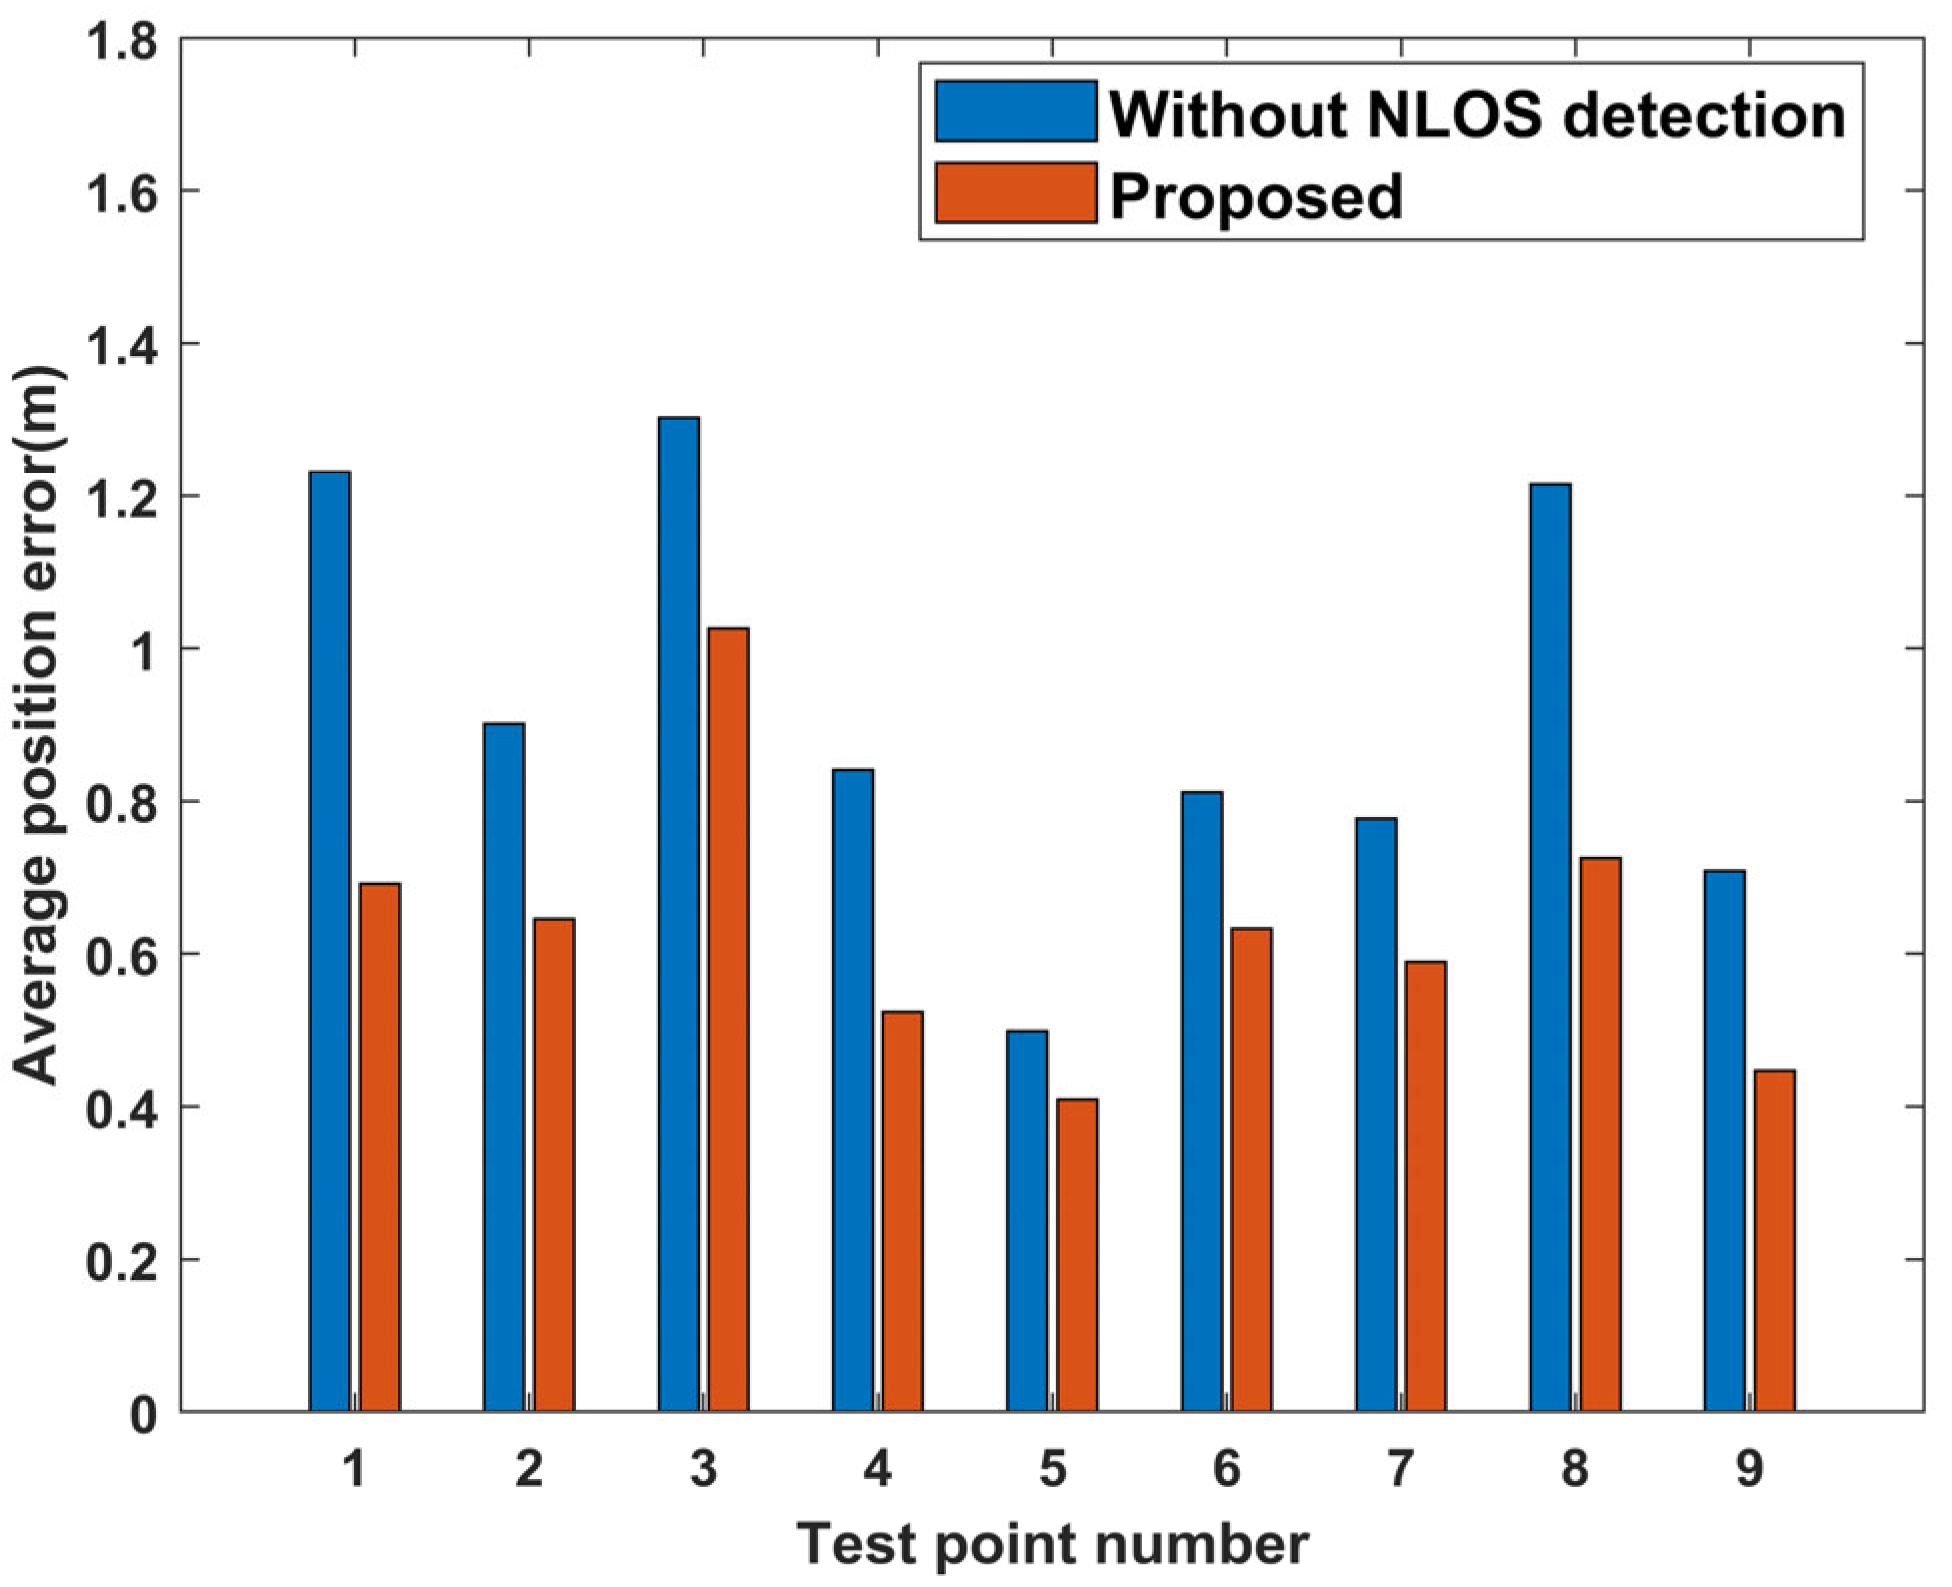
We compare the device-free position with NLOS detection and that without NLOS detection to evaluate the effect of NLOS/LOS detection. The method without NLOS detection is used in the Bayes method. Each test point’s average error of the device-free position error in the corridor and laboratory experiments are shown in
Figure 13 and
Figure 14.
Points No. 1, 2, 3, and 8 are tested under LOS conditions, while points No. 4, 5, 6, 7, and 9 are tested under NLOS conditions in a corridor environment. Test points No. 1, 2, 3, 4, 5, 6, and 7 are tested under NLOS conditions, and points No. 8, 9, 10, 11, 12, and 13 are tested in a laboratory environment under LOS conditions. The NLOS detection method improves the position accuracy of almost every test point. However, the accuracy of test point No. 10 in the laboratory is not improved due to considerable acquisition noise, resulting in low positioning accuracy for both methods. It is worth noting that the SVM-NB solution improves accuracy not only in NLOS conditions but also in LOS conditions compared to the Bayes position, which is the solution without NLOS detection.
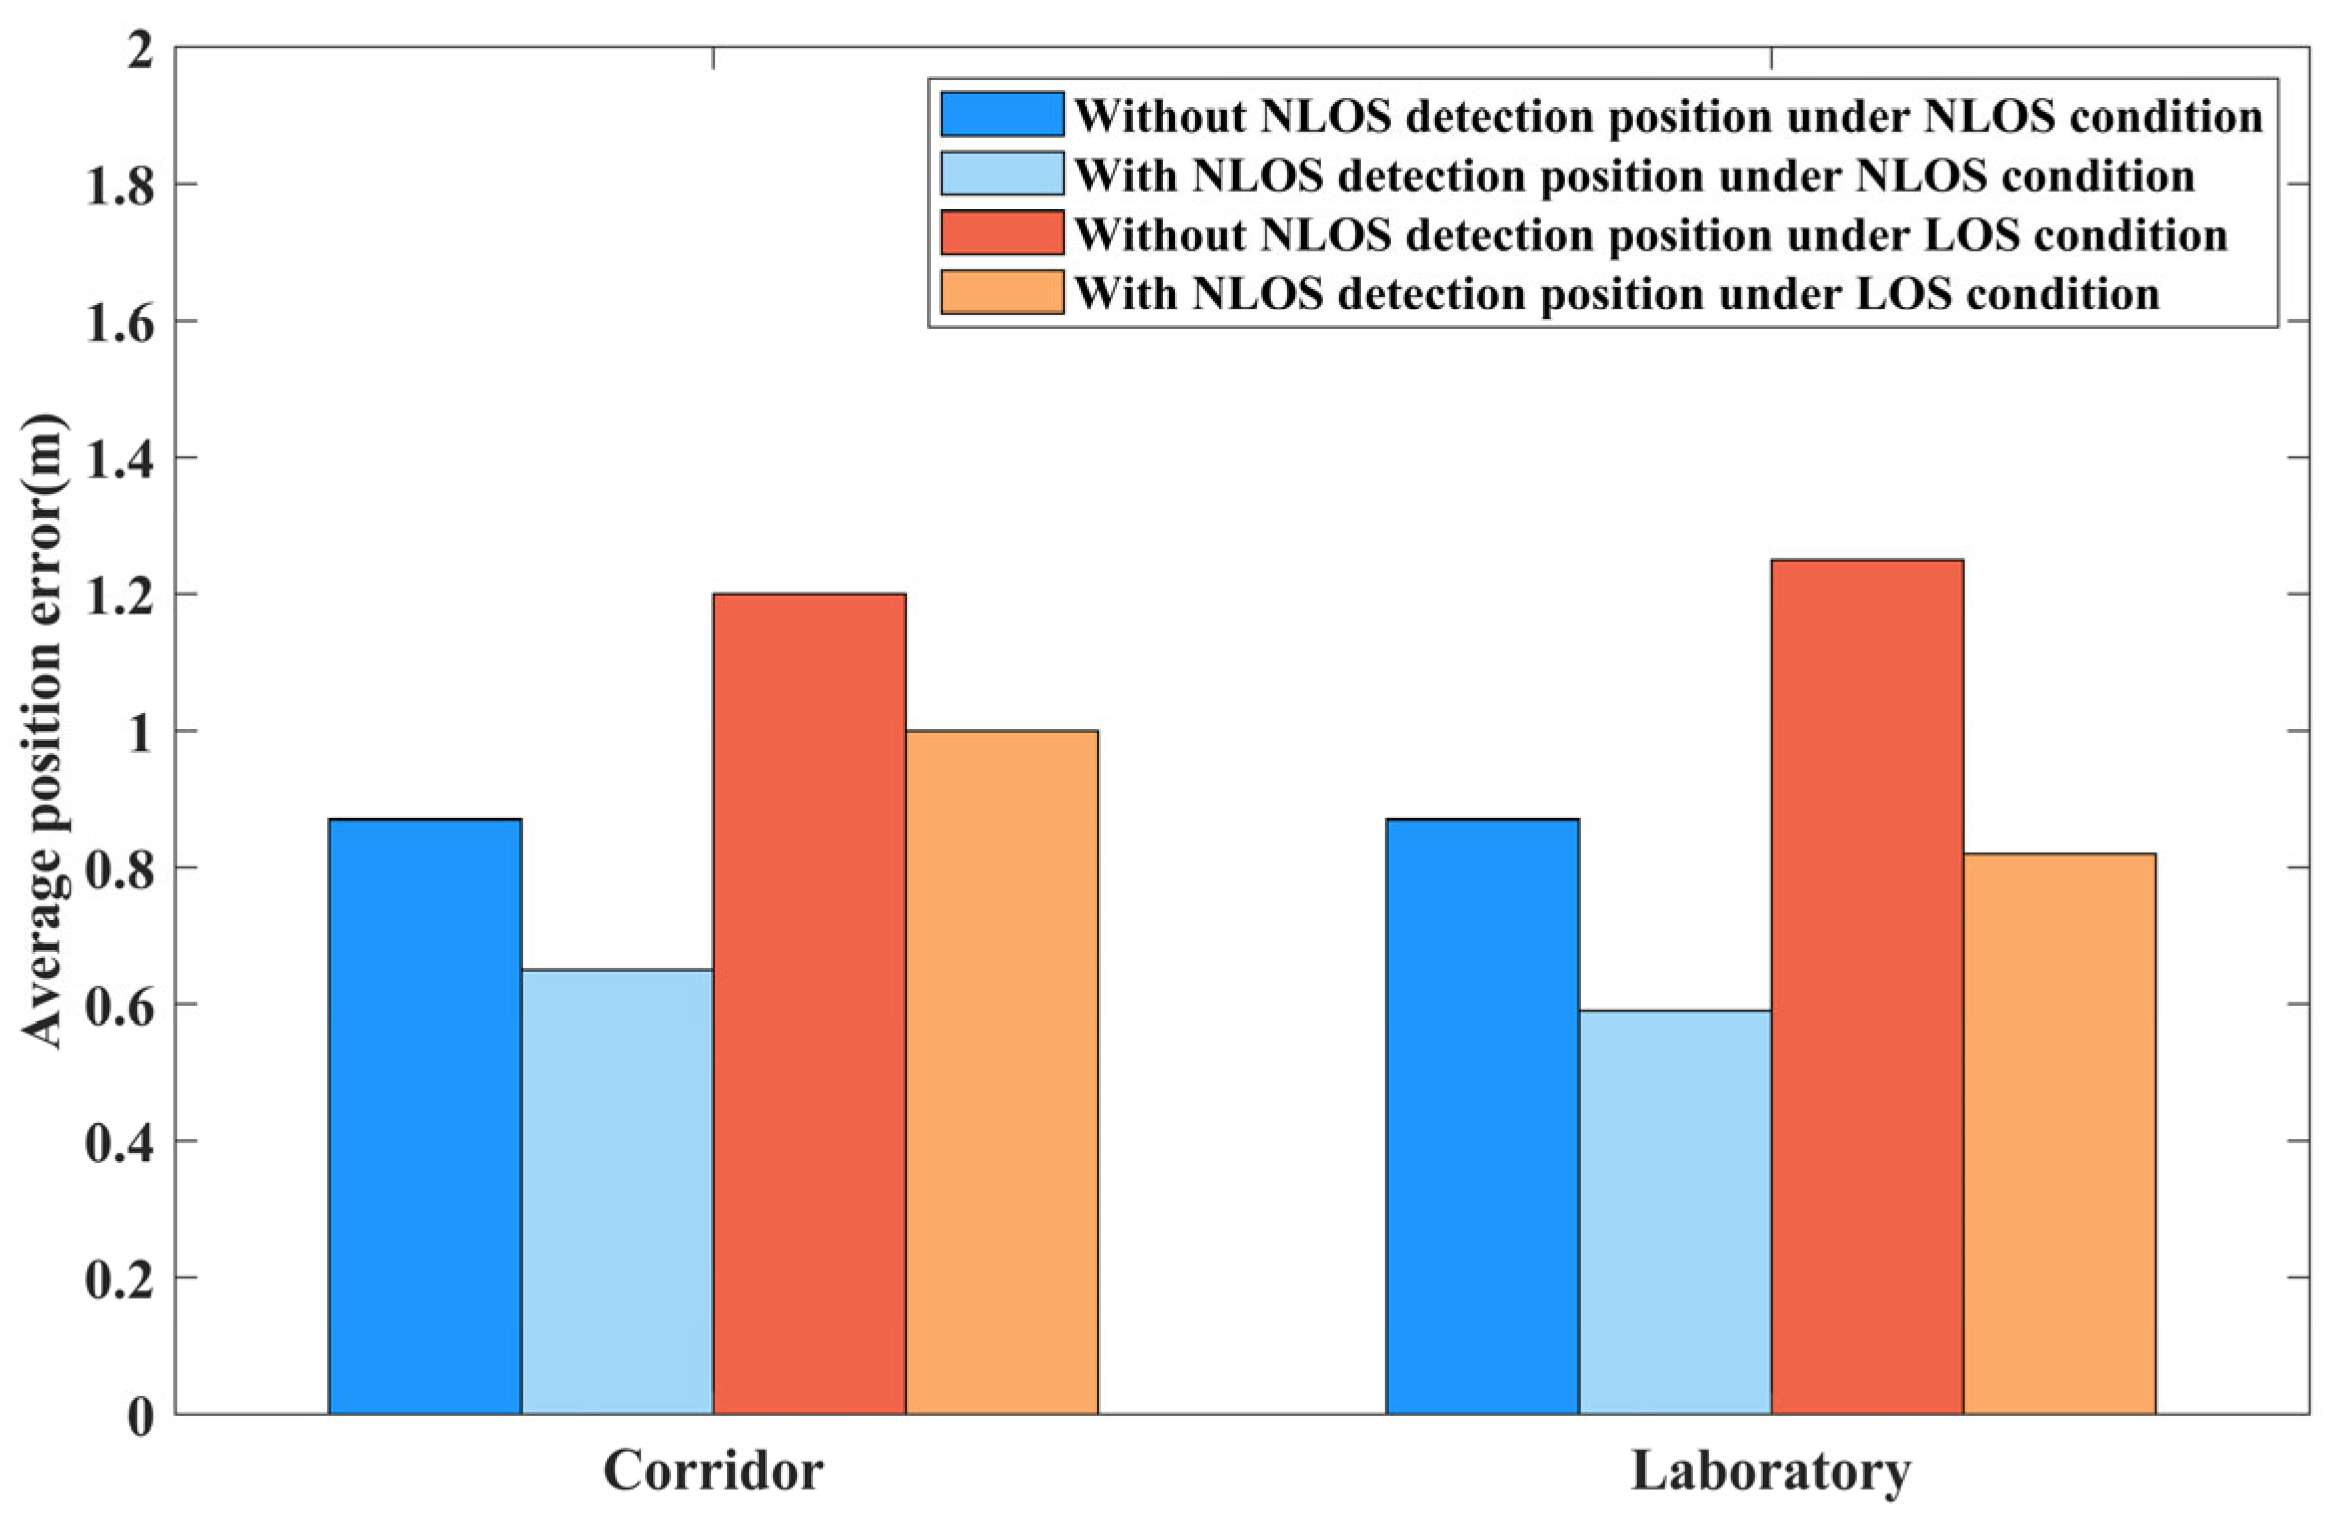
Our method with NLOS detection outperforms the unprocessed effect. The comparisons of the position errors of NLOS and LOS conditions with and without NLOS detection are shown in
Figure 15. The position error under NLOS is decreased from 0.87 m to 0.65 m, and the position error under LOS is decreased from 1.21 m to 0.99 m. In the laboratory experiment, the position error under NLOS decreased from 0.87 m to 0.59 m, and the position error under LOS decreased from 1.25 m to 0.82 m. Conclusion: in two experiments, positioning accuracy of NLOS and LOS are improved by 28.7% and 26.2%, respectively. Combining NLOS detection with a device-free position produces better position results.
4.5. Comparison of Position Results under NLOS and LOS Condition
It can also be seen in
Figure 15. that the position error under the LOS condition is the main source of error in an indoor environment. The average position error of the proposed method under LOS condition is 0.99 and 0.82 m in two environments. The average position error of the proposed method under NLOS condition is 0.65 and 0.55 m in two environments. The error of the NLOS condition is lower than that of the LOS condition. This finding is contrary to the indoor model of active positioning. A possible explanation for this may be that the refraction and diffraction of the signal in the indoor environment, particularly in LOS signals, stay stable. Therefore, these positions cannot be distinguished easily. These findings can contribute to a more comprehensive understanding of the primary error in device-free positioning. Combining NLOS detection with device-free positioning can be a promising approach to achieving accurate indoor positioning.
4.6. Impact of NLOS Transmission Paths
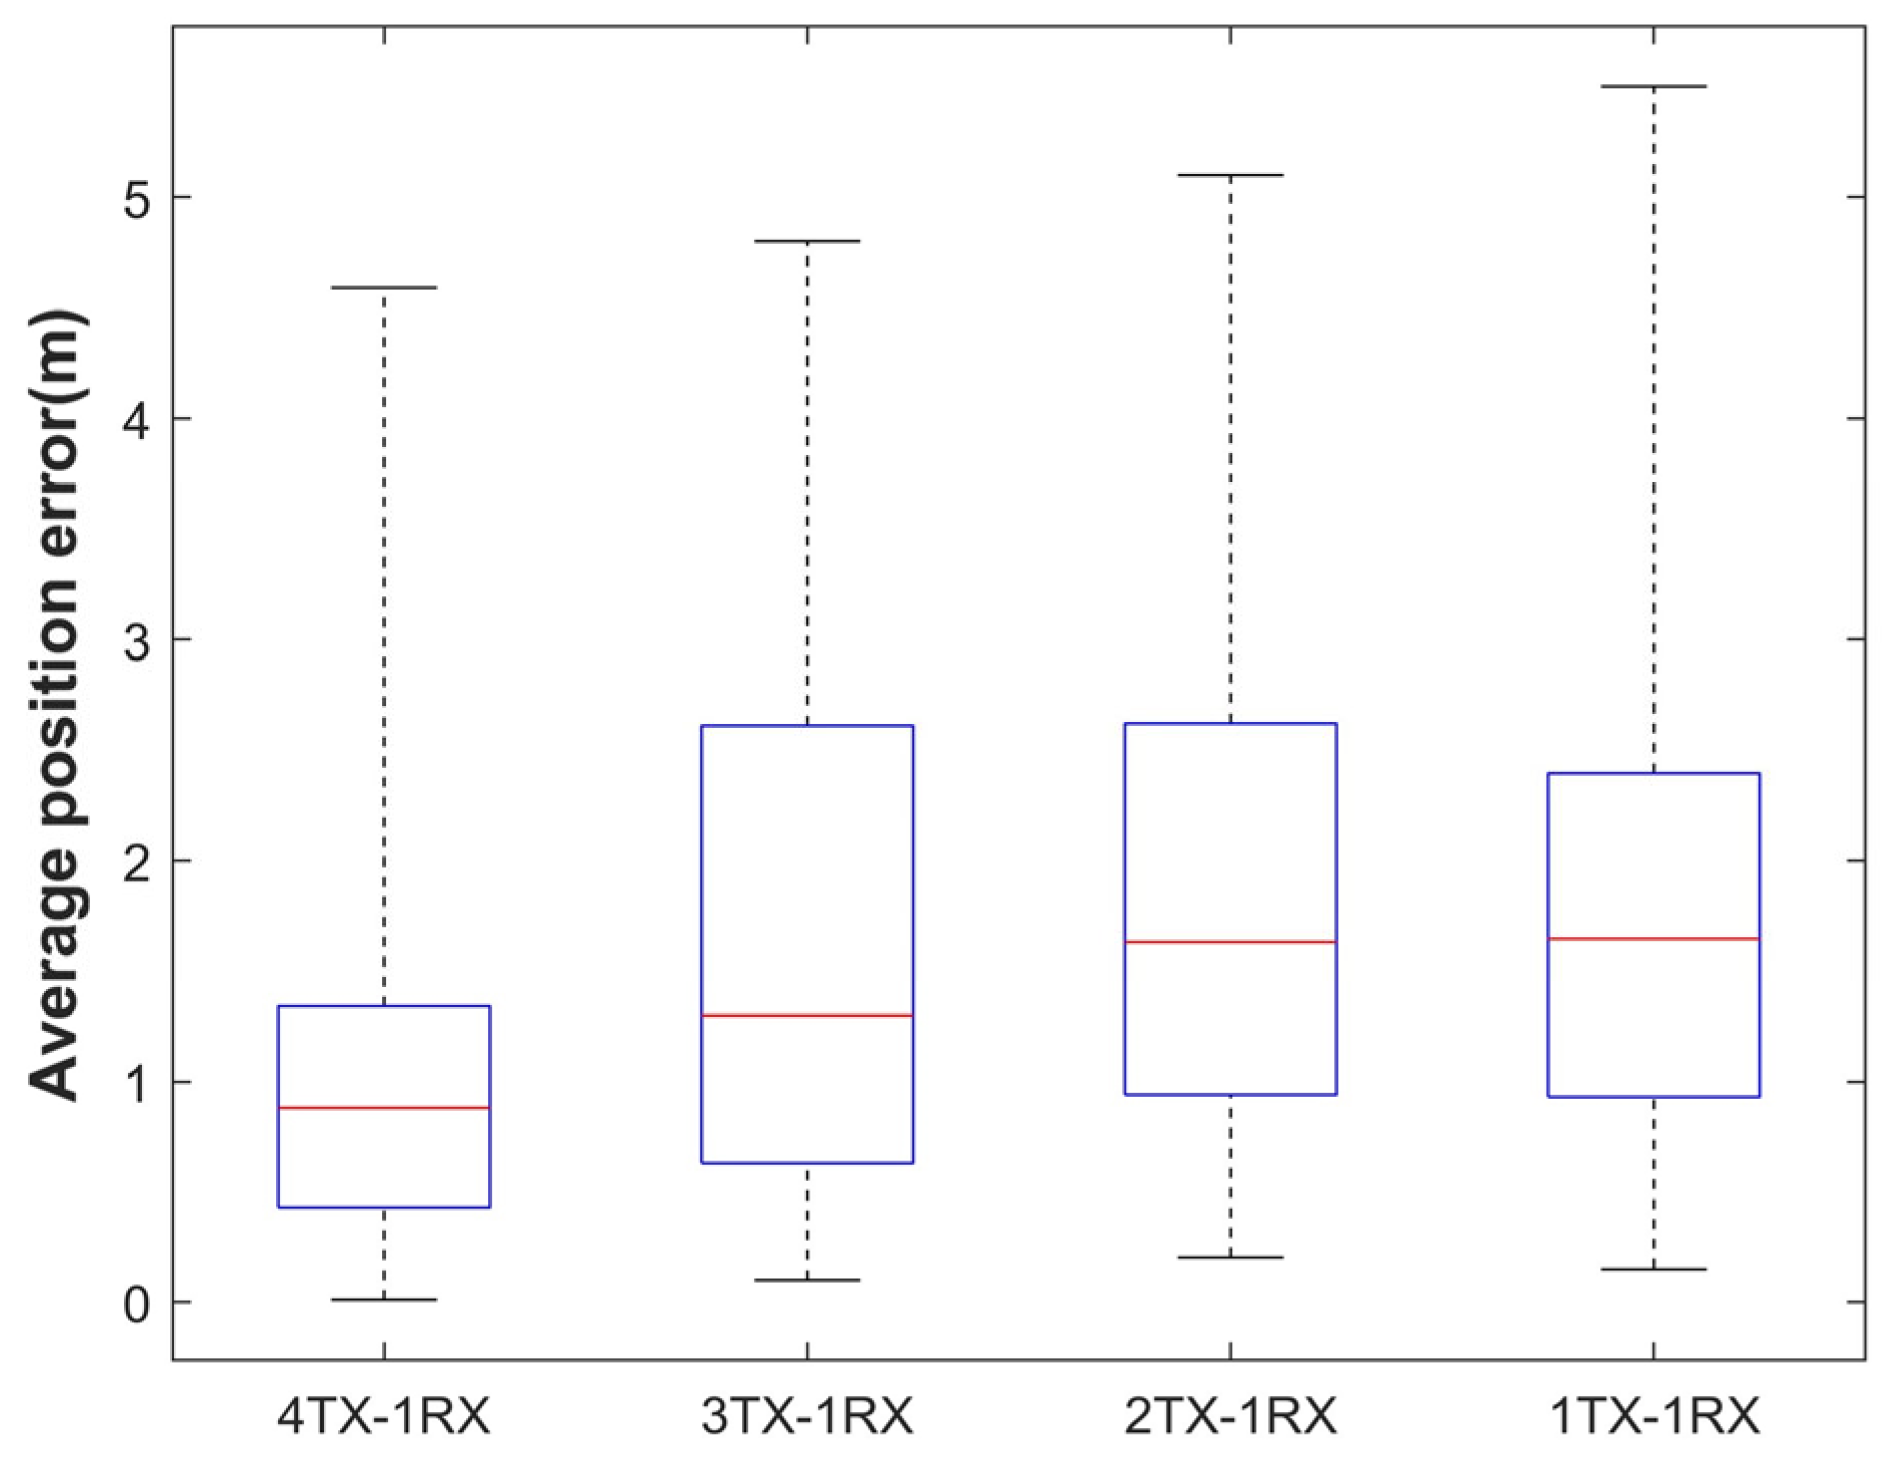
Increasing the number of Wi-Fi signal propagation links achieves higher device-free positioning accuracy using the SVM-NB algorithm. In turn, we deploy different numbers of routers in two experimental environments to find the pattern and investigate the effect of different NLOS path coverages on the localization results. We set the router placement as above to cover more NLOS paths as a way to reduce error matching, as shown in
Figure 16. Different router placement indoor position results are represented in
Figure 17.
Our experiment shows that the average positional errors of routers 4, 3, 2, and 1 are 0.72, 1.02, 1.24, and 1.29 m, respectively. Therefore, our algorithm improves the localization accuracy as the propagation path number of the user approaching or blocking the LOS increases. The higher the number of covered paths, the more improved the localization accuracy. We take the laboratory scene as an example and place the receiver in the middle of the room resulting in the receiver covering an extensive indoor activity range. Moreover, the device-free position accuracy considerably improves too. In addition, our algorithm reduces the position errors of the LOS and NLOS conditions. Therefore, our proposed algorithm considerably improves localization accuracy.
4.7. NLOS Detection Experiment
We may narrow the search area with the NLOS detection and obtain accurate results in the online localization stage. So, NLOS detection is an important part of the system. The experimental environment can be seen in
Figure 8 and
Figure 9.
4.7.1. NLOS Detection Experiment Data Collection
NLOS detection is evaluated separately in laboratory and office scenes with two groups. The NLOS condition occurs when the person is between the receiver and the transmitter blocking the LOS sign. By contrast, the LOS condition occurs when the person is not between the receiver and the transmitter. TP-link WDR4310 routers with multiple antennas are equipped as senders operating in IEEE 802.11 n at 5 Ghz. USRP N210 with one antenna is equipped as a receiver. ThinkPad laptop T470P is used with Gun Radio software and runs Ubuntu 14.04LTS to receive CSI data. In total, 32,400 and 21,000 training samples are collected in the corridor and laboratory scenes. Among the 13,200 test samples, 7800 and 4800 are collected under the NLOS and LOS conditions, respectively. We collect the CSI information under the NLOS and LOS scenes with different numbers of subcarriers. Training points and test points are shown in
Figure 10.
4.7.2. Results of NLOS Detection
To evaluate the performance of NLOS detection, we utilize a comprehensive set of five metrics: (1) false positive (FP), which is the possibility of NLOS when LOS appears; (2) true positive (TP), which is the accuracy of NLOS precisely; (3) false negative (FN), which is the possibility of LOS when NLOS appears; (4) true negative (TN), which is the accuracy of detecting LOS precisely; and (5) precision, which is the possibility of detecting NLOS and LOS correctly.
We compare our method with the parametric method to evaluate the accuracy of our method. The results are represented in
Table 3. Our method has a high identification accuracy. Our study uses the SVM algorithm to achieve a high accuracy of NLOS detection rate.
First, we compare the recognition rates of four kernel functions based on SVM. Second, we compare NLOS with two commonly used NLOS recognition methods, Rician-K and Skewness. The results of the correlational analysis are shown in
Table 1, indicating that the identification accuracy number of the SVM based on the kernel used in our method is 97.56%. The SVM based on the RBF kernel has a lower mismatch rate. The identification accuracy numbers of the NLOS recognition methods based on Rician-K and Skewness, are 89.5% and 91.5%, respectively.
Table 4 shows the overall NLOS detection accuracy of each router in two scenes. The high correct NLOS recognition rate provides the SVM-NB algorithm with a more accurate determination of the area to be matched, so our algorithm gets fine localization results with NLOS conditions.
