Abstract
In summertime, eastern China experiences severe ozone pollution. Stratosphere-to-troposphere transport (STT), as the primary natural source of tropospheric ozone, may have a non-negligible contribution to ground-level ozone. Rossby wave breaking (RWB) is a leading mechanism that triggers STT, which can be categorized as anticyclonic wave breakings (AWBs) and cyclonic wave breakings (CWBs). This study uses an objective method to diagnose AWBs and CWBs and to investigate their influence on the surface ozone in eastern China using ground-based ozone observations, satellite ozone data from AIRS, a stratospheric ozone tracer simulated by CAM-chem, and meteorological fields from MERRA-2. The results indicate that AWBs occur mainly and frequently over northeast China, while CWBs occur mostly over the northern Sea of Japan. STTs triggered by AWBs mainly have sinking areas over the North China Plain, increasing the ground-level ozone concentrations by 5–10 ppbv in eastern China. The downwelling zones in the CWBs extend from Mongolia to the East China Sea, potentially causing an elevation of 5–10 ppbv of ozone in both central and eastern China. This study gives an overview of the impacts of AWBs and CWBs on surface ozone in eastern China and helps to improve our understanding of summertime ozone pollution in eastern China.
1. Introduction
Tropospheric ozone (O3), a harmful gas for the Earth’s inhabitants, has been a focus of global research for decades [1,2]. Despite the implementation of Phase 2 of the Clean Air Action Plan in 2018, recent studies indicate an increase in ground-level O3 concentrations in China [3]. The primary cause of surface O3 pollution is photochemical generation [4,5]. However, stratosphere-to-troposphere transport (STT) also contributes significantly to this issue [6,7,8].
Studies have shown that Rossby wave breaking (RWB) is one of the most important pathways of STT [9,10,11]. RWB is characterized by a reversal in the gradient of potential vorticity (PV) in the meridional direction, indicating the irreversible exchange of air mass between the stratosphere and troposphere [12,13,14]. The occurrence of RWB is associated with the transport of momentum between transient eddies and mean flow, and is accompanied by the equatorward or poleward shift of a westerly jet [15,16]. RWBs can be categorized into two types based on the direction of wind shear: anticyclonic wave breakings (AWBs) and cyclonic wave breakings (CWBs) [17,18]. Previous studies have shown that wave activity fluxes can be used to distinguish between AWBs and CWBs, i.e., AWBs are accompanied by southward wave activity fluxes, while CWBs are accompanied by northward fluxes [15,16]. CWBs with equatorward asymmetry often form strong cut-off lows downstream [19], and the equatorward AWBs may also accompany the cut-off lows and tropopause foldings [13]. Through these processes, O3 can be transported from the stratosphere to the troposphere [20,21]. Research shows that AWBs and CWBs can account for 20–30% of elevated O3 in the upper troposphere and lower stratosphere region [14], and the regions with the highest frequency of RWB occurrence coincide with the regions with the strongest STT [9]. During violent atmospheric fluctuations, RWB-induced STT may penetrate deep into the troposphere, and sometimes even reach ground level and elevate the concentration of surface O3 through processes such as turbulent mixing, frontal circulation, and rain showers [22,23,24,25].
In China, several experiments and case studies have been conducted to gain insight into the impact of RWB on ground-level O3 through STT [20,24,26,27]. With advancements in satellite data algorithms, there has been a significant improvement in the visualization of the distribution and changes in O3 concentrations from the stratosphere to the troposphere. Since 2013, observational datasets from ground monitoring sites have become available in China, enriching the available data to understand the effect of RWB on surface O3 concentration on a larger spatiotemporal scale and with more precision. The North China Plain (33–40°N, 113–122°E) and Yangtze River Delta (30°N, 121°E) in eastern China are areas where O3 pollution is particularly severe [5]; therefore, it is essential to study the effect of RWB-related STTs in these regions, including the location, frequency, and amount of O3 concentration increase they can cause. Previous studies have shown that RWB occurs frequently in both boreal spring (MAM) and summer (JJA) [28,29]. However, the summer season, characterized by higher ground-level O3 concentrations due to more intense photochemical reactions [30,31], experiences more frequent O3 pollution events [5,32]. Therefore, it is worth exploring how much of the summertime ground-level O3 concentration can be attributed to RWB-related STTs.
This study has two main purposes. Firstly, we seek to identify regions with a higher probability of RWB, and the frequency of its occurrence, particularly how it impacts eastern China. Secondly, the study aims to analyze the mechanisms behind RWB-related STTs and to quantify the impacts. We utilized MERRA-2 (the Modern-Era Retrospective analysis for Research and Applications, Version 2) reanalysis data to diagnose RWB and perform meteorological field analysis. Additionally, we also conducted CAM-chem (The Community Atmosphere Model with chemistry) experiments to obtain the simulated stratospheric ozone (O3S), which can help us evaluate the impact of STT processes together with the satellite ozone data from AIRS (Atmospheric Infrared Sounder) and ground-level ozone observations. This article is structured as follows: Section 2 provides detailed information on the datasets used and the objective RWB diagnosis method. Section 3 includes case studies of an AWB and a CWB event, along with a composite analysis of the impact of all the RWB-related STTs on summertime O3 concentrations in eastern China (28–40°N, 112–123°E) between 2013–2020. Finally, Section 4 presents the conclusions and discussions.
2. Data and Methods
2.1. Data
2.1.1. Site Monitoring Data
The Ministry of Ecology and Environment (MEE) of the People’s Republic of China provides hourly pollutant concentrations observed at over 1400 sites across China, including ozone, nitrogen dioxide, carbon monoxide, and sulfur dioxide, and particulate matters with an aerodynamic diameter less than 2.5 µm, which can provide information on overall and detailed changes in pollutants. In this study, we averaged the data from monitoring sites within the same city and ultimately obtained a time series of ozone pollution for over 360 cities. Then, we used nighttime average (20:00 p.m.–07:00 a.m. local time) O3 concentrations from 2013 to 2020 (JJA) to analyze the impact of RWB events on ground-level O3.
2.1.2. Satellite Data
Three-dimensional O3 dataset from Atmospheric Infrared Sounder (AIRS) Version 7 Level 3 standard daily product (JJA, 2013–2020) was used in this study to understand the vertical transport of O3. This product has 24 pressure levels from 1000 hPa to 1 hPa with a horizontal resolution of 1.0° × 1.0°, which can provide detailed global distribution and changes in ozone concentrations in the whole atmosphere [33]. AIRS have been used to study the distribution and transport of tropospheric ozone, and its relationship with other atmospheric constituents [34,35]. This dataset has ascending and descending orbits corresponding to local daytime and nighttime, respectively. We used the descending orbits in this study to minimize the influence of daytime solar radiation. The satellite data may contain missing values caused by factors such as cloud cover, instrument issues, orbits and scan lines, and other sources, resulting in blanks in Figures 4 and 7.
2.1.3. Reanalysis Data
The meteorological fields used in this study were from MERRA-2 (The Modern-Era Retrospective analysis for Research and Applications, Version 2), including horizontal wind (U and V), vertical velocity (Omega), temperature, radiation flux, and geopotential height (GpH). MERRA-2 assimilates a wide variety of observational datasets, including satellite-based observations of atmospheric temperature, water vapor, aerosols, clouds, and winds, as well as in situ measurements from radiosondes, aircraft, and surface weather stations [36]. It also incorporates information from reanalysis products and forecast models to produce a comprehensive and high-resolution picture of the Earth’s atmospheric conditions. The data we retrieved have 42 pressure levels from 1000 hPa to 0.1 hPa with 1.25° × 1.25° horizontal resolution, covering JJA from 2013 to 2020 (daily means). Potential vorticity (PV) and wave activity flux (T-N flux) [37] we used in this study were calculated using this dataset.
2.2. Method
2.2.1. Model Simulations
To investigate the impact of stratospheric intrusions related to RWB, we conduct simulations using CAM-chem (Chemical Lagrangian Model of the Stratosphere), a component of the NCAR Community Earth System Model (CESM) version 2.2.0 [38]. The simulations were performed for boreal summers in 2013–2020, using the specified dynamics mode, within which the meteorological fields were forced by MERRA-2. The default meteorology for the specified dynamics was MERRA2 with 56 levels. However, as described in the CAM-Chem Wiki (https://wiki.ucar.edu/display/camchem/Meteorology (accessed on 1 April 2023)), MERRA2 regridded to the CESM2, 32-layer grid could produce better results because the internal model physics were consequently better aligned with the nudged meteorology. Therefore, we used 32-layer specified dynamics in this study. The horizontal resolution of the model was 0.9° × 1.25°. O3S is a variable that represents the stratospheric ozone tracer and can be simulated by CAM-chem. To verify the accuracy of the simulated O3S, we compared the distribution of O3 from AIRS and O3S on 300 hPa (Figure S1). Here, 300 hPa is a layer located in the upper troposphere close to the tropopause, where the ozone concentrations are basically considered to come from the stratosphere. The pattern of O3S and O3 is relatively consistent, which means CAM-chem can properly simulate the change in stratospheric ozone. In this study, we primarily used O3S to analyze the influence pattern and quantify the contribution of STT.
2.2.2. Diagnosis of RWB
The diagnostic method of RWB used in this study was mainly based on the method of Gabriel and Peters [16]. Initially, we calculated the isobaric PV using U, V, and T and interpolated the results to the isentropic levels. Subsequently, we identified regions with negative meridional PV gradients (PVy, hereafter), as RWB is indicated by the meridional overturning of isentropic PV. We then used the sign of meridional T-N flux (Fy, hereafter) to distinguish between AWBs and CWBs, as AWBs are usually accompanied by equatorward transport of Fy (negative sign), while CWBs are accompanied by poleward flux (positive sign) [15,39]. We limited the calculation area to to avoid false signals in the tropics. To filter out small-scale disturbances, we performed nine-point smoothing on PV, and PVy needed to conform to this formula: (where represents the zonal mean of PV). It is worth noting that we used a threshold of 0.2 instead of 0.05 as in the paper of Gabriel and Peters because of the different horizontal resolutions of our data. As for the Fy fields used to differentiate between AWB and CWB, we performed a nine-point smoothing and used the averages of 100–400 hPa, and required to have a strong enough distinction. Finally, to ensure that the calculated RWB was not a tiny-scale disturbance, on the basis of the above, we added the condition that RWB needed to cover an area greater than 5° × 2.5° (longitude × latitude) to be counted as an event.
Gabriel and Peters previously studied RWB during DJF in the Northern Hemisphere, using PV of 330 K for their calculations. To validate our results, we also calculated RWB frequency during DJF and compared it to their findings, as shown in Figure S2. Furthermore, we compared our calculated frequency distributions with those of other studies, which exhibited relatively good agreement (not shown). In this study, as the focus of our research was RWB during JJA, we determined that using PV of 350 K was a more appropriate choice for our calculations [13,40].
2.2.3. Selection of RWB Events
As a planetary-scale process, RWB has a wide range of impacts. The areas that may be affected by RWB-triggered STT are not limited to the areas where RWB occurs. Therefore, to focus on eastern China, it is important to determine which areas where RWB occurs are most likely to have a significant impact on eastern China. Figure 1 shows the correlation coefficients between the area-average O3S concentrations in eastern China and the monthly frequency of AWBs and CWBs, respectively. The blue boxes highlight regions with high correlation coefficients, suggesting that RWBs occurring in these regions are most likely to affect eastern China. Among the selected regions, we chose RWB events with the top 25% coverage for the subsequent analysis.
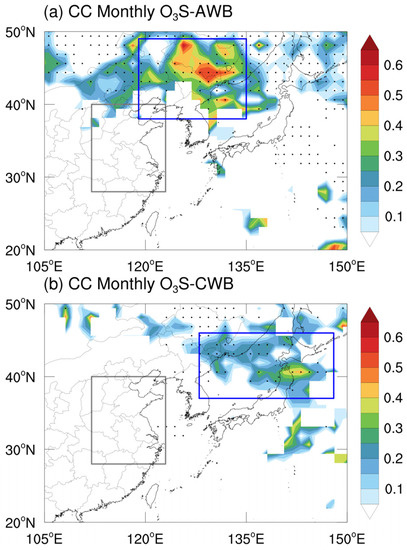
Figure 1.
Horizontal distribution of correlation coefficients between regional monthly averaged O3S (CAM-chem) and frequency of AWBs (a) and CWBs (b) in eastern China, and only the areas that correlation coefficients passed the significance test (95%) are filled. The black dots mark areas that the frequency of RWBs exceeds 5. The gray rectangles outline eastern China. The blue rectangles indicate the regions that have both high correlation coefficients and a high frequency of RWBs.
2.2.4. Calculation of Anomalies and Significant Test
To calculate the anomalies for variables, the 2013–2020 JJA (June–July–August) monthly means were first computed and taken as the climatology. The anomalies were then calculated for each day of the study period by subtracting the corresponding monthly mean from the exact daily values. This resulted in a time series of anomalies representing the deviation of each event from the long-term average.
To determine the statistical significance of the anomalies, Student’s t-test was used. The null hypothesis was that the values were not significantly different from climatological means, while the alternative hypothesis was that the values were statistically significant. The t-test was performed on each selected event day’s values using a significance level of 0.05. If the p-value was less than 0.05, the null hypothesis was rejected, and the values were considered statistically significant.
3. Results
3.1. Case Studies of STT Associated with the RWB
Before conducting a comprehensive analysis of RWB events, we first examined two typical STT cases triggered by RWB and sought to understand their mechanisms. Using the methods described in Section 2.2, we selected two STT cases related to an AWB event and a CWB event, respectively. The following section presents a detailed analysis of these cases.
3.1.1. Case 1: AWB-Induced STT during 2 to 5 July 2015
Figure 2 displays the PV anomalies at 350 K and O3 anomalies on different altitude layers for Case 1. The high PV anomalies in Figure 2a indicate the occurrence of stratospheric intrusions above northeast China and the Korean Peninsula. At the same time, the wide range of negative PVy and southward T-N flux demonstrate that this event was a relatively strong AWB. Along with stratospheric intrusion, there was a significant enhancement of O3S and O3 in the corresponding regions (Figure 2b,c). This enhancement extended to the lower troposphere (850 hPa) in both model simulations and satellite observations (Figure 2d,e). Notably, the observed nighttime O3 concentration at the surface also had a noticeable increase in eastern China (Figure 2f), reaching about 15 ppbv at most sites.
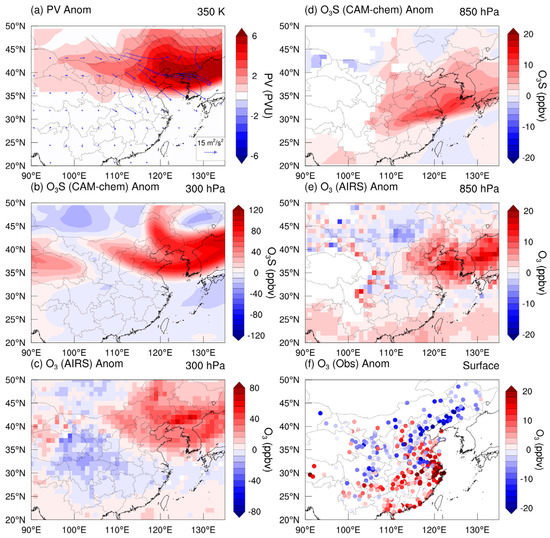
Figure 2.
Composition fields for Case 1 during 2 to 5 July 2015. (a) PV anomalies at the 350 K isentropic layer. The regions shaded by slashes indicate PVy < 0. The blue vectors show the horizontal T-N flux at 300 hPa. (b,c) O3S anomalies from CAM-chem at 300 hPa and 850 hPa. (d,e) O3 anomalies from AIRS at 300 hPa and 850 hPa. (f) Observed nighttime O3 anomalies at the surface.
Further analysis of the meteorological fields shown in Figure 3 provides additional insight into this process. From 30 June, a strong low-pressure system, initially located north of 50°N, started to develop southward, reaching its southernmost extent on 2 July (Figure 3a). Simultaneously, the formation of an AWB was observed in the PV field (not shown). As a result of the converging horizontal wave fluxes in northeastern China (Figure 3e–h), the low-pressure system above northeastern China gradually weakened and dissipated, while a small high-pressure system, originally located near 45°N, 110°E, moved southeastward and evolved into an anticyclone over eastern China by 5 July (Figure 3a–d). This atmospheric circulation pattern led the westerlies flowing cyclonically around the low-pressure system near 40°N, 120°E and moving away from it. Then, the flows created a region of divergence where air masses spread out and subsequently formed a stable sinking area over eastern China (Figure 3e–h). The downward flow resulted in clear skies and dry weather, as shown in Figure S3 (left panels); NCP had larger incoming shortwave radiation fluxes during this event. However, even though eastern China had the highest O3 and O3S anomalies (Figure 2b,c), there were no significant positive anomalies in incoming solar radiation and it experienced cooler temperature throughout the period (Figure S3, middle panels). During 4 to 5 July, there was even less incoming radiation, which led to lower O3 production rates (Figure S3, right panels). Despite this, the O3 concentrations in eastern China remained high during this event, and Figure S4 clearly illustrates the accumulation of O3 in this area.
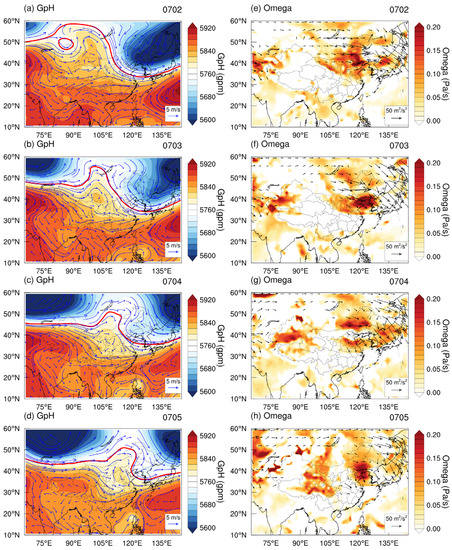
Figure 3.
Time evolution of meteorological fields for Case 1. Left: Distribution of geopotential height (shaded) and horizontal wind (blue vectors) at 500 hPa from 2 to 5 July 2015 (a–d). The red lines represent the contour of 5770 gpm. Right: Distribution of Omega anomalies (shaded) at 500 hPa and horizontal T-N flux (vectors) at 300 hPa from 2 to 5 July 2015 (e–h). The vectors are drawn only in regions that the fluxes are larger than 15 m2/s2.
To better understand the vertical movements, we presented the vertical transection of O3 and wind anomalies during Case 1 in Figure 4. It is important to note that the transections were taken along the red lines in Figure 3a–d, which means the arrows pointing to the right do not always represent westerly wind. By combining Figure 3 and Figure 4, it is evident that from 2 to 5 July, there was a continuous stratosphere-to-troposphere O3 transport pathway, resulting in the accumulation of O3 over 120°E. Furthermore, due to the appearance of a closed anticyclone over eastern China on 5 July, the sinking air current split into two branches near 120°E, one continuing eastward and the other joining the small high-pressure system (Figure 3d). This caused the local transport and dispersion of O3 in eastern China, and could responsible for the high O3 concentrations in southern China. In summary, this STT process was triggered by an AWB event in northeast China. As the wave energy propagated and AWB dissipated, a stable pathway for STT formed over eastern China, persisting for 4 days and causing an average increase of approximately 10–15 ppbv in ground-level O3 concentrations in eastern China during this period.
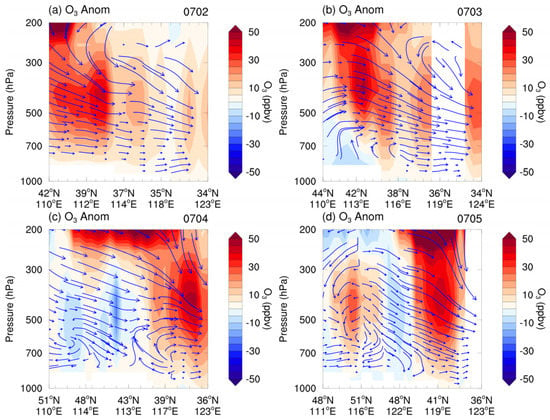
Figure 4.
Vertical transection of ozone anomalies (shaded, from AIRS) and wind (vectors, from MERRA2) for Case 1 from 2 to 5 July 2015 (a–d). The transections were taken along the contour line at 5770 gpm, which are outlined by red lines in the right panels in Figure 3. The vertical velocities are multiplied by 50 times.
3.1.2. Case 2: CWB-Induced STT during 30 to 31 August 2016
The average PV and O3 anomalies during Case 2 are presented in Figure 5. The widespread negative PVy and the positive Fy in northeast China suggest that this is a CWB event (Figure 5a). In the upper troposphere (350 K), regions with significant positive PV anomalies appear as a band from Inner Mongolia to the Sea of Japan. These areas also exhibited high O3S and O3 anomalies (Figure 5b,c), indicating the occurrence of STT. In the lower troposphere, the area impacted by this STT process was considerably larger, encompassing nearly the entire eastern and southern regions of China (Figure 5d,e). Correspondingly, the ground-level observations of O3 also demonstrated high concentrations (Figure 5f). The evolution of meteorological fields shown in Figure 6 sheds light on the development of this process. On 28 August, there was a strong high-pressure system in southwestern China, while the cut-off low was situated over the Korean Peninsula. In the following days, the high in southwestern China weakened while the cut-off low deepened gradually (Figure 6b–d). Vectors in Figure 6e–h show that a strong wave train emanated from the cut-off low and propagated toward the northeast, which corroborated the occurrence of a CWB event and was responsible for the deepening of the cut-off low and the strengthening of the high near 50°N, 145°E. Combining the left and right panels in Figure 6, it can be seen that the southwest side of the low-pressure system exhibited clear positive omega anomalies, indicating constant downward transport of the air masses. The sinking areas experienced higher solar radiation fluxes, but lower temperature (Figure S5), which was likely due to the passage of a front during the formation and development stages of the cut-off low, resulting in cooler but clearer weather. Ozone production rates in the entire southern and eastern China were slightly lower than the common condition (Figure S5, right panels), which means the significantly high O3 concentrations here might not have been caused by more intense photochemical reactions. Such STT processes triggered by a cut-off low were observed by Song et al. Their study showed that the column concentrations of ozone increased significantly when the cut-off low occured [41].
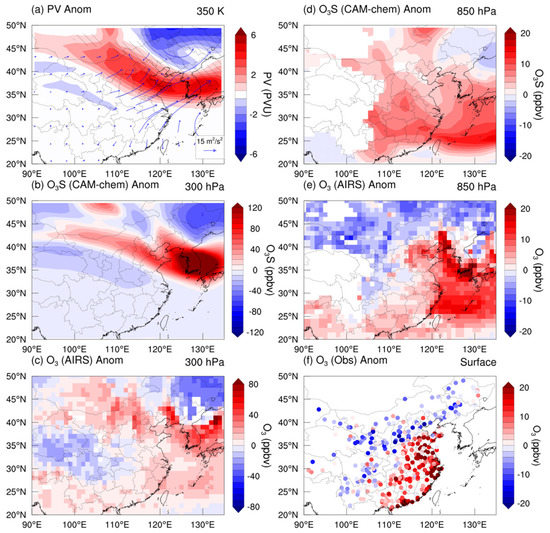
Figure 5.
Composition fields of Case 2 during 30 to 31 August 2016. (a) PV anomalies at the 350 K isentropic layer. The regions shaded by slashes indicate PVy < 0. The blue vectors show the horizontal T-N flux at 300 hPa. (b,c) O3S anomalies from CAM-chem at 300 hPa and 850 hPa. (d,e) O3 anomalies from AIRS at 300 hPa and 850 hPa. (f) Observed nighttime O3 anomalies at the surface.
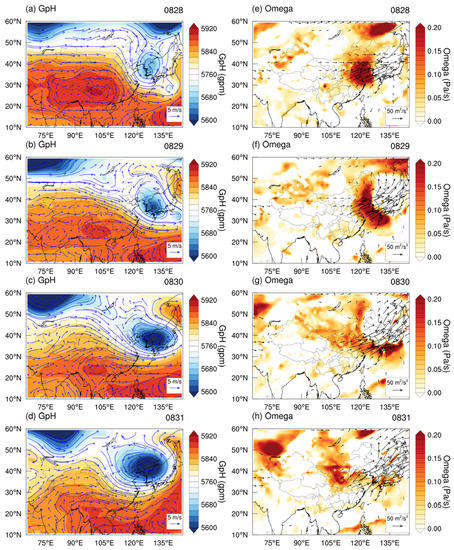
Figure 6.
Time evolution of meteorological fields for Case 2. Left: Distribution of geopotential height (shaded) and horizontal wind (blue vectors) at 500 hPa from 28–31 August 2016 (a–d). Right: Distribution of Omega anomalies (shaded) at 500 hPa and horizontal T-N flux (vectors) at 300 hPa from 28–31 August 2016 (e–h). The vectors were drawn only in regions where the fluxes were larger than 15 m2/s2.
The dynamic movements of this STT process can be observed clearly from the transections shown in Figure 7. From 105°E to 120°E, there was a continuous downward and eastward flow of air, transporting O3-rich air into the lower troposphere and leading to O3 enrichment in eastern China. The accumulation of ground-level O3 is demonstrated clearly through the time evolution in Figure S6. Based on the above discussion, we conclude that Case 2 was a CWB-induced STT process affecting both eastern and southern China, with ground-level O3 concentrations rising by about 10–15 ppbv.
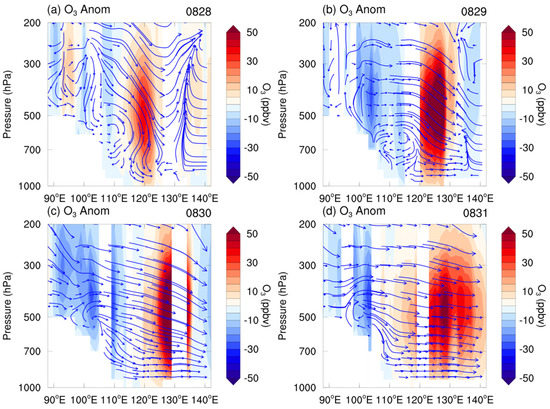
Figure 7.
Vertical transection of ozone anomalies (shaded, from AIRS) and wind (vectors, from MERRA2) for Case 2 from 28–31 August 2016 (a–d). The transections are taken along the 35°N. The vertical velocities are multiplied by 50 times.
3.2. Impact of RWB Events on Ground-Level O3 in Eastern China
Using the method described in Section 2.2.3, we identified a total of 33 AWB events and 18 CWB events that had the potential to impact eastern China during the boreal summer (JJA) from 2013 to 2020. These events were analyzed using a composite approach and the results are presented in the following section.
3.2.1. Impact of AWB Events
Figure 8 depicts the averaged data fields of the 33 selected AWB events. The distribution of PV anomalies and horizontal wave fluxes is presented in Figure 8a, where the regions with positive PV anomalies displayed an overall northeast-southwest orientation, accompanied by southward wave fluxes. In the upper troposphere, the simulated O3S (Figure 8b) and satellite O3 (Figure 8c) in the corresponding areas were significantly high, suggesting that the O3-rich stratospheric air was transported into the troposphere through strong stratospheric intrusions. The distribution of the O3S and O3 on 850 hPa (Figure 8d,e) also showed high anomalies in eastern China, which indicated the STTs were strong enough to reach the lower troposphere. At the same time, nighttime ground-level O3 concentrations in eastern China increased by an overall average of 5–10 ppbv (Figure 8f). Given that the observed O3 anomalies corresponded well with the high O3S anomalies, it is likely that STT played a significant role in the rise in ground-level O3 concentrations.
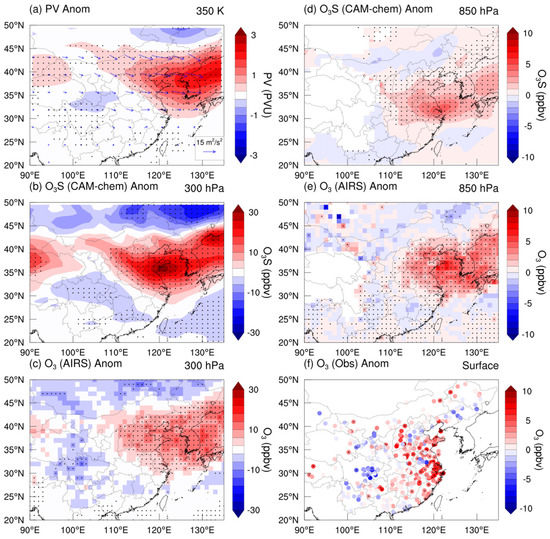
Figure 8.
Horizontal distribution of composited PV, O3, and O3S anomalies for all selected AWB events (33 days in JJA 2013–2020). (a) PV anomalies at the 350 K isentropic layer (shaded) and horizontal T-N flux at 300 hPa (vectors). (b,d) O3S anomalies from CAM-chem at 300 hPa and 850 hPa. (c,e) O3 anomalies from AIRS at 300 hPa and 850 hPa. (f) Observed nighttime O3 anomalies at the surface. The black dots mark areas where the anomalies passed the significance test (95%) in each panel.
Figure 9 illustrates the meteorological fields associated with the selected AWB events. The southward T-N flux displayed in Figure 9b confirms the occurrence of AWBs over northeastern China. The distribution of stream function in the upper troposphere shows anticyclonic anomalies in northern China and cyclonic anomalies near the Sea of Japan, which results in weakening of the westerlies near 40–50°N and strengthening of the westerlies on both the south and north sides (Figure 9a). As a consequence, the westerlies weaken over eastern China and bend cyclonically (Figure 9c). Simultaneously, the corresponding regions exhibit positive anomalies of Omega (Figure 9d), indicating the formation of the STT pathway. Figure 9e shows higher incoming solar radiation fluxes near the Shandong Peninsula (38°N, 120°E) due to the presence of downward flow, but O3 production rates in the whole eastern China decelerated slightly (Figure 9f). This suggests that photochemical generation of O3 was not the primary cause of the high ground-level O3 concentrations observed. Additionally, the ground-level O3 observations in Figure 8f represent nighttime averages, which partially circumvented the effects of daytime O3 photochemical generation. Therefore, we conclude that STT was the main cause of the increase in surface O3 in eastern China during the selected AWB events.
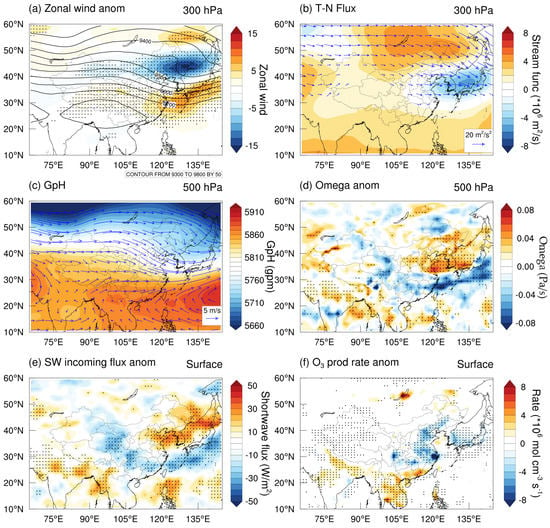
Figure 9.
Horizontal distribution of composited anomalies of meteorological fields from MERRA-2 for all selected AWB events (33 days in JJA 2013–2020). (a) Zonal wind anomalies (shaded) and GpH (contour) at 300 hPa. (b) Horizontal T-N flux (vectors) and stream function (shaded) at 300 hPa. (c) GpH (shaded) and wind (vectors) at 500 hPa. (d) Omega anomalies at 500 hPa. (e,f) Surface incoming shortwave flux and ozone production rate anomalies. The black dots in (a,d,e) and (f) mark areas that the anomalies passed the significance test (95%). The vectors in (b) are drawn only in regions where the fluxes are larger than 5 m2/s2.
In summary, we conducted a composite analysis of 33 stronger AWB events occurring in the boreal summers of 2013–2020 using the distribution of tropospheric O3 and meteorological fields. The results suggest that these strong AWBs were accompanied by deep STTs, leading to a significant rise in O3 concentrations within the troposphere. Additionally, the ground-level O3 concentrations exhibited an overall increase of 5–10 ppbv during these events. While the higher O3 concentration in the North China Plain may be partially attributed to solar radiation enhancement, the elevated O3 concentrations in eastern China, including the Yangtze River Delta, were primarily caused by STT processes.
3.2.2. Impact of CWB Events
Compared with AWB, CWB occurred less frequently, with only 18 stronger events selected for analysis during the boreal summer of 2013–2020. As shown in Figure 10a, positive anomalies of PV during CWBs exhibit an overall northwest−southeast distribution and are accompanied by northward propagating wave fluxes. The high simulated O3S and observed O3 anomalies in the regions where CWBs occur, as demonstrated in Figure 10b,c, indicate that STT processes were triggered by these CWBs. The distributions of O3S and O3 anomalies in Figure 10d,e reveal that O3 concentrations were elevated by those STT processes throughout the entire eastern and southern China in the lower troposphere. Figure 10f shows significant positive ground-level O3 anomalies in both coastal areas of southeastern China and central China, which matched well with the distribution of positive O3S anomalies in Figure 10d. Thus, we conclude that STT processes triggered by CWB events played an important role in the rise in ground-level O3 concentrations.
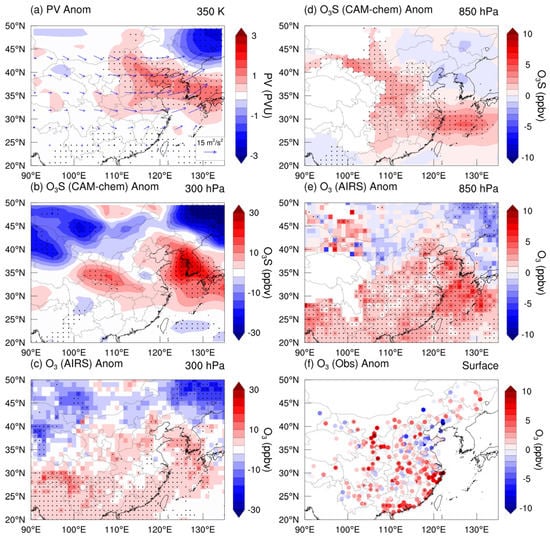
Figure 10.
Horizontal distribution of composited PV, O3, and O3S anomalies for all of theselected CWB events (18 days in JJA 2013–2020). (a) PV anomalies at the 350 K isentropic layer (shaded) and horizontal T-N flux at 300 hPa (vectors). (b,d) O3S anomalies from CAM-chem at 300 hPa and 850 hPa. (c,e) O3 anomalies from AIRS at 300 hPa and 850 hPa. (f) Observed nighttime O3 anomalies at the surface. The black dots mark areas where the anomalies pass the significance test (95%) in each panel.
Figure 11 shows the averaged meteorological fields for CWB events. Similar to the circulation fields of the AWBs (Figure 9), anticyclonic anomalies in the north (50°N) and cyclonic anomalies in the south (35°N) led to a significant weakening of the westerlies around 40°N, which implied enhanced north-to-south transport, including the transport of airflow and wave energy fluxes. The cyclonic bending of the westerlies, accompanied by strong sinking, was the pathway of STT (positive omega in Figure 11c,d), which was also the mechanism of STT processes in CWB events.
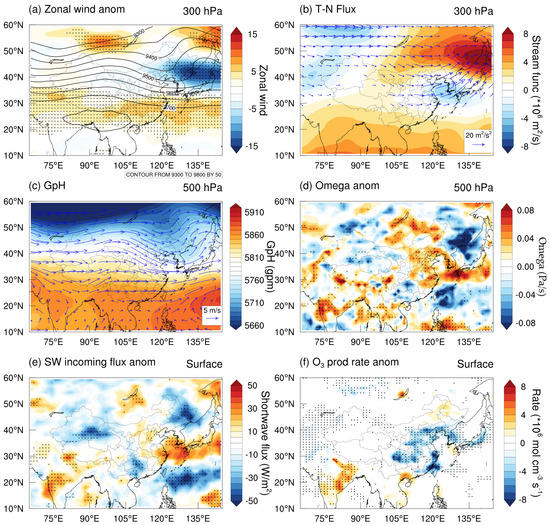
Figure 11.
Horizontal distribution of composited anomalies of meteorological fields from MERRA-2 for all selected CWB events (18 days in JJA 2013–2020). (a) Zonal wind anomalies (shaded) and GpH (contour) at 300 hPa. (b) Horizontal T-N flux (vectors) and stream function (shaded) at 300 hPa. (c) GpH (shaded) and wind (vectors) at 500 hPa. (d) Omega anomalies at 500 hPa. (e,f) Surface incoming shortwave flux and ozone production rate anomalies. The black dots in (a,d,e) and (f) mark areas that the anomalies pass the significance test (95%). The vectors in (b) are drawn only in regions where the fluxes are larger than 5 m2/s2.
The anomalies of incoming solar radiation flux and O3 production rate during CWB events are presented in Figure 11e and Figure 11f, respectively. We can observe that during CWB events, there was almost no considerable increase in the incoming solar radiation fluxes, but there were notable decelerations in the ozone production rates in most areas. Additionally, we used the nighttime average O3 concentrations in Figure 10b to minimize the effect of daytime radiation. Therefore, we conclude that the effect of photochemical generation was not significant, and the increase in ground-level O3 concentration during CWB events was mainly caused by STT.
4. Discussion and Conclusions
RWB events have the potential to trigger strong STT processes, which can lead to increases in tropospheric O3 concentrations. To investigate these events, we analyzed observational data, including ground-based observations and satellite data, for RWB events that occurred in East Asia during JJA of 2013–2020. We first analyzed two typical individual cases (one AWB and one CWB event) that may have had an impact on eastern China, and then conducted a composite analysis of all the strong AWB and CWB events. Based on our study, the conclusions are presented as follows:
- (1)
- A total of 33 AWB events and 18 CWB events were selected for analysis, revealing that AWB events occurred more frequently. Strong AWB events occurred at a frequency of four per season, while strong CWB events occurred at a frequency of two per season. These findings are consistent with the study by Jing et al. [9].
- (2)
- Figure 12a illustrates the mechanism of STT triggered by AWB events. In the case of AWBs, the PV aloft appeared as a high tongue extending from the northeast to the southwest, while wave activity fluxes headed southeast with southward components. Positive GpH anomalies emerged at anticyclonic bending points of the PV contour, indicating positive anomalies of the stream function. Downstream, negative GpH anomalies emerged where the high PV tongue went deeper. When this synoptic situation occurred over northeast China (the blue box in Figure 12a), the original westerly baseflow turned southward over eastern China, followed by a cyclonic bend, and then continued eastward. Strong downward air flow was present at the location where the westerly jet bent cyclonically, guiding the STT and ultimately leading to the elevation of ground-level O3 concentrations in eastern China.
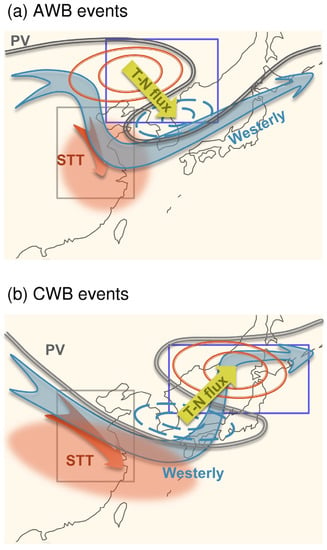 Figure 12. Schematic diagrams of AWB (a) and CWB (b) events and the subsequent STT processes. The gray lines indicate the PV contours. Green, blue, and red arrows denote the direction of horizontal T-N flux, westerly jet, and STT, respectively. The red and blue circles represent regions with positive and negative GpH anomalies, respectively. The gray and blue rectangles are the same as those in Figure 1.
 - (3)
- The mechanism and impact of STT triggered by CWB events differed from those of AWB. CWBs occurring near the Sea of Japan were more likely to have the potential to affect eastern China (blue box in Figure 12b). When CWB events occurred, the high tongue of PV extended from northwest to southeast, and potential height anomalies were mainly in the vicinity of the Sea of Japan. The wave activity flux had a northward meridional component within the region where CWB occurred. As a result of the wide cyclonic circulation from Mongolia to the East China Sea, the sinking region covered a large area and could lead to a more widespread increase in ground-level O3 concentrations under regional transport and diffusion.
- (4)
- STT processes triggered by strong AWB and CWB events could transport O3-rich air deeply into the lower troposphere, resulting in an average elevation of 5–10 ppbv ground-level O3 concentrations in eastern China.
These results suggest that the impacts of AWBs and CWBs on atmospheric circulation and air quality are regionally significant and should be considered in future climate and air quality modeling efforts.
Supplementary Materials
The following supporting information can be downloaded at: https://www.mdpi.com/article/10.3390/rs15102647/s1, Figure S1: Horizontal distribution of O3 from AIRS (left) and O3S simulated by CAM-chem (right) on 300 hPa on 2nd July, 2015; Figure S2: Left Long-term means of meridional fluxes Fy at 330 K in DJF, with (upper panel) positive and (lower panel) negative values, each restricted to areas of negative meridional PV gradient (PVy < 0), which can reveal the areas that CWB and AWB occur and the frequency (Gabriel and Peters, 2008). Right CWB (upper panel) and AWB (lower panel) frequency at 330 K in DJF 1980–2020 calculated in our work; Figure S3: Time evolution of surface incoming shortwave radiation flux (left panels), surface temperature anomalies (middle panels) and surface O3 production rate anomalies (right panels) for Case 1 from July 2nd to 5th, 2015; Figure S4: Time evolution of surface ozone anomalies for Case 1 from July 2nd to 5th, 2015. Left Daily mean ozone anomalies. Right Nighttime (20:00–07:00 local time) ozone anomalies; Figure S5: Time evolution of surface incoming shortwave radiation flux (left panels), surface temperature anomalies (middle panels) and surface O3 production rate anomalies (right panels) for Case 2 from August 28th–31th, 2016; Figure S6: Time evolution of surface ozone anomalies for Case 2 from August 28th–31th, 2016. Left Daily mean ozone anomalies. Right Nighttime (20:00–07:00 local time) ozone anomalies.
Author Contributions
Conceptualization, W.W. and M.S.; methodology, H.W.; software, J.H. and J.Z.; validation, T.W. and S.Z.; formal analysis, H.W.; writing—original draft preparation, H.W.; writing—review and editing, W.W. and M.S.; supervision, W.W. and M.S. All authors have read and agreed to the published version of the manuscript.
Funding
This research was supported by the National Natural Science Foundation of China (grant nos. 42075055, 41904023, 41974005, and 42174051) and the Fundamental Research Funds for the Central Universities, China University of Geosciences (Wuhan) (grant no. CUG2106357). This work was supported by the open project (KLME202003) from the Key Laboratory of Meteorological Disaster (KLME), Ministry of Education and Collaborative Innovation Center on Forecast and Evaluation of Meteorological Disasters (CIC-FEMD).
Data Availability Statement
O3 site observation data in China are available at https://quotsoft.net/air/ (accessed on 1 January 2021). MERRA-2 reanalysis data are available at https://disc.gsfc.nasa.gov/datasets/M2I3NPASM_5.12.4/summary?keywords=MERRA-2 (accessed on 1 January 2021). Satellite data from AIRS are available at https://disc.gsfc.nasa.gov/datasets/AIRS3STD_7.0/summary?keywords=AIRS (accessed on 1 January 2021).
Acknowledgments
The authors acknowledge the Global Modeling and Assimilation Office (GMAO) at the National Aeronautics and Space Administration (NASA) Goddard Space Flight Center for the MERRA-2 data. The authors acknowledge the use of the Atmospheric Infrared Sounder (AIRS) Version 7 Level 3 data retrieved from the NASA Goddard Earth Sciences Data and Information Services Center (GES DISC).
Conflicts of Interest
The authors declare no conflict of interest.
References
- IPCC. Climate Change: The Physical Science Basis; Cambridge University Press: Cambridge, UK; New York, NY, USA, 2013. [Google Scholar]
- Young, P.J.; Naik, V.; Fiore, A.M.; Gaudel, A.; Guo, J.; Lin, M.Y.; Neu, J.L.; Parrish, D.D.; Rieder, H.E.; Schnell, J.L.; et al. Tropospheric Ozone Assessment Report: Assessment of global-scale model performance for global and regional ozone distributions, variability, and trends. Elem.-Sci. Anthr. 2018, 6, 10. [Google Scholar] [CrossRef]
- Li, K.; Jacob, D.J.; Shen, L.; Lu, X.; De Smedt, I.; Liao, H. Increases in surface ozone pollution in China from 2013 to 2019: Anthropogenic and meteorological influences. Atmos. Chem. Phys. 2020, 20, 11423–11433. [Google Scholar] [CrossRef]
- Xu, Z.; Huang, X.; Nie, W.; Chi, X.; Xu, Z.; Zheng, L.; Sun, P.; Ding, A. Influence of synoptic condition and holiday effects on VOCs and ozone production in the Yangtze River Delta region, China. Atmos. Environ. 2017, 168, 112–124. [Google Scholar] [CrossRef]
- Wang, T.; Xue, L.; Brimblecombe, P.; Lam, Y.F.; Li, L.; Zhang, L. Ozone pollution in China: A review of concentrations, meteorological influences, chemical precursors, and effects. Sci. Total Environ. 2017, 575, 1582–1596. [Google Scholar] [CrossRef]
- Wang, H.; Wang, W.; Huang, X.; Ding, A. Impacts of stratosphere-to-troposphere-transport on summertime surface ozone over eastern China. Sci. Bull. 2020, 65, 276–279. [Google Scholar] [CrossRef]
- Wang, Y.; Wang, H.; Wang, W. A stratospheric intrusion-influenced ozone pollution episode associated with an intense horizontal-trough event. Atmosphere 2020, 11, 164. [Google Scholar] [CrossRef]
- Zhao, K.; Huang, J.; Wu, Y.; Yuan, Z.; Wang, Y.; Li, Y.; Ma, X.; Liu, X.; Ma, W.; Wang, Y. Impact of Stratospheric Intrusions on Ozone Enhancement in the Lower Troposphere and Implication to Air Quality in Hong Kong and Other South China Regions. J. Geophys. Res. 2021, 126, e2020JD033955. [Google Scholar] [CrossRef]
- Jing, P.; Banerjee, S. Rossby Wave Breaking and Isentropic Stratosphere-Troposphere Exchange During 1981–2015 in the Northern Hemisphere. J. Geophys. Res. Atmos. 2018, 123, 9011–9025. [Google Scholar] [CrossRef]
- Appenzeller, C.; Davies, H.C. Structrue of stratopsheric intrusions into the troposphere. Nature 1992, 358, 570–572. [Google Scholar] [CrossRef]
- Holton, J.R.; Haynes, P.H.; McIntyre, M.E.; Douglass, A.R.; Rood, R.B.; Pfister, L. Stratosphere-Troposphere Exchange. Rev. Geophys. 1995, 33, 403–439. [Google Scholar] [CrossRef]
- McIntyre, M.E.; Palmer, T. Breaking planetary waves in the stratosphere. Nature 1983, 305, 593–600. [Google Scholar] [CrossRef]
- Postel, G.A.; Hitchman, M.H. A climatology of Rossby wave breaking along the subtropical tropopause. J. Atmos. Sci. 1999, 56, 359–373. [Google Scholar] [CrossRef]
- Jing, P.; Banerjee, S.; Barrera, M. Impact of Rossby wave breaking on ozone variation in the upper troposphere and lower stratosphere, 1985–2015. Atmos. Environ. 2020, 222, 117122. [Google Scholar] [CrossRef]
- Esler, J.; Haynes, P. Baroclinic wave breaking and the internal variability of the tropospheric circulation. J. Atmos. Sci. 1999, 56, 4014–4031. [Google Scholar] [CrossRef]
- Gabriel, A.; Peters, D. A diagnostic study of different types of Rossby wave breaking events in the northern extratropics. J. Meteorol. Soc. Japan Ser. II 2008, 86, 613–631. [Google Scholar] [CrossRef]
- Thorncroft, C.; Hoskins, B.; McIntyre, M. Two paradigms of baroclinic-wave life-cycle behaviour. Q. J. R. Meteorolog. Soc. 1993, 119, 17–55. [Google Scholar] [CrossRef]
- Akahori, K.; Yoden, S. Zonal flow vacillation and bimodality of baroclinic eddy life cycles in a simple global circulation model. J. Atmos. Sci. 1997, 54, 2349–2361. [Google Scholar] [CrossRef]
- Peters, D.; Waugh, D.W. Influence of barotropic shear on the poleward advection of upper-tropospheric air. J. Atmos. Sci. 1996, 53, 3013–3031. [Google Scholar] [CrossRef]
- Li, D.; Bian, J.; Fan, Q. A deep stratospheric intrusion associated with an intense cut-off low event over East Asia. Sci. China Earth Sci. 2015, 58, 116–128. [Google Scholar] [CrossRef]
- Langford, A.; Senff, C.; Alvarez Ii, R.; Brioude, J.; Cooper, O.; Holloway, J.; Lin, M.; Marchbanks, R.; Pierce, R.; Sandberg, S. An overview of the 2013 Las Vegas Ozone Study (LVOS): Impact of stratospheric intrusions and long-range transport on surface air quality. Atmos. Environ. 2015, 109, 305–322. [Google Scholar] [CrossRef]
- Danielsen, E.F.; Mohnen, V.A. Project Dustorm report: Ozone transport, in situ measurements, and meteorological analyses of tropopause folding. J. Geophys. Res. 1977, 82, 5867–5877. [Google Scholar] [CrossRef]
- Lin, M.; Fiore, A.M.; Cooper, O.R.; Horowitz, L.W.; Langford, A.O.; Levy, H.; Johnson, B.J.; Naik, V.; Oltmans, S.J.; Senff, C.J. Springtime high surface ozone events over the western United States: Quantifying the role of stratospheric intrusions. J. Geophys. Res. 2012, 117, D00V22. [Google Scholar] [CrossRef]
- Ou-Yang, C.-F.; Babu, S.R.; Lee, J.-R.; Yen, M.-C.; Griffith, S.M.; Lin, C.-C.; Chang, S.-C.; Lin, N.-H. Detection of stratospheric intrusion events and their role in ozone enhancement at a mountain background site in sub-tropical East Asia. Atmos. Environ. 2022, 268, 118779. [Google Scholar] [CrossRef]
- Škerlak, B.; Pfahl, S.; Sprenger, M.; Wernli, H. A numerical process study on the rapid transport of stratospheric air down to the surface over western North America and the Tibetan Plateau. Atmos. Chem. Phys. 2019, 19, 6535–6549. [Google Scholar] [CrossRef]
- Ding, A.; Wang, T. Influence of stratosphere-to-troposphere exchange on the seasonal cycle of surface ozone at Mount Waliguan in western China. Geophys. Res. Lett. 2006, 33, L03803. [Google Scholar] [CrossRef]
- Kumar, K.N.; Sharma, S.K.; Naja, M.; Phanikumar, D. A Rossby wave breaking-induced enhancement in the tropospheric ozone over the Central Himalayan region. Atmos. Environ. 2020, 224, 117356. [Google Scholar] [CrossRef]
- Hitchman, M.H.; Huesmann, A.S. A seasonal climatology of Rossby wave breaking in the 320–2000-K layer. J. Atmos. Sci. 2007, 64, 1922–1940. [Google Scholar] [CrossRef]
- Homeyer, C.R.; Bowman, K.P. Rossby wave breaking and transport between the tropics and extratropics above the subtropical jet. J. Atmos. Sci. 2013, 70, 607–626. [Google Scholar] [CrossRef]
- Wang, H.; Ding, K.; Huang, X.; Wang, W.; Ding, A. Insight into ozone profile climatology over northeast China from aircraft measurement and numerical simulation. Sci. Total Environ. 2021, 785, 147308. [Google Scholar] [CrossRef]
- Ding, A.; Wang, T.; Thouret, V.; Cammas, J.-P.; Nédélec, P. Tropospheric ozone climatology over Beijing: Analysis of aircraft data from the MOZAIC program. Atmos. Chem. Phys. 2008, 8, 1–13. [Google Scholar] [CrossRef]
- Li, G.; Bei, N.; Cao, J.; Wu, J.; Long, X.; Feng, T.; Dai, W.; Liu, S.; Zhang, Q.; Tie, X. Widespread and persistent ozone pollution in eastern China during the non-winter season of 2015: Observations and source attributions. Atmos. Chem. Phys. 2017, 17, 2759–2774. [Google Scholar] [CrossRef]
- Susskind, J.; Blaisdell, J.M.; Iredell, L. Improved methodology for surface and atmospheric soundings, error estimates, and quality control procedures: The atmospheric infrared sounder science team version-6 retrieval algorithm. J. Appl. Remote Sens. 2014, 8, 084994. [Google Scholar] [CrossRef]
- Fu, D.; Kulawik, S.S.; Miyazaki, K.; Bowman, K.W.; Worden, J.R.; Eldering, A.; Livesey, N.J.; Teixeira, J.; Irion, F.W.; Herman, R.L. Retrievals of tropospheric ozone profiles from the synergism of AIRS and OMI: Methodology and validation. Atmos. Meas. Tech. 2018, 11, 5587–5605. [Google Scholar] [CrossRef]
- Pagano, T.S.; Payne, V.H. The Atmospheric Infrared Sounder. In Handbook of Air Quality and Climate Change; Springer: Singapore, 2021; pp. 1–13. [Google Scholar]
- Gelaro, R.; McCarty, W.; Suárez, M.J.; Todling, R.; Molod, A.; Takacs, L.; Randles, C.A.; Darmenov, A.; Bosilovich, M.G.; Reichle, R. The modern-era retrospective analysis for research and applications, version 2 (MERRA-2). J. Clim. 2017, 30, 5419–5454. [Google Scholar] [CrossRef] [PubMed]
- Takaya, K.; Nakamura, H. A formulation of a phase-independent wave-activity flux for stationary and migratory quasigeostrophic eddies on a zonally varying basic flow. J. Atmos. Sci. 2001, 58, 608–627. [Google Scholar] [CrossRef]
- Emmons, L.K.; Schwantes, R.H.; Orlando, J.J.; Tyndall, G.; Kinnison, D.; Lamarque, J.F. The Chemistry Mechanism in the Community Earth System Model Version 2 (CESM2). J. Adv. Model. Earth Syst. 2020, 12, e2019MS001882. [Google Scholar] [CrossRef]
- Kunz, T.; Fraedrich, K.; Lunkeit, F. Synoptic scale wave breaking and its potential to drive NAO-like circulation dipoles: A simplified GCM approach. Q. J. R. Meteorolog. Soc. 2009, 135, 1–19. [Google Scholar] [CrossRef]
- Zhang, G.; Wang, Z.; Peng, M.S.; Magnusdottir, G. Characteristics and impacts of extratropical Rossby wave breaking during the Atlantic hurricane season. J. Clim. 2017, 30, 2363–2379. [Google Scholar] [CrossRef]
- Song, Y.; Lü, D.; Li, Q.; Bian, J.; Wu, X.; Li, D. The impact of cut-off lows on ozone in the upper troposphere and lower stratosphere over Changchun from ozonesonde observations. Adv. Atmos. Sci. 2016, 33, 135–150. [Google Scholar] [CrossRef]
Disclaimer/Publisher’s Note: The statements, opinions and data contained in all publications are solely those of the individual author(s) and contributor(s) and not of MDPI and/or the editor(s). MDPI and/or the editor(s) disclaim responsibility for any injury to people or property resulting from any ideas, methods, instructions or products referred to in the content. |
© 2023 by the authors. Licensee MDPI, Basel, Switzerland. This article is an open access article distributed under the terms and conditions of the Creative Commons Attribution (CC BY) license (https://creativecommons.org/licenses/by/4.0/).