Abstract
On 6 February 2023, a devastating doublet of earthquakes with magnitudes of Mw 7.8 and Mw 7.6 successively struck southeastern Turkey near the border of Syria. The earthquake sequence represents the strongest earthquakes in Turkey during the past 80 years and caused an extensive loss of life and property. In this study, we processed Sentinel-1 and GPS data to derive the complete surface displacement caused by the earthquake sequence. The surface displacements were adopted to invert for the fault geometry and coseismic slip distribution on the seismogenic faults of the earthquake sequence. The results indicate that the coseismic rupture of the Turkey earthquake sequence was dominated by left-lateral strike slips with a maximum slip of ~10 m on the East Anatolian Fault Zone (EAFZ) and the Sürgü fault (SF). Significant surface ruptures are recognized based on the geodetic inversion, which is consistent with the analysis of post-earthquake satellite images. The cumulative released moment of the two earthquakes reached 9.62 × 10²⁰ Nm, which corresponds to an event of Mw 7.95. Additionally, the interseismic fault slip rates and locking depths along the central and western segments of the EAFZ were estimated using the high-resolution long-term velocity field. The results reveal significant lateral variations of fault slip rates and locking depths along the central and western segments of the EAFZ. Generally, the estimated fault locking zone showed good spatial consistency with the coseismic fault rupture of the Mw 7.8 shock on the EAFZ. The static coulomb failure stress (CFS) change due to the Mw 7.8 earthquakes suggests that the subsequent Mw 7.6 event was certainly promoted by the Mw 7.8 shock. The stress transfers from the fault EAFZ to the fault SF were realized by unclamping the interface of the fault SF, which significantly reduces the effective normal stress on the fault plane. Large CFS increases in the western Puturge segment of the EAFZ, which was not ruptured in the 2020 Mw 6.8 and the 2023 Mw 7.8 earthquakes, highlight the future earthquake risk in this fault segment.
1. Introduction
The East Anatolian Fault Zone (EAFZ), which lies between the Arabian plate and the Anatolian plateau, is one of the most active transform fault zones in the world, and it accommodates the westward extrusion of the Anatolian plate from the continental collision between the Arabian and Eurasian plates of the Late Miocene (∼11 Ma) [1]. The NE-trending EAFZ intersects the North Anatolian Fault (NAF) at the Karliova triple junction and then extends southwestwards about 700 km to the Kahramanmaras triple junction near Antakya, where it joins the Dead Sea Fault Zone (DSFZ) (Figure 1a) [2]. In geomorphology, the EAFZ is characterized by many distinct strands and splay faults with conjugate fractures and pull-apart basins, exhibiting a very complicated structure among different fault segments [3,4,5]. Geological and geodetic studies suggest that the EAFZ is a major left-lateral strike-slip fault with current slip rates varying between 4 and 10 mm/yr based on different measurement techniques, which is much smaller than the slip rates of 21~25 mm/yr on the NAF [6,7,8]. In the past century, only two large earthquakes (1905 Ms 6.8 and 2020 Mw 6.8) occurred on the EAFZ, indicating a quiescent characteristic of seismic activity in the EAFZ compared to the strong earthquake productivity on the NAF [9]. The space–time distribution of the long-term seismicity indicates that the southwestern segment of the EAFZ shows relatively lower seismicity levels than the northeastern segment, suggesting highly heterogeneous seismic behavior along the EAFZ [2,10]. Many studies suggest that the highly segmented and heterogeneous fault zone of the EAFZ could be related to the geometric complexities, the fault coupling variations, and the low fault maturity [10,11]. However, our understanding of the heterogeneous fault behavior along the EAFZ is still limited due to a lack of well-recorded large earthquakes in this region.
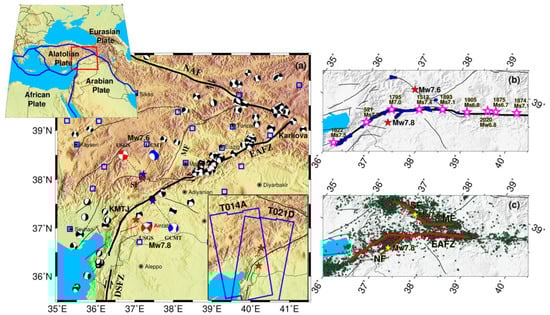
Figure 1.
Tectonic setting of the 2023 Turkey earthquake sequence. (a) The main active faults and historical earthquakes in south-central Turkey. The black solid lines indicate the main active faults. The black beach balls indicate instrumental earthquakes in south-central Turkey with Mw > 4.5 in 1976~2023. The blue and red beach balls denote fault plane solutions of the 2023 Turkey earthquake sequence derived from the GCMT ad USGS, respectively. The blue squares show the locations of GPS stations from the CORS of Turkey. The upper left insert shows the block boundaries near Turkey from Bird [12]. The lower right insert outlines the SAR data coverage of the two Sentinel-1 image pairs. (b) The preliminary surface ruptures (blue squares) of the Turkey earthquake sequence based on analysis of post-seismic satellite data. The pink stars show the location of large historical earthquakes in the EAFZ [4]. Two red stars mark the locations of the epicenters of the earthquake sequence. (c) The aftershock distributions of the 2023 Turkey earthquake sequence derived from Lomax [13]. Abbreviations are: DSFZ: Dead Sea Fault Zone, EAFZ: East Anatolian Fault zone, KMTJ: Kahramanmaras triple junction, MF: Malatya Fault, NAF: North Anatolian Fault, NF: Nurdagi-Pazircik Fault, and SF: Sürgü fault.
On 6 February 2023, a destructive Mw 7.8 earthquake struck south-central Turkey near the Syrian border. The epicenter of the earthquake is located at (37.226°N, 37.014°E) and 10 km deep according to the report of the U.S. Geological Survey (USGS). Approximately nine hours later, an Mw 7.6 earthquake occurred about 100 km away from the north of the epicenter of the first Mw 7.8 shock. The two earthquakes are the strongest earthquake sequence in Turkey in more than 80 years and the fifth-deadliest earthquake of the 21st century, as a total of over 52,000 casualties in Turkey and Syria were caused by the earthquake sequence according to the Disaster and Emergency Management Authority of Turkey [14]. The moment tensor derived from both the Global Centroid Moment Tensor (GCMT) and USGS solutions suggest that the Mw 7.8 shock was driven by oblique left-lateral strike-slip on an NE–SW trend of fault (Figure 1a). For the Mw 7.6 shock, the fault-plane solution indicates that the rupture was predominantly a strike-slip on a nearly EW-trending fault. More than 12,000 aftershocks caused by the Turkey earthquake sequence were recorded using the enhanced, absolute-timing earthquake location procedure (Figure 1c) [15]. Both the rapid moment solutions and relocated aftershocks suggest that the Mw 7.8 event mainly ruptured the western segment of the EAFZ and the Mw 7.6 event mainly failed the Sürgü fault (SF) that represents the northern strand of the EAFZ. This result is consistent with the mapped surface ruptures based on analysis of the post-earthquake satellite images (Figure 1b) [16].
In recent years, the rapid developments of space geodesy technologies, such as the Global Positioning System (GPS) and Interferometric Synthetic Aperture Radar (InSAR), have made it much more convenient to map the surface deformation caused by moderate and large earthquakes [17,18]. For the 2023 Turkey earthquake sequence, both GPS and InSAR measurements provided unprecedented data coverage of the main deformation zone, thus providing a rare opportunity to investigate the characteristics of coseismic fault slip and the heterogeneous fault behavior along the EAFZ. In this paper, we first process the GPS and InSAR observations to derive a complete three-dimensional (3D) displacement of the Turkey earthquake sequence. Then we invert for the coseismic fault slip distribution of the earthquake sequence using the GPS and InSAR measurements. Moreover, we estimate the interseismic fault motion parameters (slip rate and locking depth) along the EAFZ constrained by the recently published high-resolution surface velocity field [19]. Finally, we discuss the heterogeneous fault behavior of the EAFZ and the implication for future seismic hazards.
2. Geodetic Measurements
2.1. GPS Data
We collected high-rate (1 Hz) GPS data from the Continuously Operating Reference Stations of Turkey (CORS-TR), which are located within 300 km of the epicenter of the Mw 7.8 event. The raw GPS data of 25 GPS stations were processed using the open-source PRIDE PPP-AR software based on a precise point positioning ambiguity resolution [20]. In the detailed processing strategy, we used the precise orbit products (sp3) provided by the CODE (Centre for Orbit Determination in Europe) final products to determine the precise satellite orbit and clock parameters. The ionospheric-free combinative observation was adopted to remove the first-order ionospheric effects. The impact of tropospheric delays was corrected using the Saastamoinen model for a priori wet and dry delays [21]. Then the Global Mapping Function (GMF) model was utilized to estimate the residual zenith delays [22]. In the undifferenced processing module, the station coordinates, receiver clocks, zenith tropospheric delay, horizontal tropospheric gradients, and float ambiguity parameters were estimated using the least-squares adjustment method. After this step, the module of integer ambiguity resolution was then used to fix the ambiguities and generate the integer ambiguity parameters. Finally, these integer ambiguities were treated as hard constraints in the parameter estimation process to obtain ambiguity-fixed solutions. Figure 2a–f shows the deformation time series for sites ANTP and MLY1, which are located close to the epicenters of the two earthquakes. Clear horizontal offsets on the two sites could be recognized for both the Mw 7.8 and the Mw 7.6 events, while the vertical offsets for the Mw 7.6 event were not obvious. The coseismic offsets caused by the two events were estimated after fitting the deformation time series before and after the earthquakes separately (Figure 2g,h). The mean uncertainties of the coseismic displacements are 0.53 cm and 0.64 cm for the east and north components, respectively. For the Mw 7.8 event, the maximum displacements occurred on site MLY1 with a movement of 0.3 m along the southwest direction. The coseismic deformation shows significant extension along the E–W direction and contraction along the N–S direction, indicating that the rupture is likely dominated by strike slips along a NE-trending fault. For the Mw 7.6 shock, the site EKZ1 recorded the largest westward displacements with a magnitude of 4.4 m. The westward displacements on the north side of the epicenter and the eastward movements on the south side of the epicenter suggest that the earthquake could be characterized by left-lateral slip on an EW-striking fault, which corresponds well with the moment tensor derived from USGS and GCMT solutions. To make a better comparison with the InSAR measurements that cannot distinguish the independent deformation of the two events, we also calculated the cumulative displacements due to the two earthquakes at ~25 GPS sites that are located close to the epicenters (Figure 2i).
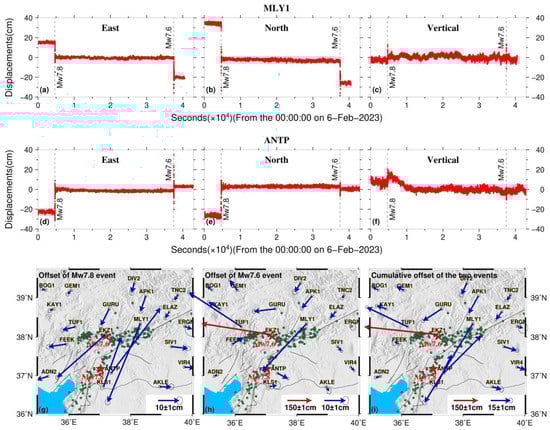
Figure 2.
GPS deformation time series and coseismic horizontal displacements of the 2023 Turkey earthquake sequence. Panels (a–c) and (d–f) show the deformation time series along the east, north, and vertical directions for the sites MLY1 and ANTP, respectively. Panels (g,h) indicate the coseismic horizontal offsets for the Mw 7.8 and Mw 7.6 earthquakes, respectively. The blue and red arrows indicate the coseismic horizontal displacements. Panel (i) shows the cumulative coseismic horizontal offsets due to the two earthquakes. The error ellipse indicates the 95% confidence interval.
2.2. InSAR Data
The utilization of InSAR observations to monitor the surface deformation due to moderate and large earthquakes has become routine in recent decades [23,24]. As the C-band SAR constellation in the European Copernicus program operated by the European Space Agency (ESA), Sentinel-1A/1B has become the major SAR data source for regular earth observations thanks to its global data coverage and friendly data policy. After the Turkey earthquake, we quickly collected the Sentinel-1A SAR data through the ESA data hub interface. There are two tracks flying over the epicenters of the earthquake sequence (T014A and T021D). The details of the interferometry pair used in this study are listed in Table 1. For the ascending track (T014), the master and slave images were acquired on 28 January 2023 and 9 February 2023 with an apart time of 12 days. For the descending track T021, we chose the image pairs on 28 January 2023 and 10 February 2023, respectively. It should be noted that both the ascending and descending image pairs cannot distinguish the deformation due to the Mw 7.8 and Mw 7.6 events even though we chose the interferometric pairs with the shortest temporal baselines.

Table 1.
The parameters of Sentinel-1 image pairs used in the POT processing.
The interferometric pairs were first processed with the traditional two-pass Differential InSAR (DInSAR) method by using the open-source GMTSAR software [25]. In the processing, the topographic phase components were removed using the Shuttle Radar Topography Mission (SRTM) 90 m-resolution digital elevation model [26]. The precise orbit data were released by the ESA to allow the processing of the C-band data. To inhibit the observation noise in the Sentinel-1 images, we adopted a multi-look factor of 20:4 in the range and azimuth direction. We used a weighted power spectrum method to filter the fringes to generate the wrapped interferograms. The parameter of filtering was set as 0.5, a useful value that can generate interferograms with high correlation. We compared the results with the interferograms that adopted low-pass filtering with a two-dimensional Gaussian filter at a 200 m cutoff wavelength. They did not show significant differences. Then, the interferograms were unwrapped using the Minimum Cost Flow algorithm (MCF) in SNAPHU software [27]. The threshold of coherence was set as 0.1. The low-coherence areas were masked out during the unwrapping. Finally, the unwrapped data were projected from the satellite azimuth and range coordinates to the geographic Mercator coordinate system to show the LOS (line-of-sight) range changes (Figure 3a). It can be seen that there are many fringes and areas of decorrelation, which could largely disturb the unwrapping result. Figure 3a shows the unwrapping result of the descending track (T021). Large unwrapping errors can be found, especially in the near field of the source faults. Thus, it might be difficult to obtain accurate surface displacements due to the two earthquakes using the traditional two-pass interferogram. Therefore, the DInSAR results of the Sentinel data were not analyzed and adopted in the source modeling.
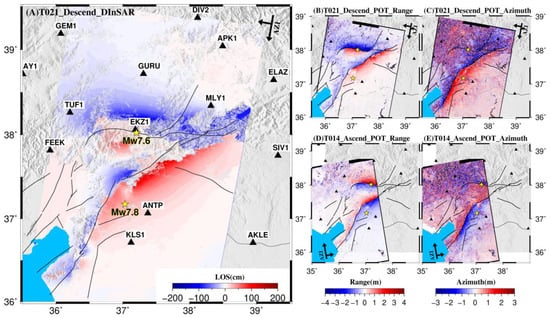
Figure 3.
Cumulative coseismic deformation of the 2023 Turkey earthquake sequence observed by InSAR observations. (A) Coseismic line-of-sight (LOS) displacements of descending track T021 based on the differential InSAR method. The black triangles mark the locations of GPS stations. The yellow stars mark the epicenters of the Mw 7.8 and Mw 7.6 earthquakes. Panels (B,C) show the coseismic deformation of the Turkey earthquake sequence for descending track T021 along the range and azimuth directions using the POT technique. Panels (D,E) show the range and azimuth displacement components of the coseismic deformation for ascending track T014.
The pixel offset tracking (POT) method is another popular technique that has been widely adopted to obtain ground displacements caused by earthquakes and glacier movements [28,29,30]. The POT technique uses the amplitude information of SAR images rather than the phase signal to determine ground displacements in both azimuth and range directions. Therefore, the calculated surface deformation is not influenced by phase coherence and was without the need for phase unwrapping. This method is especially suitable for the Turkey earthquake sequence, as the phase unwrapping process almost failed in the near field of the source fault. The accuracy of POT analysis is largely determined by the pixel size and the quality of image coregistration. Previous studies suggest that the precision of surface displacements derived from the POT method can generally reach 1/10~1/100 of pixel sizes [31,32]. In this study, the POT processing of both the ascending and descending data were conducted by a software package ISCE developed by JPL [33]. In the detail of processing, we first conducted a precise coregistration between the pre-seismic and post-seismic images. The single-look SAR amplitude images were oversampled with a factor of two to guarantee a good coregistration accuracy. Then we employed a matching window with a size of 64 × 64 pixels (~480 m × 480 m on the ground) to determine the range and azimuth offsets.
Figure 3b–e indicate the estimated range and azimuth displacements from the descending track (T021) and ascending track (T014), respectively. The POT analysis succeeded in measuring the ground displacements near the fault traces, although the ascending image (T014) only covered part of the deformation zone. The most notable feature of the range displacements was the sharp color discontinuities over a length of ~280 km for the Mw 7.8 event and a length of ~100 km for the Mw 7.6 event. The ground movements on either side of the source faults of the two earthquakes showed opposite directions. For the descending track (T021), negative displacements along the range direction, which means moving away from satellites, appeared on the northern wall of the source faults. The positive value of range displacements (moving towards the satellite) appeared on the southern wall of the faults. In contrast, positive and negative components of range displacements were located on the northern and southern walls of source faults for the ascending track (T014). This deformation characteristic indicates left-lateral strike-slip motions for both the Mw 7.8 and Mw 7.6 events. To illustrate whether there are many systematic biases in the range displacements, we used GPS-derived 3D displacements to evaluate the quality of POT-derived range components. The cumulative 3D displacement components acquired from GPS measurements were first projected into the range direction () according to the equation as follows:
where , , and are the ground displacement components in the north, east, and vertical directions, respectively. and represent the flight azimuth angle and incidence angle, respectively. indicates the measurement noise. The comparison between GPS-derived range displacements and the corresponding range displacements from POT technology at the same pixel is shown in Figure 4. No systematic offset between the two kinds of observations (GPS and POT) can be found, although the data consistency for the descending track (T021) is slightly worse than the ascending track (T014). In addition, the quality of range displacements from the POT technology appears to be better than the azimuth offset components because the resolution in the range direction of the Sentinel-1 images is much higher than that in the azimuth direction. The azimuth components of the POT technology did not detect the strike-slip deformation near the source fault of the Mw 7.6 event because the source fault here strikes to the EW direction, which is almost perpendicular to the flight direction (Figure 3c,e).
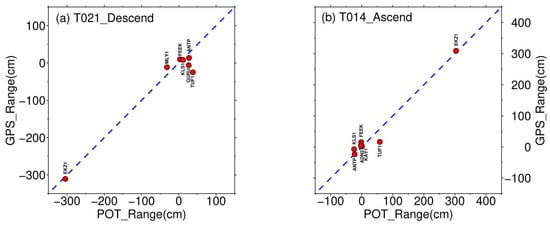
Figure 4.
Comparison between the POT-derived range components of coseismic deformations with the GPS-derived displacements after being projected into the range directions. Note that the blue dashed lines have slopes of one. Most of the red circles are very close to the blue dashed line, which indicates that the surface offsets estimated by the POT and GPS techniques show good consistency.
The ground 3D displacements due to the Turkey earthquake sequence could provide important information that constrains fault slip and earthquake rupture mechanisms. Benefiting from the different acquisition geometries of the ascending and descending SAR satellites, four independent observations (two range components and two azimuth components) were obtained using the POT technology. These data could be used to invert a complete 3D displacement field with high spatial resolution. In Equation (1), the measured range displacements are composited by the surface displacement components in the east, north, and vertical directions. Moreover, the azimuth displacements can also be expressed by the displacement components in the east and north directions. This relationship is shown as follows:
where is the azimuth displacement component. and represent ground displacement in the north and east directions, respectively. is the azimuth angle of the satellite orbit. indicates the noise within the azimuth measurement. In theory, the ground displacements in east, north, and vertical directions (i.e., , , and ) can be uniquely determined if more than three independent observations are provided. Constrained by the four independent displacement components deriving from the POT technology, the surface 3D displacement components were estimated by using the weighted least-squares (WLS) method [34,35]. Figure 5 shows the estimated 3D coseismic displacements in the overlap region of the ascending and descending images caused by the Mw 7.8 and Mw 7.6 earthquake sequence. Obvious horizontal displacements are shown in the epicenter region of the earthquake sequence, while the vertical deformation is not significant. The deformation in the eastern segment of the EAFZ cannot be imaged because the ascending SAR image did not cover this region. It can be seen that the E–W and vertical components are much clearer than the N–S components, which can be attributed to the noisier azimuth displacements that contribute most to the north–south components. It is surprising to note that the maximum surface fault offset occurred in the region close to the epicenter of the Mw 7.6 event with an offset of ~8 m, which is much larger than the maximum fault offset caused by the Mw 7.8 event, although the length of the ground deformation zone due to the Mw 7.6 event is much shorter than the Mw 7.8 shock. One possible explanation is that many aseismic slips in several hours following the Mw 7.8 event, such as the early afterslip, might contribute to generating large ground deformation in this region.
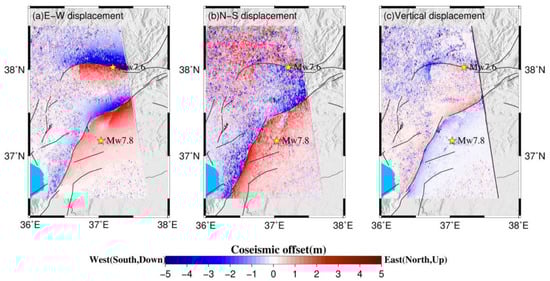
Figure 5.
The estimated EW, NS, and vertical displacement components constrained by the range and azimuth components of both ascending (T014) and descending (T021) tracks using the weighted least-squares method. The yellow stars mark the epicenters of the Mw 7.8 and Mw 7.6 earthquakes.
3. Coseismic Slip Model
3.1. Fault Geometry and Inversion Method
Ground displacements derived from POT technology reveal clear surface ruptures of the Mw 7.8 and the Mw 7.6 earthquakes on the traces of the EAFZ and the SF, respectively, which is consistent with the mapped surface ruptures based on analysis of the post-earthquake satellite data [16]. The surface ruptures and the aftershock distributions suggest the existence of strike variations along the fault traces of both earthquakes. In conjunction with the surface rupture analysis according to post-earthquake satellite data and the relocated aftershock distributions (Figure 1c), we constructed the geometries of the EAFZ and the SF in detail. The geometry of the EAFZ is composed of four fault segments (faults S1~S4). The strike of each segment was determined according to the surface rupture and aftershock distribution. In addition, we inferred that there is an NE-trending fault structure (Nurdagi-Pazircik fault, NF) where the hypocenter of the Mw 7.8 mainshock is located, which could be involved in the earthquake rupture. The strike of this new fault was estimated according to the general trend of the aftershocks and a small, mapped surface rupture (Figure 1b). The fault SF included two segments with varying fault strikes, which is supported by the aftershock distributions. We also considered an NE-trending fault segment (the Malatya fault, MF), which is almost parallel to the EAF, intersecting with the eastern segment of the fault SF based on the mapped surface offsets and aftershock clustering. We did not consider the mapped fault segment that connects the eastern terminate of the SF and the EAFZ in the modeling, as the aftershocks along this fault are rarely distributed (Figure 1c). The fault dips of faults EAFZ and SF cannot be constrained independently using the cumulative displacement field based on InSAR and GPS measurements, so we adopted a two-dimensional (2D) grid search method to simultaneously estimate the preferred fault dips of the two faults. In the grid search, all the other parameters, except for the fault dips, were fixed to their preferred values and we assumed that the different segments of the faults SF and MF had the same fault dip to reduce the number of unknown parameters. The search range of fault dips for faults EAFZ and SF were set between 60° and 90° with a step size of 2° according to the moment tensor solution from USGS. The grid search result is shown in Figure 6a. The preferred fault dips with minimal data misfit for faults EAF and NF are 86°and 89°, respectively, which are generally consistent with the focal mechanism solutions and the spatial distribution of aftershocks.
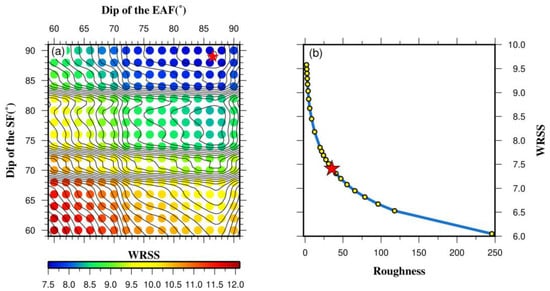
Figure 6.
(a) Determination of fault dips of the East Anatolian Fault (EAF) and the Sürgü fault (SF) based on a 2D grid searching method that minimized the WRSS. The red star shows the optimal fault dips of the fault EAF (86°) and the fault SF (89°). (b) The trade-off curve between the WRSS of observations and the model roughness. The red star marks the preferred smoothing factor adopted in the inversion.
After determining the geometry of source faults for the Mw 7.8 and Mw 7.6 earthquakes, we inverted the coseismic slip distributions on the source faults constrained by both GPS and POT measurements. For the ground measurements derived from POT technology, we only used the range components from both ascending and descending tracks in the modeling due to the relatively low accuracy and large noise of the azimuth components. To reduce modeling computation costs, the range offsets were resampled before the modeling [36]. The total number of resampled points ultimately involved in the inversion were 2076 and 1032 for tracks T021 and T014, respectively. The mathematical objective function of the slip inversion (f(s)) is summarized as follows:
where d is the surface geodetic measurements caused by the coseismic slip (s) on each fault patch. G represents Green’s function matrix, which means the induced surface displacement at the observation point due to the unit slip of each fault patch with a size of 2 km × 2 km. The Green’s functions are calculated using the elastic dislocation model in a homogeneous, isotropic half-space assuming a Poisson ratio of 0.25 [37]. k2 is the smoothing factor that balances the slip roughness and the data misfit. The preferred value of k2 is determined by analyzing the trade-off curve between the weighted residual sum of squares (WRSS) and the slip roughness (Figure 6b). We constructed the weight matrices for the GPS and POT measurement according to their formal errors, and the Helmert variance component estimation (HVCE) method was adopted to determine the relative weights between the GPS and POT measurements in the joint inversion [38].
3.2. Coseismic Slip Distribution
The preferred cumulative slip distribution of the Mw 7.8 and Mw 7.6 earthquake sequence is illustrated in Figure 7. The surface GPS measurements are explained satisfactorily in the joint inversion, with an average misfit of 1.4 cm (Figure 8). Both of the ascending and descending tracks of POT range displacements were generally retrieved well by the coseismic slip model, with a maximum misfit up to dozens of centimeters (Figure 9). The remaining residuals might be related to observation noise, the simplification of fault geometry, and many possible inelastic displacements that could occur near the fault traces. It should be noted that the time spans of GPS and SAR image pairs are not strictly consistent, as the post-earthquake SAR measurements are carried out 3–4 days after the earthquake sequence. Thus, a portion of post-seismic displacements could be included in the POT measurements.
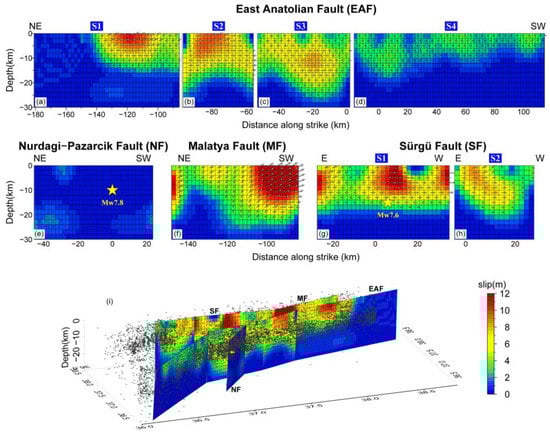
Figure 7.
Coseismic slip distribution of the Turkey earthquake sequence. Panels (a–d) denote the coseismic slip distribution on the fault segments of the EAF. Panel (e) shows the slips on the fault NF. Panel (f) shows the slip distribution on the fault MF. Panels (g,h) indicate the slip distributions on the two segments of the fault SF. Panel (i) shows the 3D distribution of cumulative coseismic fault slips. The black dots mark the locations of aftershocks.
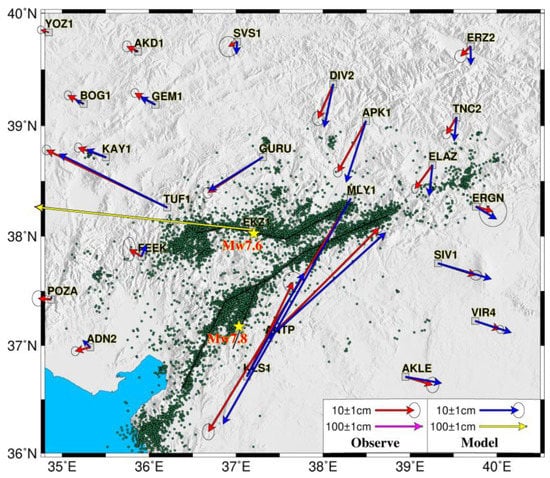
Figure 8.
The comparison between observed (red and pink arrows) and simulated (blue and yellow arrows) GPS displacements. The green dots mark the locations of aftershocks. Black solid lines outline the fault segments used in the modeling.
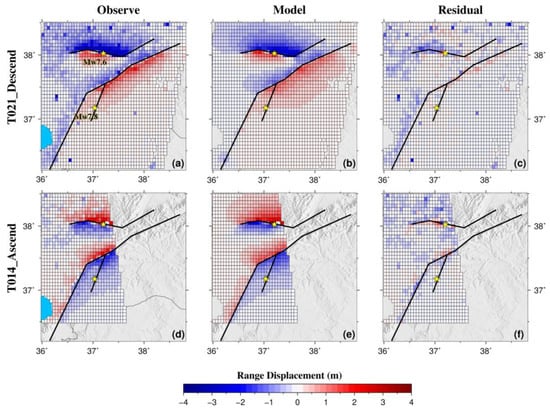
Figure 9.
The observations (left column; (a,d)), simulations (middle column; (b,e)), and residuals (right column; (c,f)) of the descending track (T021) and ascending track (T014) of InSAR observations. The black solid lines indicate the fault segments used in the inversion. The yellow stars mark the epicenters of the Mw 7.8 and Mw 7.6 earthquakes.
The preferred slip model suggests that the Turkey earthquake sequence mainly ruptured the EAFZ, SF, and MF, while the slips on the NF were not significant. The total released moment magnitude reached 9.62 × 10²⁰ Nm, corresponding to an event of Mw 7.95, assuming a shear modulus of 30 GPa. The coseismic slips on the EAFZ were caused by the Mw 7.8 shock, and the slips on the MF and SF were mainly related to the Mw 7.6 event. The EAFZ was failed by the Mw 7.8 earthquake, with a total length of surface rupture of ~280 km. The rupture on the EAFZ is characterized by a left-lateral strike-slip motion with neglected dip-slip components, which is generally consistent with the long-term fault slip pattern on the EAFZ [39]. The maximum magnitude of coseismic slip on the EAFZ reached ~9 m, located in the shallow portion of the fault segments S1 and S2. Overall, the rupture depths on fault segments S2 and S3 were generally higher than the fault segments S1 and S4. The aftershocks on the EAFZ following the Mw 7.8 earthquake mainly occurred in the depth of 0~15 km, which is spatially consistent with the rupture depth on the EAFZ. Moreover, the aftershocks on fault segments S1 and S4 were mainly confined to the bottom of the coseismic rupture on these two fault segments, indicating that these aftershocks could be promoted by stress loading due to the coseismic rupture. However, the aftershock activity in the bottom of the rupture zone on the fault segments of S2 and S3 was relatively weak. We inferred that this phenomenon could be related to the rate-strengthening frictional properties below the locking depth [40]. Generally, the rupture on the NF fault was very weak, with an average slip smaller than 1 m, although the Mw 7.8 earthquake is suggested to nucleate on this fault. The estimated geodetic moment on the EAFZ and NF was 6.39 × 10²⁰ Nm, which is equivalent to an Mw 7.84 event, coinciding well with the USGS and GCMT solutions.
The length of surface rupture on the faults MF and SF due to the Mw 7.6 event was about 150 km, which is much shorter than that on the EAFZ. The ruptures on the MF and SF faults were mainly governed by left-lateral strike-slip motion, with minor thrust slips on the MF fault, which is consistent with the focal mechanism solutions of M > 3.5 in the SF between 2007 and 2020 [10]. The rupture depths along the MF and SF faults were between 20–25 km, without showing significant lateral variations along fault strikes. Three large slip regions (slip > 8 m) could be found along the MF and SF faults. One large slip region was located in the conjunction zone between the MF and SF faults. It should be noted that this area was only covered by the descending SAR images. Another two large slip areas were located in the central and western segments of the SF fault with a maximum slip of about 10 m. The joint inversion yielded a total seismic moment of 3.23 × 10²⁰ Nm on the MF and SF faults, which corresponds to an Mw 7.64 event.
4. Interseismic Fault Slip in the EAFZ
4.1. 3D Velocity Field and Modeling Approach
It is well known that interseismic strain accumulation due to fault locking plays an important role in the nucleation and rupture extension of devastating continental earthquakes [40,41]. In the EAFZ, the general features of strain field and fault motion have been fully investigated through geological and geodetic measurements [6,7,42,43,44]. The increase in geodetic observation and development of data quality in recent years provides spatial continuous measurements in the EAFZ with higher precision, allowing us to reveal the character of fault motion in more detail. For instance, Weiss et al. [19] processed the Sentinel-1 SAR data acquired on 14 overlapping tracks from 2014 to 2019 to measure the surface deformation in the Anatolian region. A comprehensive InSAR LOS velocity in both ascending and descending models was acquired using the LiCSBAS analysis package (Figure 10a,b) [45]. By combining the discretely distributed GPS measurements in the EAFZ, a new 3D velocity field with high resolution and accuracy was obtained to show the details of strain accumulation in the EAFZ. One can refer to Weiss et al. [19] to get a detailed strategy for 3D velocity field estimation. We used the 3D velocity field derived from Weiss et al. [19] to analyze the characteristics of interseismic fault motion in the EAFZ. To account for the block rotation of the Anatolia block with respect to the Arabia block, we first transformed the velocity field under the Eurasia-fixed reference frame into the Anatolia-fixed velocity field by subtracting the rotation components using the Euler pole determined by Reilinger et al. [7].
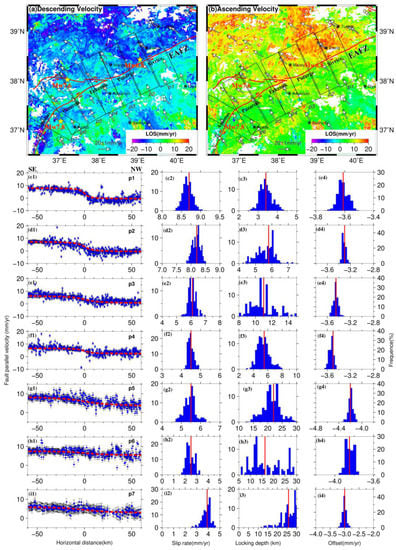
Figure 10.
Interseismic surface velocity field in the EAFZ and estimation of fault slip parameters. Panels (a,b) show the GPS and LOS velocities of descending and ascending tracks in the EAFZ in a Eurasia-fixed reference frame. The white arrows indicate the horizontal velocities derived from Aktug et al. [44]. The black boxes outline the location of velocity profiles. Two yellow stars mark the epicenters of the 2023 Turkey earthquake sequence. Panel (c1) shows the fault-parallel velocity components and the uncertainties along the profile (p1). The red dashed line represents the model prediction. Panels (c2–c4) show the posterior probability distributions for fault slip rate, locking depth, and the constant offset. The red lines indicate the preferred parameter estimation. Panels of (d1–d4), (e1–e4), (f1–f4), (g1–g4), (h1–h4), and (i1–i4) are the same as (c1–c4), but they are the velocity profiles of p2–p7, respectively.
Fault-parallel velocity components for seven velocity profiles along the strike of the EAFZ were projected to reveal the lateral variations of strain accumulation along the fault. We applied a vertical buried 2D screw dislocation to model the interseismic velocities in the EAFZ [46]. In the model, the fault-parallel velocity component () can be estimated by the formulation as follows:
where represents the constant strike-slip rate in a homogeneous, isotropic elastic half-space below the locking depth (D), and x denotes the perpendicular distance from the fault trace. c is a scalar offset between the observed velocity and model prediction corresponding to a choice of reference frame. We estimated the best-fit values for three model parameters (, D, and c) using a Bayesian Markov Chain Monte Carlo (MCMC) sampler [47,48,49]. The random walks of a given number of walkers are adopted by the Bayesian method to obtain the posterior probability distribution of the parameters based upon known prior constraints. In the modeling, the parameter space is constrained by 0 < (mm/yr) < 20, 0 < D (km) < 30, and −10 < c (mm/yr) < 0. We applied 100 walkers to perform 500,000 iterations and produce an acceptance rate of ∼10% of the posterior distribution, from which we estimated both the maximum a posteriori probability solution and corresponding parameter uncertainties.
4.2. Modeling Result
Figure 10 shows the posterior probability distributions for each parameter constrained by the seven fault-perpendicular velocity profiles. The estimated parameters with their formal uncertainties are listed in Table 2. Generally, the velocity profiles across the EAFZ provided a tighter constrain on the slip rates and constant velocity offsets than the locking depth. Significant lateral variations for fault slip rate and locking depth along the EAFZ were revealed by the inversion of fault-parallel velocities. In the Sivrice segment of the EAFZ (profiles p1 and p2), the fault slip rates were estimated to be 8.7 ± 0.12 and 8.2 ± 0.14 mm/yr, which is generally consistent with the estimation from only GPS measurements [44]. Meanwhile, Aktug et al. [44] suggested a nearly constant left-lateral slip rate (~10 mm/yr) for the whole segments between Pazarcik and Sivrice, which was not supported by our inversion result. The discrepancy might be attributed to different types of observations adopted in the modeling, as only GPS data were used in their block model. The estimated locking depth in the Sivrice segment is much smaller (only 3.4 ± 0.3 and 5.6 ± 0.5 km for the profiles p1 and p2, respectively), which coincides with the locking depth of 4.5 km estimated by Cavalié and Jónsson [42]. The shallow locking depth in this region suggests that there could be many creep zones in the shallow part of the fault, which was confirmed recently by Cakir et al. [50] according to the InSAR time series measurements. The locking depth in the Puturge segment of the EAFZ (profile p3) was estimated to be 10.8 ± 1.5 km with a left-lateral slip rate of 6.1 ± 0.24 mm/yr. The slip rate in this segment is slightly smaller than that in the Sivrice segment, but the optimal locking depth is much higher than in the east. To the further west, the locking depth in the Erkenek segment (profile p4) reduces to only 5.4 ± 0.9 km with a slip rate of 4.5 ± 0.16 mm/yr. The shallow locking depth in the Erkenek segment is consistent with the low seismicity levels in this region, as no M > 3.7 earthquakes ever occurred in this segment during the observation period from 2007 to 2019 [10].
Table 2.
The estimated fault slip parameters (slip rate, locking depth, and scalar offset) and their standard deviations for each velocity profile based on the Bayesian method.
In the Pazircik segment of the EAFZ, we estimated left-lateral slip rates of 5.5 ± 0.31 and 2.4 ± 0.33 mm/yr for the profiles p5 and p6, respectively. The slip rate in this segment was roughly 1/4~1/2 of the slip rate in the Sivrice segment, suggesting a decreasing trend of fault slip rates along the EAFZ from east to west. The estimated locking depths for profiles p5 and p6 were 21.5 ± 3.0 and 16.3 ± 6.5 km, respectively. The estimated locking depths along this segment are generally comparable with the rupture depth of the Mw 7.8 event of the 2023 Turkey earthquake sequence (segments S2 and S3 in Figure 7), although the uncertainties of estimated locking depth in the Pazircik segment are relatively large. To the south of the Pazircik segment (profile p7), the left-lateral slip rate of the Amonas fault was estimated to be 3.9 ± 0.35 mm/yr, which is generally comparable with the slip rate of 4.94 ± 0.13 mm/yr for the same segment based on the offset of a pre-Quaternary basin [51]. It should be noted that the upper bound of locking depth in the Amonas fault cannot be constrained effectively as shown by the posterior distribution for the parameter (Figure 10(i3)). Therefore, the locking depth of the Amonas fault may be considered unbounded within the parameter range we have chosen, tending toward a very high locking depth.
5. Discussion
5.1. Heterogeneity of Fault Slip Behavior along the Central and Western Segments of the EAFZ
A realistic assessment of earthquake hazards in the EAFZ requires a better understanding of fault behavior over the earthquake cycle [52,53]. The 2023 Mw 7.8 earthquake ruptured the western segment of the EAFZ with a total length of ~300 km. Significant lateral variations of the coseismic rupture zone were revealed by the inversion of geodetic measurements (Figure 7). Similarly, interseismic fault modeling also showed obvious spatial variations of slip rates and locking depths along the central and western segments of the EAFZ (Figure 11). The interseismic slip rate of the western segment of the EAFZ was only 2–5 mm/yr, which is much smaller than the central and eastern segment of the EAFZ. Taking account of the large amount of elapsed time from the latest events, previous studies suggested that the long-term seismic risk in the western segment of the EAFZ is still very high despite its low fault slip rate [10]. A similar scenario is the 2008 Wenchuan Mw 7.9 earthquake that occurred on the Longmenshan fault, which also had a low slip rate of fewer than 3 mm/yr [54,55]. We compared the coseismic fault rupture associated with the Mw 7.8 event with the interseismic fault locking depth and aftershock distributions to shed light on the fault slip behavior in the EAFZ. Overall, the coseismic rupture zone showed good spatial consistency with the interseismic fault locking area although the uncertainty of the inverted locking depth is relatively large, and the 2D model cannot constrain the partly coupled transition zone (Figure 11) [11]. In the Pazarcik and the western Erkenek segments, nearly all the locking patches with an average depth larger than 20 km were ruptured during the Mw 7.8 event. Most of the aftershocks in this segment occurred in the conjunction zone between the Pazarcik and the Amonas segments with a depth shallower than 15 km, and few aftershocks were found in the downdip edge of the rupture zone. In contrast, the aftershocks in the Amonas segment and the eastern Erkenek segment were mainly confined to the downdip edge of the rupture zones, suggesting that these aftershocks could be triggered by the deep afterslip due to coseismic stress loading of the Mw 7.8 shock.
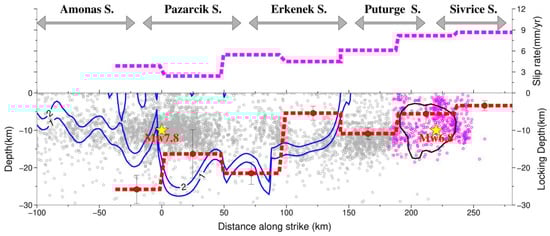
Figure 11.
Spatial correlation between coseismic fault rupture, the interseismic fault locking zone, and the aftershock distributions on the central and western segments of the EAFZ. In the upper panel, the pink dashed line indicates the estimated fault slip rates of each velocity profile. The location of each profile is shown in Figure 10. In the bottom panel, the two blue lines represent the slip contours with magnitudes of 1 m and 2 m of the coseismic rupture of the Mw 7.8 earthquake. The black line outlines the rupture zone of the 2020 Mw 6.8 Sivrice earthquake derived from Konca et al. [56]. The red dashed line indicates the locking depth of each fault segment. The error bars mark the standard deviations of the estimated locking depth. The gray and pink dots denote the relocated aftershocks of the 2023 Mw 7.8 event and the 2020 Mw 6.8 event.
Further to the east, significant aftershock activities were triggered in the western segment of the Puturge segment, although this segment did not fail in the Mw 7.8 earthquake. The aftershocks were mainly located at the downdip edge of the inverted locking zone. The aftershocks in the shallow portion (0–5 km) of the western Puturge segment were relatively sparse. Actually, the western Puturge segment was adjacent to the rupture zone of the 2020 Mw 6.8 Sivrice earthquake. Geodetic and seismological observations suggest that the rupture zone of the 2020 Mw 6.8 earthquake was mainly concentrated between the depths of 5–20 km, which is much higher than the estimated locking depth of 5.6 km here [56]. Moreover, the coseismic fault slip of the Mw 6.8 event tapered abruptly toward the surface without showing any surface slip [57,58,59]. The rupture characteristic of no surface offset associated with the 2020 Mw 6.8 event was different from the 2023 Mw 7.8 earthquake, as nearly continuous surface rupture zones were found for the Mw 7.8 event according to geodetic observations. For the 2020 Mw 6.8 earthquake, geodetic observations suggest that the striking coseismic slip deficit along the uppermost section of the fault was spatially compensated by interseismic creep and postseismic afterslip [50]. However, for the 2023 Mw 7.8 earthquake, the nearly continuous surface ruptures suggest that the shallow slip deficit might be not significant. This implies that the shallow section of the western segment of the EAFZ, at least for the fault segments that ruptured in the Mw 7.8 event, might not show obvious creep behavior. In general, the interseismic fault motion, the coseismic fault rupture, and the aftershock activities suggest strong heterogeneity of fault slip behavior along the central and western segments of the EAFZ. The strong heterogeneity of the fault slip probably implies a relatively low degree of fault maturity for the western and central segments of the EAFZ [10].
5.2. Earthquake Triggering and Implications for Future Seismic Hazards
A close spatiotemporal correlation between the 2023 Turkey Mw 7.8 and Mw 7.6 earthquake sequence is suggestive of a cause-and-effect relationship between the two events. This raises several questions that whether the subsequent Mw 7.6 earthquake was significantly triggered by the Mw 7.8 event and what was the possible triggering mechanism between them. The triggering mechanisms between moderate and large earthquake sequences have been widely explored through many well-recorded earthquake cases, such as the 2015 Gorkha (Nepal) Mw 7.8 and Mw 7.2 earthquake sequence [60] and the 2019 Ridgecrest Mw 6.4 and Mw 7.1 earthquake sequence [61,62,63]. For the 2023 Turkey earthquake sequence, we first calculated the Coulomb stress change in the surrounding region caused by the Mw 7.8 event using the Coulomb 3.4 software [64] to test whether it encouraged the subsequent Mw 7.6 earthquake. According to the coulomb failure law, the static coulomb failure stress (CFS) change on a given receiver fault plane following an event is defined as follows [65]:
where denotes the CFS change on a specific receiver fault, and indicate the shear and normal stress change, respectively, and is the effective friction coefficient. is positive along the slipping direction of the fault, and is positive when reducing the effective normal stress by unclamping the fault. The finite slip distributions on the faults EAFZ and NF caused by the Mw 7.8 event were adopted to calculate the CFS change in the surrounding region. The receiver fault mechanism (strike = 277°, dip = 78°, rake = 4°) was set to the same as the moment tensor of the Mw 7.6 earthquake based on the USGS solution. We calculated the shear stress change, the normal stress change, and the CFS change at a depth of 13 km, which is consistent with the epicenter depth of the Mw 7.6 earthquake. The effective friction coefficient was determined to be 0.4, which is a typical value for continental strike-slip faults [66]. As shown in Figure 12a, the static stress change simulations indicate that the CFS change at the hypocenter of the Mw 7.6 rupture was much higher than the 0.1–0.5 bar triggering threshold that is sufficient to bring critically stressed faults to failure [67,68]. The estimation is robust in the range of friction coefficient between 0.2 and 0.6, suggesting that the occurrence of the Mw 7.6 earthquake was almost certainly promoted by the Mw 7.8 earthquake. Furthermore, the computed shear stress change at the epicenter of the Mw 7.6 earthquake (Figure 12b) is negligible compared with the effective normal stress change in this region (Figure 12c), suggesting that the stress between the source faults of EAFZ and SF were mainly transferred by unclamping the interface of the fault SF rather than increasing the shear stress on the fault SF. The unclamping of the fault SF significantly reduces the effective normal stress on the fault plane, which brings the fault closer to failure. Additionally, many aftershocks that occurred after the Mw 7.8 earthquake and before the subsequent Mw 7.6 earthquake may also contribute to encouraging the Mw 7.6 event. These aftershocks mainly occurred in the region with a positive CFS change, suggesting that they were largely promoted by the stress disturbance due to the Mw 7.8 earthquake.
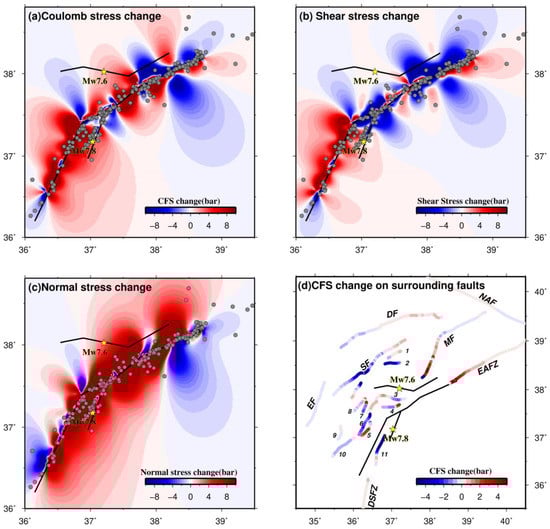
Figure 12.
(a) Coulomb Failure Stress (CFS) change at a depth of 13 km due to the Mw 7.8 earthquake. The receiver fault mechanism was chosen as (strike = 277°, dip = 78°, rake = 4°), which is the same as the moment tensor of the Mw 7.6 earthquake. The gray circles indicate the aftershocks that occurred prior to the Mw 7.6 earthquake. The two yellow stars mark the epicenters of the Mw 7.8 and Mw 7.6 earthquakes. Panels (b,c) show the calculated shear stress change and the normal stress change on the same receiver fault as panel (a). Panel (d) shows the CFS change on the surrounding faults. The abbreviations of fault names are: DF: Deliler Fault, DSFZ: Dead Sea Fault Zone, EAFZ: East Anatolian Fault Zone, EF: Ecemis Fault, MF: Malatya Fault, NAF: North Anatolian Fault, SF: Sürgü Fault, 1: Gürün fault, 2: Beyyurdu fault, 3: Engizek fault, 4: Maras fault, 5: Düzici-Osmaniye fault, 6: Toprakkale fault, 7: Cokak fault, 8: Savrun fault, 9: Misis fault, 10: Yumurtalik fault, and 11: Yesemek fault.
To evaluate the impact of the 2023 Turkey earthquake sequence on the seismic activity of surrounding faults and to analyze future earthquake potential, we need to identify which faults are encouraged by the stress change caused by the earthquake sequence. We calculated the CFS change on the surrounding faults due to the cumulative slip of the 2023 Turkey earthquake sequence. The geometries of the nearby receiver faults were simplified using single fault planes with dips of 90° and 60° for strike-slip fault and thrust fault, respectively, based on the active fault map of the Eastern Mediterranean region [4]. The rake angles of the sinistral, dextral, and thrust faults were fixed at 0°, 180°, and 90° in the simulation, respectively. The result shows significant stress perturbation on surrounding active faults caused by the Turkey earthquake sequence (Figure 12d). Significant positive stress changes were estimated in the central and eastern segments of the EAFZ, the southern segment of the Malatya fault (MF), the eastern segment of the Deliler fault (DF), the central segment of the NAF, and the northern segment of DSFZ. This suggests that the future earthquake potential on these faults is increased. It is worth noting that the ~50 km long western Puturge segment of the EAFZ, which was not ruptured in either the 2023 Mw 7.8 earthquake or the 2020 Mw 6.8 Sivrice earthquake, showed a large CFS increase. This segment has not undergone any moderate or large earthquakes at least during the past 100 years since the 1905 Ms 6.8 earthquake [4]. The slip deficit of this segment in the past century could generate an Mw 6.6~6.8 earthquake if this segment is completely ruptured. However, if the shallow section of the western Puturge segment exhibits extensive creep behavior, similar to the eastern Puturge segment [50], the earthquake potential in this segment could be overestimated.
6. Conclusions
In this study, we used two pairs of Sentinel-1 images and GPS measurements to fully map the surface displacements caused by the 2023 Turkey earthquake sequence. The surface displacements were then adopted to invert for the coseismic fault slip distribution on the seismogenic faults of the earthquake sequence. Additionally, we estimated the interseismic fault slip rates and locking depths of the EAFZ constrained by a high-resolution velocity field. We discussed the spatial correlation between the coseismic fault rupture, interseismic strain accumulation, and aftershock distribution on the central and southern segments of the EAFZ to shed light on the heterogeneous fault behavior along the EAFZ. The main conclusions are summarized as follows:
- (1)
- Both the Mw 7.8 and Mw 7.6 earthquakes were dominated by left-lateral strike slips on nearly vertical seismogenic faults with a maximum slip of ~10 m. Significant surface ruptures on the EAFZ were revealed by geodetic measurements, suggesting that the shallow slip deficits are not obvious. The cumulative released moment of the earthquake sequence reached 9.62 × 10²⁰ Nm, corresponding to an Mw 7.95 event;
- (2)
- The estimated fault slip rate and locking depth showed significant lateral variations along the central and western segments of the EAFZ. The fault slip rate generally decreased from 8~9 mm/yr in the central segment to 3~5 mm/yr in the western segment of the EAFZ. In contrast, the locking depths increased from 3~6 km in the central segment to 16~22 km in the western segment of the EAFZ. The shallow locking depth in the central segment of the EAFZ implies the probable existence of shallow fault creep behavior. Generally, the rupture depth of the Mw 7.8 earthquake shows spatial consistency with the estimated interseismic fault locking zone;
- (3)
- Coulomb failure stress calculation suggests that the Mw 7.8 earthquake largely promoted the subsequent Mw 7.6 event. The stress transfer from the fault EAFZ to the fault SF was realized by unclamping the interface of the fault SF, which significantly reduced the effective normal stress on the fault plane. A large CFS increase in the western Puturge segment of the EAFZ, which was not ruptured in the 2020 Mw 6.8 or 2023 Mw 7.8 earthquakes, indicates that its future seismic risk deserves special attention.
Author Contributions
Conceptualization, S.L. and X.W.; methodology, S.L.; software, T.T. and Y.Z.; validation, Z.L., X.Q. and J.H.; investigation, S.L.; writing—original draft preparation, S.L.; writing—review and editing, T.T. and S.S.; visualization, X.W.; funding acquisition, S.L. All authors have read and agreed to the published version of the manuscript.
Funding
This study was supported by the National Natural Science Foundation of China (42004001, 42274012, 42104019), Open Fund of Wuhan, Gravitation and Solid Earth Tides, National Observation and Research Station (WHYWZ202107), Open Fund of Hubei Subsurface Multi-scale Imaging Key Laboratory (China University of Geosciences) (SMIL-2021-04), and the Fundamental Research Funds for the Central Universities (JZ2022HGTB0268, JZ2022HGTB0358).
Data Availability Statement
The Sentinel-1 SAR data were acquired and processed by the European Space Agency Copernicus program (https://scihub.copernicus.eu/, accessed on 20 February 2023) and were retrieved from the Alaska Satellite Facility Distributed Active Archive Center (https://vertex.daac.asf.alaska.edu, accessed on 20 February 2023). The high-rate (1 Hz) GPS data were collected from the TUSAGA-Aktif (https://www.tusaga-aktif.gov.tr/, accessed on 25 February 2023). The preliminary surface ruptures of the Turkey earthquake sequence based on analysis of post-seismic satellite data were obtained from USGS (https://usgs.maps.arcgis.com/apps/webappviewer/index.html?id=5229bb842bd64b688d769abbefe43b46, accessed on 20 March 2023). The relocated aftershocks of the 2023 Turkey earthquake sequence were archived from Zenodo (https://zenodo.org/record/7699882#.ZEKnT3ZBy3A, accessed on 10 March 2023).
Acknowledgments
We really appreciate the TUSAGA-Aktif for releasing the high-rate GPS data. We thank the editor and the three anonymous reviewers for their constructive suggestions that significantly improved the quality of the manuscript.
Conflicts of Interest
The authors declare no conflict of interest.
References
- Lyberis, N.; Yurur, T.; Chorowicz, J.; Kasapoglu, E.; Gundogdu, N. The East Anatolian Fault: An oblique collisional belt. Tectonophysics 1992, 204, 1–15. [Google Scholar] [CrossRef]
- Bulut, F.; Bohnhoff, M.; Eken, T.; Janssen, C.; Kılıç, T.; Dresen, G. The East Anatolian Fault Zone: Seismotectonic setting and spatiotemporal characteristics of seismicity based on precise earthquake locations. J. Geophys. Res. 2012, 117, 7304. [Google Scholar] [CrossRef]
- Taymaz, T.; Eyidoǧan, H.; Jackson, J. Source parameters of large earthquakes in the East Anatolian Fault Zone (Turkey). Geophys. J. Int. 1991, 106, 537–550. [Google Scholar] [CrossRef]
- Duman Tamer, Y.; Emre, Ö. The East Anatolian Fault: Geometry, segmentation and jog characteristics. Geol. Soc. Lond. Spec. Publ. 2013, 372, 495–529. [Google Scholar] [CrossRef]
- Tarı, U.; Tüysüz, O.; Can Genç, Ş.; İmren, C.; Blackwell, B.A.B.; Lom, N.; Tekeşin, Ö.; Üsküplü, S.; Erel, L.; Altıok, S.; et al. The geology and morphology of the Antakya Graben between the Amik Triple Junction and the Cyprus Arc. Geodin. Acta 2013, 26, 27–55. [Google Scholar] [CrossRef]
- Yilmaz, H.; Over, S.; Ozden, S. Kinematics of the East Anatolian Fault Zone between Turkoglu (Kahramanmaras) and Celikhan (Adiyaman), eastern Turkey. Earth Planets Space 2006, 58, 1463–1473. [Google Scholar] [CrossRef]
- Reilinger, R.; McClusky, S.; Vernant, P.; Lawrence, S.; Ergintav, S.; Cakmak, R.; Ozener, H.; Kadirov, F.; Guliev, I.; Stepanyan, R.; et al. GPS constraints on continental deformation in the Africa-Arabia-Eurasia continental collision zone and implications for the dynamics of plate interactions. J. Geophys. Res. 2006, 111, B05411. [Google Scholar] [CrossRef]
- Mahmoud, Y.; Masson, F.; Meghraoui, M.; Cakir, Z.; Alchalbi, A.; Yavasoglu, H.; Yönlü, O.; Daoud, M.; Ergintav, S.; Inan, S. Kinematic study at the junction of the East Anatolian fault and the Dead Sea fault from GPS measurements. J. Geodyn. 2013, 67, 30–39. [Google Scholar] [CrossRef]
- Ambraseys, N.N. Temporary seismic quiescence: SE Turkey. Geophys. J. Int. 1989, 96, 311–331. [Google Scholar] [CrossRef]
- Güvercin, S.E.; Karabulut, H.; Konca, A.Ö.; Doğan, U.; Ergintav, S. Active seismotectonics of the East Anatolian Fault. Geophys. J. Int. 2022, 230, 50–69. [Google Scholar] [CrossRef]
- Bletery, Q.; Cavalié, O.; Nocquet, J.-M.; Ragon, T. Distribution of Interseismic Coupling Along the North and East Anatolian Faults Inferred from InSAR and GPS Data. Geophys. Res. Lett. 2020, 47, e2020GL087775. [Google Scholar] [CrossRef]
- Bird, P. An updated digital model of plate boundaries. Geochem. Geophys. Geosyst. 2003, 4, 1027. [Google Scholar] [CrossRef]
- Lomax, A. Precise, NLL-SSST-coherence hypocenter catalog for the 2023 Mw 7.8 and Mw 7.6 SE Turkey earthquake sequence. (v1.0). Zenodo 2023. [Google Scholar] [CrossRef]
- Dal Zilio, L.; Ampuero, J.-P. Earthquake doublet in Turkey and Syria. Commun. Earth Environ. 2023, 4, 71. [Google Scholar] [CrossRef]
- Lomax, A.; Savvaidis, A. High-Precision Earthquake Location Using Source-Specific Station Terms and Inter-Event Waveform Similarity. J. Geophys. Res. 2022, 127, e2021JB023190. [Google Scholar] [CrossRef]
- Reitman, G.N.; Briggs, R.W.; Barnhart, W.D.; Jobe, J.A.T.; DuRoss, C.B.; Hatem, A.E.; Gold, R.D.; Mejstrik, J.D.; Akçiz, A.S. Preliminary Fault Rupture Mapping of the 2023 M7.8 and M7.5 Türkiye Earthquakes; USGS: Reston, VA, USA, 2023. [CrossRef]
- Elliott, J.R.; Walters, R.J.; Wright, T.J. The role of space-based observation in understanding and responding to active tectonics and earthquakes. Nat. Commun. 2016, 7, 13844. [Google Scholar] [CrossRef]
- Merryman Boncori, J.P. Measuring Coseismic Deformation with Spaceborne Synthetic Aperture Radar: A Review. Front. Earth Sci. 2019, 7, 16. [Google Scholar] [CrossRef]
- Weiss, J.R.; Walters, R.J.; Morishita, Y.; Wright, T.J.; Lazecky, M.; Wang, H.; Hussain, E.; Hooper, A.J.; Elliott, J.R.; Rollins, C.; et al. High-Resolution Surface Velocities and Strain for Anatolia from Sentinel-1 InSAR and GNSS Data. Geophys. Res. Lett. 2020, 47, e2020GL087376. [Google Scholar] [CrossRef]
- Geng, J.; Chen, X.; Pan, Y.; Mao, S.; Li, C.; Zhou, J.; Zhang, K. PRIDE PPP-AR: An open-source software for GPS PPP ambiguity resolution. GPS Solut. 2019, 23, 91. [Google Scholar] [CrossRef]
- Saastamoinen, J.J.B.G. Contributions to the theory of atmospheric refraction. Bull Géodésique 1972, 107, 13–34. [Google Scholar] [CrossRef]
- Boehm, J.; Niell, A.; Tregoning, P.; Schuh, H. Global Mapping Function (GMF): A new empirical mapping function based on numerical weather model data. Geophys. Res. Lett. 2006, 33. [Google Scholar] [CrossRef]
- Elliott, J.R.; de Michele, M.; Gupta, H.K. Earth Observation for Crustal Tectonics and Earthquake Hazards. Surv. Geophys. 2020, 41, 1355–1389. [Google Scholar] [CrossRef]
- He, P.; Wen, Y.; Xu, C.; Chen, Y. Complete three-dimensional near-field surface displacements from imaging geodesy techniques applied to the 2016 Kumamoto earthquake. Remote Sens. Environ. 2019, 232, 111321. [Google Scholar] [CrossRef]
- Sandwell, D.; Mellors, R.; Tong, X.; Wei, M.; Wessel, P. Open radar interferometry software for mapping surface Deformation. Eos Trans. AGU 2011, 92, 234. [Google Scholar] [CrossRef]
- Farr, T.G.; Rosen, P.A.; Caro, E.; Crippen, R.; Duren, R.; Hensley, S.; Kobrick, M.; Paller, M.; Rodriguez, E.; Roth, L. The Shuttle Radar Topography Mission. Rev. Geophys. 2007, 45, 361. [Google Scholar] [CrossRef]
- Chen, C.W.; Zebker, H.A. Network approaches to two-dimensional phase unwrapping: Intractability and two new algorithms. J. Opt. Soc. Am. A Opt. Image Sci. 2000, 17, 401–414. [Google Scholar] [CrossRef]
- Kobayashi, T.; Takada, Y.; Furuya, M.; Murakami, M. Locations and types of ruptures involved in the 2008 Sichuan earthquake inferred from SAR image matching. Geophys. Res. Lett. 2009, 36, L07302. [Google Scholar] [CrossRef]
- Wang, T.; Wei, S.; Jónsson, S. Coseismic displacements from SAR image offsets between different satellite sensors: Application to the 2001 Bhuj (India) earthquake. Geophys. Res. Lett. 2015, 42, 7022–7030. [Google Scholar] [CrossRef]
- Strozzi, T.; Luckman, A.; Murray, T.; Wegmuller, U.; Werner, C.L. Glacier motion estimation using SAR offset-tracking procedures. IEEE Trans. Geosci. Remote Sens. 2002, 40, 2384–2391. [Google Scholar] [CrossRef]
- Jiang, H.; Feng, G.; Wang, T.; Bürgmann, R. Toward full exploitation of coherent and incoherent information in Sentinel-1 TOPS data for retrieving surface displacement: Application to the 2016 Kumamoto (Japan) earthquake. Geophys. Res. Lett. 2017, 44, 1758–1767. [Google Scholar] [CrossRef]
- He, P.; Wen, Y.; Xu, C.; Chen, Y. High-quality three-dimensional displacement fields from new-generation SAR imagery: Application to the 2017 Ezgeleh, Iran, earthquake. J. Geod. 2018, 93, 573–591. [Google Scholar] [CrossRef]
- Liang, C.; Fielding, E.J. Measuring Azimuth Deformation with L-Band ALOS-2 ScanSAR Interferometry. IEEE Trans. Geosci. Remote Sens. 2017, 55, 2725–2738. [Google Scholar] [CrossRef]
- Fialko, Y.; Simons, M.; Agnew, D. The complete (3-D) surface displacement field in the epicentral area of the 1999 MW7.1 Hector Mine Earthquake, California, from space geodetic observations. Geophys. Res. Lett. 2001, 28, 3063–3066. [Google Scholar] [CrossRef]
- Hu, J.; Liu, J.; Li, Z.; Zhu, J.; Wu, L.; Sun, Q.; Wu, W. Estimating three-dimensional coseismic deformations with the SM-VCE method based on heterogeneous SAR observations: Selection of homogeneous points and analysis of observation combinations. Remote Sens. Environ. 2021, 255, 112298. [Google Scholar] [CrossRef]
- Lohman, R.B.; Simons, M. Some thoughts on the use of InSAR data to constrain models of surface deformation. Geochem. Geophys. Geosyst. 2005, 6. [Google Scholar] [CrossRef]
- Okada, Y. Surface deformation due to shear and tensile faults in a half-space. Bull. Seismol. Soc. Am. 1985, 75, 1135–1154. [Google Scholar] [CrossRef]
- Xu, C.; Ding, K.; Cai, J.; Grafarend, E.W. Methods of determining weight scaling factors for geodetic–geophysical joint inversion. J. Geodyn. 2009, 47, 39–46. [Google Scholar] [CrossRef]
- Kiratzi, A.A. A study on the active crustal deformation of the north and east anatolian fault zones. Tectonophysics 1993, 225, 191–203. [Google Scholar] [CrossRef]
- Avouac, J.-P. From Geodetic Imaging of Seismic and Aseismic Fault Slip to Dynamic Modeling of the Seismic Cycle. Annu. Rev. Earth Planet. Sci. 2015, 43, 233–271. [Google Scholar] [CrossRef]
- Li, S.; Wang, Q.; Yang, S.; Qiao, X.; Nie, Z.; Zou, R.; Ding, K.; He, P.; Chen, G. Geodetic imaging mega-thrust coupling beneath the Himalaya. Tectonophysics 2018, 747–748, 225–238. [Google Scholar] [CrossRef]
- Cavalié, O.; Jónsson, S. Block-like plate movements in eastern Anatolia observed by InSAR. Geophys. Res. Lett. 2014, 41, 26–31. [Google Scholar] [CrossRef]
- Walters, R.J.; Parsons, B.; Wright, T.J. Constraining crustal velocity fields with InSAR for Eastern Turkey: Limits to the block-like behavior of Eastern Anatolia. J. Geophys. Res. 2014, 119, 5215–5234. [Google Scholar] [CrossRef]
- Aktug, B.; Ozener, H.; Dogru, A.; Sabuncu, A.; Turgut, B.; Halicioglu, K.; Yilmaz, O.; Havazli, E. Slip rates and seismic potential on the East Anatolian Fault System using an improved GPS velocity field. J. Geodyn. 2016, 94–95, 1–12. [Google Scholar] [CrossRef]
- Morishita, Y.; Lazecky, M.; Wright, T.J.; Weiss, J.R.; Elliott, J.R.; Hooper, A. LiCSBAS: An Open-Source InSAR Time Series Analysis Package Integrated with the LiCSAR Automated Sentinel-1 InSAR Processor. Remote Sens. 2020, 12, 424. [Google Scholar] [CrossRef]
- Savage, J.C.; Burford, R.O. Geodetic determination of relative plate motion in central California. J. Geophys. Res. 1973, 78, 832–845. [Google Scholar] [CrossRef]
- Minson, S.E.; Simons, M.; Beck, J.L. Bayesian inversion for finite fault earthquake source models I—Theory and algorithm. Geophys. J. Int. 2013, 194, 1701–1726. [Google Scholar] [CrossRef]
- Guo, R.; Li, L.; Zhang, W.; Zhang, Y.; Tang, X.; Dai, K.; Li, Y.; Zhang, L.; Wang, J. Kinematic Slip Evolution During the 2022 Ms 6.8 Luding, China, Earthquake: Compatible with the Preseismic Locked Patch. Geophys. Res. Lett. 2023, 50, e2023GL103164. [Google Scholar] [CrossRef]
- Li, S.; Tao, T.; Gao, F.; Qu, X.; Zhu, Y.; Huang, J. Present-day fault kinematic around the eastern Himalayan Syntaxis and probable viscoelastic relaxation perturbation following the 1950 Mw 8.7 Assam earthquake. J. Asian Earth Sci. 2022, 238, 105396. [Google Scholar] [CrossRef]
- Cakir, Z.; Doğan, U.; Akoğlu, A.M.; Ergintav, S.; Özarpacı, S.; Özdemir, A.; Nozadkhalil, T.; Çakir, N.; Zabcı, C.; Erkoç, M.H.; et al. Arrest of the Mw 6.8 January 24, 2020 Elaziğ (Turkey) earthquake by shallow fault creep. Earth Planet. Sci. Lett. 2023, 608, 118085. [Google Scholar] [CrossRef]
- Karabacak, V.; Altunel, E.; Meghraoui, M.; Akyüz, H.S. Field evidences from northern Dead Sea Fault Zone (South Turkey): New findings for the initiation age and slip rate. Tectonophysics 2010, 480, 172–182. [Google Scholar] [CrossRef]
- Bürgmann, R. Interseismic coupling and asperity distribution along the Kamchatka subduction zone. J. Geophys. Res. 2005, 110, B07405. [Google Scholar] [CrossRef]
- Chlieh, M.; Perfettini, H.; Tavera, H.; Avouac, J.P.; Remy, D.; Nocquet, J.M.; Rolandone, F.; Bondoux, F.; Gabalda, G.; Bonvalot, S. Interseismic coupling and seismic potential along the Central Andes subduction zone. J. Geophys. Res. 2011, 116, 12405. [Google Scholar] [CrossRef]
- Hubbard, J.; Shaw, J. Uplift of the Longmen Shan and Tibetan plateau, and the 2008 Wenchuan (Mw7.9) earthquake. Nature 2009, 458, 191–194. [Google Scholar] [CrossRef] [PubMed]
- Wang, Q.; Qiao, X.; Lan, Q.; Jeffrey, F.; Yang, S.; Xu, C.; Yang, Y.; You, X.; Tan, K.; Chen, G. Rupture of deep faults in the 2008 Wenchuan earthquake and uplift of the Longmen Shan. Nature Geosci. 2011, 4, 634–640. [Google Scholar] [CrossRef]
- Konca, A.Ö.; Karabulut, H.; Güvercin, S.E.; Eskiköy, F.; Özarpacı, S.; Özdemir, A.; Floyd, M.; Ergintav, S.; Doğan, U. From Interseismic Deformation with Near-Repeating Earthquakes to Co-Seismic Rupture: A Unified View of the 2020 Mw6.8 Sivrice (Elazığ) Eastern Turkey Earthquake. J. Geophys. Res. 2021, 126, e2021JB021830. [Google Scholar] [CrossRef]
- Chen, K.; Zhang, Z.; Liang, C.; Xue, C.; Liu, P. Kinematics and Dynamics of the 24 January 2020 Mw 6.7 Elazig, Turkey Earthquake. Earth Space Sci. 2020, 7, e2020EA001452. [Google Scholar] [CrossRef]
- Gallovič, F.; Zahradník, J.; Plicka, V.; Sokos, E.; Evangelidis, C.; Fountoulakis, I.; Turhan, F. Complex rupture dynamics on an immature fault during the 2020 Mw 6.8 Elazığ earthquake, Turkey. Commun. Earth Environ. 2020, 1, 40. [Google Scholar] [CrossRef]
- Lin, X.; Hao, J.; Wang, D.; Chu, R.; Zeng, X.; Xie, J.; Zhang, B.; Bai, Q. Coseismic Slip Distribution of the 24 January 2020 Mw 6.7 Doganyol Earthquake and in Relation to the Foreshock and Aftershock Activities. Seismol. Res. Lett. 2020, 92, 127–139. [Google Scholar] [CrossRef]
- Liu, C.; Dong, P.; Shi, Y. Stress change from the 2015 Mw 7.8 Gorkha earthquake and increased hazard in the southern Tibetan Plateau. Phys. Earth Planet. Inter. 2017, 267, 1–8. [Google Scholar] [CrossRef]
- Barnhart, W.D.; Hayes, G.P.; Gold, R.D. The July 2019 Ridgecrest, California, Earthquake Sequence: Kinematics of Slip and Stressing in Cross-Fault Ruptures. Geophys. Res. Lett. 2019, 46, 11859–11867. [Google Scholar] [CrossRef]
- Goldberg, D.E.; Melgar, D.; Sahakian, V.J.; Thomas, A.M.; Xu, X.; Crowell, B.W.; Geng, J. Complex Rupture of an Immature Fault Zone: A Simultaneous Kinematic Model of the 2019 Ridgecrest, CA Earthquakes. Geophys. Res. Lett. 2020, 47, e2019GL086382. [Google Scholar] [CrossRef]
- Li, S.; Chen, G.; Tao, T.; He, P.; Ding, K.; Zou, R.; Li, J.; Wang, Q. The 2019 Mw 6.4 and Mw 7.1 Ridgecrest earthquake sequence in Eastern California: Rupture on a conjugate fault structure revealed by GPS and InSAR measurements. Geophys. J. Int. 2020, 221, 1651–1666. [Google Scholar] [CrossRef]
- Toda, S.; Stein, R.S.; Sevilgen, V.; Lin, J. Coulomb 3.3 Graphic-Rich Deformation and Stress-Change Software for Earthquake, Tectonic, and Volcano Research and Teaching-User Guide; 2011–1060; Earthquake Science Center, Menlo Park Science Center: Menlo Park, CA, USA, 2011.
- Scholz, C.H. The Mechanics of Earthquakes and Faulting, 2nd ed.; Cambridge University Press: Cambridge, UK, 2002. [Google Scholar]
- Freed, A.M. Earthquake triggering by static, dynamic, and postseismic stress transfer. Annu. Rev. Earth Planet. Sci. 2005, 33, 335–367. [Google Scholar] [CrossRef]
- King, G.C.P.; Stein, R.S.; Lin, J. Static stress changes and the triggering of earthquakes. Bull. Seismol. Soc. Am. 1994, 84, 935–953. [Google Scholar]
- Stein, R.S. The role of stress transfer in earthquake occurrence. Nature 1999, 402, 605–609. [Google Scholar] [CrossRef]
Disclaimer/Publisher’s Note: The statements, opinions and data contained in all publications are solely those of the individual author(s) and contributor(s) and not of MDPI and/or the editor(s). MDPI and/or the editor(s) disclaim responsibility for any injury to people or property resulting from any ideas, methods, instructions or products referred to in the content. |
© 2023 by the authors. Licensee MDPI, Basel, Switzerland. This article is an open access article distributed under the terms and conditions of the Creative Commons Attribution (CC BY) license (https://creativecommons.org/licenses/by/4.0/).