Article

Coseismic and Early Postseismic Deformation of the 2020 Mw 6.4 Petrinja Earthquake (Croatia) Revealed by InSAR

1
State Key Laboratory of Information Engineering in Surveying, Mapping and Remote Sensing, Wuhan University, Wuhan 430079, China
2
School of Geodesy and Geomatics, Wuhan University, Wuhan 430079, China
*
Author to whom correspondence should be addressed.
Remote Sens. 2023, 15(10), 2617; https://doi.org/10.3390/rs15102617
Submission received: 11 April 2023 / Revised: 15 May 2023 / Accepted: 15 May 2023 / Published: 18 May 2023

Abstract

:
The largest earthquake (Mw 6.4) in northwestern Croatia ruptured the faults near the city of Petrinja on 29 December 2020, at 11:19 UTC. The epicenter was located ~3 km southwest of Petrinja, ~40 km southeast of Zagreb, the capital of the Republic of Croatia. Here we investigated the geometric and kinematic properties of the 2020 Mw 6.4 Petrinja earthquake using a joint inversion of ascending and descending interferograms from three tracks of Sentinel-1 Single-Look Complex (SLC) images. The coseismic and early postseismic surface displacements associated with the Petrinja earthquake were imaged using standard DInSAR and SBAS time-series InSAR methods, respectively. The distributed slip model was inverted based on the ground surface displacements with maximum slip patch in 5 km depth. The early postseismic deformation occurred on the northwestern extent of coseismic slip, and it cannot be well modeled by the coseismic model. We thus suggested that the postseismic deformation was caused by a combined effect of the postseismic afterslips and aftershocks occurring in this area. Based on the inverted slip model, we calculated the Coulomb stress change in the region, and found a good correlation between positive Coulomb failure stress ∆CFS and the distribution of aftershocks. Based on these results, we identified which faults are more active, and then better estimated the seismic hazards in the region.

1. Introduction

The 2020 Petrinja earthquake occurred at 11:19 on December 29 (UTC time) in the central part of Croatia, with an epicenter located roughly 3 km west-southwest of the town of Petrinja, 40 km southeast of Zagreb, the capital of the country. The focal mechanism and the distribution of aftershocks determined by the United States Geological Survey (USGS) show that the earthquake ruptured a NW-SE striking transcurrent fault with mainly left-lateral strike-slip. The USGS centroid moment tensor (CMT) solution shows a main nodal plane with a strike of 134° and high dip of 76° with predominantly left-lateral motion. It is the strongest earthquake to occur in Croatia since the advent of modern seismic instruments (USGS). This event destroyed about half of the town of Petrinja, where many buildings collapsed and resulted in at least seven deaths and more than 26 injuries [1,2]. There were two moderate-size foreshocks that occurred just one day before the mainshock. The first event struck at 05:28 UTC (Mw 4.8 GFZ), while the other Mw 4.4 event struck at 06:49 UTC [1]. The focal mechanism solutions of the earthquake (Table 1) from most of the seismic agencies suggest right-lateral strike-slip faulting, which is consistent with the regional tectonics [3]. As the largest earthquake instrumentally recorded in the region, coseismic and postseismic displacements of the Petrinja earthquake are critical to illuminate the local active tectonic structures and potential seismic risk.
The regional tectonics of Central Croatia are dominated by N-S compressional motion between the Adria and Eurasia Plates, accommodated by faults including the Pokupsko fault, the Glina fault, and the Sava fault [3,4,5]. As the main tectonic driving source of the area, the crustal shortening is accommodated by both strike-slip and reverse-slip motions [3,4,6]. The crustal shortening rate between the Adria plate and Eurasia plate is ~4 mm/yr, based on inversion results from GPS (Global Positioning System) velocities [6,7]. Crustal strain rates within this area derived from dense GPS measurements ranging from 10 to 30 nstrain/yr, indicating very little compression is required in Croatia. The area adjacent to the 2020 Petrinja earthquake has been very active seismically, with a number of moderate events occurring over the last 200 years.
InSAR (Interferometric Synthetic Aperture Radar) enables us to study surface deformation associated with earthquakes and invert the slip distribution of the source fault [8,9,10,11]. Since the launch of Sentinel-1A in 2014 and Sentinel-1B in 2016, the Sentinel-1 images can be obtained in as little as a 6-day satellite revisit time, thus significantly increasing the usability of the InSAR results and improving our understanding of the deformation in the seismic cycle. In this work, we firstly generate coseismic deformation maps associated with the 2020 Petrinja earthquake using Sentinel-1 SAR data from both ascending and descending tracks (two ascending tracks P146A and P073A, and one descending track P124D). Combining these observational data from different orbits, we extract a 2.5-D displacement map associated with this event. The geometric and kinematic parameters of the source fault are inverted based on these observations with equal weight using elastic dislocation models and nonlinear and linear inversion algorithms. Then, we calculate the Coulomb failure stress change of the region and discuss the tectonic implications of this event. The first 6 months of Sentinel-1 data were processed to evaluate early postseismic deformation of the earthquake. Finally, we explore its critical effect on the potential seismic hazards of the regional fault systems to provide additional insights to hazard assessments and disaster mitigation.

2. Data and Methods

2.1. InSAR Data

In order to investigate the surface deformation pattern and slip distribution associated with the 29 December 2020 Mw 6.4 earthquake, we generate three coseismic interferograms from both the ascending and descending tracks of C-band (5.6 cm wavelength) SAR data acquired in the Terrain Observations with Progressive Scans (TOPS) mode of the Sentinel 1A/B satellites, including images acquired from ascending track 146 on 24 December 2020 to 30 December 2020, ascending track 73 on 25 December 2020 to 31 December 2020, and descending track 124 on 29 December 2020 to 4 January 2021. The footprints of these three coseismic interferograms are shown in Figure 1 with arrows denoting the flight direction and look direction of the imaging satellite. The interferograms (Figure 2) with temporal baselines of 6 days were generated using the InSAR Scientific Computing Environment (ISCE) software (version 2.5.3) [12] and precise orbits provided by the European Space Agency (ESA). The traditional two-pass DInSAR method was employed to generate coseismic interferograms [13]. The standard 1 Arc-Second (30 m) Shuttle Radar Topography Mission (SRTM) Global digital elevation model (DEM) was used for the coregistering and correcting the topography-related noise [14]. In the interferometry process, a multilook ratio of 19:7 in range and azimuth directions (default values of ISCE) was applied to the interferograms to suppress decorrelation noises and improve the signal-to-noise ratio. The signal-to-noise ratio was also enhanced by applying the adaptive power spectrum filter of Goldstein and Werner [15] with a strength of 0.5 during the processing. The phase unwrapping was performed with the minimum cost flow SNAPHU (version 1.4.2) [16] program by masking the areas with coherence smaller than 0.7. Finally, the interferogram in radar coordinate system was geocoded to World Geodetic System 1984 (longitude and latitude) coordinate system. The quality of the interferograms (especially the near-fault area) was partly affected by the low coherence in the near-fault high-gradient deformation zone and tropospheric noise.
All the interferograms cover the whole zone of interest with surface displacement >2 cm except for the interferogram in Figure 2a, which covered only part of the west deformation zone. The phase difference is a measurement of the displacement in the LOS (Line of Sight) direction, with possible contributions of atmospheric delays, orbital errors, and thermal noise. Both the ascending and descending interferograms show the deformation in a “butterfly” pattern, while the opposite signs are presented due to different fly directions, implying mostly horizontal ground displacements motivated by right-lateral strike-slip motion (e.g., [13]). Figure 2a shows the rewrapped interferogram in ascending track P146A with heading and inclination angles of −169° and 38°, respectively, and temporal and spatial baselines of 6 days and 28 m, respectively; Figure 2b denotes the interferogram in descending track P124D with heading and inclination angles of −11° and 41°, respectively, and temporal and spatial baseline of 6 days and 6 m, respectively; Figure 2c indicates the interferogram in ascending track P073A with heading and inclination angles of −169° and 38°, respectively, and temporal and spatial baselines of 6 days and 15 m, respectively. Near-fault phase decorrelation was observed on all interferograms because of the large deformation gradients and the occurrence of high ground disruption and severe surface damage. The ranges of LOS displacements in two ascending interferograms are −12 to 31 cm in P073A and −11 to 32 cm in P146A, respectively, while the ranges in the descending interferogram are −12 to 16 cm (Figure 2). The ground motion characteristics across the fault implies the dominant component of right-lateral slip, consistent with most published focal mechanism solutions from analysis of seismic data (Table 1). Since the time span (6 days for ascending tracks P073A and P146A and 12 days for descending track P124D) of the interferometric pairs for the event is very short, we assumed a negligible interseismic signal and a small postseismic signal and deemed that all the interferograms are dominated by a coseismic signal. It is worth noting that the displacement field is asymmetric across the fault, with a larger displacement at the northwest side of the fault, suggesting a slightly west dipping fault.

2.2. Fault Model

The detailed slip model is of great importance to explain the tectonic mechanism of an earthquake and it is vital in evaluating the seismic risk on the regional faults in view of the coseismic and postseismic Coulomb static stress change. Using the InSAR LOS displacements from both the ascending and descending tracks, we first estimated the fault source parameters (including geometry and slip parameters) assuming that a single rectangular dislocation buried in a homogeneous elastic half-space [17]. Our inversion approach involved two successive steps making to possible to search first the uniform fault slip model embedded in a homogeneous elastic half-space with the nonlinear inversion method and then the kinematic parameters (strike and dip slip) of the best-fitting fault model slip distribution with a linear inversion. The InSAR ground displacements were inverted by using the particle swarm optimization (PSOKINV) package [18]. Nine fault parameters including fault location, strike, dip, length, depth, width, and slip were inverted by minimizing the misfit between the observations and model predictions, with a Poisson ratio of 0.25 and a shear modulus of 3.3 × 10 10 N/ m 2 .
To improve the computational efficiency, we subsampled the unwrapped interferograms using a resolution-based quadtree sampling method [19]. Each sampled data point comprises coordinates in longitude and latitude, the LOS unit vector, and the LOS displacement. The data points within 2 km of the fault trace were masked out to prevent near-fault spatial misfit. Finally, the number of data points was reduced from 2.5 million to 3247 after these steps. With these reduced data points, a Monte Carlo simulation technique was employed to invert for the fault parameters and estimate their uncertainties. To estimate the standard deviations, we constructed 100 sets of observations to perform the inversion. Simulated noises generated using 1-D covariance functions of the downsampled interferograms were added to the original observations. Then the perturbed data were inverted to estimate the source parameter errors. The modeling allowed us to explore the nine parameters: the coordinates of the center point of the top side, strike, dip, length, depth, width, and slip.
After estimating the best-fitting fault model parameters by the nonlinear inversion, we conducted an inversion for the variable slip model. To determine the finer details of the coseismic slip distribution in both fault strike and dip direction, we extended the dimensions of the fault to 30 km in length and 20 km in width and discretized the fault into 30 × 20 (each subpatch 1 km × 1 km) fault patches. The fault dip angle was fixed to 82 degrees according to the nonlinear inversion results of uniform model. The fault slip inversion turned out to be a linear problem, and a non-negative least square algorithm was used to solve it. The relationship between observations and slips at the patches can be written in the following form:
G δ α 2 L S = D 0
where G δ is the Green matrix relating slips at the patches to the predicted displacements, S is the slip vector at each patch, D is the InSAR LOS observations, L is the second-order finite difference approximation of the Laplacian operator, and α 2 is the smoothing factor.
A grid search method proposed by Feng et al. [18] was used to obtain the tradeoff between the smoothing factors and dip angles. A log function f δ , κ 2 = log ( φ + ξ ) was used to estimate the optimal dip angle and smoothing factor, where δ is the dip angle, φ is the model roughness, and ξ is the residuals.
The features of our preferred slip distribution model are discussed in Section 3.

3. Results

3.1. Coseismic Deformation Field

Significant coseismic ground deformation signals associated with the 2020 Mw 6.4 Petrinja earthquake have been captured by both the ascending and descending tracks of image pairs from Sentinel-1A/B satellite operated by ESA. The maximum positive and negative LOS displacements covering the epicentral area detected by the interferograms were 31 and −12 cm for P073A, 32 and −11 cm for P146A, and 16 and −12 cm for P124D, respectively. It should be noted that these are the real maximum displacements for the data we have that have not been lost to decorrelation. The coseismic displacements (Figure 2) show apparent unsymmetric “butterfly” patterns, including the north and south quadrants characterized by positive LOS displacements and the west and east quadrants characterized by negative LOS displacements in relatively larger values for ascending interferograms from Path 73 and 146; the sign of the LOS displacements is opposite for the descending interferogram from Path 124. These deformation patterns, which are consistent to the simulated deformation field, imply a NW-SE oriented seismogenic strike-slip fault with a steep dip angle. A 1-D covariance function [20] in the non-deforming areas was used to calculate the standard deviation of the interferograms, which were 11, 14, and 13 mm for P073A, P146A, and P124D, respectively, suggesting that the interferograms had a relatively low noise level.
We retrieved the 2.5-dimensional coseismic deformation field (Figure 3) of this earthquake from three pairs of TOPS interferograms using a method similar to Fujiwara et al. [21]. The approach is employed to extract quasi-eastward and quasi-upward components of the 2020 Petrinja earthquake using a least-squares optimization by ignoring the north components due to its small contribution (near-polar orbital geometry of the SAR satellites) to the LOS displacements [22]. Figure 3a,b show the quasi-eastward and quasi-upward displacement map of the 2020 Petrinja earthquake, respectively. The retrieved East–West displacement map shows positive (eastward) and negative (westward) displacements on the north-eastern and south-western side of the fault, respectively, consistent with the dextral strike-slip of the source fault (the Pokupsko Fault). The maximum eastward and westward displacements were 26.2 and 29.4 cm, respectively (Figure 3). The clearest feature of the vertical displacement map is uplift in the northwestern zone of the fault and subsidence in the north-eastern and south-western quadrants. The magnitude of uplift reaches 16 cm while the subsidence has a maximum amplitude of 10.5 cm and 11.3 cm in the north and south part, respectively. Larger displacements occurring at the west side of the fault suggest that the fault dips to west. Both the horizontal and vertical displacement maps demonstrate the deformation characteristics caused by right-lateral strike-slip of the source fault.

3.2. Coseismic Slip Model

The best-fitting model shows variable slip distribution in an area of ~25 km long and ~15 km wide on the source fault plane. Our preferred coseismic slip distribution (Figure 4a) and its corresponding standard deviations (Figure 4b) of the 2020 Petrinja earthquake is shown in Figure 4. The notable feature of the slip model is that one major dextral-slip asperity is constrained within a depth of 0 to 15 km, with the maximum slip of about 2.3 m at a depth of ~5 km, indicating that the fault slip extends to the ground surface. It is in accordance with the field investigation conducted by Tondi et al. [1]. They found NW-SE trending shear fractures implying right-lateral offset whose maximum value reaches 36 cm. The local largest offset was observed along the national road 37 [1].
Figure 5 shows the modeled and residual interferograms of three tracks. The three tracks of data were inverted with equal weight because of similar observation quality and approximate representations of the coseismic deformation. The inversion results show that the source fault is a dextral strike-slip fault dipping steeply at 82° to the southwest. The total geodetic moment released was 4.5 × 10¹⁸ N m, corresponding to an Mw 6.4 magnitude earthquake, which is in agreement with the seismic results from USGS and GCMT. Our preferred fault parameters are close to those obtained by Xiong et al. [23].
Comparison of the modeled and geodetic displacements shows that our preferred model reproduces the general characteristics of the surface deformation well (Figure 5a–c). No remarkable residual fringes can be found in the deforming area of our inverted fault. Residual root-mean-square of InSAR data are smaller than 2.8 cm for all three interferograms, suggesting good fitting to the displacements (Figure 5d–f). The average slip errors are ~4 cm, with the largest error attaining 6 cm in the depth of 12 km. The ratio between the errors and values of slip is below 6% for most of the slip area, confirming the reliability of our distributed slip model.
The optimal dip angle and smoothing factor derived from the grid search are 82° and 1.2, respectively (Figure 6).

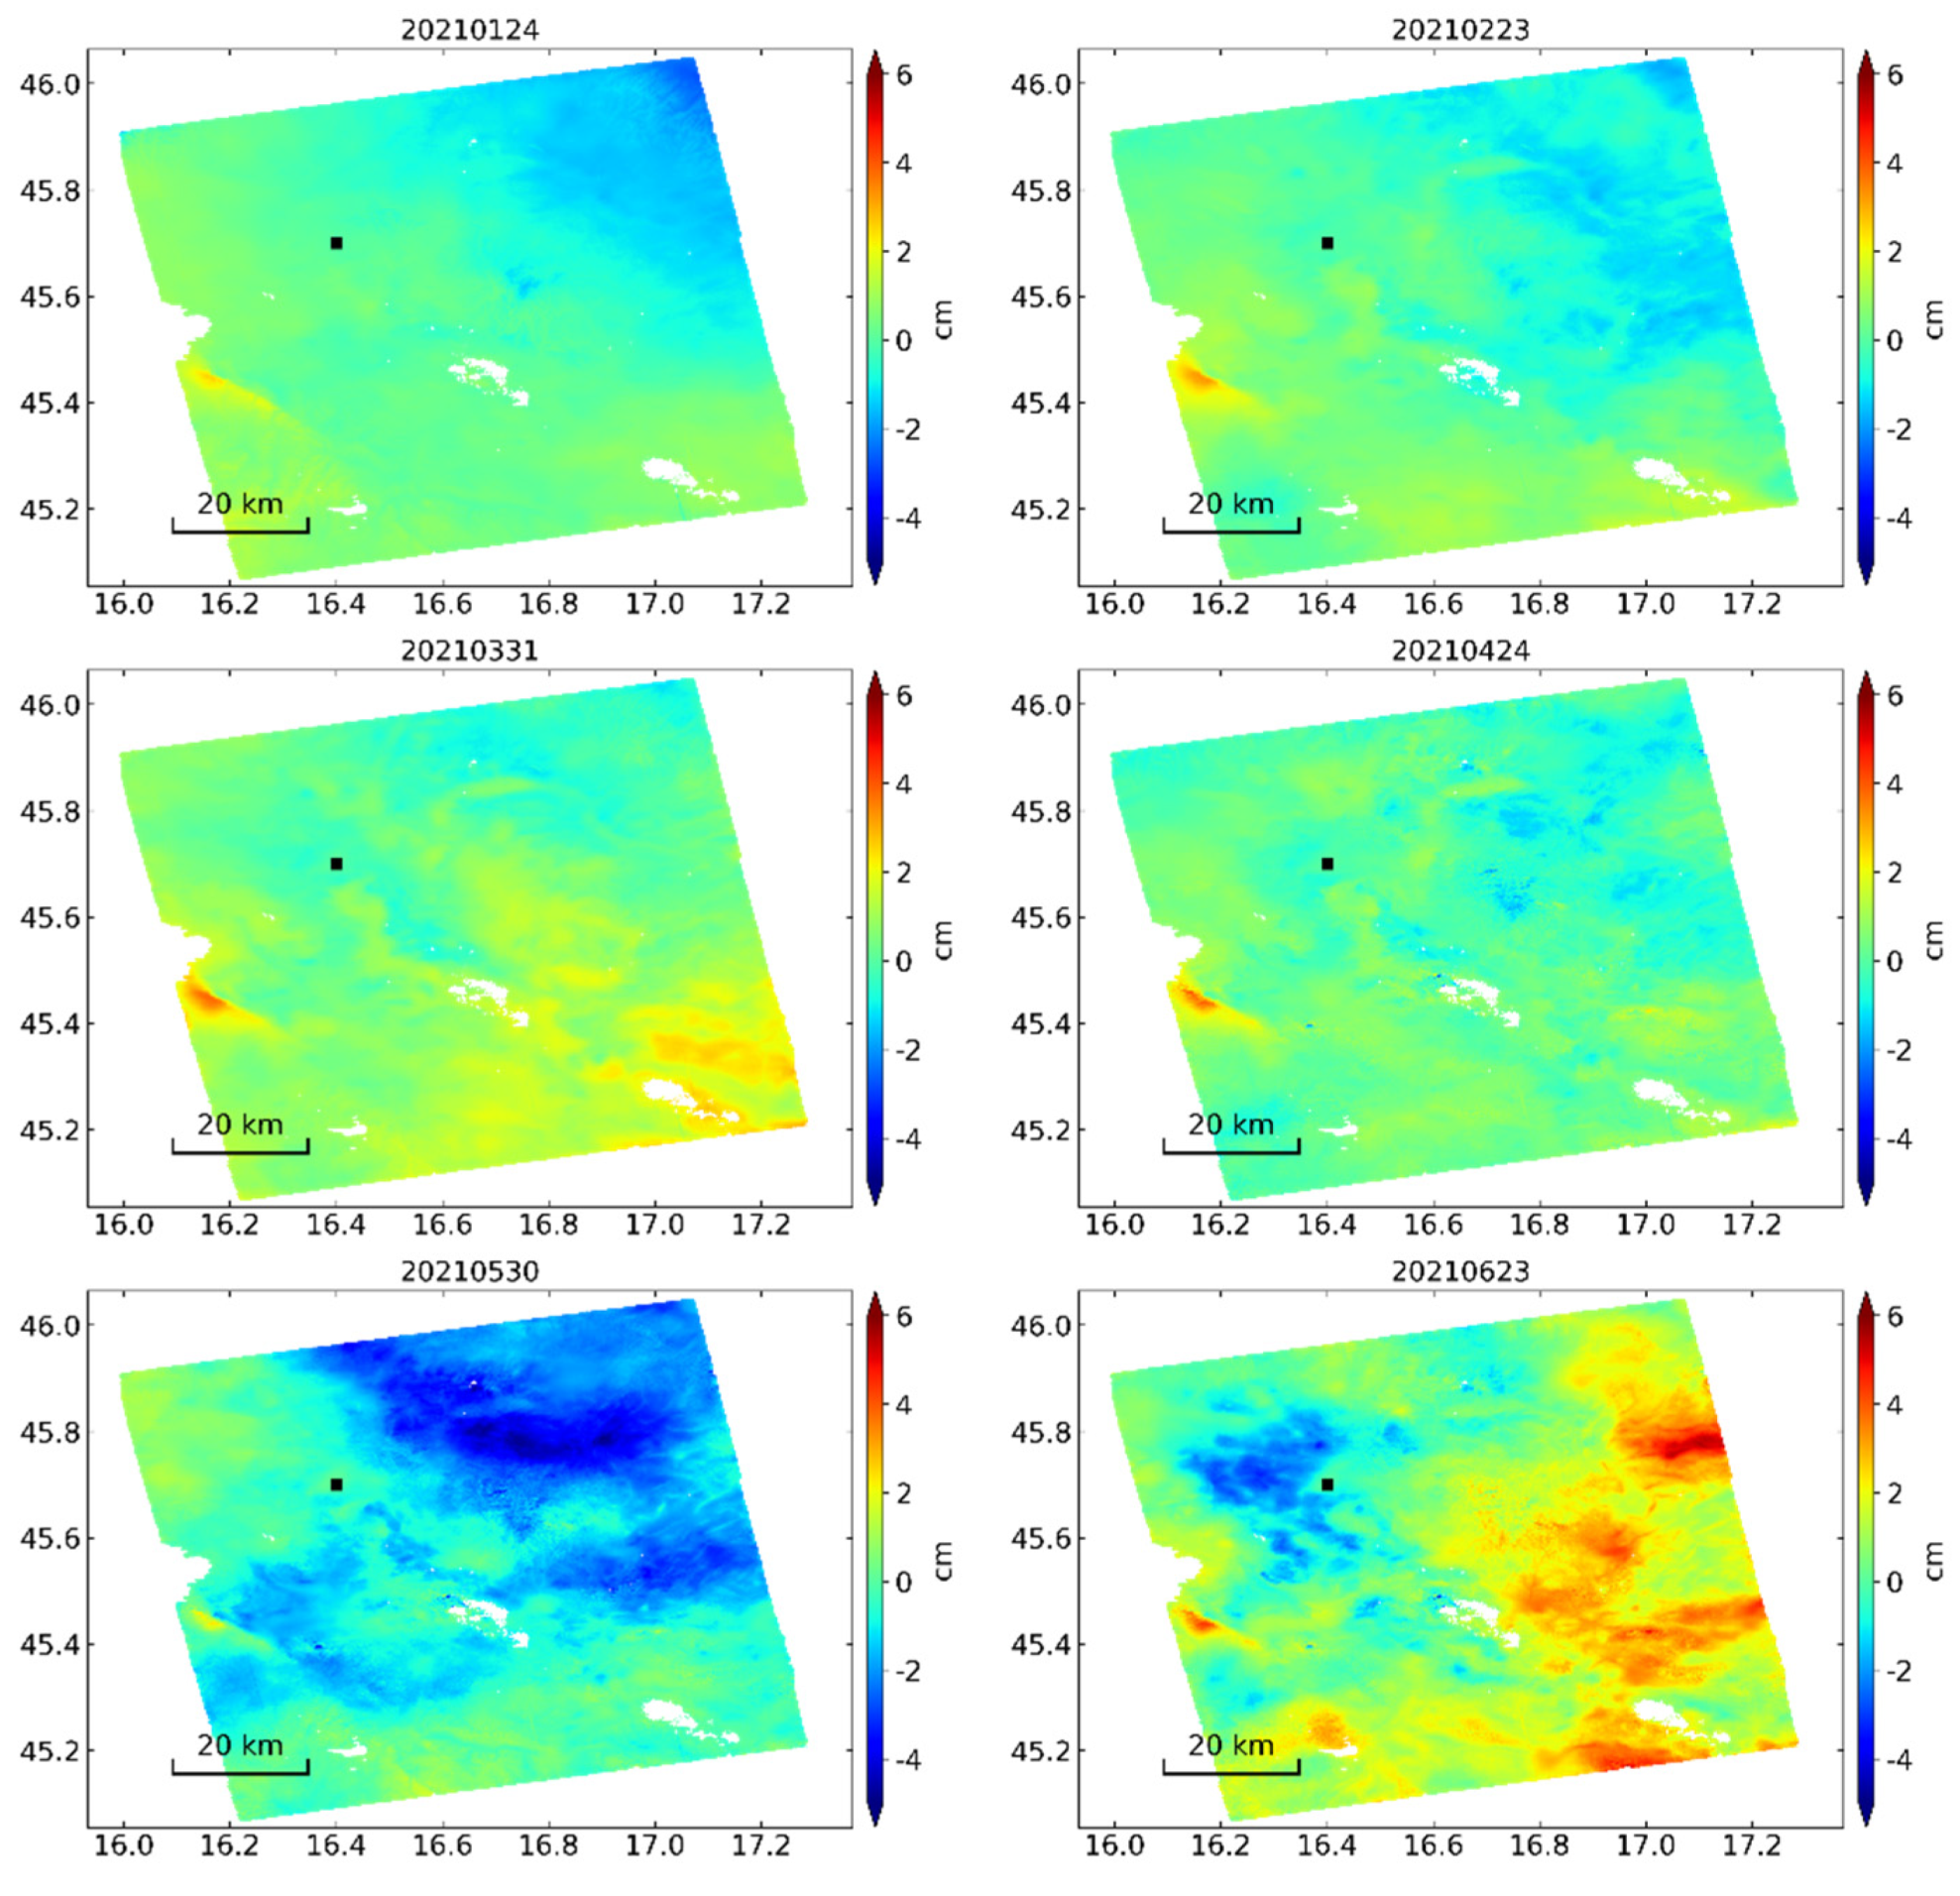
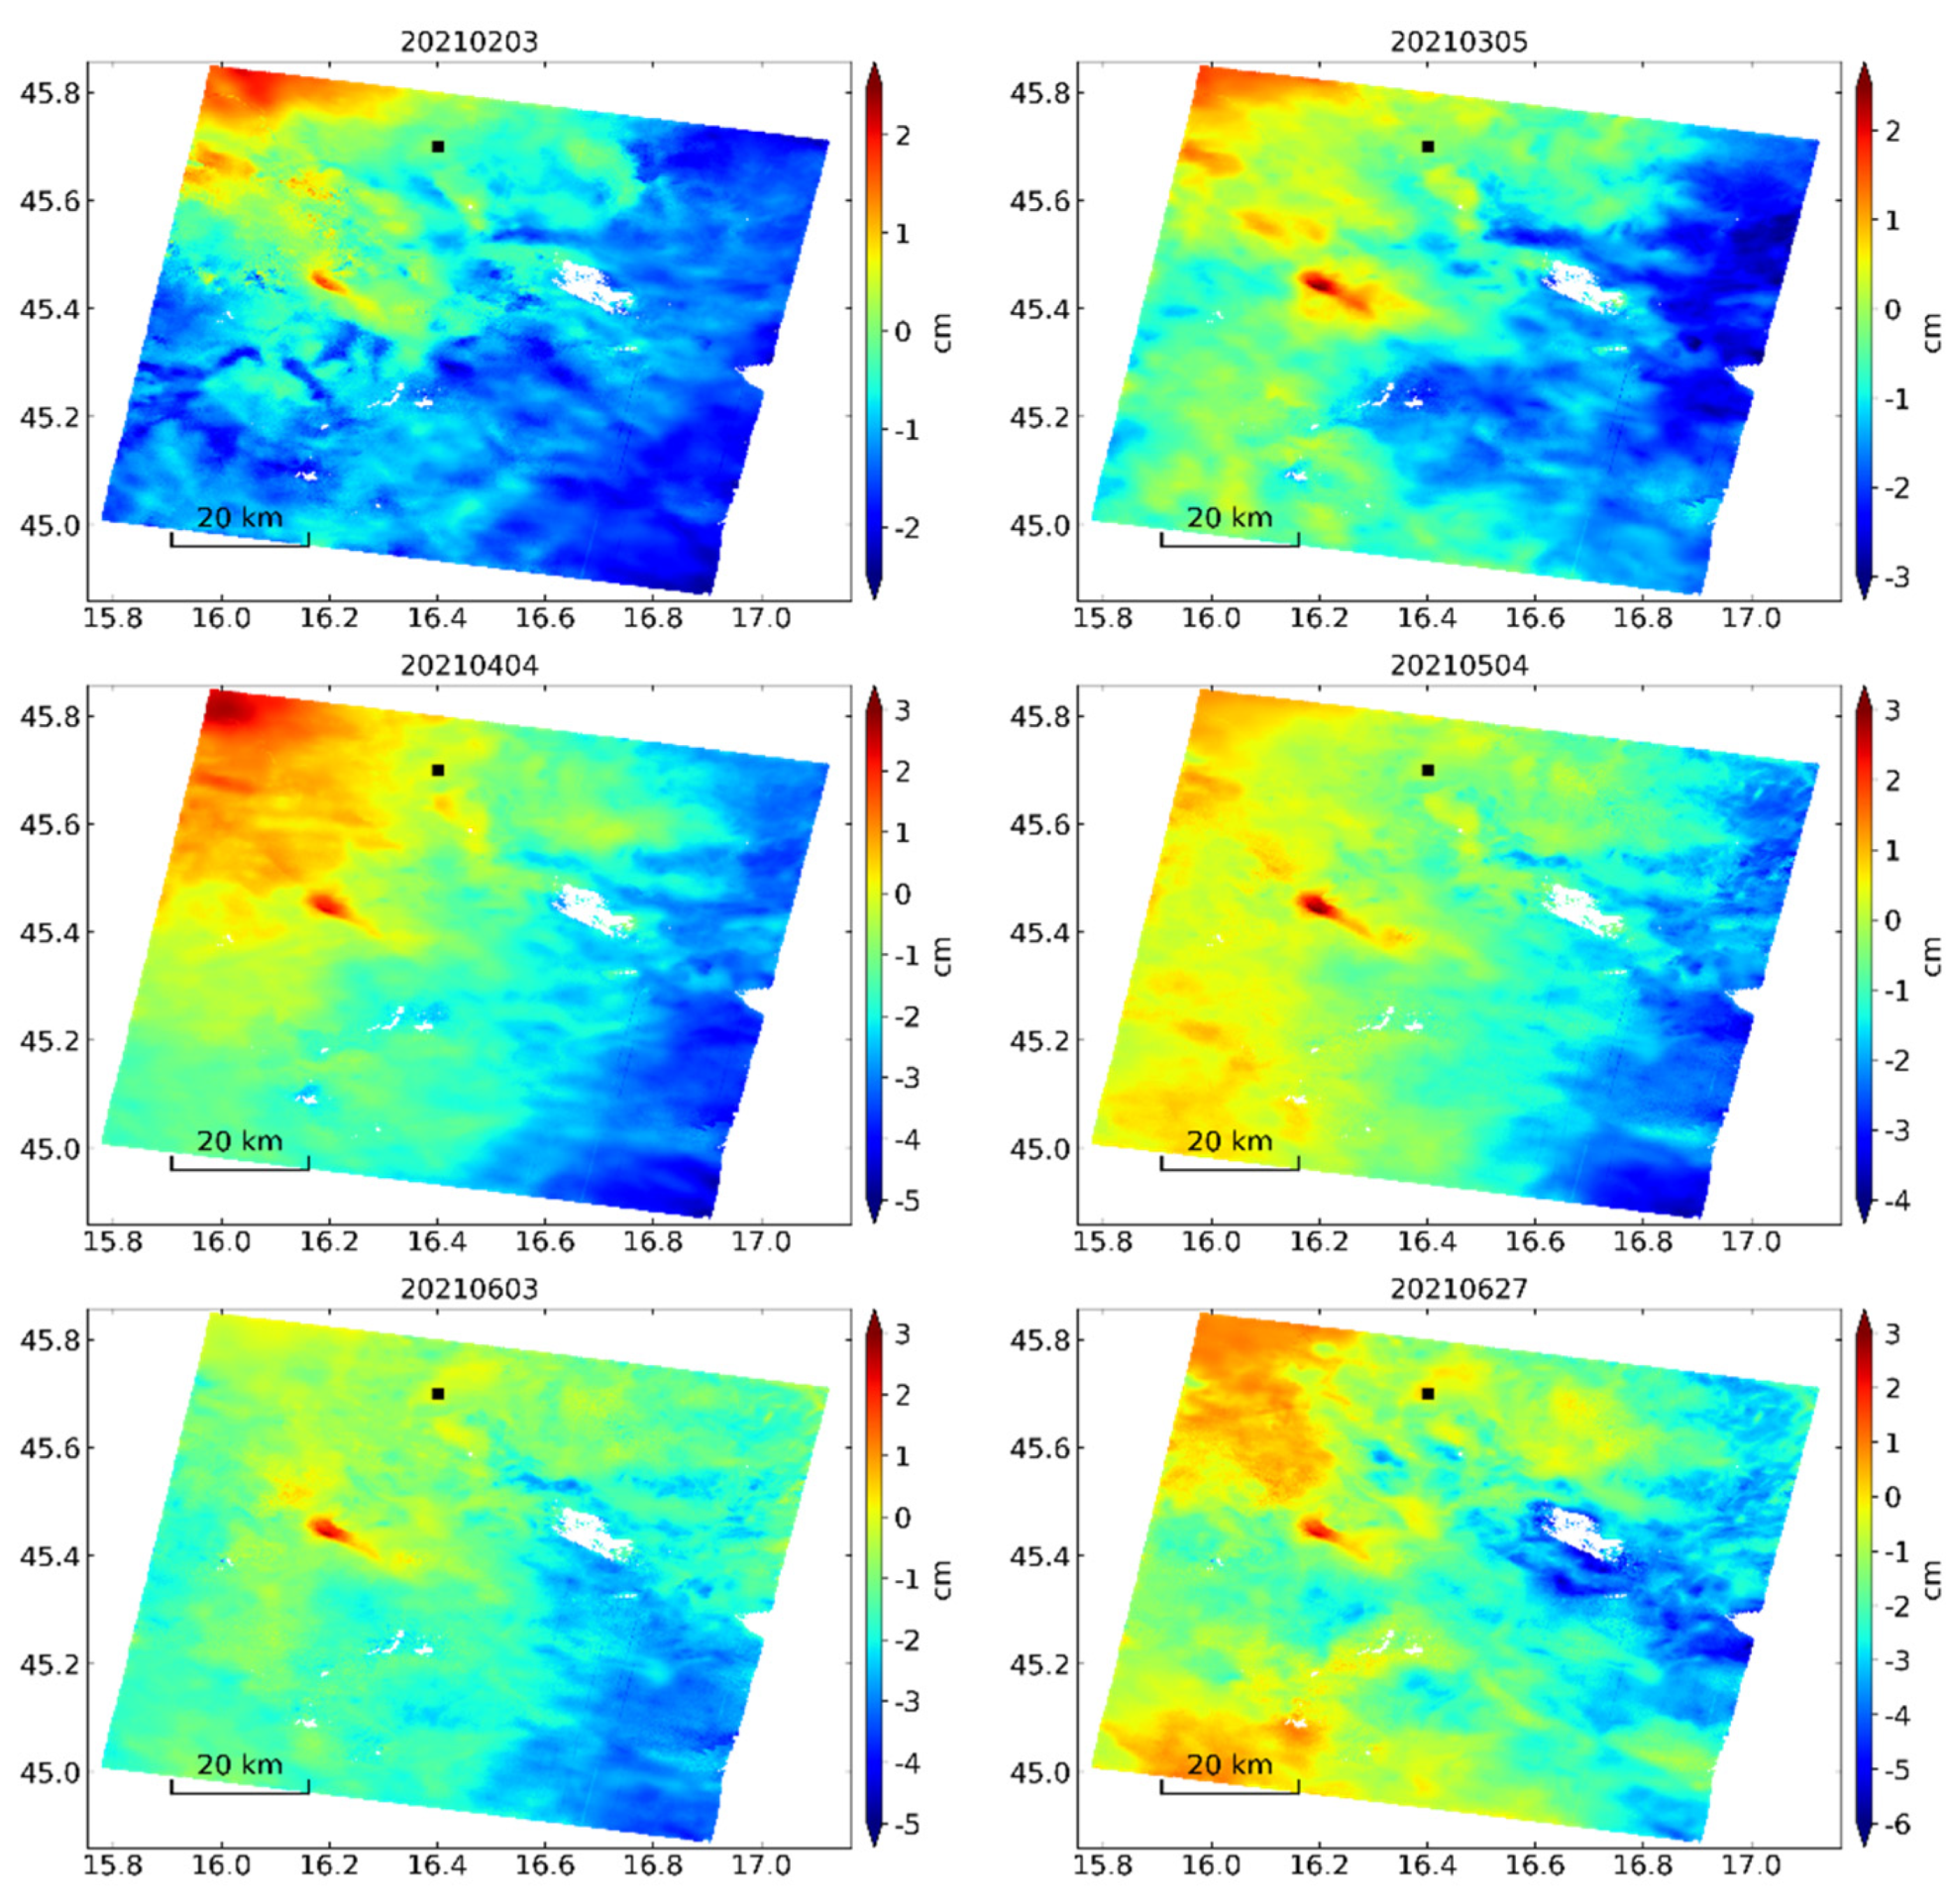
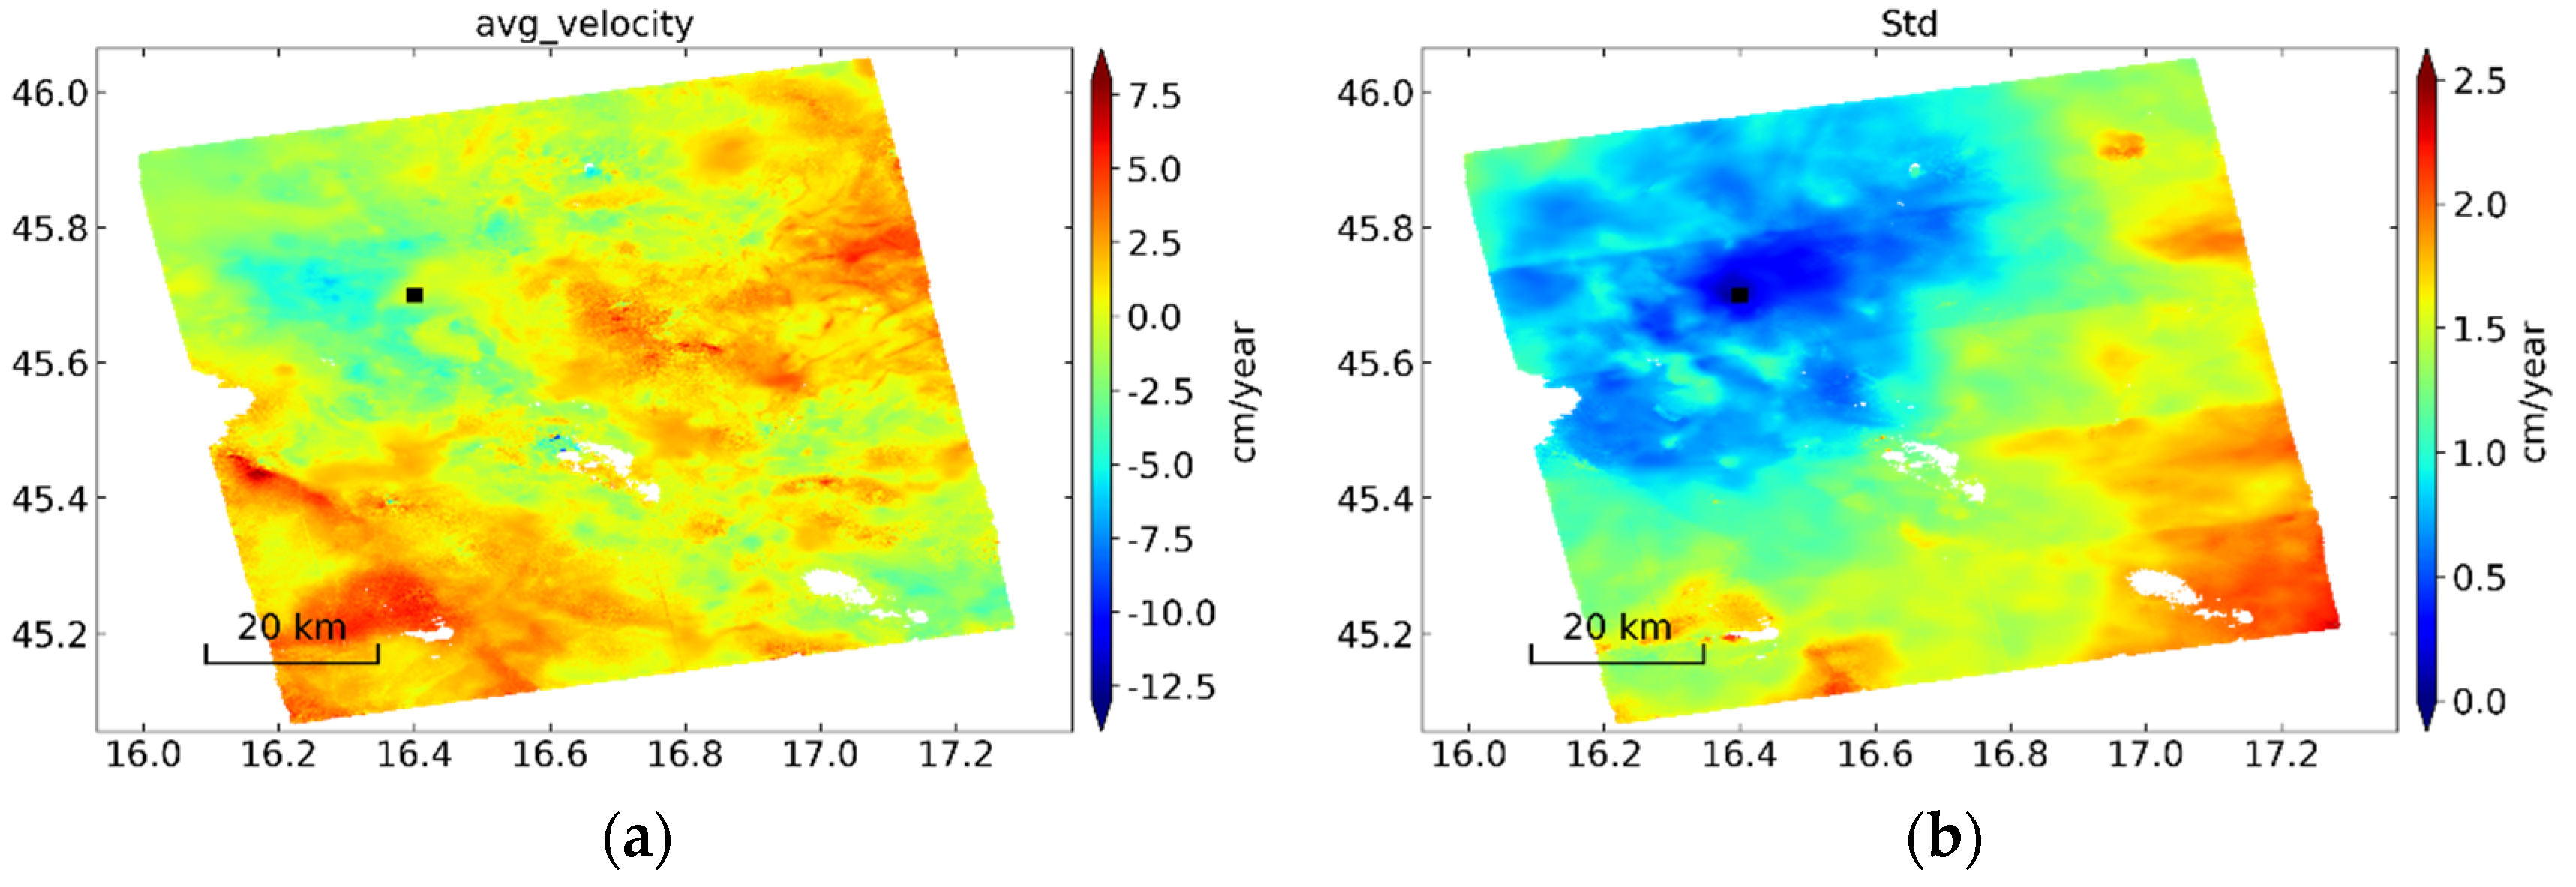
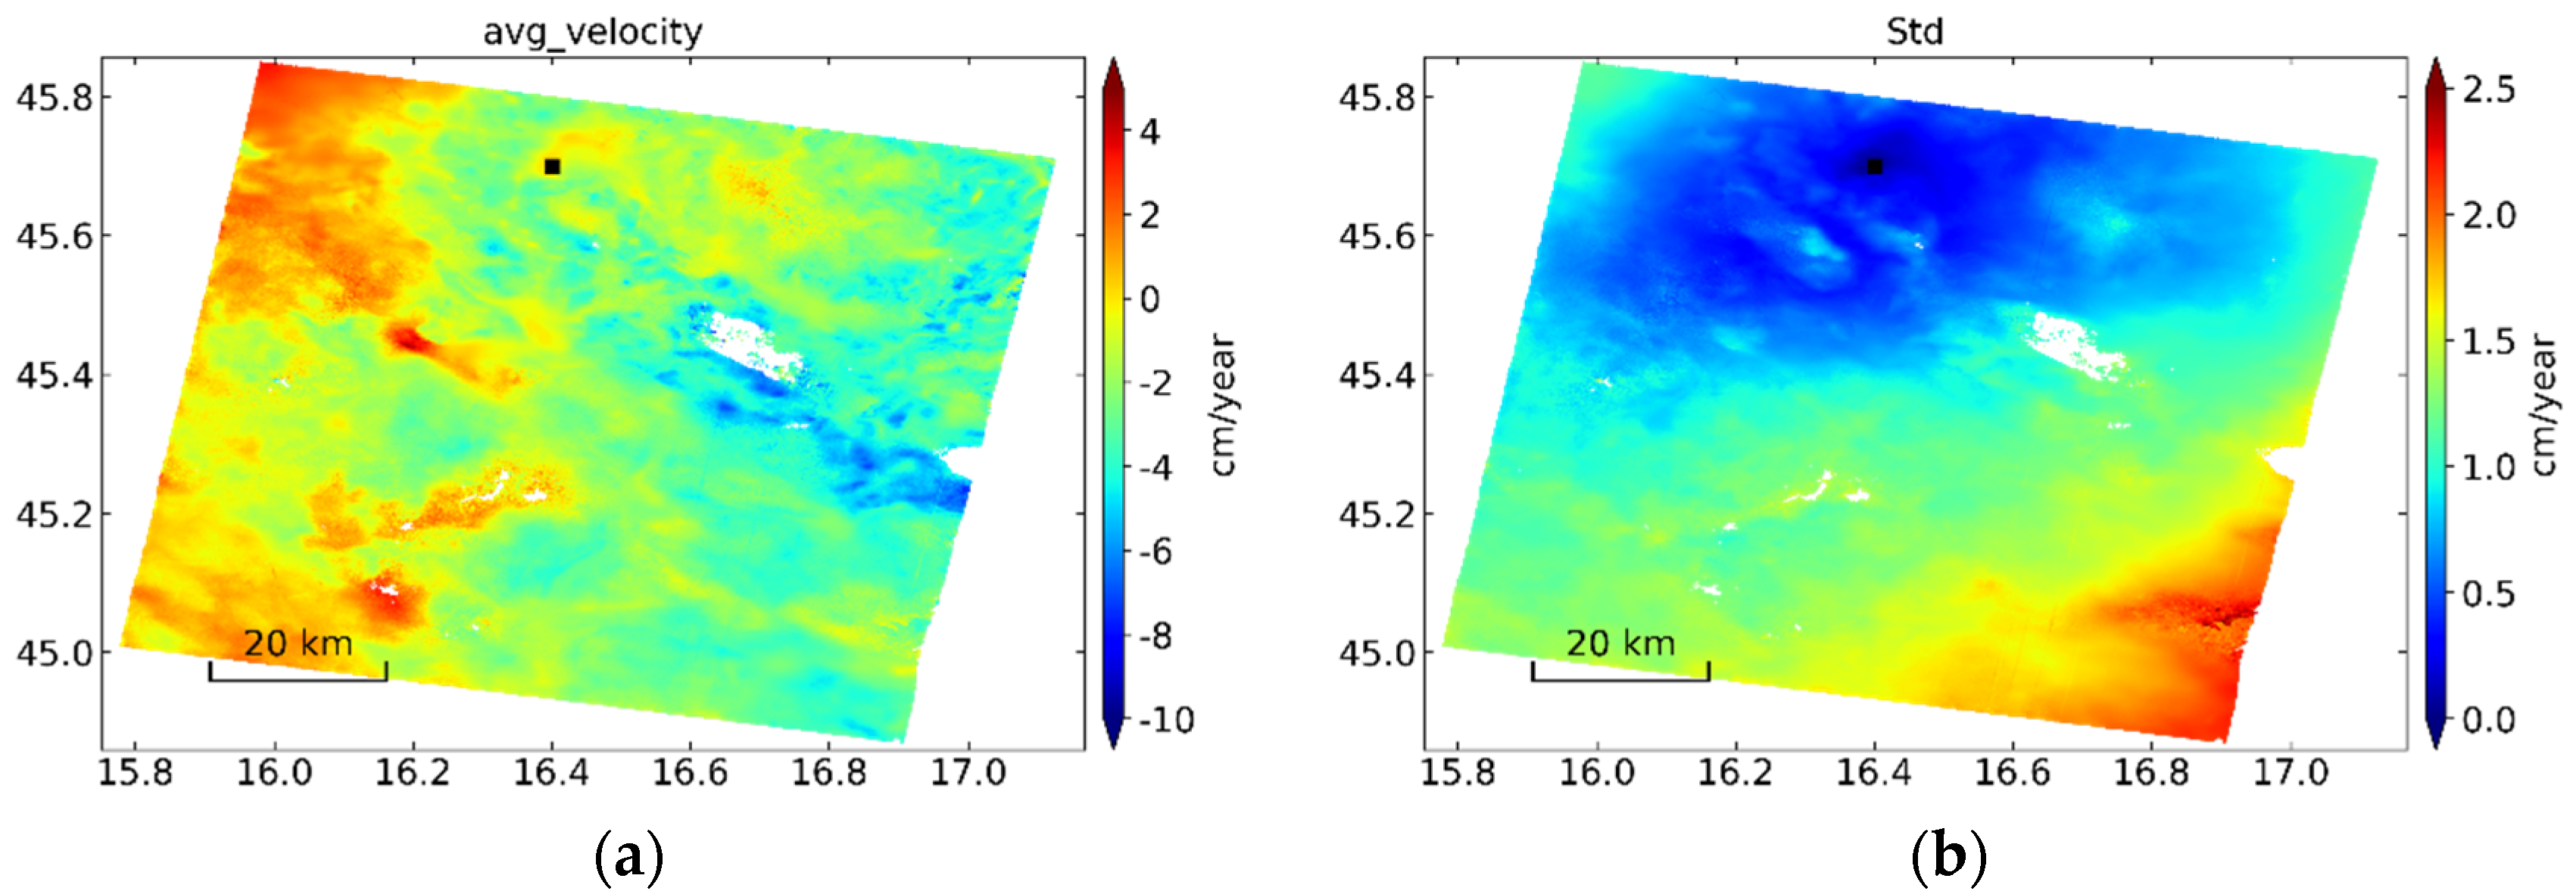
3.3. Postseismic Deformation

For strike-slip earthquakes with a magnitude close to the 2020 Petrinja earthquake (Mw 6.4), postseismic deformation is often observed within several days to months [24] after the mainshock. The first postseismic 6-day interferogram of this earthquake was constructed 7 days after the mainshock, with image pair 20201231–20210106 from ascending track P073A (Figure 7a). A sharp phase jump localized on the NW edge of the fault was observed in this earliest postseismic interferogram, the LOS displacement was ~2 cm in the first week after the mainshock. All the postseismic interferograms (Figure 7a–c) from the three different tracks showed localized uplift (in the black rectangle), suggesting minor horizontal deformation. The ascending track P146A presented the largest LOS displacement due its earlier acquisition time of master image and later acquisition time for secondary image. The similar magnitude of ascending track P073A and descending track P124D indicated almost the same deformation amount in the time period 20201231–20210106 and 20210104–20210110. This observation also demonstrates that most of the postseismic displacement in P146A occurred in the time period 20201230–20201231. Further, we processed the Sentinel-1 images acquired in the first 6 months after the event to evaluate the early postseismic deformation following the 2020 Petrinja earthquake. We utilized the Small BAseline Subset (SBAS) time-series method [25] implemented in the MintPy package [26] to construct the deformation time series. Two tracks of SAR data were used to construct the LOS deformation time series, including one ascending track P073A and one descending track P124D. The interferogram network of each track consists of 29 and 30 images, respectively. The temporal–spatial baselines are plotted in Figure 8. The deformation history with respect to the earliest acquisition is shown in Figure 9 and Figure 10, respectively. All the tracks demonstrated postseismic deformation in the northwestern edge of coseismic deformation region.
To reveal the deformation evolution, we selected several dates to plot the postseismic deformation time series. Figure 9 and Figure 10 presents the time series of P073A and P124D, respectively. Both tracks suggest ~2 cm postseismic LOS displacement in the first 6 months after the mainshock. The results again demonstrate the mainly uplift pattern of the postseismic deformation in half a year after the mainshock. The spatial patterns of the postseismic deformation of different tracks are slightly different due to different first acquisition date and different imaging geometry. We also plotted the standard deviation maps. The low standard deviation values (Figure 11b and Figure 12b) in the deformation region demonstrate the reliability of our time-series analysis.
Three mechanisms can be used to explain postseismic deformation: viscoelastic relaxation, poroelastic rebound, and afterslip [27,28]. To examine the possibility of the poroelastic rebound as the driving mechanism, we used the Poisson’s ratio under different conditions (0.28 for undrained value and 0.25 for drained value) to calculate the simulated deformation, then do a subtraction between them [27]. The predicted LOS displacements related to poroelastic rebound for different tracks are shown in Figure 13. The deformation caused by poroelastic rebound shows a larger extent compared with the observations. In addition, the sign of LOS displacement calculated from poroelastic rebound is opposite to the observed LOS motion. The surface deformation due to viscoelastic relaxation at larger depth than coseismic slip usually has a larger spatial extent than coseismic surface deformation [28]. However, the observed postseismic deformation is limited in a localized area. Due to different predicted deformation pattern and sign, we suggested that the contributions of poroelastic rebound and viscoelastic relaxation are small. The afterslip was adopted to understand the mechanism responsible for the postseismic deformation mainly in the early days.
To explore the detailed characteristics of afterslips, we conducted inversions of the postseismic displacements from ascending track P073A on the same fault of the coseismic slip. The fault geometry based on the coseismic slip model was utilized, with extending dimensions in both strike and dip directions. The correlation coefficient [27] between the inverted afterslip model of the Petrinja earthquake and the observed displacements is 0.4. However, the observed postseismic deformation was mainly uplift, which was totally different from strike-slip, the major coseismic deformation mechanism. Thus, we inverted the postseismic slip model using a nonlinear inversion method. Unfortunately, we cannot fit the observed postseismic displacements with a simple single-fault model better than the coseismic slip model. A complex model is not appropriate for the small displacement (~4 cm in 6 months after the event). Figure 7 shows that the spatial distribution of postseismic deformation is in good agreement with most of the aftershocks, including 9 M > 4 earthquakes. Based on these results, we speculated that the postseismic deformation was caused by a combined effect of the afterslip of the mainshock and the coseismic slip of hundreds of aftershocks.

4. Discussion

Based on the multi-geometry SAR observations of surface displacements, we jointly inverted for the fault source parameters employing the multi-peak particle swarm optimization algorithm—Monte Carlo style package PSOKINV [18]. Both the uniform and distributed slip models were estimated for the 2020 Petrinja earthquake, the largest earthquake in Croatia in the historic record. Our two-step inversions of InSAR displacements suggested that the best-fitting model has a right-lateral strike-slip mechanism with slight reverse-slip component. Our preferred slip distribution model of the 2020 Petrinja earthquake agrees with the published kinematic model [23] in a general sense. The slip distribution of our preferred model exhibits one slip patch of 30 km in length along strike and 20 km in depth along dip. The main asperity with maximum slip value of 2.3 m reaches the surface, indicating surface break of this dextral strike-slip event. Comparison between results of this earthquake from InSAR and seismology shows that most of the source parameters are in good agreements. In particular, both the hypocenter location and moment tensor from USGS are closer to our InSAR solutions than those from GCMT and INGV. These discrepancies are likely caused by the different data source and processing methods used by the different institutions. The maximum right-lateral slip value reaches 2.3 m, which is larger than the average value for slip of earthquakes in similar magnitude. The fault is also characterized by 0.2 m reverse slip, consistent with the source parameters obtained by seismic method. Our calculated geodetic moment is 4.5 × 10¹⁸ N m, equivalent to Mw 6.4, slightly larger than the seismic moment from USGS.
The first 6 months of Sentinel-1 data were processed to evaluate early postseismic deformation of the 2020 Petrinja earthquake. Both ascending and descending track results show localized uplift in ~4 cm at the northwest edge of the main fault. Neither the coseismic model nor the nonlinear inversing single-fault model can appropriately fit the postseismic deformation. We suggested that the combined effect of the afterslip of the mainshock and the coseismic slip of aftershocks is the main contributor to the early postseismic displacements.
The seismic stress triggering theory indicates that the regional stress accumulated by tectonic activity will be released when seismic and aseismic slip occur on active faults.
Based on the best-fitting fault model, the coseismic static Coulomb failure stress (CFS) changes induced by the 2020 Petrinja earthquake in the surrounding active faults were calculated using the USGS software Coulomb 3.4 [29]. According to the Coulomb failure law, the static Coulomb failure stress ∆CFS on a given receiver fault plane is defined as
C F S = τ β + μ σ n
where τ β is the shear stress change on the receiver fault, μ is the coefficient of effective friction, and σ n is the fault-normal stress change.
We calculated the Coulomb failure stress change of the mainshock on the source region following the Coulomb failure law. Following previous studies on the strike-slip faults [24], the effective coefficient of friction and the shear modulus were chosen to be 0.4 and 3.32 × 10¹⁰ N/m2, respectively.
The calculated static Coulomb failure stress change (at depth 5 km) induced by the 2020 Petrinja earthquake with the best-fitting distributed slip model is shown in Figure 14. The results demonstrate that the Petrinja earthquake raised the Coulomb stress by about 0.5 bar on the NW extension of the source fault where ~2 cm postseismic displacements in the first 6 months and most aftershocks occurred.
Generally, most of the aftershocks occurred at areas with positive coseismic CFS changes [30,31]. The 2020 Petrinja earthquake confirms this spatial correlation like previous earthquakes. Some aftershocks occurred in areas with negative CFS change, and we cannot explain them with Coulomb failure law. We proposed that they were caused by other tectonic mechanisms, which are beyond the scope of this study.
Using present-day velocities derived from GPS network, Weber et al. [32] explored the kinematic parameters of the Adriatic microplate and estimated that the convergence rate of the Adriatic microplate is smaller than 5 mm/yr. Based on the loading rate and coseismic average slip inverted in this study, an earthquake recurrence interval of over 500 years is obtained if the 2020 Petrinja earthquake released all the strain energy accumulated in this fault segment. The earthquake recurrence interval is consistent with the historic earthquake record [1] that no Mw > 6.4 earthquakes have been found in this area. The large coseismic slip and small afterslip indicate that most of the accumulated strain energy is released by the mainshock, suggesting decreased seismic hazard in this fault segment.

5. Conclusions

The 2020 Petrinja earthquake occurred near Petrinja, about 40 km southeast of the capital of Zagreb in a region with moderate seismic activity [23]. We used three Sentinel-1 interferograms spanning the rupture event to investigate the coseismic surface deformation and inverted the fault slip parameters of the source fault to shed light on the driving mechanism of such an event. Our modeling of slip during the earthquake showed a shallow right-lateral strike-slip mechanism with 2.5 m slip in average for a patch 8.2 km length and 5.3 km width with a secondary reverse component. The slip distribution model showed an absence of shallow slip deficit (SSD) indicating that the fault rupture reached the surface, in good agreement with field observations [1]. We also processed the Sentinel-1 data acquired 6 months after the main event to probe the early postseismic deformation. We propose that the main mechanism of the postseismic deformation is the combination of aseismic afterslip of the mainshock and the seismic slip of aftershocks, which corresponds well with the coseismic static stress change caused by the mainshock. The strong spatial correlation between the static stress increase and the postseismic activities including the afterslip and aftershocks indicates that the static stress changes play an important role in the triggering of aseismic and seismic fault slip. Our study has important implications for understanding the tectonic mechanism in Central Croatia.

Author Contributions

Conceptualization, S.Z. and Y.W.; methodology, S.Z.; software, S.Z.; validation, S.Z., Y.W. and X.G.; formal analysis, S.Z.; investigation, S.Z.; resources, J.L.; data curation, S.Z.; writing—original draft preparation, S.Z.; writing—review and editing, S.Z., Y.W. and X.G.; visualization, S.Z.; supervision, J.L.; project administration, J.L.; funding acquisition, J.L. All authors have read and agreed to the published version of the manuscript.

Funding

This research was funded by Shenzhen Science and Technology Program (JCYJ20210324123611032), the Natural Science Fund of China with Project No. 42111530064 and 41874031.

Data Availability Statement

The Sentinle-1 data are available from the Copernicus Sentinels Scientific Data Hub (https://scihub.copernicus.eu/, accessed on 15 May 2023) and the Alaska Satellite Facility (https://search.asf.alaska.edu/, accessed on 15 May 2023). The ISCE2 software is available on GitHub at https://github.com/isce-framework/isce2, accessed on 15 May 2023. The European Database of Seismogenic Faults (EDSF) is obtained from the EU Project SHARE on https://edsf13.ingv.it/SHARE_WP3.2_Downloads.html, accessed on 15 May 2023.

Acknowledgments

We thank the European Space Agency for providing us the Sentinel-1 data freely through the Alaska Satellite Facility Data Search portal (https://search.asf.alaska.edu/, accessed on 15 May 2023) and the precise orbit files through https://s1qc.asf.alaska.edu/, accessed on 15 May 2023. Some of the figures in this paper are plotted using the Generic Mapping Tools (GMT5) and matplotlib.

Conflicts of Interest

The authors declare no conflict of interest.

References

  1. Tondi, E.; Blumetti, A.M.; Čičak, M.; Di Manna, P.; Galli, P.; Invernizzi, C.; Mazzoli, S.; Piccardi, L.; Valentini, G.; Vittori, E.; et al. ‘Conjugate’ coseismic surface faulting related with the 29 December 2020, Mw 6.4, Petrinja earthquake (Sisak-Moslavina, Croatia). Sci. Rep. 2021, 11, 9150. [Google Scholar] [CrossRef] [PubMed]
  2. Baize, S.; Amoroso, S.; Belić, N.; Benedetti, L.; Boncio, P.; Budić, M.; Cinti, F.R.; Henriquet, M.; Rupnik, P.J.; Kordić, B.; et al. Environmental effects and seismogenic source characterization of the December 2020 earthquake sequence near Petrinja, Croatia. Geophys. J. Int. 2022, 230, 1394–1418. [Google Scholar] [CrossRef]
  3. Ganas, A.; Elias, P.; Valkaniotis, S.; Tsironi, V.; Karasante, I.; Briole, P. Petrinja earthquake moved crust 10 feet. Temblor 2021. [Google Scholar] [CrossRef]
  4. Herak, D.; Herak, M.; Tomljenović, B. Seismicity and earthquake focal mechanisms in North-Western Croatia. Tectonophysics 2009, 485, 212–220. [Google Scholar] [CrossRef]
  5. Métois, M.; D’Agostino, N.; Avallone, A.; Chamot-Rooke, N.; Rabaute, A.; Duni, L.; Kuka, N.; Koci, R.; Georgiev, I. Insights on continental collisional processes from GPS data: Dynamics of the peri-Adriatic belts. J. Geophys. Res. Solid Earth 2015, 120, 8701–8719. [Google Scholar] [CrossRef]
  6. Bennett, R.A.; Hreinsdóttir, S.; Buble, G.; Bačić, T.; Marjanović, M.; Casale, G.; Gendaszek, A.; Cowan, D. Eocene to present subduction of southern Adria mantle lithosphere beneath the Dinarides. Geology 2008, 36, 3–6. [Google Scholar] [CrossRef]
  7. Battaglia, M.; Murray, M.H.; Serpelloni, E.; Burgmann, R. The Adriatic region: An independent microplate within the Africa-Eurasia collision zone. Geophys. Res. Lett. 2004, 31, L09605. [Google Scholar] [CrossRef]
  8. Barnhart, W.D.; Hayes, G.P.; Gold, R.D. The July 2019 Ridgecrest, California, earthquake sequence: Kinematics of slip and stressing in cross-fault ruptures. Geophys. Res. Lett. 2019, 46, 11859–11867. [Google Scholar] [CrossRef]
  9. Govorčin, M.; Wdowinski, S.; Matoš, B.; Funning, G.J. Geodetic source modeling of the 2019 Mw 6.3 Durrës, Albania, earthquake: Partial rupture of a blind reverse fault. Geophys. Res. Lett. 2020, 47, e2020GL088990. [Google Scholar] [CrossRef]
  10. Fathian, A.; Atzori, S.; Nazari, H.; Reicherter, K.; Salvi, S.; Svigkas, N.; Tatar, M.; Tolomei, C.; Yaminifard, F. Complex co- and postseismic faulting of the 2017–2018 seismic sequence in western Iran revealed by InSAR and seismic data. Remote Sens. Environ. 2021, 253, 112224. [Google Scholar] [CrossRef]
  11. Milliner, C.; Bürgmann, R.; Inbal, A.; Wang, T.; Liang, C. Resolving the kinematics and moment release of early afterslip within the first hours following the 2016 Mw 7.1 Kumamoto earthquake: Implications for the shallow slip deficit and frictional behavior of aseismic creep. J. Geophys. Res. Solid Earth 2020, 125, e2019JB018928. [Google Scholar] [CrossRef]
  12. Rosen, P.A.; Gurrola, E.; Sacco, G.F.; Zebker, H. The InSAR scientific computing environment. In Proceedings of the EUSAR 2012—9th European Conference on Synthetic Aperture Radar, Nuremberg, Germany, 23–26 April 2012; pp. 730–733. [Google Scholar]
  13. Massonnet, D.; Rossi, M.; Carmona, C.; Adragna, F.; Peltzer, G.; Feigl, K.; Rabaute, T. The displacement field of the Landers earthquake mapped by radar interferometry. Nature 1993, 364, 138–142. [Google Scholar] [CrossRef]
  14. Farr, T.G.; Rosen, P.A.; Caro, E.; Crippen, R.; Duren, R.; Hensley, S.; Kobrick, M.; Paller, M.; Rodríguez, E.; Roth, L.; et al. The Shuttle Radar Topography Mission. Rev. Geophys. 2007, 45, 361. [Google Scholar] [CrossRef]
  15. Goldstein, R.M.; Werner, C.L. Radar interferogram filtering for geophysical applications. Geophys. Res. Lett. 1998, 25, 4035–4038. [Google Scholar] [CrossRef]
  16. Chen, C.W.; Zebker, H.A. Network approaches to two-dimensional phase unwrapping: Intractability and two new algorithms. JOSA A 2000, 17, 401–414. [Google Scholar] [CrossRef]
  17. Okada, Y. Surface deformation due to shear and tensile faults in a half-space. Bull. Seismol. Soc. Am. 1985, 75, 1135–1154. [Google Scholar] [CrossRef]
  18. Feng, W.; Li, Z.; Elliott, J.R.; Fukushima, Y.; Hoey, T.; Singleton, A.; Cook, R.; Xu, Z. The 2011MW 6.8 Burma earthquake: Fault constraints provided by multiple SAR techniques. Geophys. J. Int. 2013, 195, 650–660. [Google Scholar] [CrossRef]
  19. Lohman, R.B.; Simons, M. Some thoughts on the use of InSAR data to constrain models of surface deformation: Noise structure and data downsampling. Geochem. Geophys. Geosystems 2005, 6, 1–12. [Google Scholar] [CrossRef]
  20. Parsons, B.; Wright, T.; Rowe, P.; Andrews, J.; Jackson, J.; Walker, R.; Khatib, M.; Talebian, M.; Bergman, E.; Engdahl, E.R. The 1994 Sefidabeh (Eastern Iran) earthquakes revisited: New evidence from satellite radar interferometry and carbonate dating about the growth of an active fold above a blind thrust fault. Geophys. J. Int. 2005, 164, 202–217. [Google Scholar] [CrossRef]
  21. Fujiwara, S.; Nishimura, T.; Murakami, M.; Nakagawa, H.; Tobita, M.; Rosen, P.A. 2.5-D surface deformation of M6.1 earthquake near Mt Iwate detected by SAR interferometry. Geophys. Res. Lett. 2000, 27, 2049–2052. [Google Scholar] [CrossRef]
  22. Wen, Y.; Xu, C.; Liu, Y.; Jiang, G. Deformation and source parameters of the 2015 Mw 6.5 earthquake in Pishan, Western China, from sentinel-1A and ALOS-2 data. Remote Sens. 2016, 8, 134. [Google Scholar] [CrossRef]
  23. Xiong, W.; Yu, P.; Chen, W.; Liu, G.; Zhao, B.; Nie, Z.; Qiao, X. The 2020 Mw 6.4 Petrinja earthquake: A dextral event with large coseismic slip highlights a complex fault system in northwestern Croatia. Geophys. J. Int. 2022, 228, 1935–1945. [Google Scholar] [CrossRef]
  24. Jin, Z.; Fialko, Y. Coseismic and early postseismic deformation due to the 2021 M7.4 Maduo (China) earthquake. Geophys. Res. Lett. 2021, 48, e2021GL095213. [Google Scholar] [CrossRef]
  25. Berardino, P.; Fornaro, G.; Lanari, R.; Sansosti, E. A new algorithm for surface deformation monitoring based on small baseline differential SAR interferograms. IEEE Trans. Geosci. Remote Sens. 2002, 40, 2375–2383. [Google Scholar] [CrossRef]
  26. Zhang, Y.J.; Fattahi, H.; Amelung, F. Small baseline InSAR time series analysis: Unwrapping error correction and noise reduction. Comput. Geosci. 2019, 133, 104331. [Google Scholar]
  27. Feng, W.; Samsonov, S.; Almeida, R.; Yassaghi, A.; Li, J.; Qiu, Q.; Li, P.; Zheng, W. Geodetic constraints of the 2017 Mw 7.3 Sarpol Zahab, Iran earthquake, and its implications on the structure and mechanics of the northwest Zagros thrust-fold belt. Geophys. Res. Lett. 2018, 45, 6853–6861. [Google Scholar] [CrossRef]
  28. Zhou, Y.; Thomas, M.Y.; Parsons, B.; Walker, R.T. Time-dependent postseismic slip following the 1978 Mw 7.3 Tabas-e-Golshan, Iran earthquake revealed by over 20 years of ESA InSAR observations. Earth Planet. Sci. Lett. 2018, 483, 64–75. [Google Scholar] [CrossRef]
  29. Toda, S.; Stein, R.S.; Sevilgen, V.; Lin, J. Coulomb 3.3 Graphic-Rich Deformation and Stress-Change Software for Earthquake, Tectonic, and Volcano Research and Teaching-User Guide: U.S. Geological Survey Open-File Report 2011–1060. Available online: https://pubs.usgs.gov/of/2011/1060/ (accessed on 15 May 2023).
  30. King, G.C.P.; Stein, R.S.; Lin, J. Static stress changes and the triggering of earthquakes. Bull. Seismol. Soc. Am. 1994, 84, 935–953. [Google Scholar]
  31. Stein, R.S. The role of stress transfer in earthquake occurrence. Nature 1999, 402, 605–609. [Google Scholar] [CrossRef]
  32. Weber, J.; Vrabec, M.; Pavlovčič-Prešeren, P.; Dixon, T.; Jiang, Y.; Stopar, B. GPS-derived motion of the Adriatic microplate from Istria Peninsula and Po Plain sites, and geodynamic implications. Tectonophysics 2010, 483, 214–222. [Google Scholar] [CrossRef]
Figure 1. Location map showing shaded topography, the focal mechanism of the Petrinja 29 December 2020, earthquake (Mw = 6.4) from different agencies. White rectangles indicate coverage of Sentinel-1 SAR data (two ascending track P073A, P146A, and one descending track P124D). The faults are denoted by solid black lines (from https://seismofaults.eu/edsf13data, accessed on 15 May 2023). Petrinja is represented by the yellow star. Zagreb, the capital city of Croatia, is represented by the white circle. Inset box indicates the location of earthquake area within Croatia.
Remotesensing 15 02617 g001
Figure 2. The coseismic interferograms of the Petrinja earthquake. (a) shows the image pair 20201225–20201231 (ascending orbit 73). (b): 20201223–20210104 (descending orbit 124). (c): 20201224–20201230 (ascending orbit 146). The white solid lines indicate the locations of two faults.
Remotesensing 15 02617 g002
Figure 3. 2.5-D ground surface displacements of the 2020 Mw 6.4 Petrinja earthquake. (a) East–west and (b) vertical displacement components derived from the Sentinel-1 interferograms. The black beach balls with names mark the epicenter of the mainshock from different agencies. The red solid lines indicate the locations of two faults. Aftershocks are shown in black circles.
Remotesensing 15 02617 g003
Figure 4. Slip distribution model (a) and its standard deviations (b) of the 2020 Petrinja earthquake from Monte Carlo estimation.
Remotesensing 15 02617 g004
Figure 5. Observational (ac), synthetic (df) and residual (gi) interferograms of our preferred fault model.
Remotesensing 15 02617 g005
Figure 6. Tradeoff map of smoothing factors and dip angles.
Remotesensing 15 02617 g006
Figure 7. InSAR maps obtained from different tracks showing postseismic deformation in the first 6 days of after the mainshock. (a) P073A. (b) P124D. (c) P146A.
Remotesensing 15 02617 g007
Figure 8. Baseline plots of selected interferograms from two Sentinel-1 tracks. Circles are selected SAR acquisitions: 29 for ascending track 73, and 30 for descending track 124.
Remotesensing 15 02617 g008
Figure 9. Postseismic deformation series with respect to the date of first postseismic acquisition 20201231 in 6 months after the main event from ascending track P073A. The black rectangle denotes the location of reference point.
Remotesensing 15 02617 g009
Figure 10. Postseismic deformation series with respect to the date of the first postseismic acquisition 20210104 in 6 months after the main event from descending track P124D. The black rectangle denotes the location of reference point.
Remotesensing 15 02617 g010
Figure 11. (a,b) Average velocity and its standard deviation of postseismic deformation in the ascending track P073A. The black rectangle denotes the location of reference point.
Remotesensing 15 02617 g011
Figure 12. (a,b) Average velocity and its standard deviation of postseismic deformation in the descending track P124D. The black rectangle denotes the location of reference point.
Remotesensing 15 02617 g012
Figure 13. Predicted LOS displacements in each track caused by poroelastic rebound for the 2020 Petrinja earthquake. The black rectangle denotes the surface projection of distributed slip model. (a) P073A. (b) P124D. (c) P146A.
Remotesensing 15 02617 g013
Figure 14. Coulomb failure stress change caused by the 2020 Mw 6.4 Petrinja earthquake. The black circles denote the location of relocated aftershocks obtained from EMSC (https://www.emsc-csem.org/, accessed on 15 May 2023).
Remotesensing 15 02617 g014
Table 1. Source parameters of the 2020 Mw 6.4 Petrinja earthquake.
Lon.Lat.DepthStrikeDipRakeLengthWidth
Source(°)(°)(km)(°)(°)(°)(km)(km)Mw
2248914
USGS16.25545.42213.513476179--6.4
223828
GCMT16.2145.381213282172--6.4
4077−6
GFZ16.245.471113183−167--6.4
13171176
INGV16.245.3914.92238619--6.4
223823
IPGP16.29845.4121313387172--6.4
409020
OCA16.245.47813070180--6.5
13968−164
BMKG16.2145.48104376−23--6.3
16.25545.4220.5134821798.25.36.4
Uniform−0.3−0.2−0.2−0.4−1.8-−0.3−0.1
+0.3+0.2+0.4+0.6+1.2 +0.3+0.4
Distributed16.25545.42201348217930206.4
Disclaimer/Publisher’s Note: The statements, opinions and data contained in all publications are solely those of the individual author(s) and contributor(s) and not of MDPI and/or the editor(s). MDPI and/or the editor(s) disclaim responsibility for any injury to people or property resulting from any ideas, methods, instructions or products referred to in the content.

