Article

Uncertainty Quantification of Satellite Soil Moisture Retrieved Precipitation in the Central Tibetan Plateau

1
Chongqing Jinfo Mountain Karst Ecosystem National Observation and Research Station, School of Geographical Sciences, Southwest University, Chongqing 400715, China
2
Chongqing Engineering Research Center for Remote Sensing Big Data Application, School of Geographical Sciences, Southwest University, Chongqing 400715, China
3
Department of Earth System Science, Ministry of Education Key Laboratory for Earth System Modeling, Institute for Global Change Studies, Tsinghua University, Beijing 100084, China
4
Anhui Province Key Laboratory of Earth Surface Processes and Regional Response in the Yangtze-Huaihe River Basin, School of Geography and Tourism, Anhui Normal University, Wuhu 241002, China
*
Author to whom correspondence should be addressed.
Remote Sens. 2023, 15(10), 2600; https://doi.org/10.3390/rs15102600
Submission received: 20 April 2023 / Revised: 15 May 2023 / Accepted: 15 May 2023 / Published: 16 May 2023

Abstract

:
SM2RAIN is a well-established methodology for estimating precipitation from satellite or observed soil moisture and it has been applied as a complementary approach to conventional precipitation monitoring methods. However, satellite soil moisture retrievals are usually subject to various biases and limited number of retrievals (and therefore large intervals) in remote areas, such as the Tibetan Plateau (TP), and little is known about their potential impacts on precipitation estimation. This study seeks to quantify the uncertainties in Soil Moisture Active and Passive (SMAP) soil moisture estimated precipitation through the commonly used SM2RAIN by referring to in situ soil moisture observations from the central Tibetan Plateau soil moisture network. The estimated precipitation is evaluated against rain gauge observations. Additional attention is paid to different orbits of the SMAP retrievals. Results show that the original SM2RAIN algorithm tends to underestimate the precipitation amount in the central TP when using SMAP soil moisture retrievals as input. The retrieval accuracy and sampling interval of SMAP soil moisture from ascending (descending) orbits each count for 1.04 mm/5 d (−0.18 mm/5 d) and 1.67 mm/5 d (0.72 mm/5 d) of estimated precipitation uncertainties as represented by root mean square error. Besides, the descending product of SMAP with a relatively less sampling interval and higher retrieval accuracy outperforms the ascending one in estimating precipitation, and the combination of both two orbits does add value to the overall SM2RAIN estimation. This study is expected to provide guidance for future applications of SM2RAIN-derived precipitation. Meanwhile, more reliable SM2RAIN precipitation estimations are desired when using higher quality satellite soil moisture products with better retrieval accuracy and smaller intervals.

Graphical Abstract

1. Introduction

Precipitation is one of the pivotal driving factors of surface hydrological processes and serves as an essential parameter in land–atmospheric interactions. Given its fundamental importance, accurate estimation of precipitation is crucial across various fields, including climate change, weather forecasting, hydrologic applications, and societal activities [1,2,3,4]. Generally, precipitation is obtained through ground monitoring networks (e.g., rain gauges and radars), meteorological and numerical weather prediction models [5,6], and more recently, by satellite observations [7].
Ground-based observations are believed to be more accurate, yet are prone to limited spatial representativeness (e.g., for rain gauges) and reflectivity issues (e.g., for meteorological radars) [8]. Alternatively, precipitation in areas without reliable ground observations can be obtained by model simulation. However, these estimates are also prone to large uncertainties due to model imperfections, particularly in areas with scarce ground observations [9]. Satellite remote sensing has been widely employed to monitor precipitation over the last decades. It can produce gridded precipitation with different spatial resolutions and coverages, thus filling gaps regarding the spatial representativeness. The problem is that it indirectly estimates instantaneous precipitation through atmospheric signals [10] and thus may fail to reproduce the real surface precipitation, for instance, the “top-down” approach [11].
The soil moisture has a strong physical connection with precipitation, whereby the soil moisture exhibits a sudden increase after precipitation occurs, and gradually decreases with processes, such as evapotranspiration and drainage. Based on this, a “bottom-up” approach (i.e., the SM2RAIN algorithm) has been proposed by Brocca et al. [11] recently. The basic assumption of this algorithm is to treat the soil as a naturally formed rain gauge to measure precipitation. It estimates accumulated rather than instantaneous precipitation using consecutive in situ or satellite soil moisture as input by inverting the soil water balance equation. Over the past decades, the SM2RAIN algorithm has been successfully applied at regional and global scales to produce precipitation datasets [11,12,13,14,15,16,17,18], offering good results, and those datasets have been employed in hydrological and water resources applications [4,19,20,21,22,23]. Besides, it has been utilized as an indirect method to evaluate satellite-based soil moisture products [24]. Moreover, as an independent precipitation data source, SM2RAIN-derived precipitation can act as complementary to conventional precipitation estimate methods and offer a unique opportunity for applying the Triple Collocation [25] analysis worldwide, especially in poorly gauged areas. Additionally, its integration with the “top-down” approach has been successfully examined (e.g., [12,26,27]). However, the accuracy of the bottom-up approach is strongly influenced by the quality of the input satellite soil moisture products as demonstrated by Brocca et al. [15]. Further, as to our knowledge, few studies have systematically investigated the error sources of the SM2RAIN algorithm when using satellite soil moisture as input.
The Tibetan Plateau (TP) plays an important role in regional and global climate. However, due to the harsh environment, ground observations have been extremely sparse over this region, especially over the western TP [28,29]. Currently available precipitation products over TP are also subject to large uncertainties, such as significant systematic and random errors in satellite retrievals [30] and obvious wet bias in modeled precipitation [31]. Several studies have been conducted to assess the quality of SM2RAIN-derived precipitation in the TP. For example, Fan et al. [32] suggested slightly larger bias and less detectability of SM2RAIN-ASCAT as compared to Integrated Multi-satellitE Retrievals for Global Precipitation Measurement (IMERG) in this specific region. This is probably due to the large uncertainty in the input satellite soil moisture product [33] and the fact that it is commonly influenced by radio frequency interference, which leads to a large sampling interval and therefore less effective retrievals [34].
This study intends to attribute the uncertainty in SM2RAIN estimated precipitation with regard to the aforementioned issues with the satellite soil moisture product, namely, the retrieval accuracy and sampling interval, and to quantify their impacts by using in situ soil moisture observations. The well testified SM2RAIN algorithm that was established by Brocca et al. [11] is adopted as the baseline algorithm. Meanwhile, the Naqu area in the central TP with extensive in situ soil moisture observations from the Central Tibetan Plateau Soil Moisture and Temperature Monitoring Network (CTP-SMTMN [35]) is selected as the study area. Soil moisture retrievals from the Soil Moisture Active Passive (SMAP) soil moisture product is adopted as the input to estimate precipitation. The SMAP satellite was launched by the National Aeronautics and Space Administration (NASA) on 31 January 2015, and is featured with relatively more reliable retrievals and less noise from radio frequency interference (RFI) [36,37,38,39]. In general, the descending soil moisture retrievals (6:00 A.M. at local solar time) are commonly adopted by researchers due to their relatively higher quality than the ascending (6:00 P.M. at local solar time) data because of more favorable thermal equilibrium conditions between vegetation and near surface soil [40,41]. Based on the above, the impact of retrieval accuracy and sampling interval on SM2RAIN estimates is derived by using two different soil moisture datasets (i.e., SMAP and in situ soil moisture observations) with the same sampling intervals as input, and the same soil moisture datasets (i.e., in situ soil moisture observations) with different sampling intervals as input, respectively. To address different impacts from these two orbits, both the ascending and descending orbits are evaluated. It should be noted that the major focus of this study is to propose a way of quantifying uncertainties with regard to satellite soil moisture input during the SM2RAIN implementation. The improvement of the current SM2RAIN algorithm and the production of the regional or global precipitation product is beyond the scope of the current study and will be addressed in future studies.
The paper is organized as follows: Section 2 describes the study area, datasets, and methods, Section 3 the research results, followed by conclusions and discussions in Section 4.

2. Data and Methods

2.1. Study Area

The study area is located in the central Tibetan Plateau around the city of Naqu, where the CTP-SMTMN (91.5°E–92.5°E, 31°N–32°N) is situated (Figure 1). This region falls into the cold semi-arid climate zone and is characterized by a relatively flat terrain with rolling hills. The ecosystem is dominated by alpine grasslands and alpine meadows, which exerts less impact on the L–band passive microwave remote sensing of soil moisture (e.g., SMAP). The main soil texture classes are sands and sandy loam [42] with a high infiltration rate, making it hard for precipitation to form surface runoff. Precipitation mainly occurs during the rainy season (i.e., June–September, JJAS), accounting for about 70% of the total precipitation throughout the year. There is a typical freeze–thaw cycle here [35], and therefore, the analysis was conducted during the rainy season to avoid the impacts from freezing soil and/or snow cover.

2.2. Datasets

Two soil moisture products and one evapotranspiration product, namely, in situ soil moisture observations collected from CTP-SMTMN, satellite soil moisture retrievals from SMAP, and modeled evapotranspiration product from the version 2 of the Penman–Monteith–Leuning model (PML-V2), were spatially aggregated into 100 km averages using a simple arithmetic average and then utilized as input for SM2RAIN to derive precipitation. Rain gauge observations from a China Meteorological Administration (CMA) station were used as a reference for the calibration of SM2RAIN parameters and the evaluation of the estimated precipitation amount. Additionally, the IMERG Final run precipitation was used to investigate the representativeness of the CMA rain gauge station.

2.2.1. Soil Moisture Datasets

CTP-SMTMN is a dense monitoring network composed of 56 stations (indicated by black dots in Figure 1b) primarily located in grasslands at elevations ranging from 4470 to 4950 m. At each station, soil moisture is measured by 5TM and EC-TM capacitance probes from METER, USA (https://www.metergroup.com/, accessed on 11 October 2022), at four depths: 0–5 cm, 10 cm, 20 cm, and 40 cm, and recorded every 30 min [35]. These sensors measure volumetric water content (VWC) based on the relationship between soil dielectric constant and soil liquid water and have been carefully calibrated station by station to take into account the impact of high soil organic carbon (SOC) on soil moisture measurements [35]. All data have been meticulously quality controlled by checking the soil moisture series to eliminate suspected or erroneous data, resulting in more accurate results. Soil moisture ranges from 0.40 to 0.55 at a depth of 0–10 cm [43]. It is usually high due to the higher SOC at the topsoil but decreases with increasing soil depth as SOC decreases [44]. To avoid damage to the wireless transmitter by livestock, the data are downloaded and the network status is checked manually after the deep soil thaw (i.e., early June) and before the soil starts to freeze (i.e., late September) each year. The soil moisture dataset is available from the Central Tibetan Plateau Data Center (TPDC, https://www.tpdc.ac.cn/en/, accessed on 11 October 2022), and has been successfully applied in various studies, including soil moisture freeze–thaw monitoring [45,46], soil moisture scaling [47,48], and evaluation of soil moisture products [49]. In this study, surface (0–5 cm) soil moisture measurements that are mostly comparable to the SMAP retrievals during 2015–2018 were used. Figure 2 illustrates the temporal evolution of surface soil moisture time series across all 56 stations in the order of completeness in recorded time series, and for each time point, the areal mean is obtained through averaging over all the available soil moisture measurements. However, it is noticed that some stations have missing data at certain time periods. To examine the impact of data missing on the areal mean soil moisture, we compared the time series of average daily in situ soil moisture from stations with good time series completeness (stations numbered 1–35, i.e., those above the red horizontal line in Figure 2) to those of all stations during JJAS 2015–2018. As shown in Figure 3, the two time series show a high level of consistency, indicating the missing data at some stations should have negligible impact on the areal mean soil moisture estimation.
The SMAP satellite operates in a sun-synchronous orbit at local solar time of 6:00 A.M. (descending) and 6:00 P.M. (ascending). It makes use of the L–band microwave to detect changes in soil moisture within the topsoil layer of 0–5 cm, which is relatively thicker than previous sensors do, and thereby can provide more information on precipitation. In this study, the recently released SMAP Level 3 radiometer global daily soil moisture (SPL3SMP) version 8 [50] with spatial resolutions of 36 km × 36 km was adopted and fed to SM2RAIN to estimate precipitation for this region. This retrieval employed the Dual Channel Algorithm (DCA) as the baseline algorithm to retrieve soil moisture, rather than the Single Channel Algorithm-Vertical Polarization (SCA-V) used in its predecessor (i.e., SPL3SMP version 7). Some studies have demonstrated that the DCA product performed relatively improved or comparable to SCA-V product [51,52,53,54], and it is available at the National Snow and Ice Data Center (NSDIC; https://nsidc.org/data, accessed on 10 September 2022). It is noteworthy that at least six SMAP grids with valid data were used to calculate the areal mean soil moisture to ensure its representativeness (nine SMAP grids totally in the study area).

2.2.2. Precipitation Products

The ground rain gauge observations were obtained from the CMA automatic weather station in Naqu (white triangle in Figure 1b). The data are available from 2006 to present at hourly temporal steps with a data availability of greater than 90%. Meanwhile, it has undergone rigorous quality control as described by Zhang et al. [55]. In this study, the CMA precipitation observations were served as a benchmark for evaluating the SM2RAIN estimates.
The level 3 IMERG product was used mainly to investigate the representativeness of the CMA rain gauge station. This product integrates infrared, passive microwave, and radar observations from the Global Precipitation Measurement (GPM) satellite constellation and provides Early, Late, and Final releases with different latencies. The data are accessible from the Goddard Earth Sciences Data and Information Services Center (GES DISC; https://disc.gsfc.nasa.gov/, accessed on 26 December 2022). Studies have suggested that the Final product, which is corrected using monthly gauge data, outperforms the Early and Late products by capturing precipitation events more effectively and accurately, reflecting the spatiotemporal pattern of precipitation, as well as daily variability [56,57,58,59,60]. In this study, the 0.1° × 0.1°, half-hourly IMERG Final V06 product was used.

2.2.3. Evapotranspiration Dataset

The China PML-V2 terrestrial evapotranspiration, i.e., PML-V2 (China) [61], was fed to SM2RAIN to estimate precipitation. This product has a spatial resolution of 500 m and a temporal resolution of 1 day. Previous study has demonstrated the ability of PML-V2 (China) to accurately represent local evapotranspiration [61]. It is available from the Central Tibetan Plateau Data Center (TPDC, https://www.tpdc.ac.cn/en/, accessed on 11 October 2022) and provides four ET components, including vegetation transpiration, soil evaporation, vaporization of intercepted rainfall, and evaporation from water bodies, ice, and snow. The sum of these four components was used as input to the SM2RAIN algorithm.
Note that as SMAP data are available since 2015 and CMA precipitation is available till 2018, the time window of 2015–2018 is used for the subsequent analysis.

2.3. Methods

2.3.1. The SM2RAIN Algorithm

The SM2RAIN algorithm is based on the soil water balance equation (Equation (1)) to derive accumulated precipitation:
p t = Z * d S t d t + r t + e t + g t ,
where Z* (mm) is the saturated soil water capacity (soil depth times soil porosity), S(t) (–) is the surface relative soil saturation (0–5 cm), t (d) denotes time, p(t) (mm/d), r(t) (mm/d), e(t) (mm/d), and g(t) (mm/d) are precipitation, surface runoff, actual evapotranspiration, and drainage (deep percolation plus subsurface runoff) rate, respectively.
In this study, a simplified version of the SM2RAIN algorithm is adopted by neglecting the contributions of runoff (i.e., r(t) = 0) over large areas (>20 km) following Brocca et al. [15]. The evapotranspiration rate (e(t)) and drainage rate (g(t)) in Equation (1) are calculated following Brocca et al. [15] and Koster et al. [14]:
e t = K c E T P M L t ,
g t = a S t 1 b + a S t b 2 ,
where ETPML(t) (mm/d) is the actual evapotranspiration rate obtained from the PML-V2 (China), Kc (–) is a correction factor for taking into account potential bias in the PML-V2 (China) estimates, a (mm/d) is the saturated hydraulic conductivity, and b (–) is the exponent related to the pore size distribution index [62]. Finally, by combining Equations (1)–(3), the precipitation amount can be estimated as:
p t = Z * d S t d t + K c E T P M L t + a S t 1 b + a S t b 2 ,
where Z*, Kc, a, and b are parameters that need to be calibrated.
Additionally, prior to the SM2RAIN implementation, a nonlinear exponential filter proposed by Brocca et al. [63] was applied to remove noise from the input soil moisture. This introduced two additional parameters, namely, Tbase and Tpot. They represent the minimum value of T (the characteristic time length) corresponding to saturated soil conditions and the parameter allowing to increase T by decreasing the Soil Water Index [63], respectively. The upper and lower boundaries of these parameters were set as listed in Table 1, mostly following Brocca et al. [15] and the associated SM2RAIN source code (available at http://hydrology.irpi.cnr.it/download-area/, accessed on 18 June 2022). Filippucci et al. [16] also illustrated the general range of each parameter over the globe. However, parameter a was determined based on the saturated conductivity measured by Chen et al. [43]. These six parameters (Z*, Kc, a, b, Tbase, and Tpot) were calibrated by minimizing the root mean square error between estimated and observed precipitation (i.e., rain gauge observations from the CMA station) and then fed back to SM2RAIN to estimate precipitation over the entire study period.
The IMERG precipitation with high spatiotemporal resolution (half hourly and 0.1°) was used to investigate the spatial representativeness of the CMA rain gauge station. Specifically, cumulative precipitation curves of the IMERG grid where the CMA station is located and the regional average IMERG precipitation across the 1° network were compared during the rainy season (JJAS) of 2015–2017. The results (as shown in Figure 4) demonstrate close accumulated precipitation and high correlation (0.80, 0.73, and 0.71 for 2015, 2016, 2017, respectively) between them, thereby indicating the feasibility of using centroid CMA rain gauge measurements to represent precipitation over the entire 1° grid.
Figure 5a displays the number of effective retrievals for SMAP ascending and descending soil moisture products during the JJAS 2015–2018. Obviously, SMAP had fewer retrievals in 2015 and 2016, both for ascending and descending data. Thus, SMAP retrievals from 2017 to 2018 were selected for parameter optimization, and 2015–2018 for precipitation estimation. The in situ soil moisture observations, SMAP retrievals, and PML-V2 evapotranspiration were spatially aggregated into 100 km averages using a simple arithmetic method to facilitate uncertainty quantification.

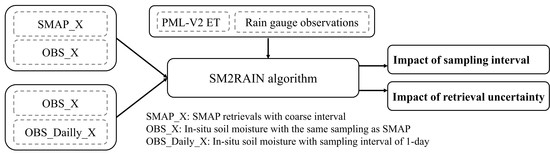
2.3.2. Experimental Design

In this study, three sets of soil moisture data, namely, SMAP_X, OBS_X, OBS_Daily_X were used as inputs for SM2RAIN to estimate precipitation. Here, X stands for a certain sampling time, with X = A, X = D, and X = AD, each corresponding to satellite overpass time of ascending orbit, descending orbit, and both orbits. As such, SMAP_X, OBS_X, and OBS_Daily_X each corresponds to the original SMAP soil moisture retrieval with coarse intervals, the CTP-SMTMN surface soil moisture with the same sampling interval as SMAP, and the CTP-SMTMN surface soil moisture with a finer sampling interval of 1 day. Upon these datasets, two sets of experiments were implemented to investigate the uncertainties in SM2RAIN estimated precipitation. First, the impact of SMAP retrieval accuracy was quantified by comparing precipitation estimates from SMAP_X and OBS_X. Second, the impact of the SMAP original retrieval interval was quantified by comparing precipitation estimates from OBS_X and OBS_Daily_X, and this is so designed to eliminate the impact from retrieval accuracy. Note that the impact of varying retrieval intervals is also worthy studying, yet it is beyond the scope of the current study and will be addressed in future studies. Finally, the difference between satellite orbits and the added value of combining two orbits in estimating precipitation were obtained by comparing x_A, x_D, and x_AD (x = SMAP, OBS, OBS_Daily).

2.3.3. Evaluation Metrics

The SMAP retrievals are often subject to large sampling intervals (e.g., 2–3 days or longer) in the central TP. Therefore, the evaluation of SM2RAIN estimated precipitation was conducted on a coarser time interval basis (5 days in this study). In detail, accumulated precipitation between two adjacent retrievals (interval of N days) was first calculated using Equation (4) and then evenly assigned to each day to form a daily estimation, which was subsequently reaggregated into a 5-day accumulation. It is noteworthy that (1) SM2RAIN estimates were not conducted when the time interval between two soil moisture records exceeded four days; (2) The daily PML-V2 evapotranspiration data were first interpolated to hourly data (by averaging daily data through simple arithmetic averaging), and then aggregated to obtain the corresponding evapotranspiration between two adjacent soil moisture records at different orbits. Finally, the SM2RAIN estimated 5-day accumulated precipitation time series was further compared with rain gauge observations to produce six metrics (Table 2), which measure the performance of the SM2RAIN algorithm with certain soil moisture input.
Specifically, the Pearson correlation coefficient (R) reflecting the degree of consistency between estimated and observed precipitation, mean bias error (BIAS, in mm/5 d) and root mean square error (RMSE, in mm/5 d) characterizing the deviation magnitude of estimated precipitation compared with the observed, were served as statistical metrics. Whereas the probability of detection (POD) indicating the fraction of precipitation events which are correctly identified by the SM2RAIN estimates, false alarm ratio (FAR) representing the fraction of precipitation events which are identified by SM2RAIN estimates but non-events observed by rain gauge, and threat score (TS) that combines POD and FAR, were served as categorical metrics. These metrics, in addition to R, BIAS, and RMSE, were used to appraise the capability of SM2RAIN-derived products in capturing rainfall events. Note that during the evaluation, a threshold value of 0.5 mm/5 d, according to the classification of precipitation in climatology, was used to determine whether there was a precipitation event [64]. Clearly, higher R, lower absolute BIASs, lower RMSE, higher POD, lower FAR, and higher TS indicate better estimation of spatiotemporal variation of precipitation and better detectability of rainfall events.
Furthermore, the magnitude of RMSE was considered (i.e., RMSE obtained with regard to default soil moisture input minus the RMSE obtained with regard to improved soil moisture input) in order to measure the improvement in precipitation estimates upon the use of better satellite soil moisture quality (e.g., data with reduced retrieval uncertainty, smaller sampling interval, and both).

3. Results

3.1. The Impact of Soil Moisture Retrieval Uncertainty

The impact of satellite soil moisture retrieval uncertainty was detected by comparing estimates obtained using soil moisture from different sources but with the same sampling interval (i.e., SMAP_X vs. OBS_X) as input to SM2RAIN. Figure 6, Figure 7, Figure 8 and Figure 9 illustrate the estimated precipitation from SMAP_X and OBS_X compared to the rain gauge observations and the corresponding evaluation metrics. Notably, the substantial amount of missing SMAP ascending retrievals resulted in a significant reduction in precipitation estimates during the period from 2015 to 2016, as depicted in Figure 6.
Taking ascending orbit as an example, SM2RAIN-derived precipitation based on SMAP_A captures almost all precipitation events, except for days with missing soil moisture retrievals (i.e., days colored with gray background in Figure 6(a1)). However, obvious underestimation is observed on some days, especially on the days with intense precipitation (i.e., days around July 2018, and August 2018 in Figure 6(a1)). This may attribute to the fact that when precipitation intensity is high, the soil becomes saturated and difficult to record more information about precipitation. In terms of accumulated precipitation, the SM2RAIN estimates is 801 mm, which is lower than that of the rain gauge observed (i.e., 812 mm). For the quantiles, it tends to exhibit slightly larger values in the lower quantiles but much smaller values in the upper quantiles than the rain gauge observations, indicating that SM2RAIN-derived precipitation based on SMAP_A tends to slightly overestimate low intensity precipitation but largely underestimate extreme high intensity precipitation. In terms of evaluation metrics, it yields statistical metrics of R, RMSE, and BIAS to be 0.66, 10.77 mm/5 d, and −0.26 mm/5 d, respectively, while categorical metrics of POD, FAR, and TS to be 0.45, 0.02, and 0.44, respectively (Figure 7a). Nevertheless, as would be expected, the SM2RAIN estimate is improved with OBS_A, as evidenced by alleviated underestimation in accumulated precipitation amount (Figure 6) and more favorable evaluation metrics (i.e., R, RMSE, and BIAS in Figure 7a).
For the descending orbit, SM2RAIN-derived precipitation based on SMAP_D also performs well in capturing precipitation events, but still significantly underestimates intensive precipitation (see days around June–August 2016, June–July 2017, and Aug 2018 in Figure 8a1). In addition, there is an obvious overestimation for light rainfall events with an intensity of less than 5 mm/5 d (see days around Jun 2015, Aug 2015, Jun 2016, and Sep 2018 in Figure 8a1). With regard to the accumulated precipitation amount, it yields a value of 1215 mm, which is lower than the observed value of 1238 mm. In terms of evaluation metrics, SMAP_D yields statistical metrics of R, RMSE, and BIAS to be 0.72, 8.35 mm/5 d, and −0.33 mm/5 d, respectively, and categorical metrics of POD, FAR, and TS to be 0.73, 0.04, and 0.71, respectively (Figure 7b). The overall underestimation of SMAP_D improves when OBS_D is used as an input, but it is slightly less consistent with the rain gauge observations, as shown in scatterplots in Figure 8. Additionally, all metrics are almost comparable to those of SMAP_D.
For the combined orbit, more precipitation events are detected by SMAP_AD due to more retrievals resulting from less sampling intervals. As shown in Figure 9, SM2RAIN-derived precipitation based on SMAP_AD largely underestimates those that are intensive precipitation (see days around July 2016 and August 2018 in Figure 9(a1)) and overestimates those that are light precipitation (see days around June 2015, June 2016, and September 2017 in Figure 9a1). The estimated accumulated precipitation amount (1314 mm) is lower than that observed by rain gauge (1382 mm). The statistical metrics R, RMSE, and BIAS are 0.78, 8.66 mm/5 d, and −0.91 mm/5 d, respectively, while the categorical metrics POD, FAR, and TS are 0.78, 0.07, and 0.73, respectively (Figure 7c). When OBS_AD is used as input, a slightly degraded performance is observed as evidenced by somewhat large inconsistency with rain gauge observations (Figure 9(b2)) and slightly degraded metrics expect for BIAS (Figure 7c).
From an overall point of view, the SM2RAIN performance significantly improved by reduced uncertainty of ascending soil moisture input, with RMSE reduced by about 1.0 mm/5 d. However, it is not noticeable for the descending and combined orbits, with RMSE increased by about 0.2 mm/5 d and 0.3 mm/5 d, respectively (Figure 10).

3.2. The Impact of Soil Moisture Sampling Interval

The impact of satellite soil moisture original sampling interval was detected by comparing SM2RAIN estimates using soil moisture inputs from the same source but with different sampling intervals (i.e., OBS_X vs. OBS_Daily_X). Figure 11, Figure 12 and Figure 13 illustrate the estimated precipitation from OBS_X and OBS_Daily_X compared to the rain gauge observations.
Taking ascending orbit as an example, SM2RAIN-derived precipitation based on OBS_A demonstrates relatively good agreement with the rain gauge observations. However, it tends to largely underestimate those intensive precipitation (see days around July 2018 and August 2018 in Figure 11(a1)), resulting in an estimated accumulated precipitation amount of 805 mm, which is lower than that of rain gauge observations of 812 mm (Figure 11(a2)). The statistical metrics R, RMSE, and BIAS are 0.73, 9.73 mm/5 d, and −0.16 mm/5 d, respectively, while categorical metrics POD, FAR, and TS are 0.45, 0.02, and 0.44, respectively (Figure 7a). However, by substituting OBS_A with OBS_Daily_A, both the underestimation of intensive precipitation and evaluation metrics are further improved. This is evidenced by (1) better consistency with the rain gauge observations as supported by a better distribution along the 1:1 line and a higher R value of 0.83 (0.73 for OBS_A, Figure 11); (2) superior metrics with RMSE, BIAS, POD, FAR, and TS values of 8.06 mm/5 d, −0.92 mm/5 d, 1.00, 0.02 and 0.98, respectively (Figure 7a).
For the descending orbit, SM2RAIN-derived precipitation based on OBS_D tends to underestimate those precipitation events with intensity larger than 30 mm/5 d (see days around June–August 2016, Jun 2018 and Aug 2018 in Figure 12(a1)). The accumulated precipitation amount obtained from OBS_D is 1222 mm, which is lower than the rain gauge observations of 1238 mm. The evaluation metrics, R, RMSE, BIAS, POD, FAR, and TS are 0.71, 8.53 mm/5 d, −0.23 mm/5 d, 0.73, 0.44 and 0.71, respectively. When OBS_Daily_D is used as input, better performance is obtained as evidenced by higher consistency with the rain gauge observations (Figure 12(b2)) as well as superior metrics except for BIAS (0.78, 7.81 mm/5 d, 1, 0.96 for R, RMSE, POD and TS, respectively) (Figure 7b).
For the combined orbit, despite the improved sampling interval of OBS_AD, underestimation of intensive precipitation (see days around Jun–Aug 2016, Jul 2018, and Aug 2018 in Figure 13(a1)) and overestimation of light precipitation (see days around Aug 2015) are still observed. The accumulated precipitation amount is 1330 mm, which is lower than that of rain gauge observations 1382 mm (Figure 13(a2)). The metrics R, RMSE, BIAS, POD, FAR, and TS are 0.76, 8.92 mm/5 d, −0.69 mm/5 d, 0.78, 0.07, and 0.73, respectively. Nevertheless, OBS_Daily_AD improves the performance of SM2RAIN as indicated by higher consistency with the rain gauge observations (Figure 13(b2)) and marginally improved metrics except for BIAS (0.80, 8.44 mm/5 d, 1, 0.93 for R, RMSE, POD and TS, respectively) (Figure 7c).
In general, the improvements of the SM2RAIN algorithm introduced by reducing the sampling interval of soil moisture input in terms of RMSE are approximately 1.67 mm/5 d, 0.72 mm/5 d, and 0.48 mm/5 d for ascending, descending, and combined orbit, respectively (Figure 10), with 0.96 mm/5 d on average.

3.3. Comparison between Retrieval Uncertainty and Sampling Interval in Precipitation Estimation

The abovementioned evaluation for each soil moisture input indicates that SM2RAIN estimates have a relatively good agreement with rain gauge observations, although it tends to underestimate intensive precipitation and overestimate light precipitation in the central TP. Overall, SM2RAIN exhibits an underestimation in the central TP with negative bias, which is in line with earlier findings of Zhang et al. [27]. This underestimation found in SM2RAIN estimates derived from SMAP retrievals might be related to the underestimation of SMAP soil moisture [65] and the fact that precipitation is unable to drive any soil moisture variation when the soil is close to saturated. Despite this, SM2RAIN-derived precipitation from SMAP retrievals performs better than other SM2RAIN products in the TP. For instance, SMAP estimates yield smaller BIAS (−0.26 mm/5 d, −0.16 mm/5 d, and −0.92 mm/5 d for ascending, descending, and combined orbits, respectively) and larger TS (0.44, 0.44, and 0.98 for ascending, descending, and combined orbits, respectively) as compared to the ASCAT estimates (BIAS: 6 mm/5 d, TS: 0.4–0.5) [27,32]. Thus, there is great potential for SMAP to estimate precipitation through SM2RAIN algorithm.
Meanwhile, the experiment conducted in this study reveals that SM2RAIN estimates can be further improved by reducing the soil moisture retrieval uncertainty and sampling interval (as described in Section 3.1 and Section 3.2), with the latter making a greater contribution. Additionally, to quantify the overall improvement introduced by both SMAP retrieval accuracy and its sampling interval, precipitation estimates from SMAP_X and OBS_Daily_X were compared as well. As shown in Figure 10, the overall uncertainties introduced by both impacts are larger than those of separate impacts in terms of RMSE for ascending (2.71 mm/5 d) orbit, but opposite for descending and combined orbits (0.54 mm/5 d and 0.22 mm/5 d, respectively) (Figure 10). In general, both the impact of soil moisture retrieval uncertainty and sampling interval is more obvious for ascending data than for descending data. This may be ascribed to the fact that SMAP_D is capable of producing reasonable estimates with a smaller sampling interval, thus leaving small room for further improvement with OBS_D. The smallest improvement is observed for combined orbits. Similar to OBS_D over SMAP_D, this may be due to the fact that the joint use of ascending and descending orbits of SMAP retrievals enables more frequent soil moisture observations and thus a finer sampling interval, which allows for the capture of finer precipitation information across the day. As such, it provides a more reliable estimation of precipitation amount with SMAP_AD, and therefore leaves even less room for improvement with OBS_AD. To sum up, the smaller sampling interval is highly desirable to increase the accuracy of SM2RAIN estimates.

3.4. Comparison between Different Orbits

It is found that precipitation estimated from SMAP_D delivers more favorable consistency with rain gauge observations than SMAP_A with higher R (0.72), lower RMSE (8.35 mm/5 d), higher POD (0.73), and higher TS (0.71). As demonstrated in the above section, given the relatively good performance of SM2RAIN based on SMAP_D, OBS_D delivers negligible improvement in precipitation estimation.
To compare the differences in precipitation estimates between various SMAP orbits, Figure 7a was reorganized as Figure 14. Obviously, among all three SM2RAIN estimates with SMAP, SMAP_D and SMAP_AD produce more accurate estimation of precipitation, followed by SMAP_A, as seen from most of the evaluation metrics except for BIAS and FAR. Specifically, SMAP_D outperforms SMAP_AD in terms of RMSE, BIAS, and FAR, while SMAP_AD outperforms SMAP_D in terms of R, POD, and TS. This indicates that better agreement with rain gauge observations can be achieved by considering both ascending and descending orbits. Furthermore, SMAP_D outperforms SMAP_A, probably due to two reasons: (1) relatively more accurate soil moisture retrievals in the morning owing to increased thermal equilibrium conditions among the near-surface air, vegetation canopy, and surface soil, as demonstrated by Dente et al. [66]; (2) more retrievals and smaller sampling intervals for SMAP_D than for SMAP_A, as seen from Figure 5. Hence, the SMAP retrievals from descending and combined orbits are recommended to derive SM2RAIN precipitation products for the central TP.

4. Conclusions

This study investigated the impact of retrieval uncertainty and the sampling interval of input microwave soil moisture (i.e., SMAP) on SM2RAIN precipitation estimates by referring to observed soil moisture in the central TP. Comparisons were made across different soil moisture input sources, including SMAP retrievals from the ascending and descending orbits as well as their combination, and in situ observations sampled from the same overpass time. Findings suggested that:
(1)
SM2RAIN exhibits large uncertainties when SMAP ascending retrievals are used as input (RMSE = 10.77 mm/5 d), while better performance is observed by SMAP descending retrievals (RMSE = 8.35 mm/5 d). This may attribute to less sampling interval and reduced retrieval uncertainty in the morning. Additionally, considering both orbits do add value to SM2RAIN estimates as evidenced by the comparable or improved metrics with the descending orbit.
(2)
Biased SMAP soil moisture retrieval counts for 0.20 mm/5 d of precipitation estimate uncertainty in average for all different orbits, while the discontinuity of SMAP soil moisture retrieval exhibits remarkably larger impact of about 0.96 mm/5 d in average. In total, they count for 1.16 mm/5 d of precipitation estimate uncertainty in average.
(3)
For SM2RAIN estimation with SMAP, it is suggested to use descending or both orbits to achieve better estimation of accumulated precipitation. Meanwhile, efforts are needed to reduce the retrieval uncertainty of SMAP soil moisture to further improve performance of the SM2RAIN algorithm.
Some limitations are recognized in this study. First, this study was carried out only based on a recent release of the SMAP soil moisture, and future analyses using other state-of-the-art soil moisture products with possible improved quality are desired. Second, this study assumed surface runoff to be zero, which may be valid at large scales such as the 100 km CTP-SMTMN area. However, it may be necessary to take into account the potential effects of surface runoff at smaller scales. Besides, the PML-V2 (China) evapotranspiration data are used as input for SM2RAIN, mainly due to its superiority over the global version of the PML-V2 product. While systematic comparison against other available evapotranspiration data is beyond the focus of this study, future investigations are desired to comprehensively study the error sources of the SM2RAIN algorithm.
Despite the above, SMAP satellite soil moisture retrievals hold great potential in estimating precipitation through SM2RAIN, though they still exhibit uncertainties, mainly underestimation, in regions such as the TP. Currently, the descending orbit or the joint use of both orbits of SMAP retrievals is recommended for estimating precipitation with SM2RAIN. Meanwhile, future advancements in satellite retrieved soil moisture, including improving the retrieval accuracy and shortening retrieving intervals, are expected to deliver more reliable precipitation estimation through the SM2RAIN algorithm. As such, SM2RAIN estimation could serve as complementary to conventional precipitation estimation methods, including atmospheric modeling, satellite remote sensing, and rain gauge observations, and better support wide applications in regional climate studies such as drought monitoring, weather forecasting, and crop management, etc.

Author Contributions

This paper is a collaborative work by all of the authors. Conceptualization, L.Z.; Data curation, K.Z.; Formal analysis, K.Z.; Methodology, K.Z. and L.Z.; Supervision, L.Z., K.Y., L.S., X.N., X.H. and L.F.; Writing (original draft), K.Z.; Writing (review and editing), K.Z., L.Z. and M.M. All authors have read and agreed to the published version of the manuscript.

Funding

This research was funded by National Natural Science Foundation of China (grant no. 42271491) and Natural Science Foundation of Chongqing, China (grant no. CSTB2022NSCQ-MSX1568).

Data Availability Statement

The CTP-SMTMN soil moisture observations and PML-V2 evapotranspiration product are obtained from the National Tibetan Plateau Third Pole Environment Data Center (TPDC; https://www.tpdc.ac.cn/en/, accessed on 11 October 2022); SMAP soil moisture retrievals are available through National Snow and Ice Data Center (NSIDC; https://nsidc.org/data, accessed on 10 September 2022); the rain gauge observations in Naqu is provided by the China Meteorological Administration (CMA; http://data.cma.cn/, accessed on 10 September 2022); IMERG final run precipitation is accessible from the Goddard Earth Sciences Data and Information Services Center (GES DISC; https://disc.gsfc.nasa.gov/, accessed on 26 December 2022).

Conflicts of Interest

The authors declare that they have no conflict of interest to disclose.

References

  1. Pendergrass, A.G.; Knutti, R. The uneven nature of daily precipitation and its change. Geophys. Res. Lett. 2018, 45, 980–988. [Google Scholar] [CrossRef]
  2. Ricciardelli, E.; Di Paola, F.; Gentile, S.; Cersosimo, A.; Cimini, D.; Gallucci, D.; Geraldi, E.; Larosa, S.; Nilo, S.T.; Ripepi, E.; et al. Analysis of Livorno heavy rainfall event: Examples of satellite-based observation techniques in support of numerical weather prediction. Remote Sens. 2018, 10, 1549. [Google Scholar] [CrossRef]
  3. Yuan, F.; Zhang, L.; Soe, K.M.W.; Ren, L.; Zhao, C.; Zhu, Y.; Jiang, S.; Liu, Y. Applications of TRMM-and GPM-era multiple-satellite precipitation products for flood simulations at sub-daily scales in a sparsely gauged watershed in Myanmar. Remote Sens. 2019, 11, 140. [Google Scholar] [CrossRef]
  4. Koohi, S.; Azizian, A.; Brocca, L. Spatiotemporal drought monitoring using bottom-up precipitation dataset (SM2RAIN-ASCAT) over different regions of Iran. Sci. Total Environ. 2021, 779, 146535. [Google Scholar] [CrossRef]
  5. Montani, A.; Cesari, D.; Marsigli, C.; Paccagnella, T. Seven years of activity in the field of mesoscale ensemble forecasting by the COSMO-LEPS system: Main achievements and open challenges. Tellus A 2011, 63, 605–624. [Google Scholar] [CrossRef]
  6. Zappa, M.; Rotach, M.W.; Arpagaus, M.; Dorninger, M.; Hegg, C.; Montani, A.; Ranzi, R.; Ament, F.; Germann, U.; Grossi, G.; et al. MAP D-PHASE: Real-time demonstration of hydrological ensemble prediction systems. Atmos. Sci. Lett. 2008, 9, 80–87. [Google Scholar] [CrossRef]
  7. Adler, R.F.; Gu, G.; Sapiano, M.; Wang, J.-J.; Huffman, G.J. Global precipitation: Means, variations and trends during the satellite era (1979–2014). Surv. Geophys. 2017, 38, 679–699. [Google Scholar] [CrossRef]
  8. Tapiador, F.J.; Turk, F.J.; Petersen, W.; Hou, A.Y.; García-Ortega, E.; Machado, L.A.T.; Angelis, C.F.; Salio, P.; Kidd, C.; Huffman, G.J.; et al. Global precipitation measurement: Methods, datasets and applications. Atmos. Res. 2012, 104, 70–97. [Google Scholar] [CrossRef]
  9. Michaelides, S.; Levizzani, V.; Anagnostou, E.; Bauer, P.; Kasparis, T.; Lane, J. Precipitation: Measurement, remote sensing, climatology and modeling. Atmos. Res. 2009, 94, 512–533. [Google Scholar] [CrossRef]
  10. Kidd, C.; Levizzani, V. Status of satellite precipitation retrievals. Hydrol. Earth Syst. Sci. 2011, 15, 1109–1116. [Google Scholar] [CrossRef]
  11. Brocca, L.; Moramarco, T.; Melone, F.; Wagner, W. A new method for rainfall estimation through soil moisture observations. Geophys. Res. Lett. 2013, 40, 853–858. [Google Scholar] [CrossRef]
  12. Brocca, L.; Pellarin, T.; Crow, W.T.; Ciabatta, L.; Massari, C.; Ryu, D.; Su, C.H.; Rüdiger, C.; Kerr, Y. Rainfall estimation by inverting SMOS soil moisture estimates: A comparison of different methods over Australia. J. Geophys. Res. Atmos. 2016, 121, 12062–12079. [Google Scholar] [CrossRef]
  13. Massari, C.; Maggioni, V.; Barbetta, S.; Brocca, L.; Ciabatta, L.; Camici, S.; Moramarco, T.; Coccia, G.; Todini, E. Complementing near-real time satellite rainfall products with satellite soil moisture-derived rainfall through a Bayesian inversion approach. J. Hydrol. 2019, 573, 341–351. [Google Scholar] [CrossRef]
  14. Koster, R.D.; Brocca, L.; Crow, W.T.; Burgin, M.S.; De Lannoy, G.J. Precipitation estimation using L-band and C-band soil moisture retrievals. Water Resour. Res. 2016, 52, 7213–7225. [Google Scholar] [CrossRef]
  15. Brocca, L.; Filippucci, P.; Hahn, S.; Ciabatta, L.; Massari, C.; Camici, S.; Schüller, L.; Bojkov, B.; Wagner, W. SM2RAIN–ASCAT (2007–2018): Global daily satellite rainfall data from ASCAT soil moisture observations. Earth Syst. Sci. Data. 2019, 11, 1583–1601. [Google Scholar] [CrossRef]
  16. Filippucci, P.; Brocca, L.; Massari, C.; Saltalippi, C.; Wagner, W.; Tarpanelli, A. Toward a self-calibrated and independent SM2RAIN rainfall product. J. Hydrol. 2021, 603, 126837. [Google Scholar] [CrossRef]
  17. Ciabatta, L.; Massari, C.; Brocca, L.; Gruber, A.; Reimer, C.; Hahn, S.; Paulik, C.; Dorigo, W.; Kidd, R.; Wagner, W. SM2RAIN-CCI: A new global long-term rainfall data set derived from ESA CCI soil moisture. Earth Syst. Sci. Data. 2018, 10, 267–280. [Google Scholar] [CrossRef]
  18. Massari, C.; Brocca, L.; Pellarin, T.; Abramowitz, G.; Filippucci, P.; Ciabatta, L.; Maggioni, V.; Kerr, Y.H.; Prieto, D.F. A daily 25 km short-latency rainfall product for data-scarce regions based on the integration of the Global Precipitation Measurement mission rainfall and multiple-satellite soil moisture products. Hydrol. Earth Syst. Sci. 2020, 24, 2687–2710. [Google Scholar] [CrossRef]
  19. Ramos Filho, G.M.; Coelho, V.H.R.; da Silva Freitas, E.; Xuan, Y.; Brocca, L.; Almeida, C.D.N. Regional-scale evaluation of 14 satellite-based precipitation products in characterising extreme events and delineating rainfall thresholds for flood hazards. Atmos. Res. 2022, 276, 106259. [Google Scholar] [CrossRef]
  20. Brunetti, M.T.; Melillo, M.; Peruccacci, S.; Ciabatta, L.; Brocca, L. How far are we from the use of satellite rainfall products in landslide forecasting? Remote Sens. Environ. 2018, 210, 65–75. [Google Scholar] [CrossRef]
  21. Camici, S.; Ciabatta, L.; Massari, C.; Brocca, L. How reliable are satellite precipitation estimates for driving hydrological models: A verification study over the Mediterranean area. J. Hydrol. 2018, 563, 950–961. [Google Scholar] [CrossRef]
  22. Alfieri, L.; Avanzi, F.; Delogu, F.; Gabellani, S.; Bruno, G.; Campo, L.; Libertino, A.; Massari, C.; Tarpanelli, A.; Rains, D.; et al. High-resolution satellite products improve hydrological modeling in northern Italy. Hydrol. Earth Syst. Sci. 2022, 26, 3921–3939. [Google Scholar] [CrossRef]
  23. Saeedi, M.; Sharafati, A.; Brocca, L.; Tavakol, A. Estimating rainfall depth from satellite-based soil moisture data: A new algorithm by integrating SM2RAIN and the analytical net water flux models. J. Hydrol. 2022, 610, 127868. [Google Scholar] [CrossRef]
  24. Tuttle, S.E.; Salvucci, G.D. A new approach for validating satellite estimates of soil moisture using large-scale precipitation: Comparing AMSR-E products. Remote Sens. Environ. 2014, 142, 207–222. [Google Scholar] [CrossRef]
  25. Massari, C.; Crow, W.; Brocca, L. An assessment of the performance of global rainfall estimates without ground-based observations. Hydrol. Earth Syst. Sci. 2017, 21, 4347–4361. [Google Scholar] [CrossRef]
  26. Chiaravalloti, F.; Brocca, L.; Procopio, A.; Massari, C.; Gabriele, S. Assessment of GPM and SM2RAIN-ASCAT rainfall products over complex terrain in southern Italy. Atmos. Res. 2018, 206, 64–74. [Google Scholar] [CrossRef]
  27. Tong, K.; Su, F.; Yang, D.; Zhang, L.; Hao, Z. Tibetan Plateau precipitation as depicted by gauge observations, reanalyses and satellite retrievals. Int. J. Climatol. 2014, 34, 265–285. [Google Scholar] [CrossRef]
  28. Yang, K.; Chen, Y.; Zhan, C.; Ling, X.; Zhou, X.; Jiang, Y.; Yao, X.; Lu, H.; Ma, X.; Ouyang, L.; et al. Cross-sectional rainfall observation on the central-western Tibetan Plateau in the warm season: System design and preliminary results. Sci. China Earth Sci. 2023, 66, 1015–1030. [Google Scholar] [CrossRef]
  29. Tan, X.; Ma, Z.; He, K.; Han, X.; Ji, Q.; He, Y. Evaluations on gridded precipitation products spanning more than half a century over the Tibetan Plateau and its surroundings. J. Hydrol. 2020, 582, 124455. [Google Scholar] [CrossRef]
  30. Zhu, Y.-Y.; Yang, S. Evaluation of CMIP6 for historical temperature and precipitation over the Tibetan Plateau and its comparison with CMIP5. Adv. Clim. Chang. Res. 2020, 11, 239–251. [Google Scholar] [CrossRef]
  31. Fan, Y.; Ma, Z.; Ma, Y.; Ma, W.; Xie, Z.; Ding, L.; Han, Y.; Hu, W.; Su, R. Respective advantages of “Top-Down” based GPM IMERG and “Bottom-Up” based SM2RAIN-ASCAT precipitation products over the Tibetan Plateau. J. Geophys. Res. Atmos. 2021, 126, e2020JD033946. [Google Scholar] [CrossRef]
  32. Xing, Z.; Fan, L.; Zhao, L.; De Lannoy, G.; Frappart, F.; Peng, J.; Li, X.; Zeng, J.; Al-Yaari, A.; Yang, K.; et al. A first assessment of satellite and reanalysis estimates of surface and root-zone soil moisture over the permafrost region of Qinghai-Tibet Plateau. Remote Sens. Environ. 2021, 265, 112666. [Google Scholar] [CrossRef]
  33. Chen, Y.; Yang, K.; Qin, J.; Cui, Q.; Lu, H.; La, Z.; Han, M.; Tang, W. Evaluation of SMAP, SMOS, and AMSR2 soil moisture retrievals against observations from two networks on the Tibetan Plateau. J. Geophys. Res. Atmos. 2017, 122, 5780–5792. [Google Scholar] [CrossRef]
  34. Yang, K.; Qin, J.; Zhao, L.; Chen, Y.; Tang, W.; Han, M.; Chen, Z.; Lv, N.; Ding, B.; Wu, H.; et al. A multiscale soil moisture and freeze–thaw monitoring network on the third pole. Bull. Am. Meteorol. Soc. 2013, 94, 1907–1916. [Google Scholar] [CrossRef]
  35. Entekhabi, D.; Njoku, E.G.; O’Neill, P.E.; Kellogg, K.H.; Crow, W.T.; Edelstein, W.N.; Entin, J.K.; Goodman, S.D.; Jackson, T.J.; Johnson, J.; et al. The soil moisture active passive (SMAP) mission. Proc. IEEE 2010, 98, 704–716. [Google Scholar] [CrossRef]
  36. Kerr, Y.H.; Wigneron, J.-P.; Al Bitar, A.; Mialon, A.; Srivastava, P. Soil moisture from space: Techniques and limitations. In Satellite Soil Moisture Retrieval; Elsevier: Amsterdam, The Netherlands, 2016; pp. 3–27. [Google Scholar]
  37. Wigneron, J.-P.; Jackson, T.; O’neill, P.; De Lannoy, G.; de Rosnay, P.; Walker, J.; Ferrazzoli, P.; Mironov, V.; Bircher, S.; Grant, J. Modelling the passive microwave signature from land surfaces: A review of recent results and application to the L-band SMOS & SMAP soil moisture retrieval algorithms. Remote Sens. Environ. 2017, 192, 238–262. [Google Scholar]
  38. Piepmeier, J.R.; Johnson, J.T.; Mohammed, P.N.; Bradley, D.; Ruf, C.; Aksoy, M.; Garcia, R.; Hudson, D.; Miles, L.; Wong, M. Radio-frequency interference mitigation for the soil moisture active passive microwave radiometer. IEEE Trans. Geosci. Remote Sens. 2013, 52, 761–775. [Google Scholar] [CrossRef]
  39. de Jeu, R.A.M.; Wagner, W.; Holmes, T.R.H.; Dolman, A.J.; van de Giesen, N.C.; Friesen, J. Global soil moisture patterns observed by space borne microwave radiometers and scatterometers. Surv. Geophys. 2008, 29, 399–420. [Google Scholar] [CrossRef]
  40. Lei, F.; Crow, W.T.; Shen, H.; Parinussa, R.M.; Holmes, T.R.H. The impact of local acquisition time on the accuracy of microwave surface soil moisture retrievals over the contiguous United States. Remote Sens. 2015, 7, 13448–13465. [Google Scholar] [CrossRef]
  41. Fu, Q.; Yang, K.; Zheng, D. Impact of soil organic matter content on soil moisture and temperature at different depths in the central Qinghai-Xizang Plateau. Plateau Meteor. 2021, 1, 1–11. [Google Scholar]
  42. Chen, Y.; Yang, K.; Tang, W.; Qin, J.; Zhao, L. Parameterizing soil organic carbon’s impacts on soil porosity and thermal parameters for Eastern Tibet grasslands. Sci. China Earth Sci. 2012, 55, 1001–1011. [Google Scholar] [CrossRef]
  43. Sun, J.; Chen, Y.; Yang, K.; Lu, H.; Zhao, L.; Zheng, D. Influence of organic matter on soil hydrothermal processes in the Tibetan Plateau: Observation and parameterization. J. Hydrometeorol. 2021, 22, 2659–2674. [Google Scholar] [CrossRef]
  44. Han, M.; Yang, K.; Qin, J.; Jin, R.; Ma, Y.; Wen, J.; Chen, Y.; Zhao, L.; Lazhu; Tang, W. An algorithm based on the standard deviation of passive microwave brightness temperatures for monitoring soil surface freeze/thaw state on the Tibetan Plateau. IEEE Trans. Geosci. Remote Sens. 2015, 53, 2775–2783. [Google Scholar] [CrossRef]
  45. Jiang, H.; Yi, Y.; Zhang, W.; Yang, K.; Chen, D. Sensitivity of soil freeze/thaw dynamics to environmental conditions at different spatial scales in the central Tibetan Plateau. Sci. Total Environ. 2020, 734, 139261. [Google Scholar] [CrossRef] [PubMed]
  46. Kang, J.; Jin, R.; Li, X.; Zhang, Y.; Zhu, Z. Spatial upscaling of sparse soil moisture observations based on ridge regression. Remote Sens. 2018, 10, 192. [Google Scholar] [CrossRef]
  47. Zhao, L.; Yang, K.; Qin, J.; Chen, Y.; Tang, W.; Montzka, C.; Wu, H.; Lin, C.; Han, M.; Vereecken, H. Spatiotemporal analysis of soil moisture observations within a Tibetan mesoscale area and its implication to regional soil moisture measurements. J. Hydrol. 2013, 482, 92–104. [Google Scholar] [CrossRef]
  48. Li, D.; Zhao, T.; Shi, J.; Bindlish, R.; Jackson, T.J.; Peng, B.; An, M.; Han, B. First evaluation of Aquarius soil moisture products using in situ observations and GLDAS model simulations. IEEE J. Sel. Top. Appl. Earth Obs. Remote Sens. 2015, 8, 5511–5525. [Google Scholar] [CrossRef]
  49. O’Neill, P.; Chan, S.; Njoku, E.; Jackson, T. SMAP L3 Radiometer Global Daily 36 km EASE-Grid Soil Moisture, Version 8 [Data Set]; NASA National Snow and Ice Data Center Distributed Active Archive Center: Boulder, CO, USA, 2021. [CrossRef]
  50. Colliander, A.; Reichle, R.H.; Crow, W.T.; Cosh, M.H.; Chen, F.; Chan, S.; Das, N.N.; Bindlish, R.; Chaubell, J.; Kim, S.; et al. Validation of soil moisture data products from the NASA SMAP mission. IEEE J. Sel. Top. Appl. Earth Obs. Remote Sens. 2021, 15, 364–392. [Google Scholar] [CrossRef]
  51. Gao, L.; Ebtehaj, A.; Chaubell, M.J.; Sadeghi, M.; Li, X.; Wigneron, J.-P. Reappraisal of SMAP inversion algorithms for soil moisture and vegetation optical depth. Remote Sens. Environ. 2021, 264, 112627. [Google Scholar] [CrossRef]
  52. Zheng, J.; Zhao, T.; Lü, H.; Shi, J.; Cosh, M.H.; Ji, D.; Jiang, L.; Cui, Q.; Lu, H.; Yang, K.; et al. Assessment of 24 soil moisture datasets using a new in situ network in the Shandian River Basin of China. Remote Sens. Environ. 2022, 271, 112891. [Google Scholar] [CrossRef]
  53. Li, X.; Wigneron, J.-P.; Fan, L.; Frappart, F.; Yueh, S.H.; Colliander, A.; Ebtehaj, A.; Gao, L.; Fernandez-Moran, R.; Liu, X.; et al. A new SMAP soil moisture and vegetation optical depth product (SMAP-IB): Algorithm, assessment and inter-comparison. Remote Sens. Environ. 2022, 271, 112921. [Google Scholar] [CrossRef]
  54. Zhang, Q.; Zhao, Y.-F.; Fan, S.-H. Development of hourly precipitation datasets for national meteorological stations in China. Torrential Rain Disasters 2016, 35, 182–186. [Google Scholar]
  55. Huffman, G.J.; Bolvin, D.T.; Braithwaite, D. NASA Global Precipitation Measurement (GPM) Integrated Multi-Satellite Retrievals for GPM (IMERG); Algorithm Theoretical Basis Document (ATBD) Version 06; National Aeronautics and Space Administration (NASA): Washington, DC, USA, 2019.
  56. Li, D.; Qi, Y.; Chen, D. Changes in rain and snow over the Tibetan Plateau based on IMERG and Ground-based observation. J. Hydrol. 2022, 606, 127400. [Google Scholar] [CrossRef]
  57. Liu, Z. Comparison of integrated multisatellite retrievals for GPM (IMERG) and TRMM multisatellite precipitation analysis (TMPA) monthly precipitation products: Initial results. J. Hydrometeorol. 2016, 17, 777–790. [Google Scholar] [CrossRef]
  58. Zhang, S.; Wang, D.; Qin, Z.; Zheng, Y.; Guo, J. Assessment of the GPM and TRMM precipitation products using the rain gauge network over the Tibetan Plateau. J. Meteorol. Res. 2018, 32, 324–336. [Google Scholar] [CrossRef]
  59. Ma, Q.; Li, Y.; Feng, H.; Yu, Q.; Zou, Y.; Liu, F.; Pulatov, B. Performance evaluation and correction of precipitation data using the 20-year IMERG and TMPA precipitation products in diverse subregions of China. Atmos. Res. 2021, 249, 105304. [Google Scholar] [CrossRef]
  60. He, S.; Zhang, Y.; Ma, N.; Tian, J.; Kong, D.; Liu, C. A daily and 500 m coupled evapotranspiration and gross primary production product across China during 2000–2020. Earth Syst. Sci. Data 2022, 14, 5463–5488. [Google Scholar] [CrossRef]
  61. Famiglietti, J.; Wood, E.F. Multiscale modeling of spatially variable water and energy balance processes. Water Resour. Res. 1994, 30, 3061–3078. [Google Scholar] [CrossRef]
  62. Brocca, L.; Melone, F.; Moramarco, T.; Wagner, W.; Albergel, C.; Petropoulos, G. Scaling and filtering approaches for the use of satellite soil moisture observations. In Remote Sensing of Energy Fluxes and Soil Moisture Content; Routledge: Abingron-on-Thames, UK, 2013; Volume 1, pp. 411–426. [Google Scholar]
  63. Wang, Z.; Zhong, R.; Lai, C. Evaluation and hydrologic validation of TMPA satellite precipitation product downstream of the Pearl River Basin, China. Hydrol. Process. 2017, 31, 4169–4182. [Google Scholar] [CrossRef]
  64. Zhang, L.; Li, X.; Cao, Y.; Nan, Z.; Wang, W.; Ge, Y.; Wang, P.; Yu, W. Evaluation and integration of the top-down and bottom-up satellite precipitation products over mainland China. J. Hydrol. 2020, 581, 124456. [Google Scholar] [CrossRef]
  65. Wei, Z.; Meng, Y.; Zhang, W.; Peng, J.; Meng, L. Downscaling SMAP soil moisture estimation with gradient boosting decision tree regression over the Tibetan Plateau. Remote Sens. Environ. 2019, 225, 30–44. [Google Scholar] [CrossRef]
  66. Dente, L.; Ferrazzoli, P.; Su, Z.; van der Velde, R.; Guerriero, L. Combined use of active and passive microwave satellite data 512 to constrain a discrete scattering model. Remote Sens. Environ. 2014, 155, 222–238. [Google Scholar] [CrossRef]
Figure 1. (a) The Tibetan Plateau collocated with the Central Tibetan Plateau Soil Moisture Monitoring Network (CTP-SMTMN). (b) Spatial distribution of the soil moisture stations within the CTP-SMTMN (black dots) as well as the China Meteorological Administration (CMA) rain gauge station (white triangle).
Remotesensing 15 02600 g001
Figure 2. Time series of half-hourly surface soil moisture (0–5 cm) observed across the 56 stations of CTP-SMTMN from June–September (JJAS) 2015–2018. Note that blanks denote missing data. Stations above the red horizontal line are those with good time series completeness.
Remotesensing 15 02600 g002
Figure 3. (a) Comparison of the time series of average daily in situ soil moisture over stations with good time series completeness (stations numbered 1–35, i.e., those above the red horizontal line in Figure 2) (AVE1) and all stations (AVE2) during JJAS 2015–2018, and (b) its corresponding scatterplot.
Remotesensing 15 02600 g003
Figure 4. The accumulated precipitation curve of IMERG grid where CMA station is located (Pre_IMERG_NQ) and the regional average IMERG precipitation (Pre_IMERG_RM) during (a) JJAS 2015, (b) JJAS 2016, and (c) JJAS 2017.
Remotesensing 15 02600 g004
Figure 5. (a) Barplot of number of effective retrievals and (b) boxplot of sampling intervals for SMAP ascending (SMAP_A) and descending (SMAP_D) soil moisture products during the JJAS 2015–2018.
Remotesensing 15 02600 g005
Figure 6. Lineplots and scatterplots of 5-day accumulated precipitation estimated by SM2RAIN (Pest) versus the corresponding rain gauge observations (Pobs) during JJAS 2015–2018. (a1,a2) are the results with SMAP_A as input. (b1,b2) are the results with OBS_A as input. Grey background in the lineplots indicates failed precipitation estimates due to missing satellite soil moisture retrievals. The sPest and sPobs in the scatterplots indicate the total estimated and observed precipitation, respectively. N indicates the number of successful SM2RAIN estimation.
Remotesensing 15 02600 g006
Figure 7. Evaluation metrics of SM2RAIN with regard to input of (a) ascending, (b) descending, and (c) combined soil moisture datasets, respectively, during JJAS 2015–2018.
Remotesensing 15 02600 g007
Figure 8. Similar to Figure 6, but for SMAP_D (a1,a2) and OBS_D (b1,b2), respectively.
Remotesensing 15 02600 g008
Figure 9. Similar to Figure 6, but for SMAP_AD (a1,a2) and OBS_AD (b1,b2), respectively.
Remotesensing 15 02600 g009
Figure 10. Improvement in precipitation estimate (in terms of RMSE) with the aid of reduced retrieval uncertainty and smaller sampling interval of soil moisture inputs. RMSE_Diff represents the difference of RMSE with regard to default and referenced soil moisture input. Data_A, Data_D, and Data_AD represent the ascending, descending, and combined soil moisture inputs, respectively.
Remotesensing 15 02600 g010
Figure 11. Similar to Figure 6, but for OBS_A (a1,a2) and OBS_Daily_A (b1,b2).
Remotesensing 15 02600 g011
Figure 12. Similar to Figure 6, but for OBS_D (a1,a2) and OBS_Daily_D (b1,b2), respectively.
Remotesensing 15 02600 g012
Figure 13. Similar to Figure 6, but for OBS_AD (a1,a2) and OBS_Daily_AD (b1,b2), respectively.
Remotesensing 15 02600 g013
Figure 14. Evaluation metrics of SM2RAIN-derived precipitation using soil moisture retrievals from SMAP ascending (SMAP_A), descending (SMAP_D), and combined orbits (SMAP_AD) during JJAS 2015–2018. All the metrics are extracted from Figure 7.
Remotesensing 15 02600 g014
Table 1. Upper and lower boundaries for parameters in the SM2RAIN algorithm.
ParametersLower BoundaryUpper Boundary
Z* (mm)1400
a (mm/d)01800
b (–)150
Tpot (–)0.050.75
Tbase (–)0.053
Kc (–)0.021.98
Table 2. List of precipitation evaluation metrics. Pobs and Pest represent the observed and SM2RAIN estimated 5 -day accumulated precipitation.
Metric ClassesMetricsEquationRange
Statistical
metrics
R R = c o v P e s t , P o b s σ P e s t σ P o b s [−1, 1]
BIAS (mm/5 d) B I A S = P e s t P o b s N [–∞, +∞]
RMSE (mm/5 d) R M S E = P e s t P o b s 2 N [0, +∞]
Categorical
metrics
POD P O D = H H + M [0, 1]
FAR F A R = F H + F [0, 1]
TS T S = H H + M + F [0, 1]
cov and σ indicate the covariance and standard deviation operator; N denotes length of the time series; H, F, and M, each represents precipitation events detected by both rain gauge observations and SM2RAIN estimates, by SM2RAIN estimates but not rain gauge observations, and by rain gauge observations but not SM2RAIN estimates, respectively.
Disclaimer/Publisher’s Note: The statements, opinions and data contained in all publications are solely those of the individual author(s) and contributor(s) and not of MDPI and/or the editor(s). MDPI and/or the editor(s) disclaim responsibility for any injury to people or property resulting from any ideas, methods, instructions or products referred to in the content.

