Article

Multi-Label Classification and Automatic Damage Detection of Masonry Heritage Building through CNN Analysis of Infrared Thermal Imaging

1
Department of Civil Engineering and Industrial Design, University of Liverpool, Liverpool L69 7WW, UK
2
Department of Civil Engineering, Xi’an Jiaotong-Liverpool University, 111 Renai Road, Dushu Lake, Suzhou 215000, China
*
Author to whom correspondence should be addressed.
Remote Sens. 2023, 15(10), 2517; https://doi.org/10.3390/rs15102517
Submission received: 24 February 2023 / Revised: 2 May 2023 / Accepted: 9 May 2023 / Published: 10 May 2023

Abstract

:
In the era of the first Industrial Revolution, many buildings were built with red bricks, and the heritage buildings built at that time are more than 100 years old. In these old heritage buildings, damage is bound to occur due to chemical and physical effects. Technologies such as automatic damage detection can effectively manage damage, but they can be affected by other categories present in heritage buildings. Therefore, this paper proposes a CNN algorithm that can automatically detect cracks and damage that occur in heritage buildings, as well as multi-label classification, such as doors, windows, arches, artwork, brick walls, stonewalls, and vents. A total of 2400 thermal infrared images are collected for 8 categories and automatic classification was performed using the CNN algorithm. The average precision and average sensitivity for the eight categories of heritage buildings are 97.72% and 97.43%, respectively. This paper defines the causes of misclassification as the following two causes: misclassification by multiple objects and misclassification by the perception of the CNN algorithm.

1. Introduction

Brick is a representative building material whose production rapidly increased during the Industrial Revolution, and as mass production became possible during the first Industrial Revolution, numerous buildings were constructed using red bricks [1]. Masonry Heritage buildings over 100 years old require monitoring to ensure stability. Masonry Heritage buildings can be damaged by various external environments, such as earthquakes and weathering, and damage such as cracks can propagate globally and lead to the collapse of heritage buildings [2,3]. Therefore, the monitoring of heritage buildings must be continuously performed for long-term maintenance, and monitoring to measure the damage of heritage buildings has been continuously developed. In order to continuously monitor heritage buildings, data acquisition through wireless monitoring and real-time monitoring is essential [4,5]. Because the installation of sensors in heritage buildings is limited, studies using non-destructive techniques (NDTs) are essential [6,7]. Jalón et al. (2021) conducted research on monitoring heritage buildings through various digital photogrammetry techniques [8]. Recently, studies are being conducted to monitor heritage buildings through LiDAR techniques. Lerones (2016) and others used 3D laser scanning to detect moisture present in heritage buildings [9]. Zahiri et al. (2021) conducted a study to characterize the materials of a building with multispectral imagery and LiDAR intensity data [10]. Moyano et al. (2022) conducted a case study to collect heritage building information by terrestrial laser scanning [11]. Costanzo et al. (2022) conducted a study on the impact of heritage buildings by traffic-induced vibrations with laser scanning investigation and geophysical monitoring at Villa Farnesina in Rome [12].
A study to develop a platform that manages the monitoring of data collected in this way is also being conducted [13]. Because heritage buildings are affected by seasons or climate, the monitoring of changes in heritage buildings due to environmental influences is also being carried out [14,15]. Infrared thermography is also being used to detect environmental changes in detail [16]. In order for the data monitored by heritage buildings to be effectively reflected on the heritage site, techniques for automatically analysing monitoring data have also been developed. Mishra (2020) applied a machining-learning algorithm to data analysis after structural health monitoring of a heritage building [17,18,19]. Boesgaard (2022) also utilized machine learning to predict indoor climate [20]. Monna (2021) and others conducted research on detecting built-in cultural heritage by analysing satellite images with a deep-learning algorithm [21]. Cui (2021) proposed digital intangible cultural heritage management (DLICHM) using a deep-learning algorithm to analyse damaged images and image reconstruction [22]. This deep-learning algorithm for automatic damage detection has been applied not only to heritage buildings but also to other infrastructures [23,24,25]. To detect each damage, deep-learning algorithms and machine-learning algorithms, including CNN algorithms, are used [26,27]. Recently, studies on detecting structural displacement and damage based on 3D point cloud data have been conducted [28,29]. Structure stability analysis of 3D data enables damage detection in extensive areas of structures [30,31,32]. However, it does not have high accuracy as a monitoring technique because of errors in the data acquisition process [33,34,35].
In this paper, data for training and testing the deep-learning algorithm were collected by taking pictures of objects existing in the heritage building using an infrared thermal camera. Infrared thermal images can effectively detect damage, such as cracks, in heritage buildings [36]. Thermal infrared images collected by the CNN algorithm can be multi-label-classified and cracks can be automatically measured. The main contribution of this research is to collect infrared images for each element of the heritage building, and it was automatically categorized to detect the damage to the heritage building.

2. Site Introduction

Victoria Gallery and Museum of the University of Liverpool completed its construction in the year 1892 and was designed by architect Alfred Waterhouse (see Figure 1). This structure has served as the heart of the university community ever since it was constructed in 1892. In 2008, following extensive renovation work that totalled GBP 8.6 million and was finally finished, it was officially renamed the “Victoria Gallery and Museum”, and it was opened to the public as one of the most distinctive museums and art galleries in Liverpool. In addition, the project was finished in 2008. It houses the art and museum collections that have been given to the University of Liverpool or were created by the university itself. This structure was given a spectacular quality by the combination of its neo-Gothic architecture, exquisite brickwork, stunning Italian mosaic inside, and typical Victorian tiles. All of these elements work together to create the building.
Most of the heritage buildings built in the 19th century were built with red brick as a material due to the influence of the first Industrial Revolution. Red bricks are made by mixing clay, water, and aggregate together. The compressive strength value of red brick sample one is (0–2.77) Mpa [37]. Red brick undergoes physical and chemical weathering, such as abrasion, over a long period of time. In particular, acceptable water absorption for red brick is between 12% and 20%, which is highly influenced by water. Water enters cracks caused by physical loading or weathering. When water freezes due to seasonal effects, cracks can expand and contract, and the crack opens a little wider. Over time, pieces of red brick can split off from the surface of the red brick body, and this damage can further expand. Because the Victoria Gallery and Museum was built about 130 years ago, it needs to be monitored for physical and chemical weathering, as well as seasonal effects. In particular, it is necessary to measure cracks at an early stage to prevent expanding cracks due to the water or destroying red bricks. It is necessary to carry out monitoring over a long period of time to assess weathering effects, and both micro and macro cracks must be monitored. Therefore, in this paper, the Victoria Gallery and Museum was measured in general through a thermal infrared camera.

3. Field Test

3.1. Infrared Thermal Imaging

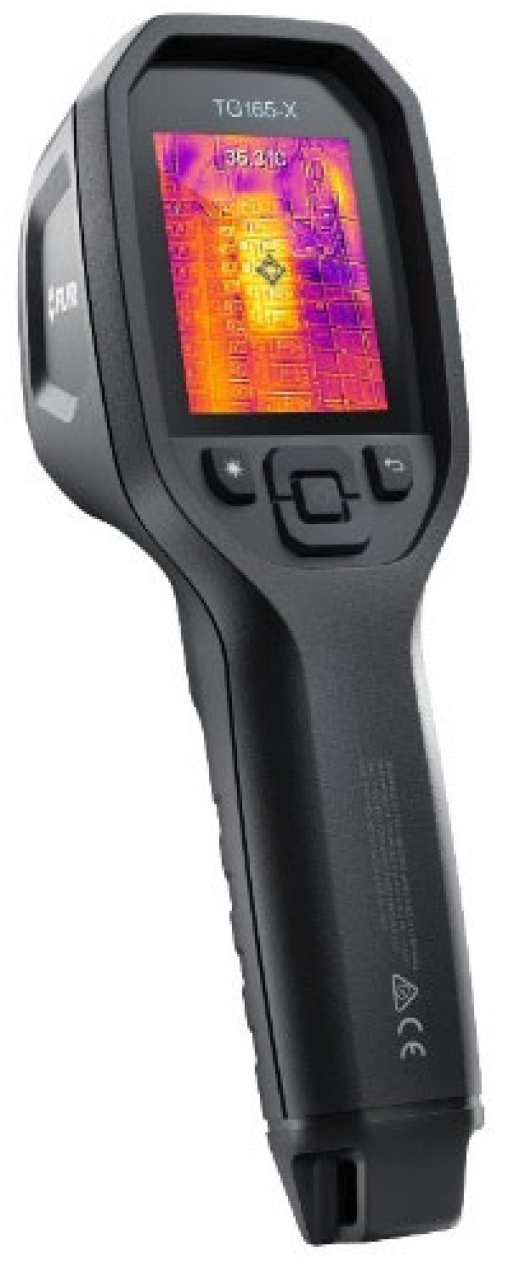
In this study, infrared thermal images were used to evaluate the damage to heritage buildings. Digital cameras may not be able to capture micro-cracks in red brick due to pixel resolution. However, infrared thermal images can detect cracks through micro-cracks and the temperature difference between cracks and red bricks [38,39]. Therefore, in this paper, a thermal infrared camera was used to detect not only cracks, but also various objects present in the heritage building. A FLIR ONE TG165-X camera was used to take photographs of each of the images that belong to the various categories as shown in Figure 2. This particular camera has an infrared resolution of 80 × 60 pixels and a thermal sensitivity of less than 70 mK. The detailed specification of the thermal infrared camera is shown in Table 1. In this paper, we focus on the relative temperature difference within a single picture in order to automatically classify the categories of objects present in the heritage building. Therefore, the absolute temperature difference is not considered.
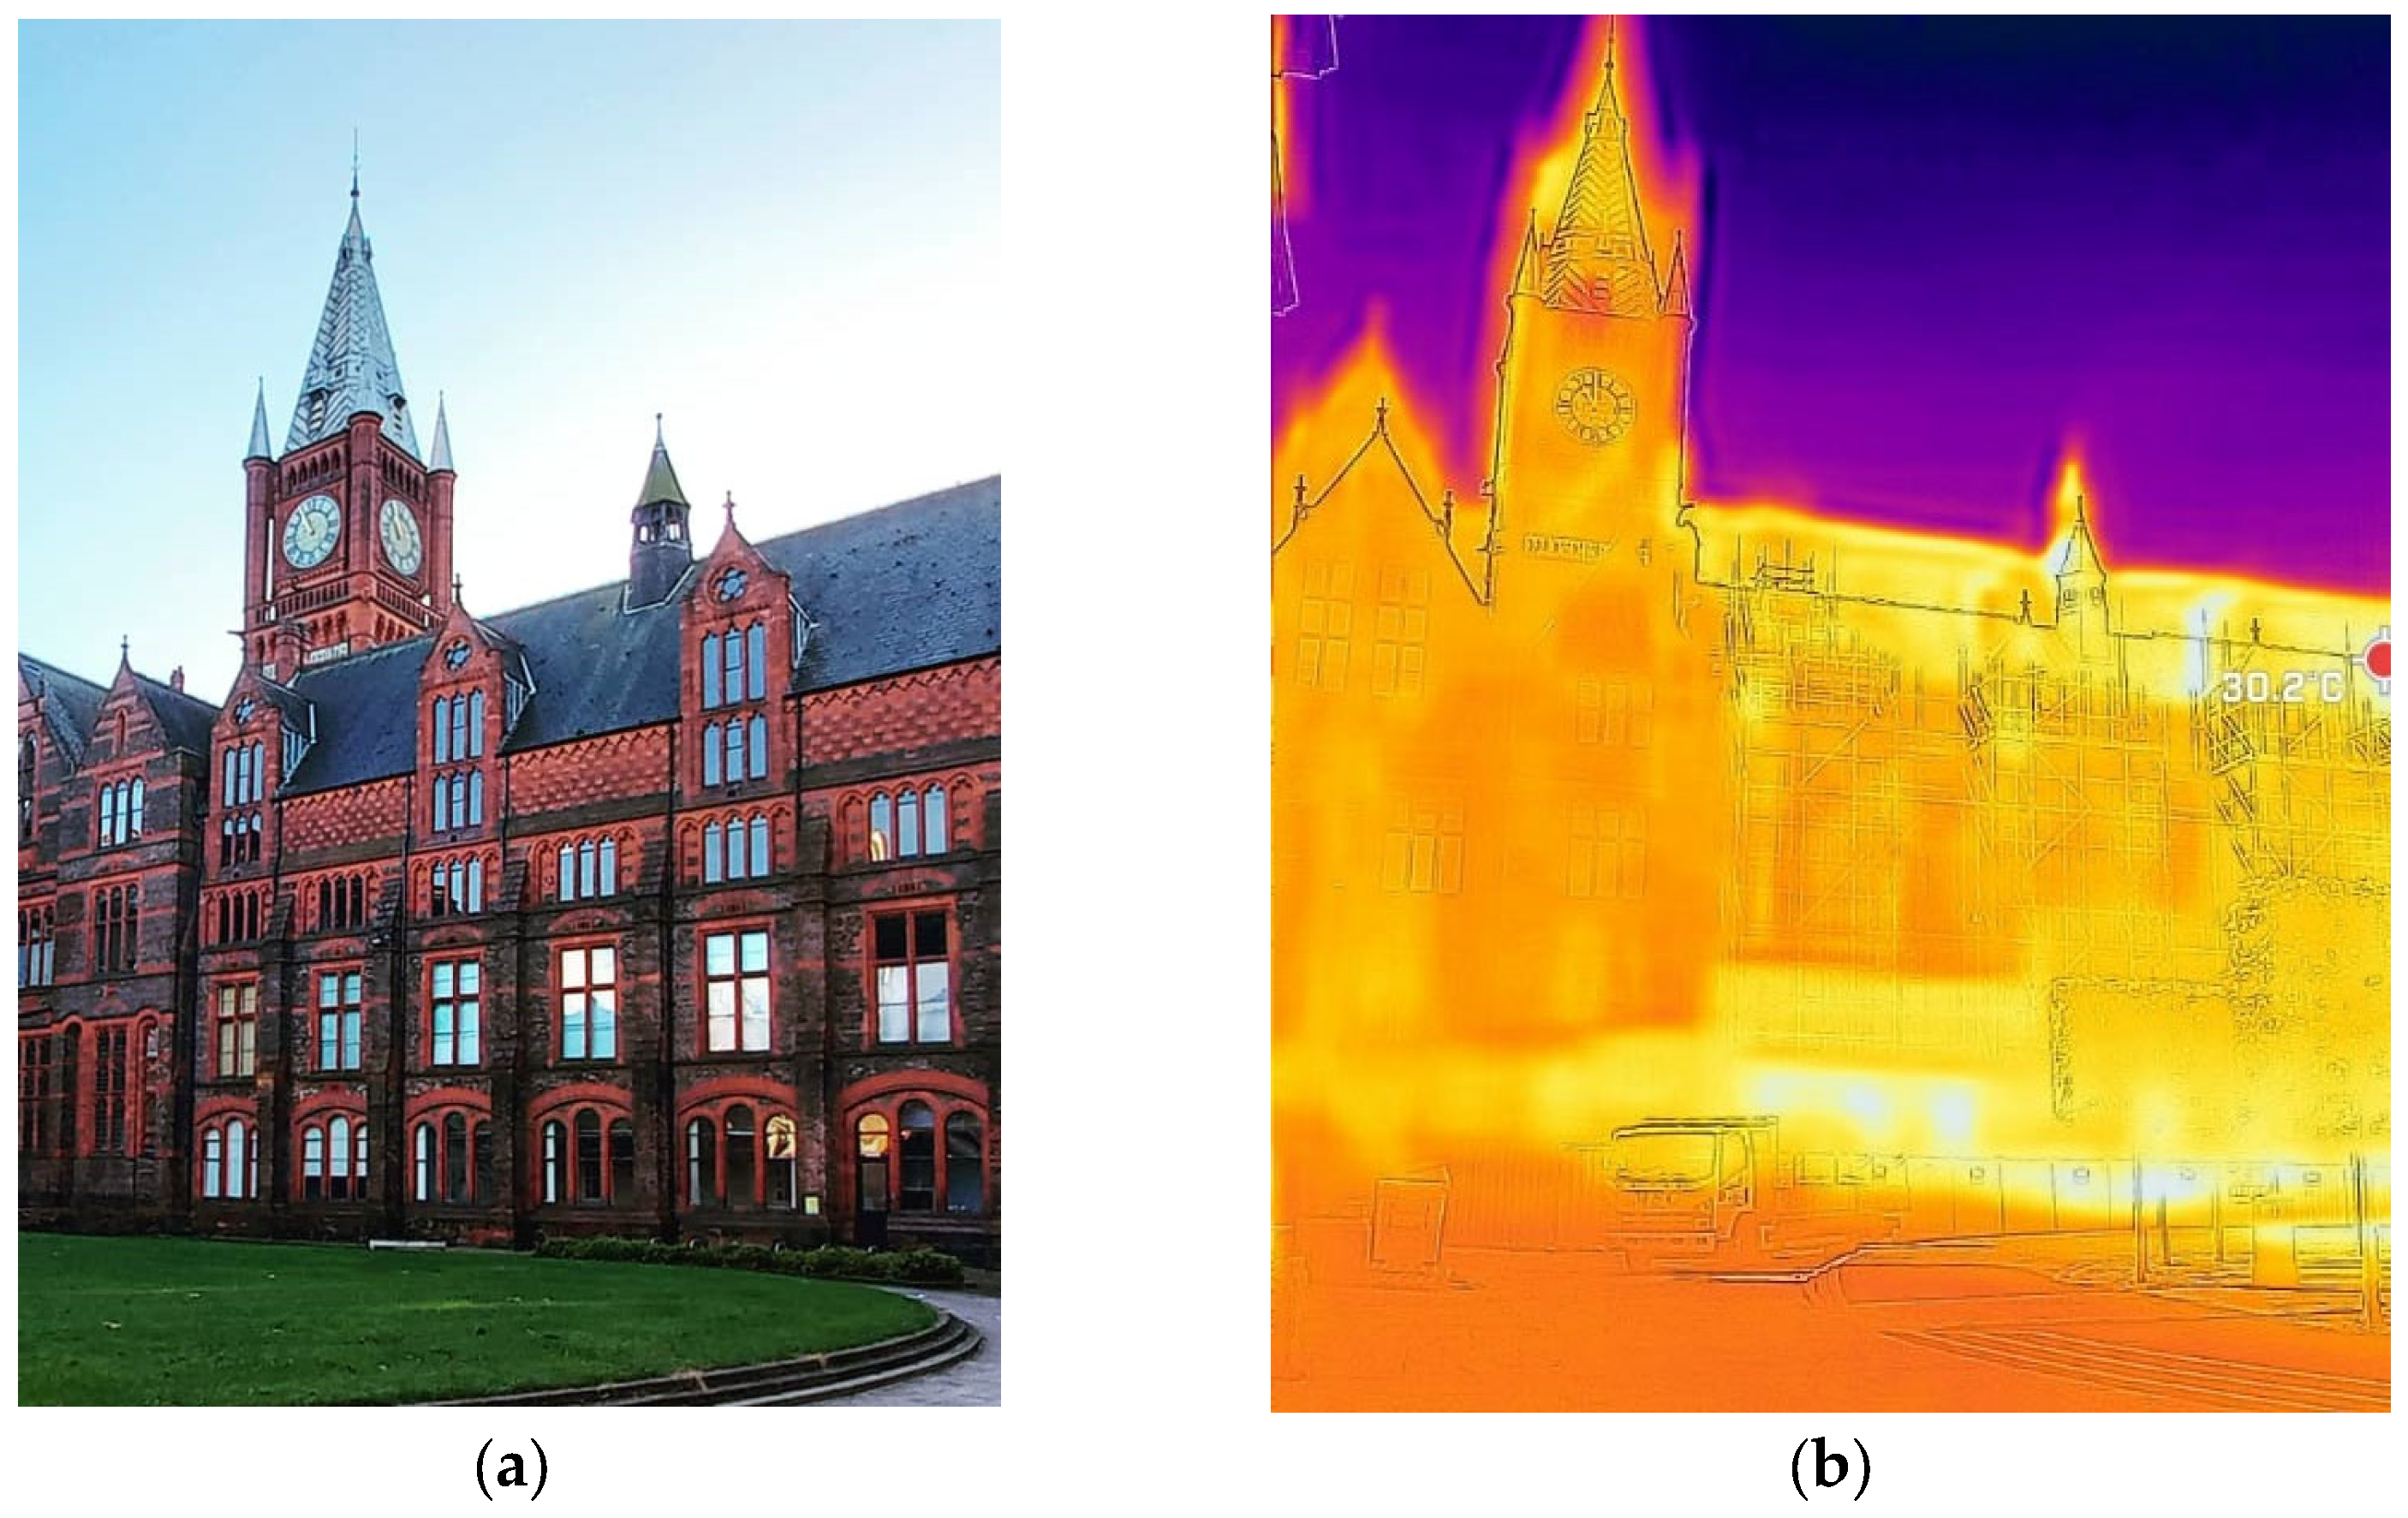
Figure 3 shows digital and infrared thermal images of the Victoria Gallery and Museum. As shown in Figure 3a, there are various objects, such as doors, windows, arches, artwork, brick walls, stonewalls, cracks, and vents, in the heritage building. The detection of cracks is the ultimate purpose of this paper, but cracks are not able to be detected unless other objects are also classified. Figure 3b is an infrared thermal image of the Victoria Gallery and Museum. As the distance between the heritage building and the thermal infrared camera increases, the temperature change between various objects in the heritage building is not able to be clearly identified, and the boundary between each object is not revealed. Small elements, such as cracks, are also not revealed in the image. This is because the resolution of the thermal infrared image is reduced and the difference between the lowest temperature and the highest temperature in one image is large. Therefore, in this paper, the distance between the heritage building and the thermal infrared camera was set to 1 m to collect images of each object in the heritage building.

3.2. Data Collection

All the images were taken in clear daylight and a non-cloudy atmosphere. Despite this, the month of July 2022 was marked by exceptionally high temperatures. There were reports of a heat wave because the temperature was significantly higher than average. The temperature dropped to a low of 26 degrees Celsius during the night after reaching a high of 32 degrees Celsius during the day. The images taken during these days were taken in direct sunlight which had a significant impact on the surface temperature. This had an effect on the temperature that was reflected, which resulted in increased emissivity. The range of thermal imaging equipment can be significantly hindered when rain clouds scatter the light that is emitted by individual water droplets. As the number of droplets rises, the infrared signal suffers a significant loss of strength. Consequently, infrared imaging was not performed when there was precipitation.
As the Victoria Gallery and Museum is a very large area to cover, it was divided into eight different categories in order to obtain a more precise image. A massive amount of data is required for accurate categorisation. It was simpler to appropriately categorise and order the data after dividing it into groups.
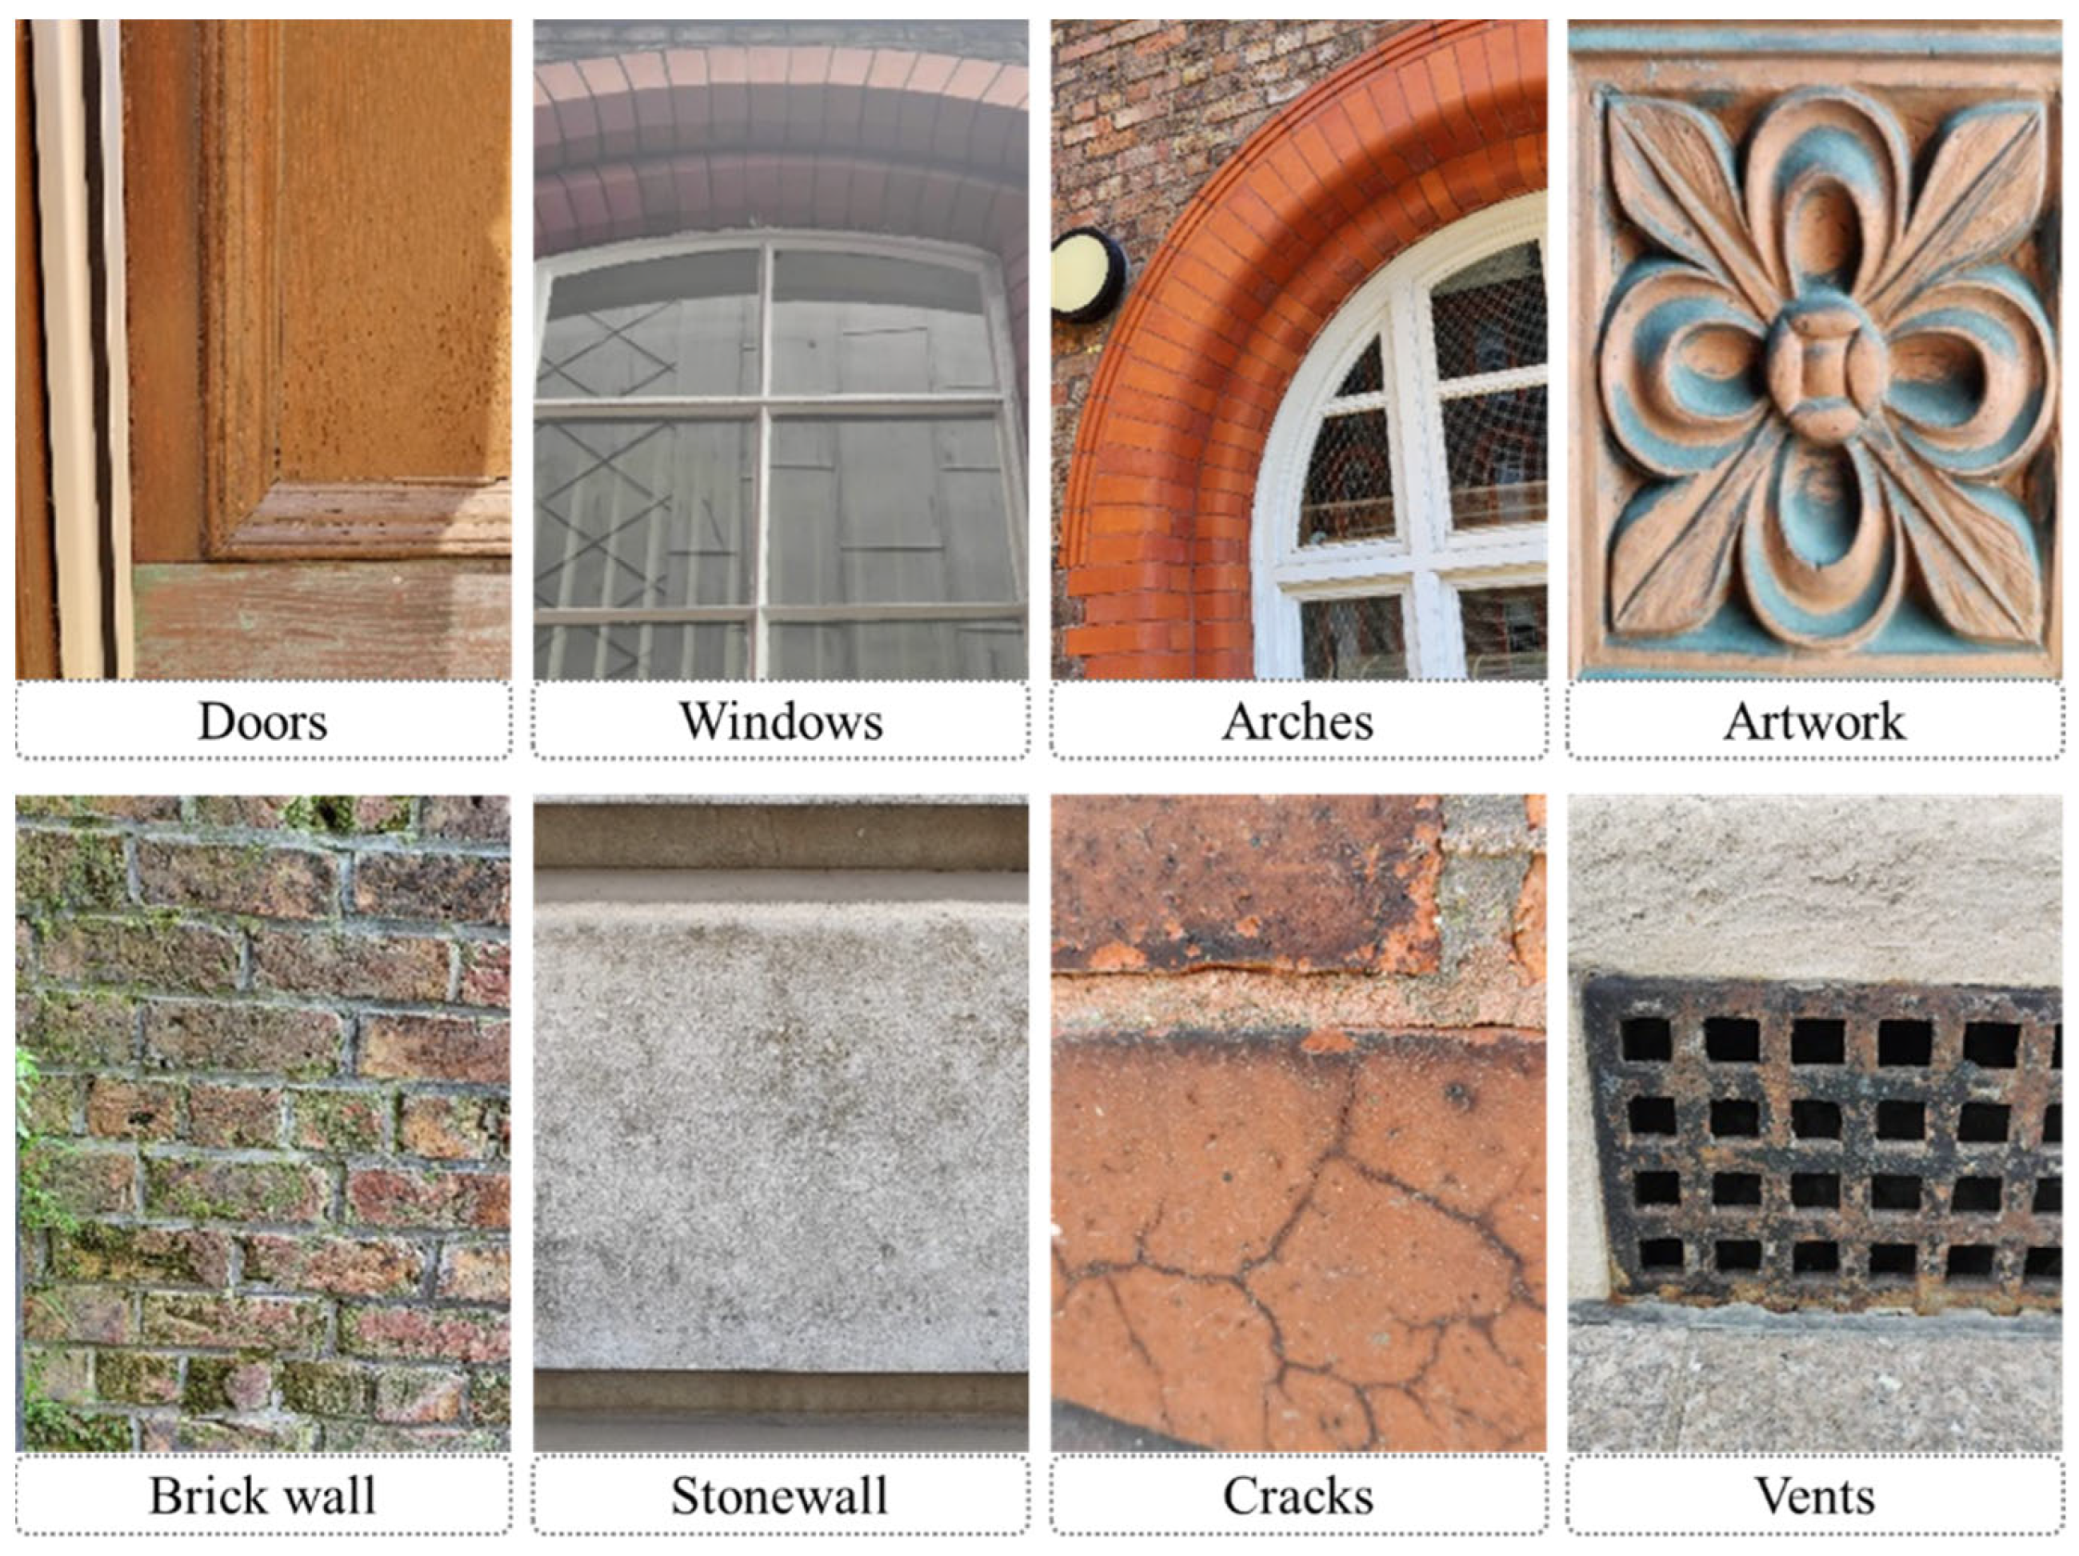
The eight categories are listed as follows: doors; windows; arches; artwork; brick wall; stonewall; cracks; and vents (see Figure 4). The Victoria Gallery’s design features a lot of arches and artwork because it is an old neo-Gothic building, leading us to create these key classification categories. This structure features numerous windows on every side. However, it was a little challenging to collect the data because most windows are at a specific height. While the newly refurbished portion of the museum also has stones, the front structure and rear side of the building are entirely composed of bricks. Doorways in this structure are limited. The main entry features a door on either side of an arch with artwork. With an adequate number of vents in the lowest portion of the structure, the building is appropriately ventilated. There were several fissures in the building’s brick and stone walls. As a result, cracks were added as a category. Almost every component of the construction was covered by the eight categories we took into consideration. Therefore, these categories were sufficient to identify damages. In order to automatically detect damage such as cracks in a heritage building effectively, it is first of all necessary to distinguish it from other structures existing in the heritage building. Therefore, in this paper, several categories were selected to consider not only damage, but also other elements that exist in heritage buildings.
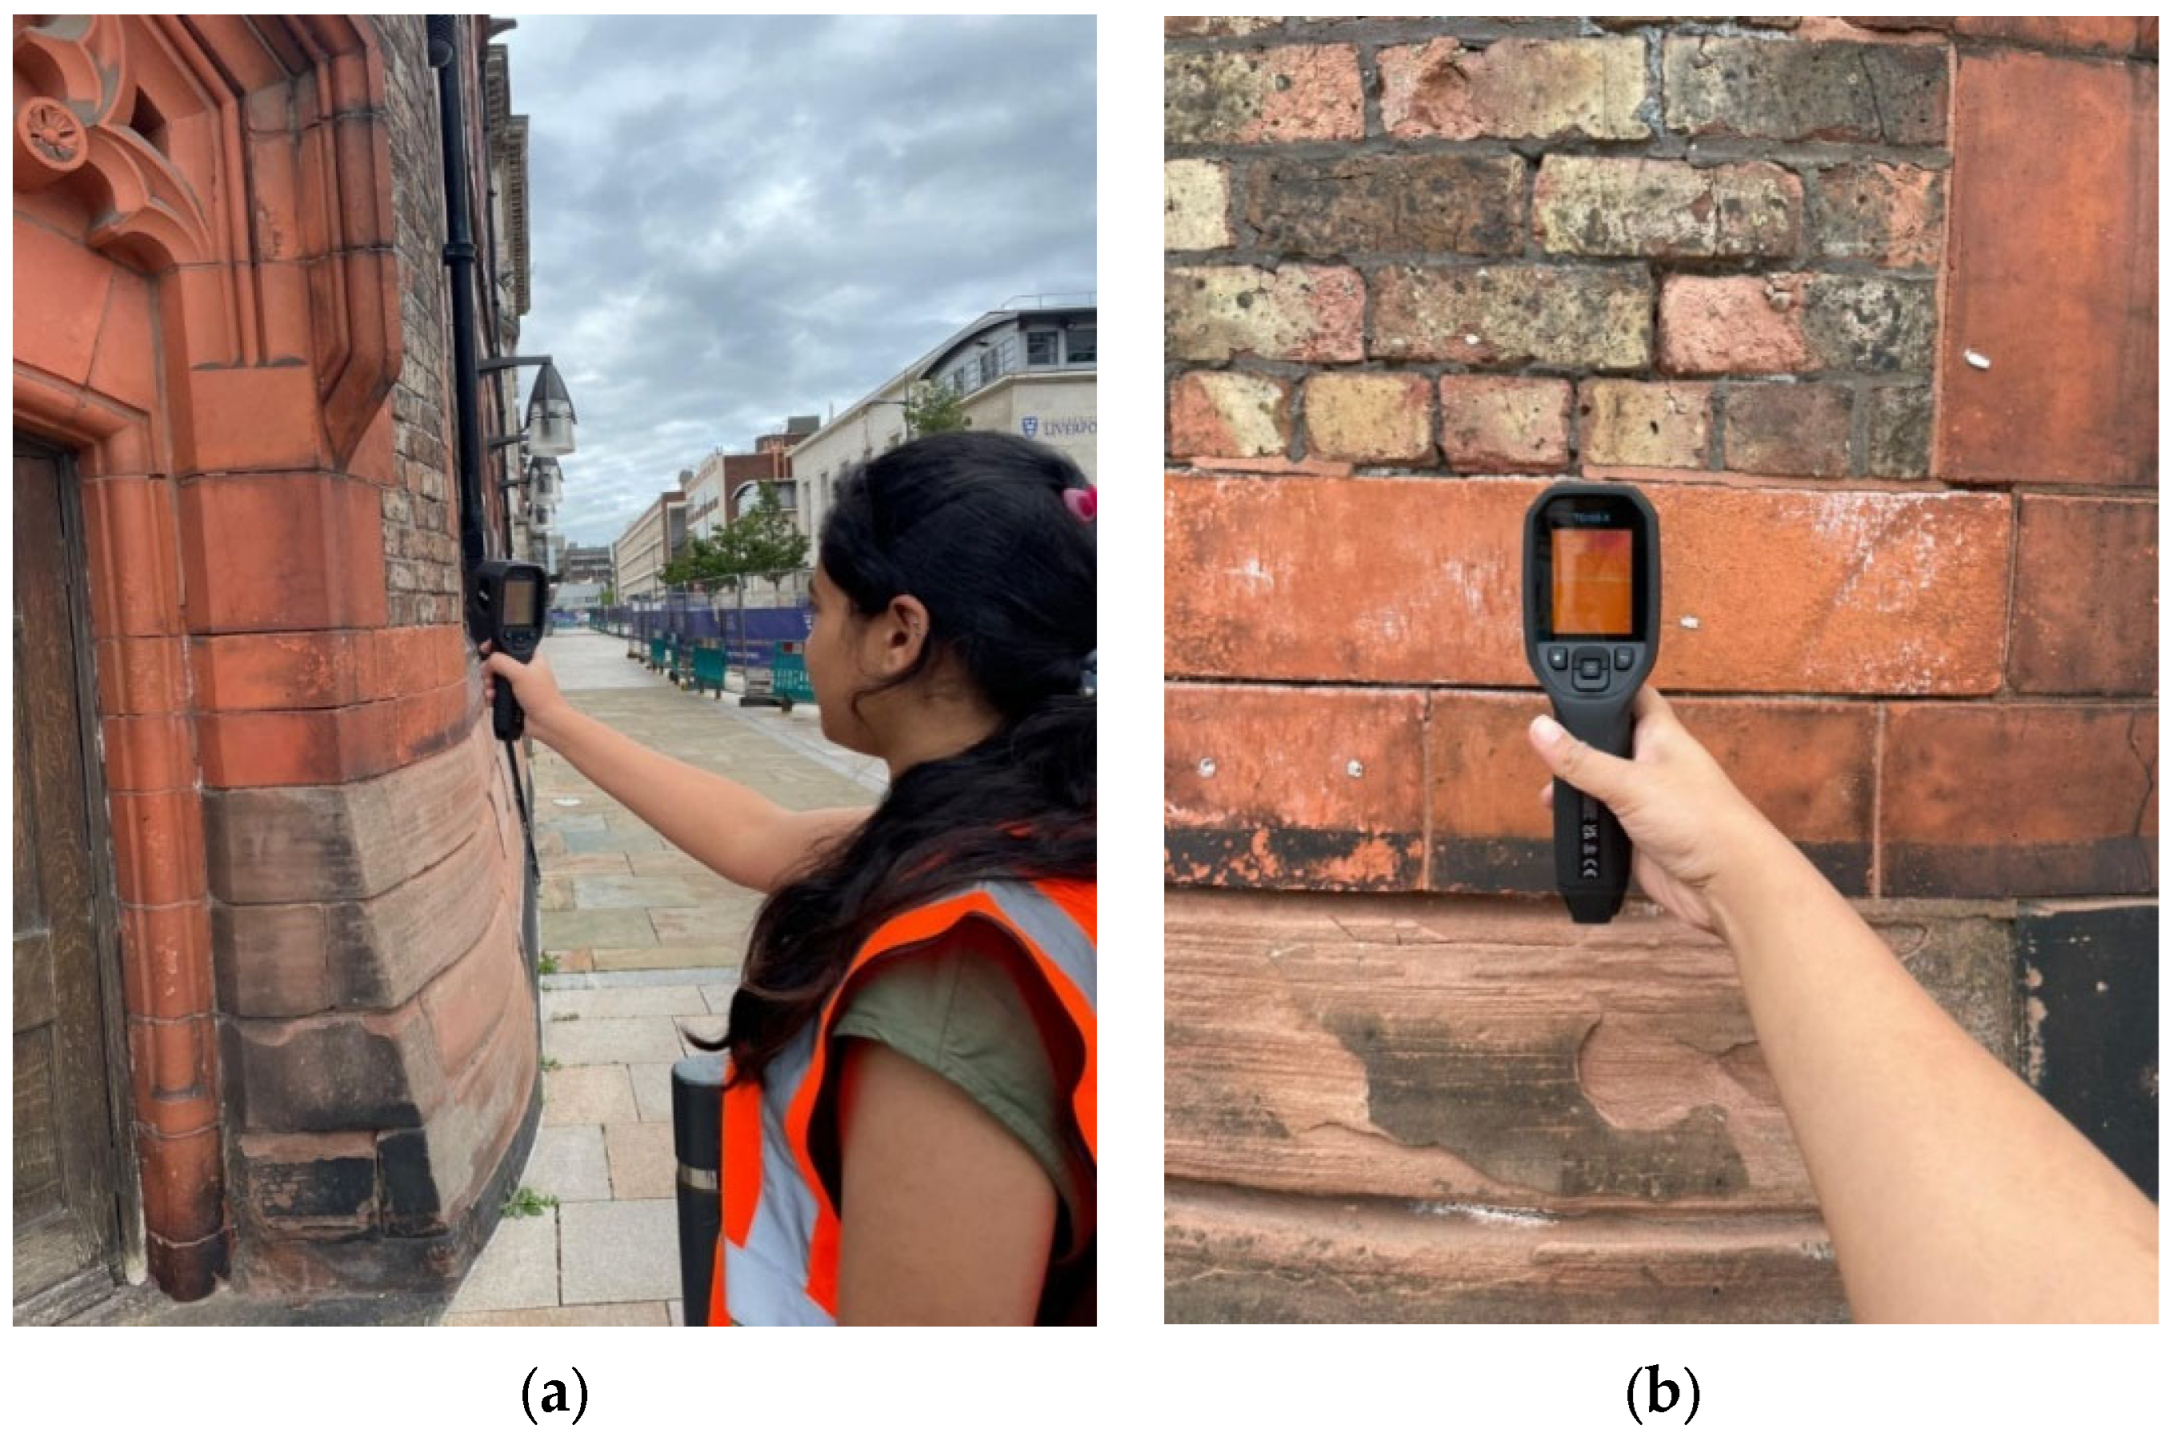
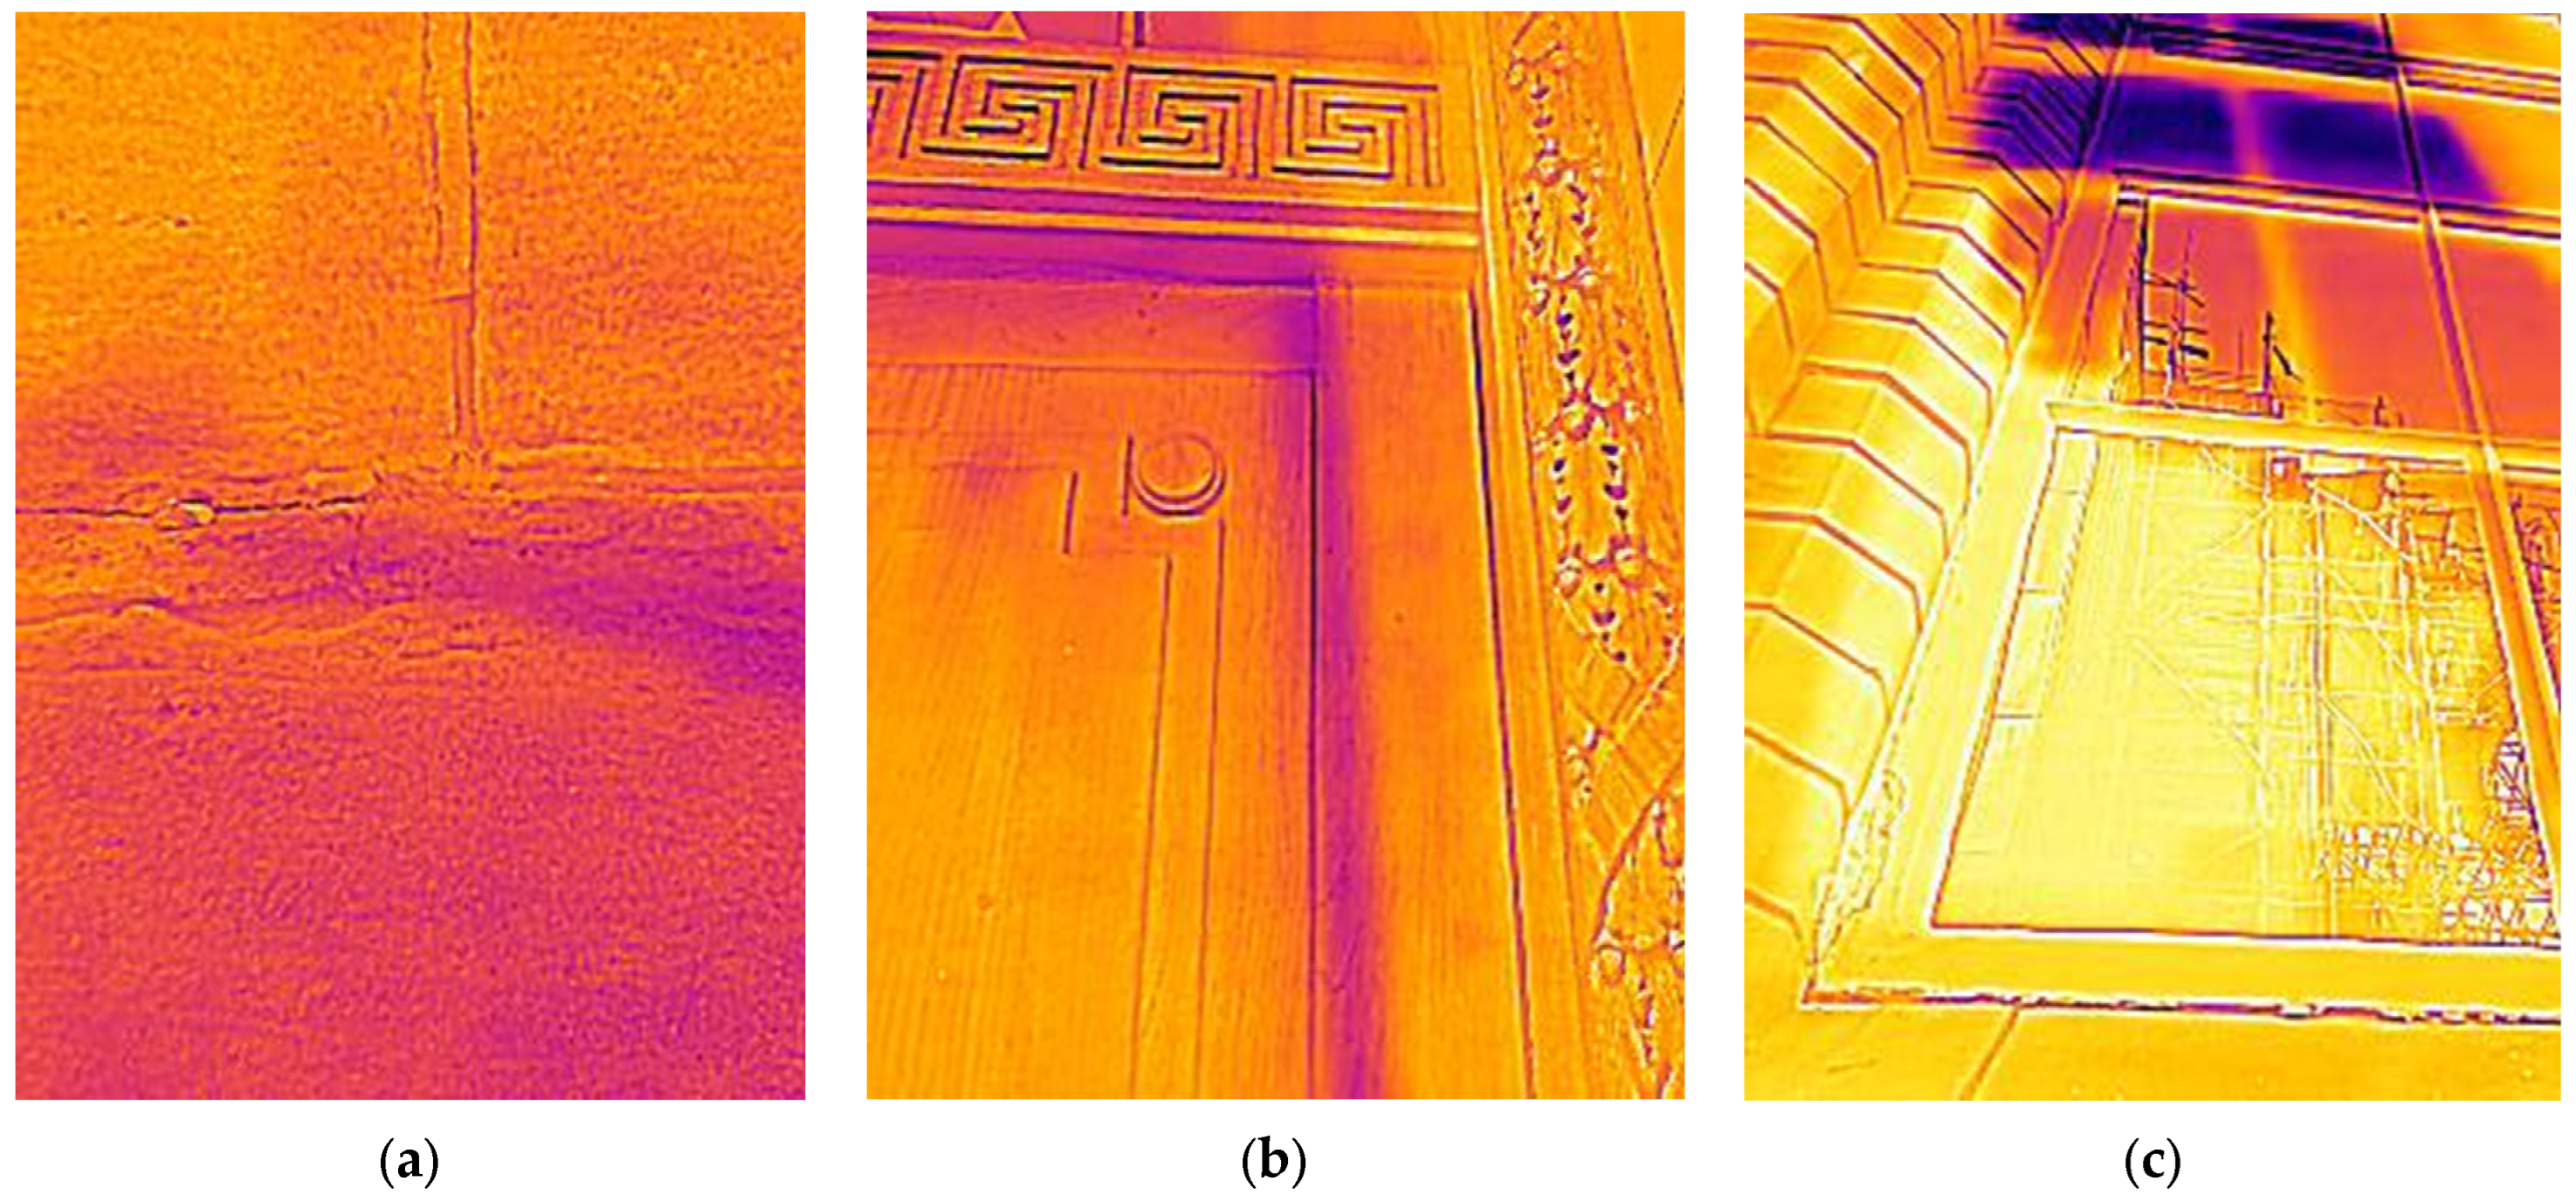
In this paper, 300 pictures were collected for each category to classify thermal infrared images for 8 categories with a deep-learning algorithm, and the total number of collected images was 2400. In order to collect thermal images of the same scale, the distance between the thermal infrared camera and the object was set to 1 m as shown in Figure 5a. To minimize the collection of blurry images, images were taken in a fixed state as shown in Figure 5b. Data cleansing was conducted by removing the images containing the following: unclear or blurry images and images in an irregular scale. The scale of data acquisition can affect further CNN analysis. For example, if multiple categories are included in an image, this can affect the results of CNN analysis. Therefore, stipulating the scale of the image at the data collection stage is essential to ensure high classification accuracy.
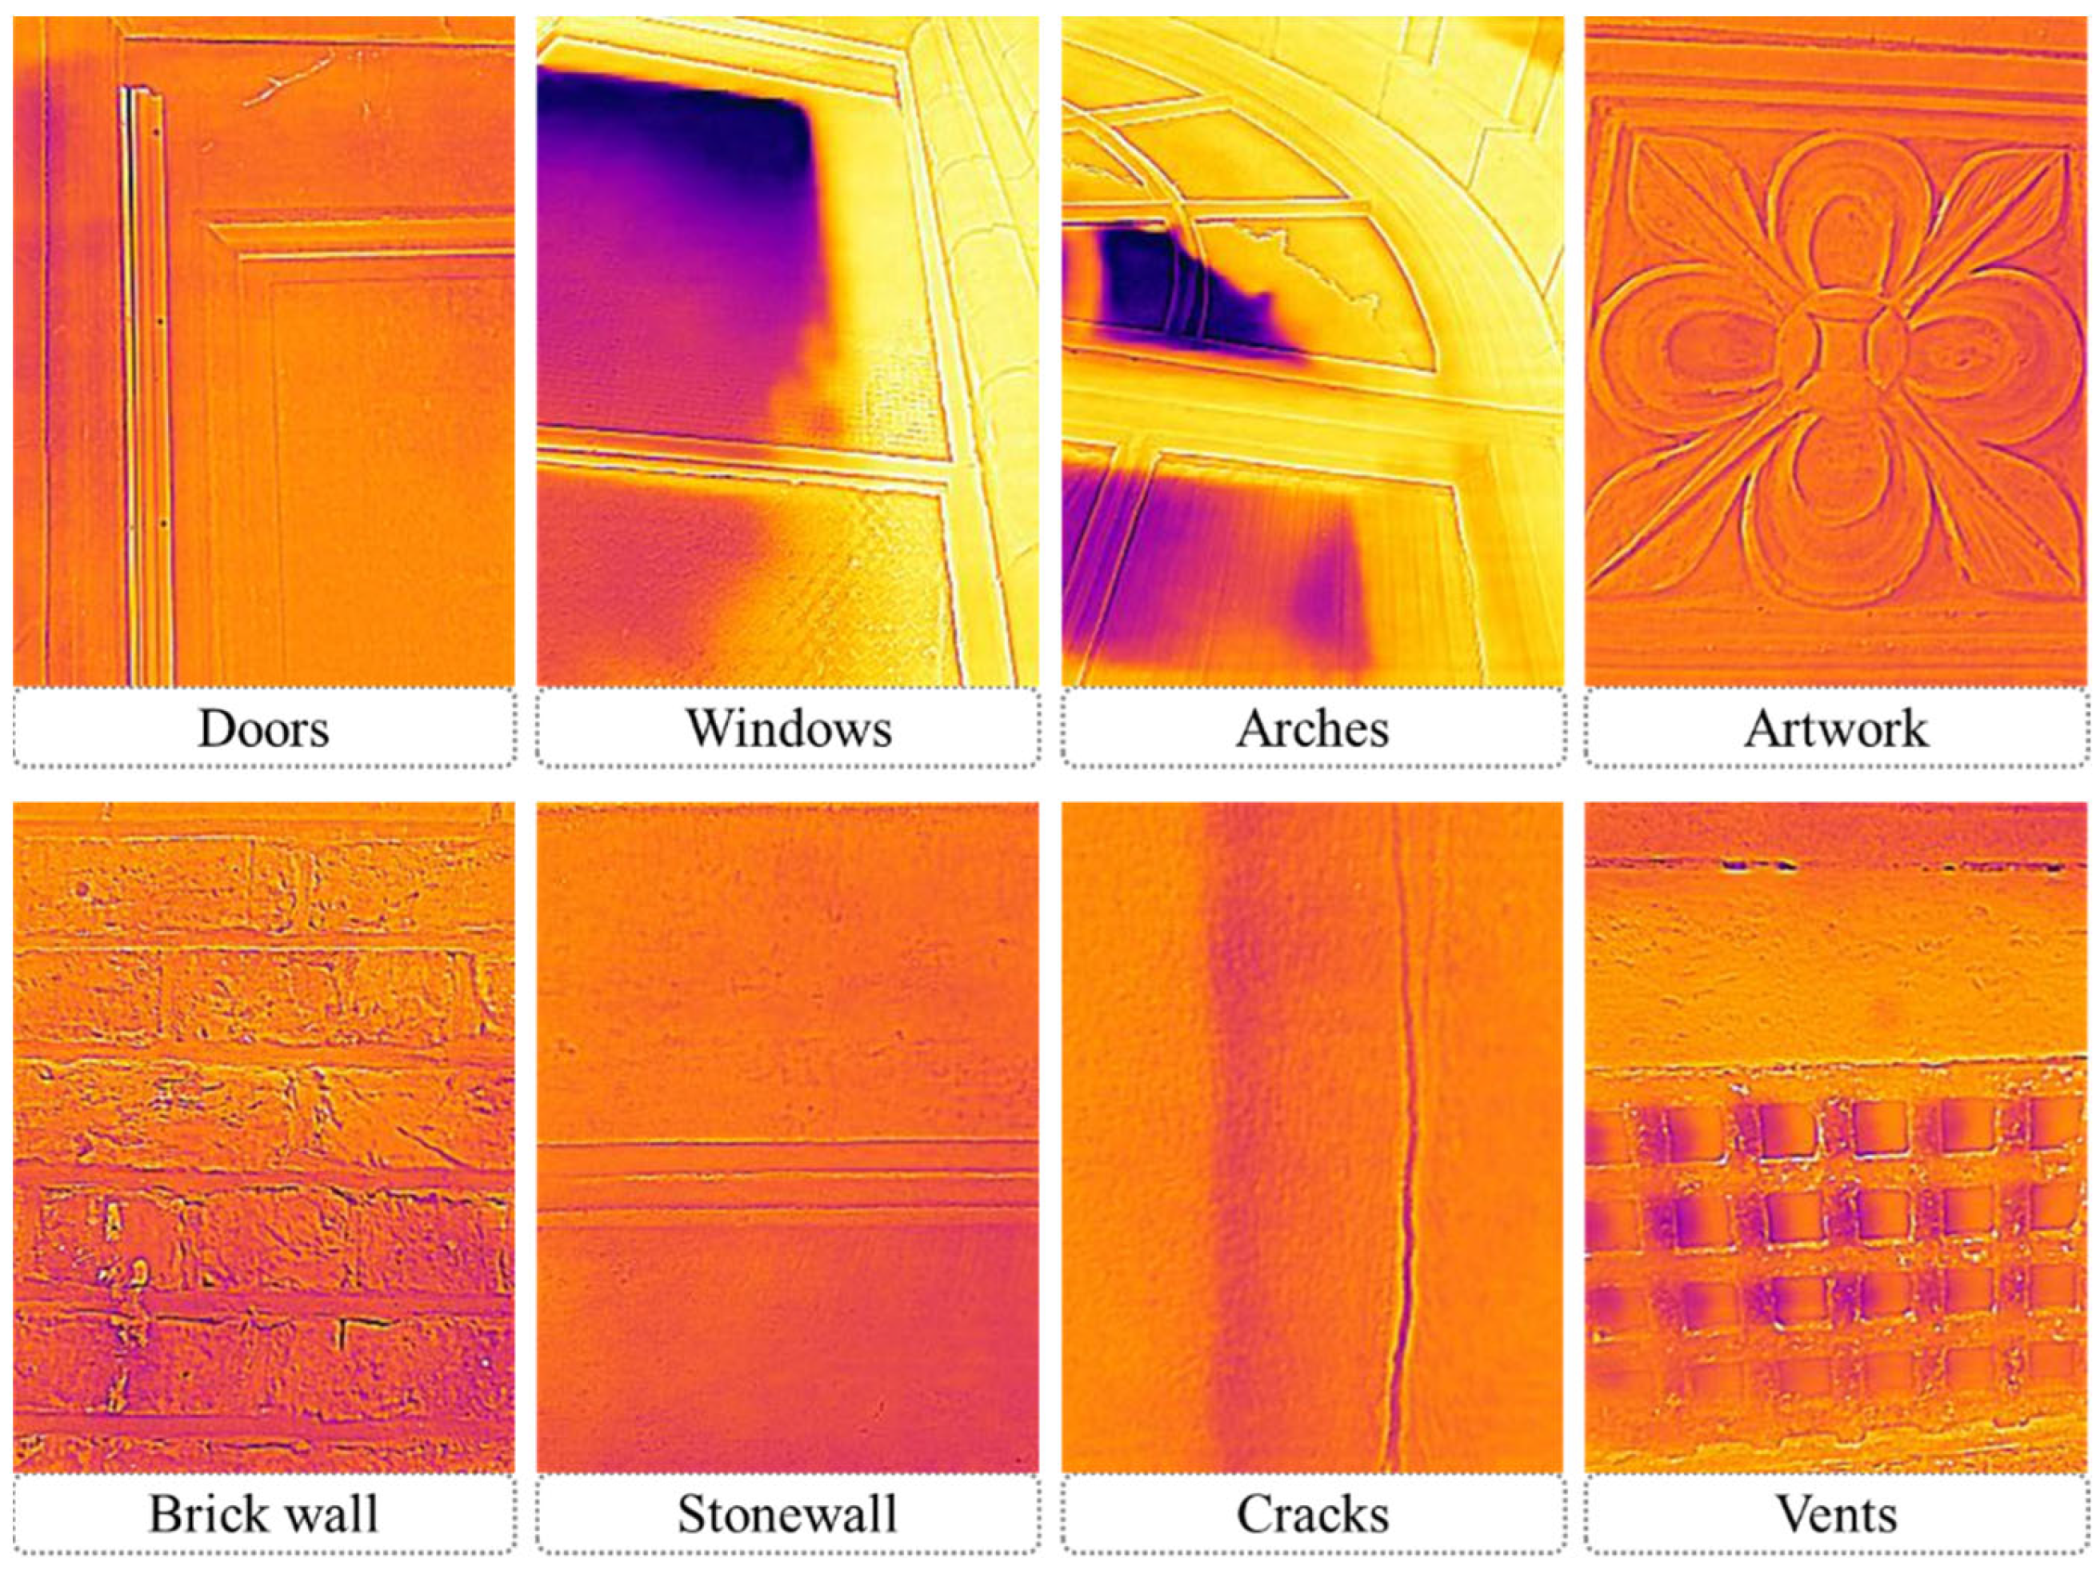
Figure 6 shows the infrared thermal images collected in each category. In all images, the boundary is clearly revealed by the relative temperature difference between different objects. In particular, when an infrared thermal camera penetrates or captures the atmosphere, such as a window and a vent, it shows a significant temperature difference. Doors are featured at large right angles between the wood and wall, and brick walls are featured as small rectangles in the images. While the artwork is made up of various curves, the stonewall is featured as being sharp and is not subject to large temperature changes. Because the temperature inside the crack is lower than the temperature of the wall, even a small crack reveals its shape on the infrared thermal image. For CNN algorithm analysis, the temperature difference at the boundary that can recognize the shape of an object can affect the analysis results rather than the absolute value of the temperature. As shown in Figure 6, the infrared image clearly reveals the boundaries for shape change of the object in each category.

4. Automatic Damage Detection

4.1. Analysis of Infrared Thermal Images

The infrared thermal images clearly reveal the temperature change at the boundary of each object. In order to quantitatively analyse the temperature change pattern of this boundary, the RGB channel value of each pixel is analysed. As the channel values of red, green, and blue increase, the colours are closer to pure red, green, and blue, respectively, and as the channel values are closer to 0, the colours become closer to black (see Figure 7). In this paper, image analysis was conducted through greyscale, in which all characteristics of the RGB images were reflected. Because thermal infrared images contain various colours, the colours of thermal infrared images are converted to greyscale in this paper. Therefore, the channel value change pattern of the pixels of the image was analysed with the grey channel value in this paper.
Doors and artwork show similar infrared thermal energy changes (see Figure 8). Background images are mostly light grey and show low thermal energy due to shadows at the interfaces of objects. Therefore, in the infrared thermal image of the door, low thermal energy appears at the boundary between the door pieces or in the gap between the doors. As shown in the histogram result, most of the light grey pixels corresponding to the background image of the door have a grey channel of over 200 (see Figure 8a). Pixels corresponding to the boundary of the door piece or the gap between the doors have low pixel values and appear in straight lines as seen in the 3D image. Figure 8b shows the histogram and 3D colour scale of the thermal infrared image of the artwork. Similar to the results of the door, most of the pixels in the histogram are concentrated at grey channel values of over 200. However, in the thermal infrared image of the artwork, the shadow area is more widely distributed than the shadow of the door, resulting in a wider histogram. Even in the 3D colour scale result, the area where the thermal energy is reduced by the shadow is visible, and the shape of the artwork is clearly revealed due to this area.
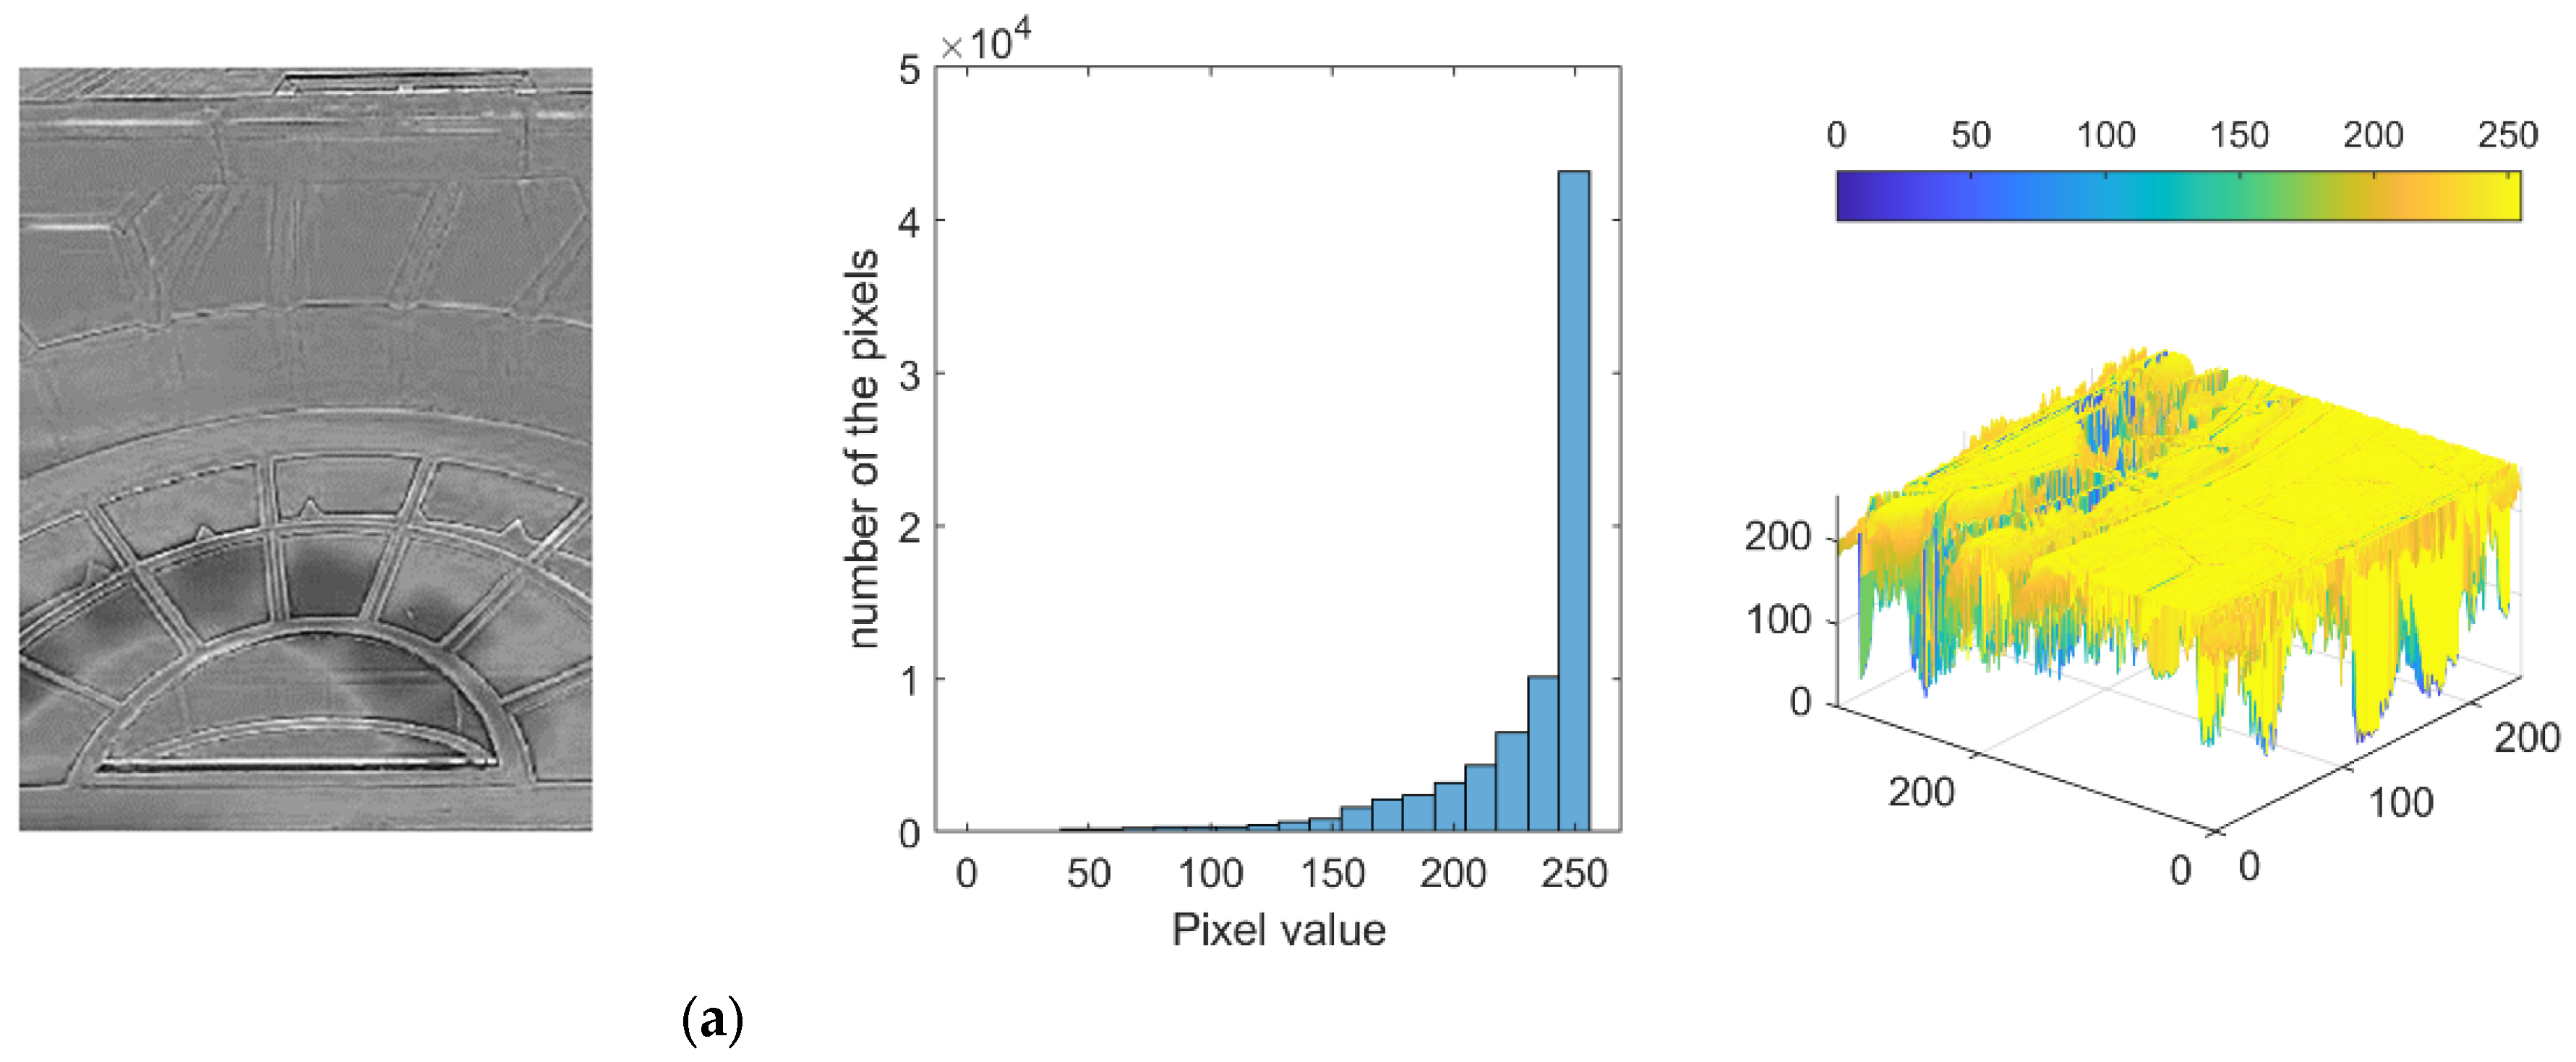
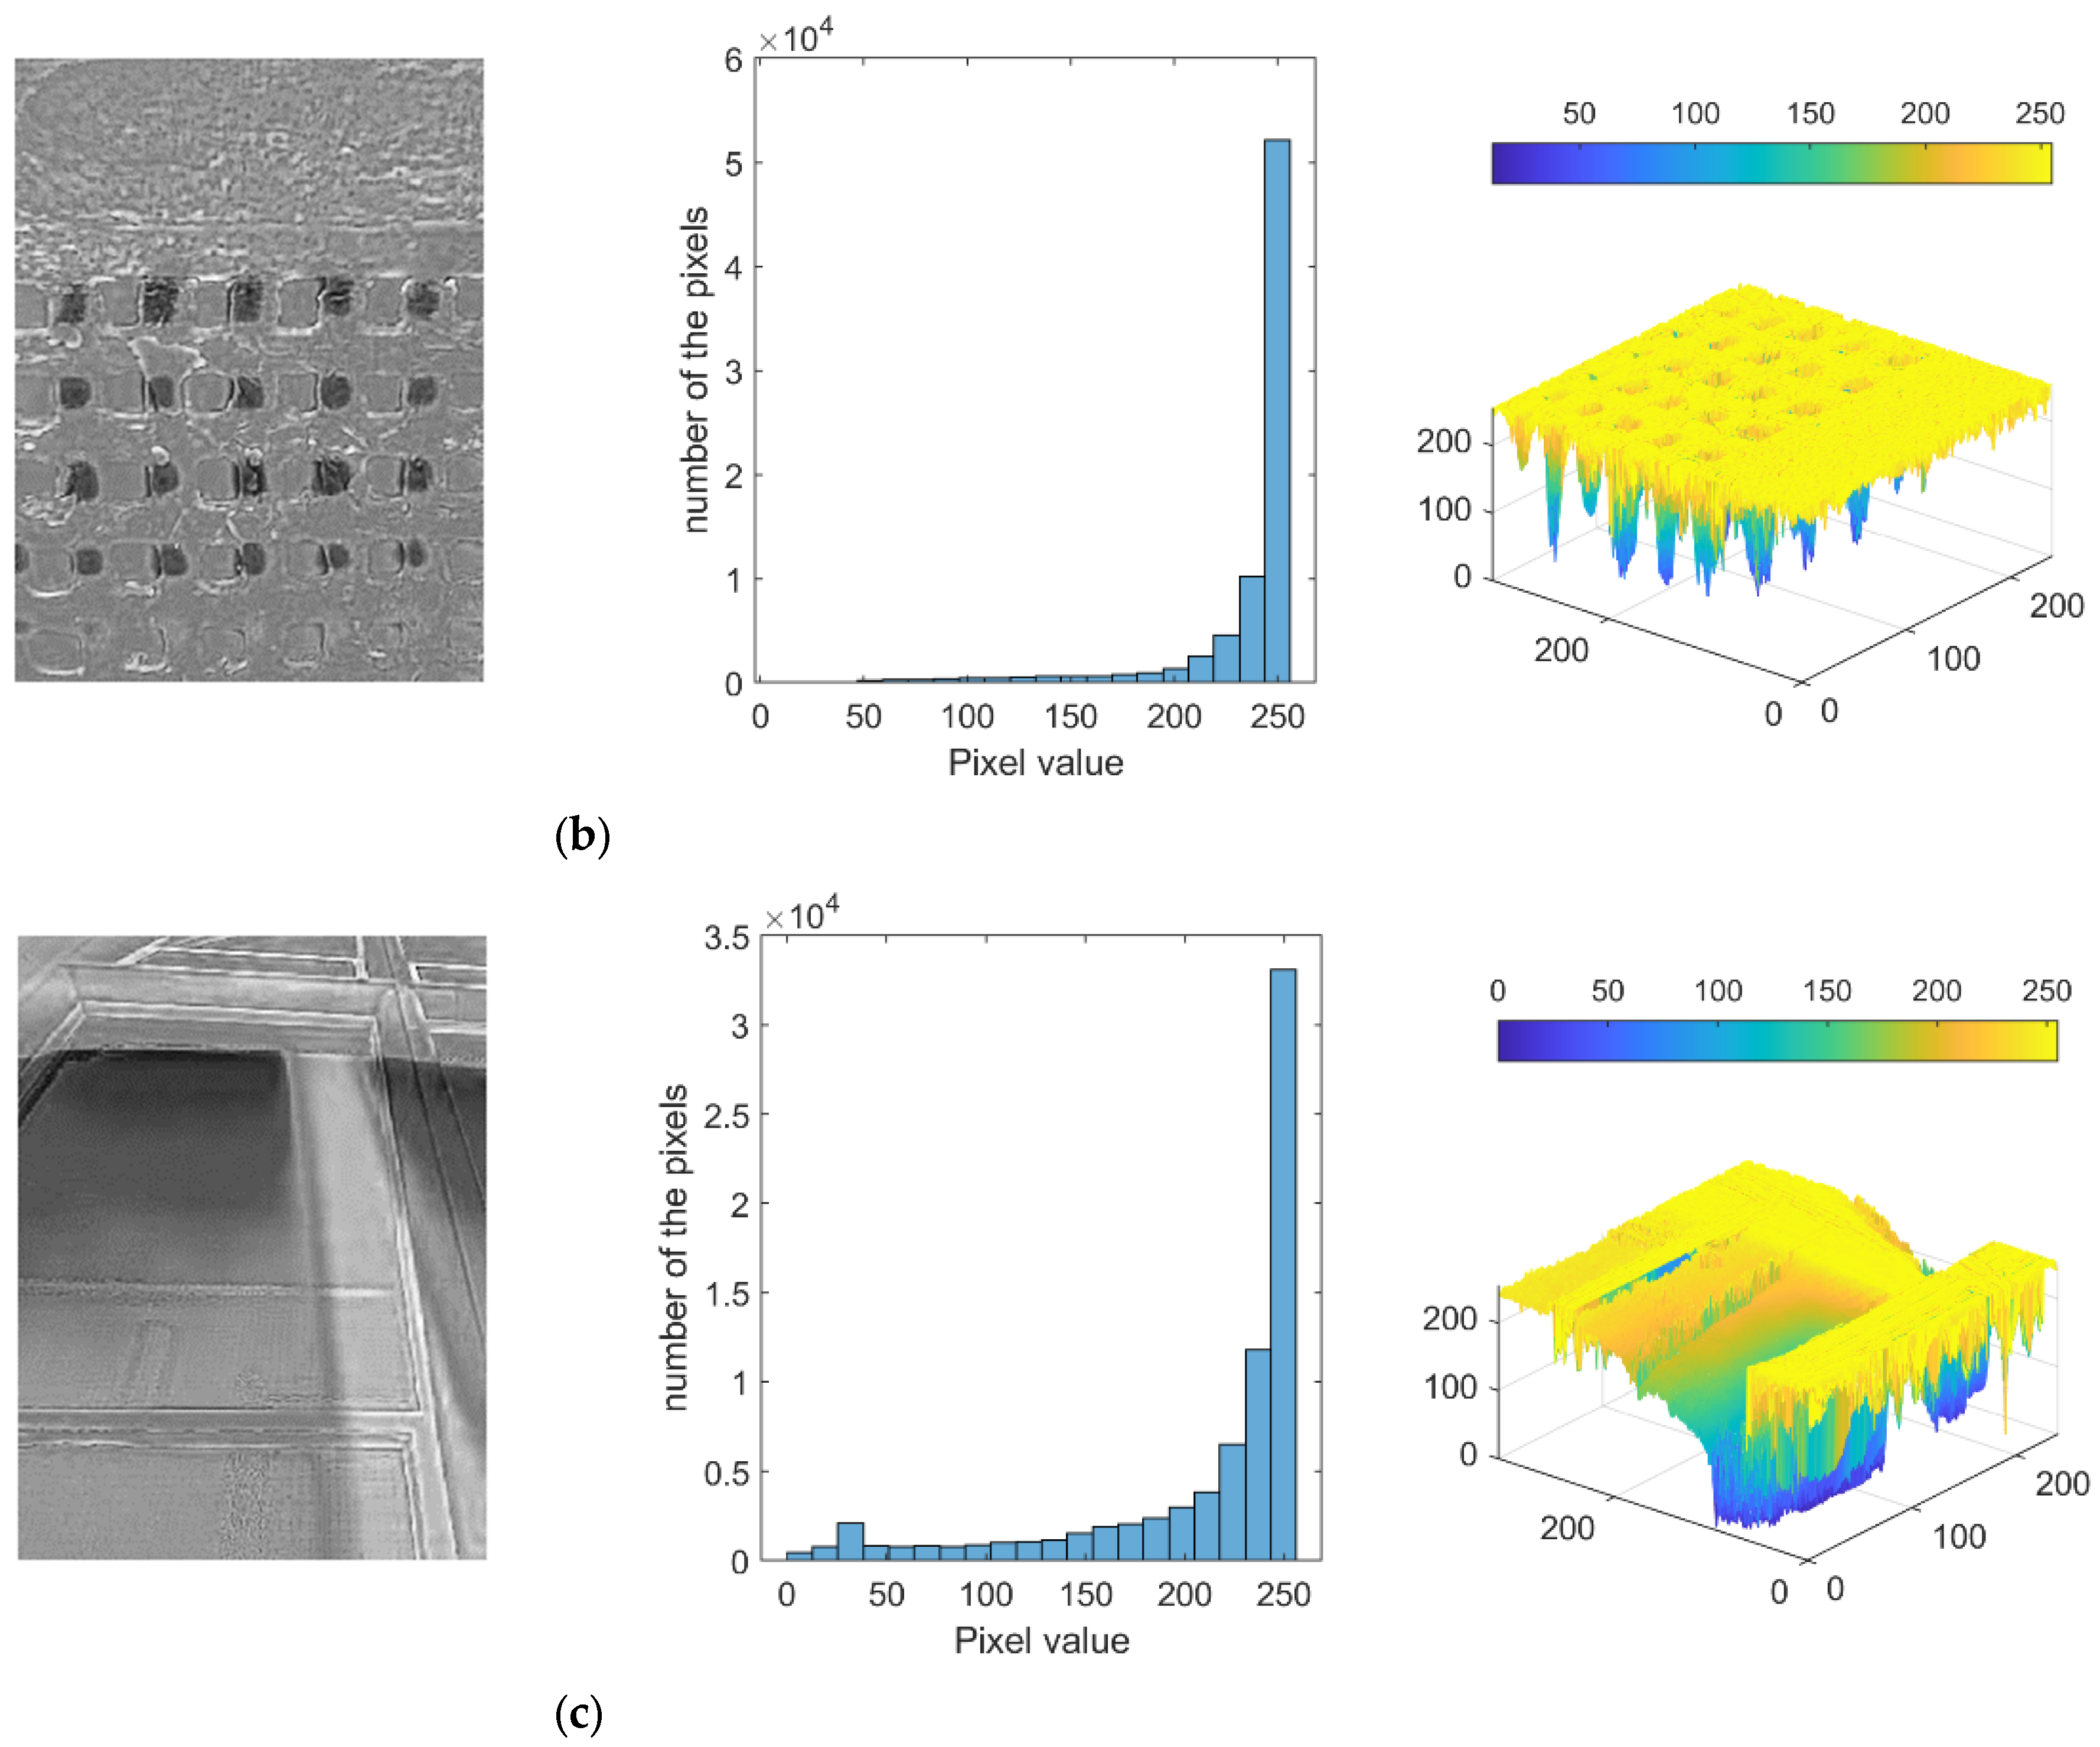
Figure 9 shows the histogram and 3D colour scale distribution of arches, vents, and windows that have similar heat energy distribution features. Unlike the door and artwork histograms, these histograms have a wide distribution of pixels in the histogram by the window or atmospheric temperature. As shown in Figure 9a, when an arch includes a window, the area corresponding to the arch has a high grey channel value, and the part corresponding to the window has a low grey channel value. Because the area of the window is wide in the thermal infrared image, pixels corresponding to a low grey channel appear wide in the distribution histogram. In the three-dimensional colour scale aspect, the shape of the arch is clearly revealed by the temperature difference. As shown in the histogram of the vent’s infrared thermal image, pixels are concentrated in a high grey channel and the greyscale is widely distributed, such as the results of the arch’s histogram. This is because the thermal energy of the atmosphere in the vent hole is measured to be low, so the pixels in this area have low grey channel values. Because the area of the vent hole is smaller than that of the arch window, the number of pixels with low grey channel values in the histogram is small. As shown in the 3D colour scale result, the hole in the vent is clearly visible as a low grey channel value (see Figure 9b). Figure 9c shows the histogram and 3D colour scale distribution of the infrared thermal image of the window. An infrared thermal image of a window shows that the pixels on the frame and walls of the window have a high grey channel, but the greyscale of the window is low. Because the window has a larger area than the window at the arch and the hole of the vent, the number of pixels in the lower greyscale appears to be higher than in other cases. Because the area of low thermal energy in the window is large, the area corresponding to the window can be clearly seen, even on a 3D colour scale. These three categories have a wide range of grey channel values in the histogram result due to the low thermal energy of the window or atmosphere, but they also have a feature in which the distribution of the 3D colour scale is different according to the characteristics of each category.
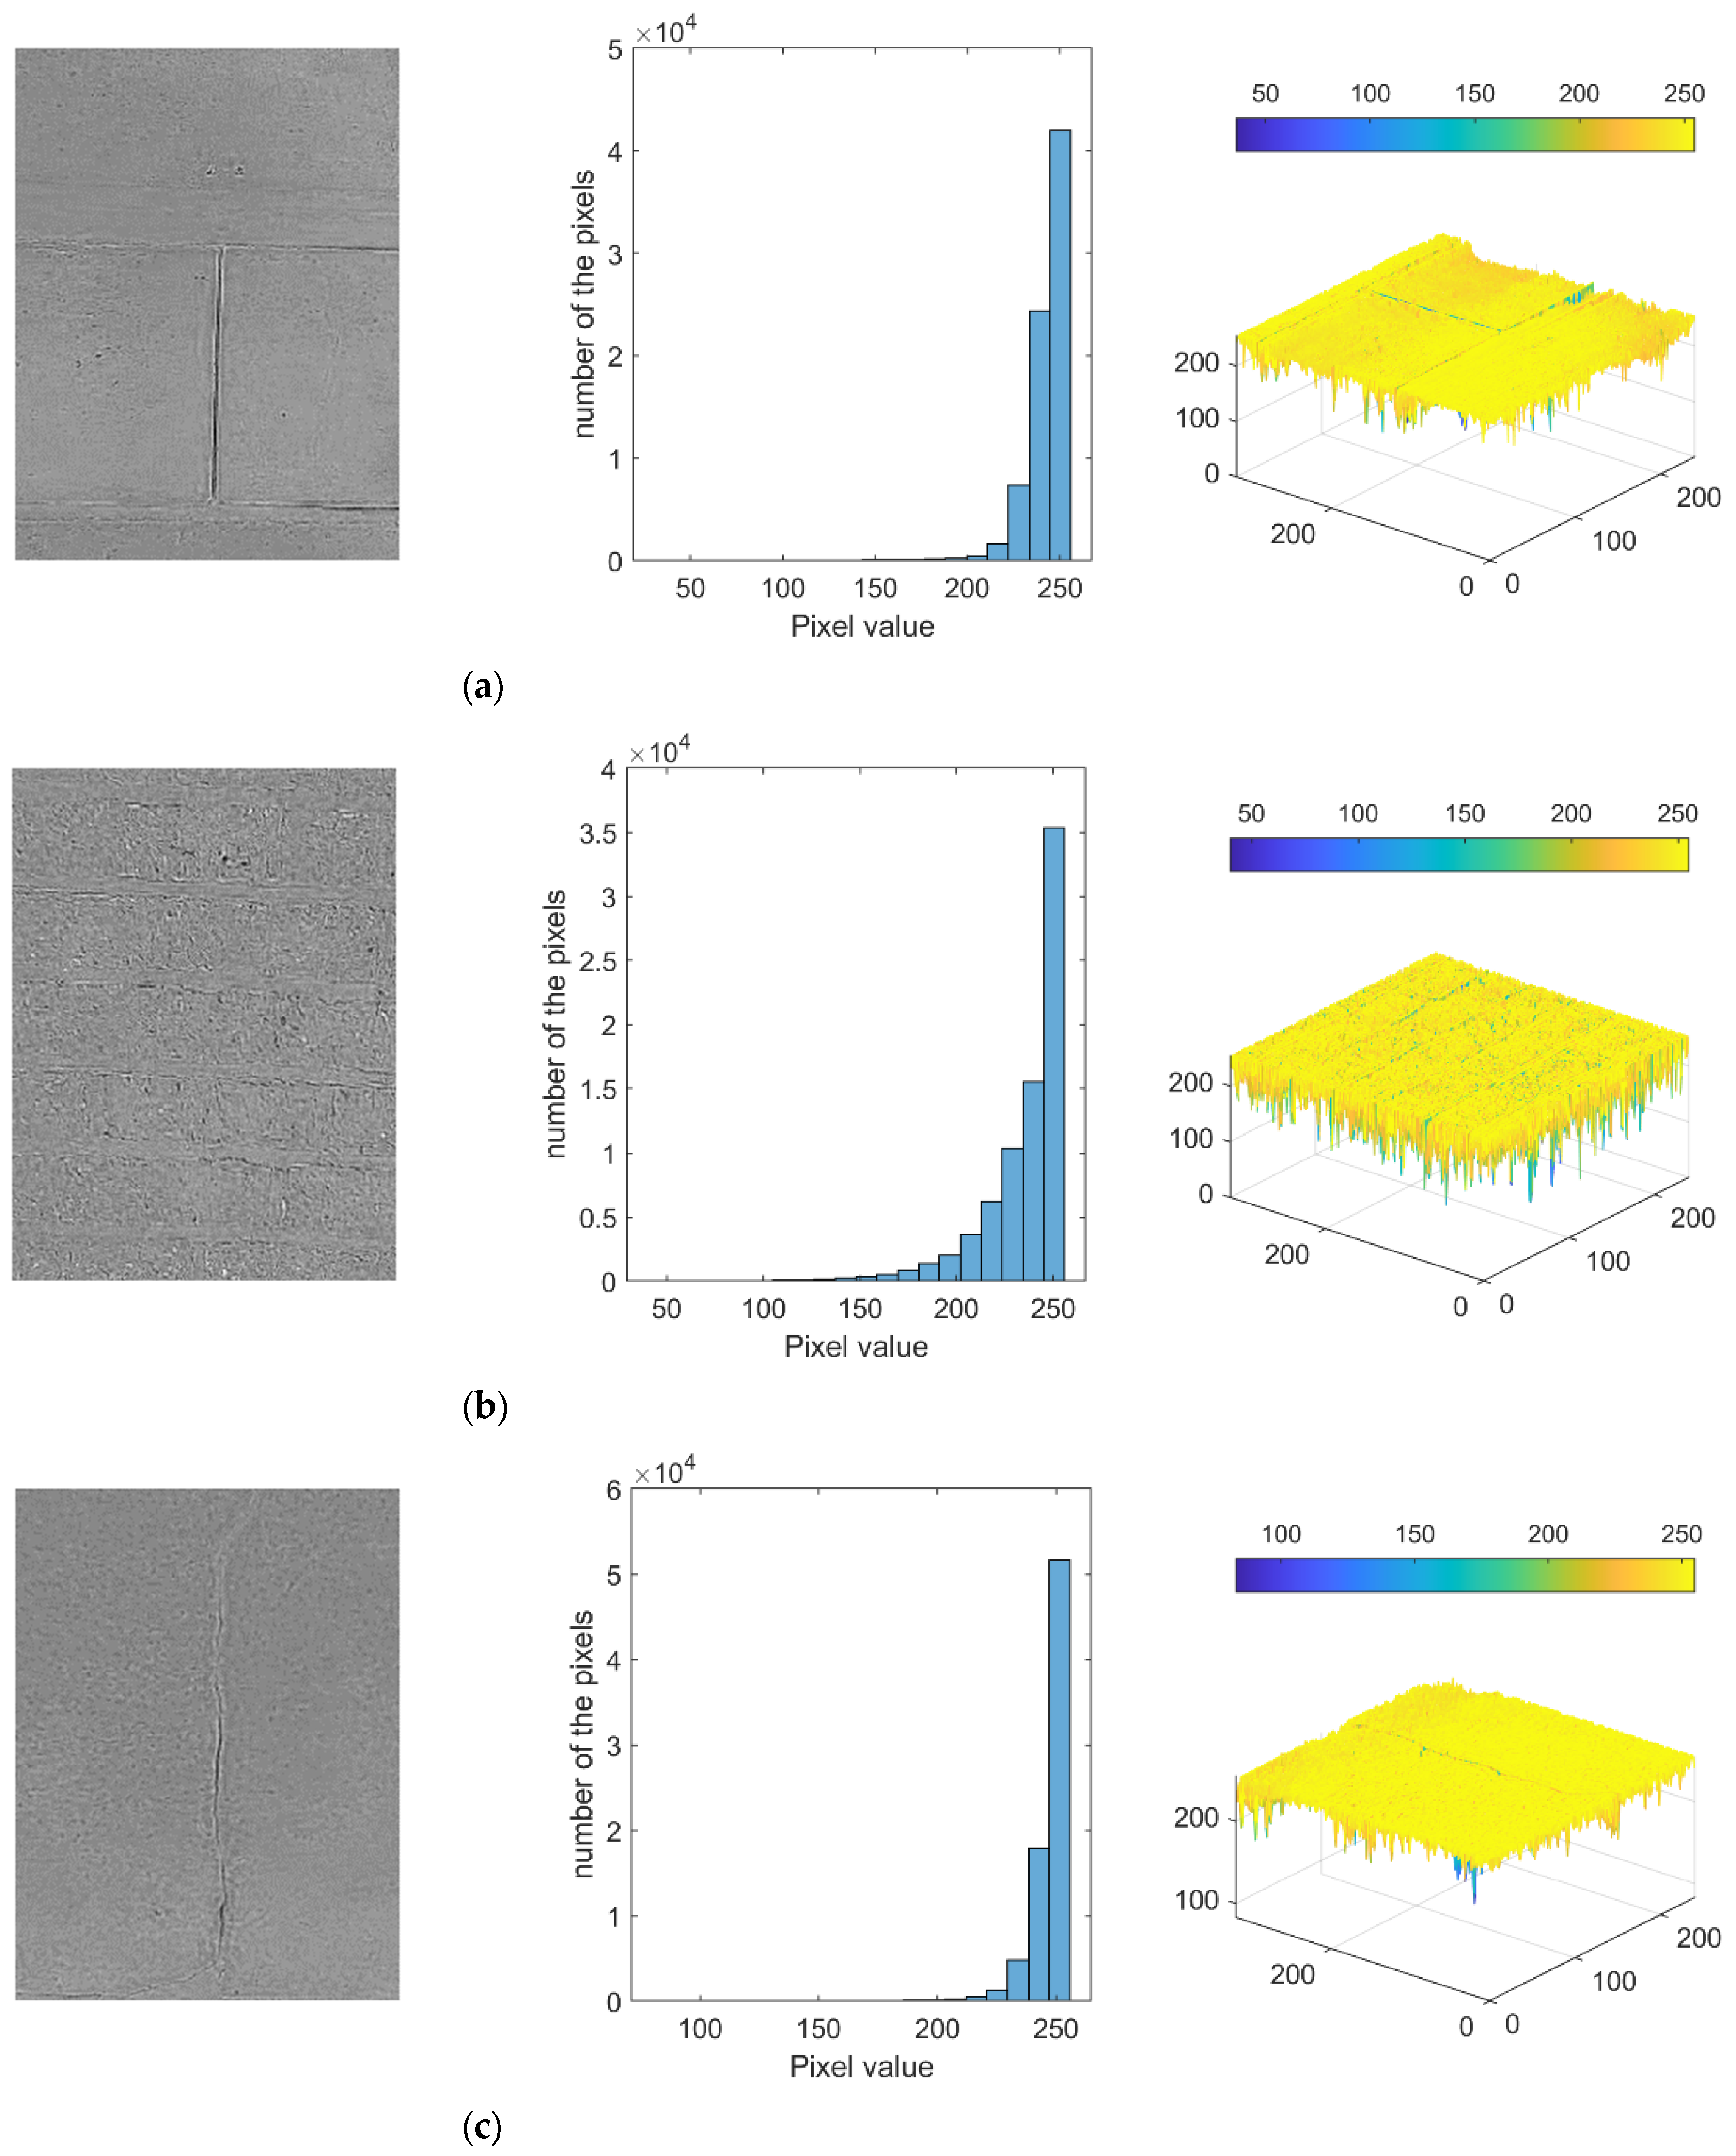
Figure 10 shows the histograms and 3D colour scale results of the stonewall, brick wall, and crack, which have similar thermal image features. Most of the background image in stonewall is occupied in light grey as shown in Figure 10a. Therefore, most of the pixels are concentrated in grey channel values of over 200 as shown in the histogram. In the 3D colour scale distribution, it can be seen that the joints between the stonewalls are rectangular with low grey channel values. A brick wall has a larger area occupied by a joint rather than stonewall within the same image size. Therefore, the distribution of greyscale in the histogram is between 150 and 255, which is more widely distributed than that of stonewall. Because the joints between the brick wall have lower thermal energy than the surface of the brick wall, the three-dimensional colour scale shows the distinction between a brick wall and joints (see Figure 10b). The ultimate purpose of this paper is to detect the cracks that exist in the heritage building. The histogram of cracks closely resembles the histogram distribution of stonewall, as shown in Figure 10c. Most of the pixels representing the wall are distributed in over 200 grey channel values. While the stonewall’s 3D colour scale is rectangular in the crack’s 3D colour scale, pixels with low thermal energy representing cracks represented rough straight lines. The three categories shown in Figure 10 have a similar feature in that a majority of pixels representing the thermal energy of the wall surface are concentrated to the higher greyscale channel in the histogram, but the shape is different in the 3D colour scale results.

4.2. CNN Algorithm

In this paper, image labelling is performed for the training and testing of the CNN algorithm. To achieve more precision and a sharper image, one category, i.e., door, was broken down into its component pieces using a certain scale. All the images were taken from an approximate 1 m distance from the target category and a 32 × 24 scale was adopted for all images. The scale was a key component to ensuring that the images were not placed in the incorrect category, for example, there is artwork alongside the doors and windows, and there are cracks in the brickwork. Thus, the data were collected with the utmost care in the proper scale to avoid misclassification. Rainy days were avoided as much as possible during the data collection process in order to improve the quality of the images. When it comes to deep learning, one of the most important tasks to conduct during the pre-processing of data before developing a deep-learning model is to scale the features being used. Scaling might be the deciding factor in determining whether a deep-learning model is weak or strong. In this case, because the photographs were initially captured at random, the images did not perform very well because they comprised elements from more than one category. This could cause complications in the processing of data in the future. Therefore, it is essential to choose an appropriate scale before taking the photographs in order to accomplish the goal of producing correct results. To make an accurate forecast, each image belonging to a category was cut up into small portions while considering the fact that no other category was included in the image.
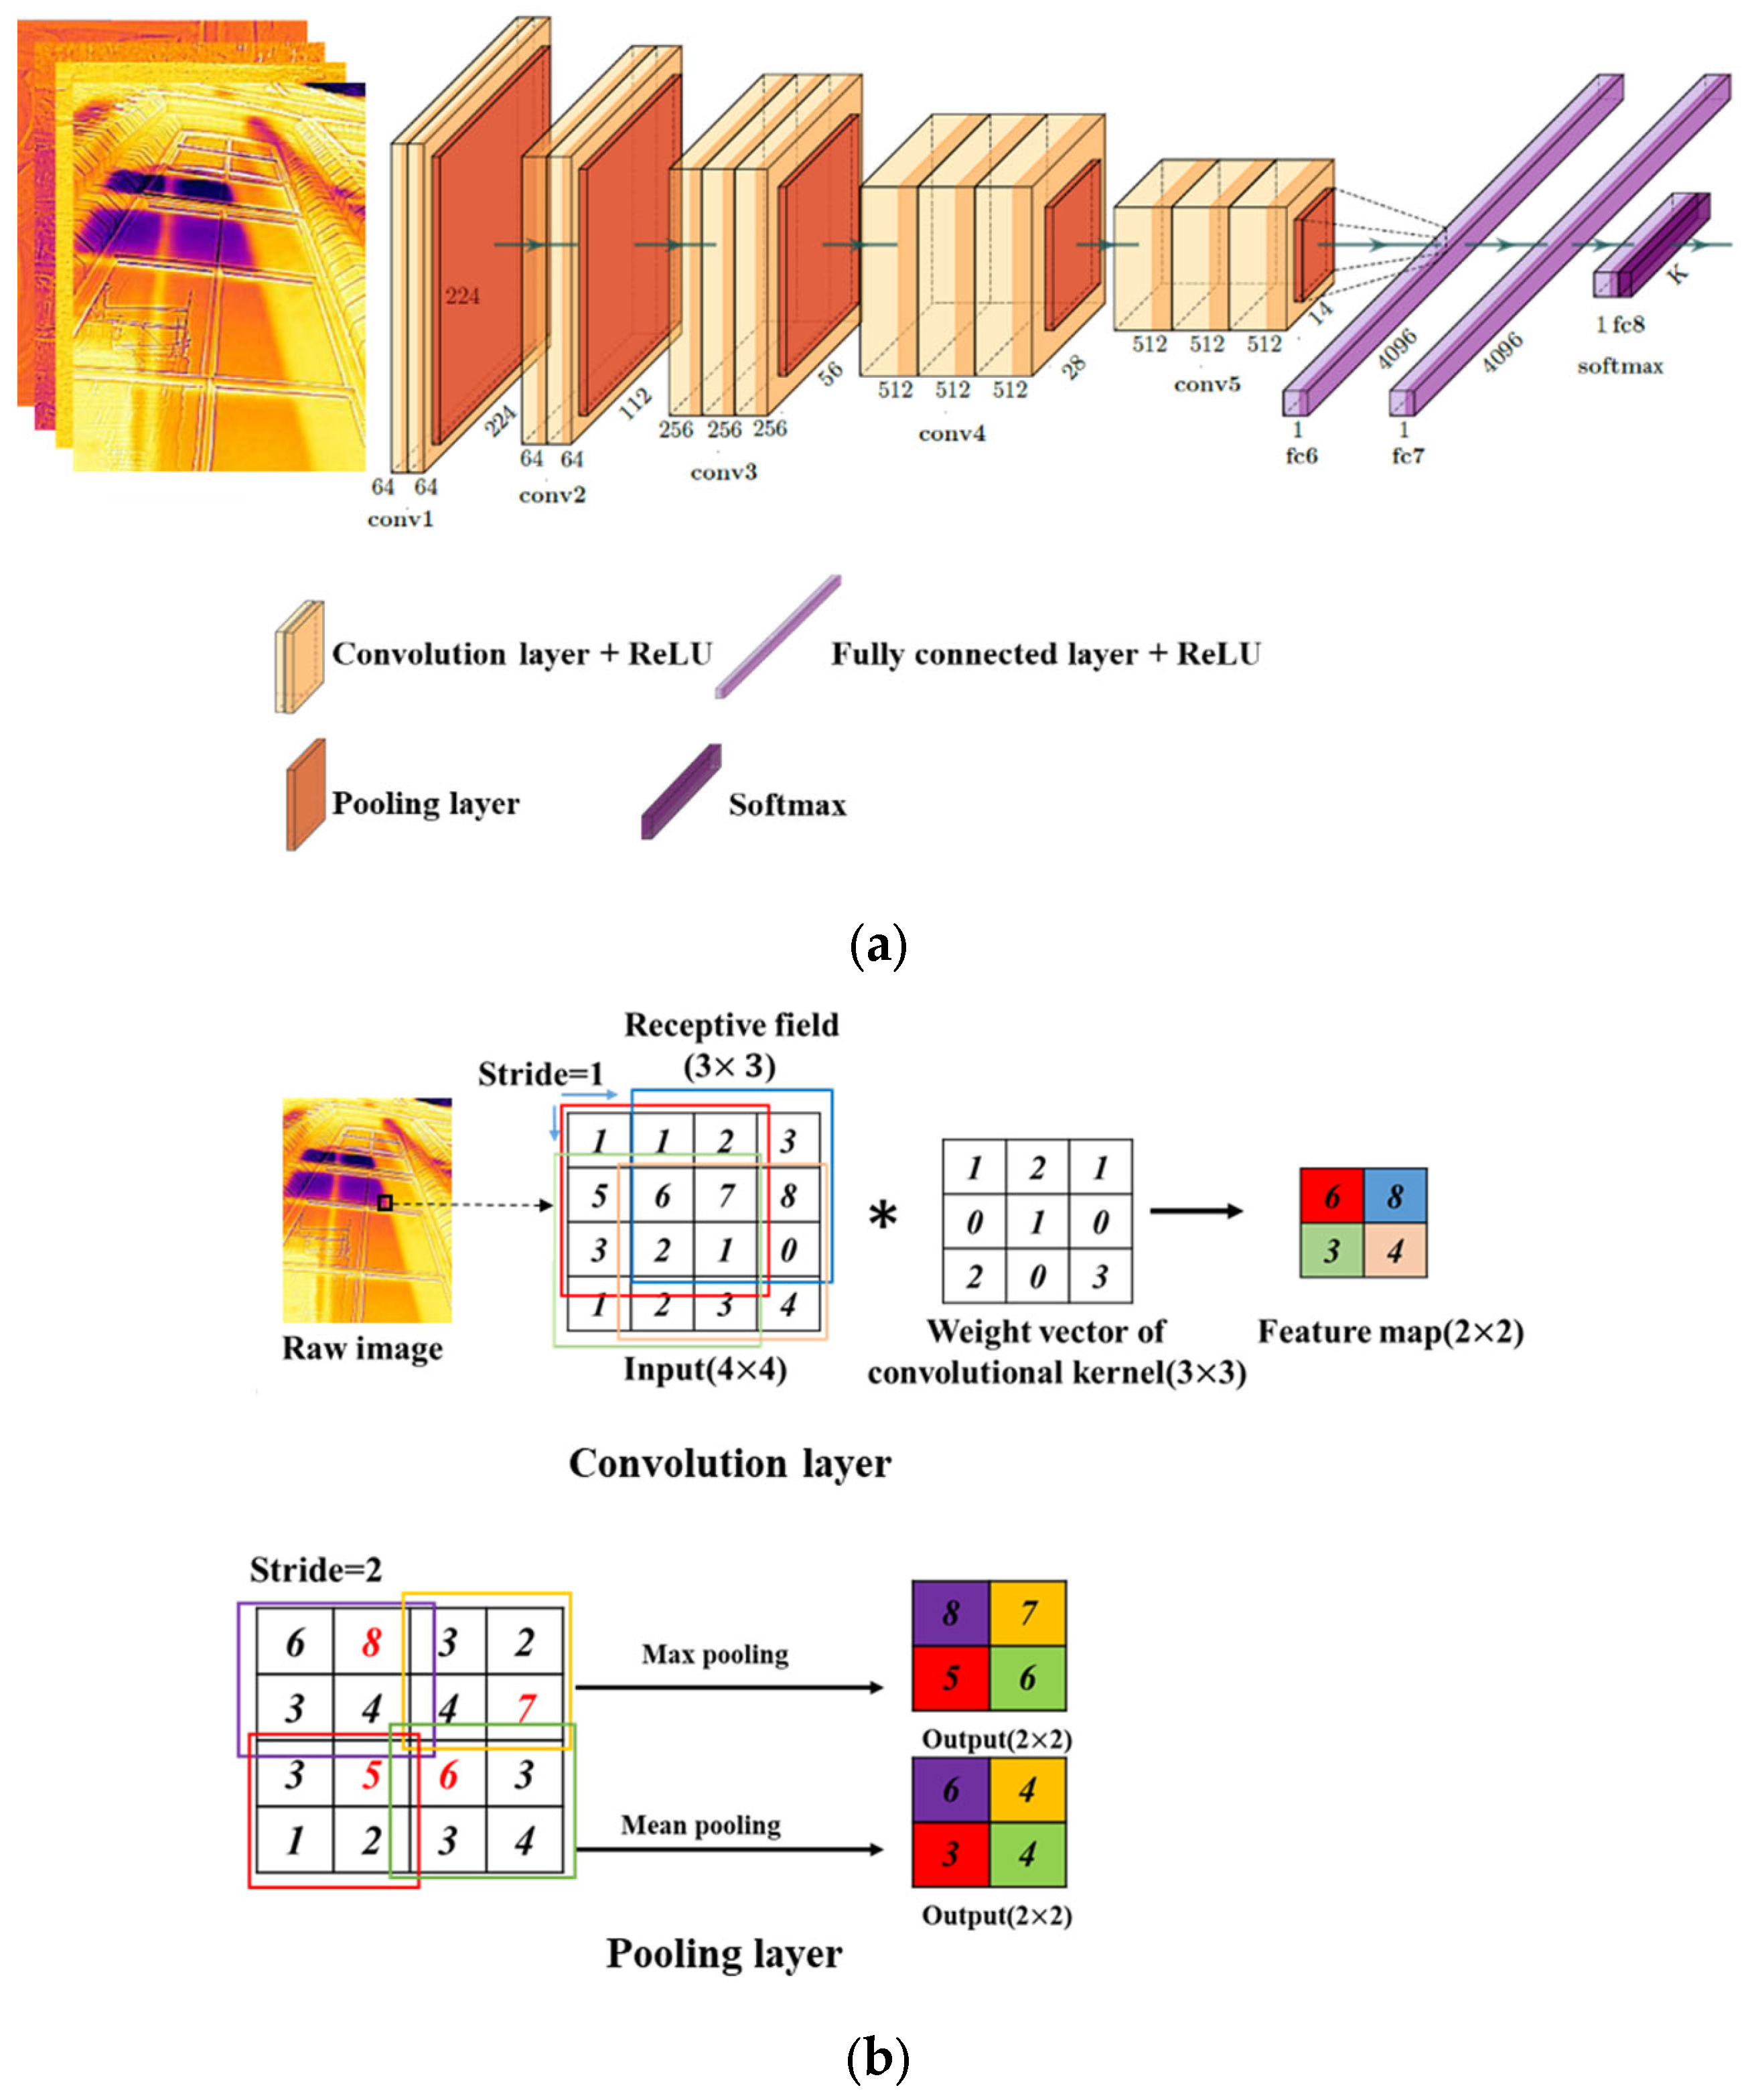
In this paper, a convolutional neural network (CNN) is used to automatically classify multi-class-labelled thermal infrared images. In the CNN algorithm, the hidden layers include convolution layers, ReLU layers, pooling layers, and a fully connected neural network. Furthermore, a fully connected neural network is also included in this category. It is essential to understand that artificial neural networks, also known as ANNs, which are made up of several neurons, are unable to extract features from images. At this point, a combination of a convolutional layer and a pooling layer become active in the model. In a similar manner, classification cannot be accomplished by the convolution or pooling layers of a neural network; hence, such a network must be fully connected.
The CNN algorithm in this study is mainly focused on image processing. Convolutional neural networks consist of several layers. These layers include an input layer, a convolution action layer, a fully connected layer, and an output layer. The input layer comprises the collection of input units. It is a conduit by which the learning-related image pixels are sent into the system. The size of an image can be affected by the number of pixels it contains (see Figure 11a). The convolutional layer comprises a wide variety of convolution filters. Following nonlinear transfer, the values that were determined by the convolutional layer are given to the subsequent layer. In the pooling layer, the dimensions of the data are averaged out to obtain lower dimensionality (see Figure 11b). A convolutional layer is the main building block of a CNN. It contains a set of filters (or kernels), the parameters of which are to be learned throughout training. The size of the filters is usually smaller than the actual image. Each filter convolves with the image and creates an activation map [40]. The purpose of the pooling layers is to reduce the dimensions of the hidden layer by combining the outputs of neuron clusters at the previous layer into a single neuron in the next layer [41]. To avoid over- or underfitting, many fully linked layers may be placed on top of one another. The output layer is then trained to score each class, and the estimated model is typically employed.
In order to enable automatic damage detection and categorisation, the system is required to be trained using sample patterns contained inside each image. This training allowed the system to accurately predict the category or discover the pattern contained within new photographs. As a direct consequence of this, the original batch of 2400 images required further processing so that training shots and test images could be extracted. In order for the algorithm to make good predictions, it needed to be trained on a wide variety of patterns that were contained within the photographs. There must be a distinct divide between the training data and the test data. This is because the accuracy of the prediction is negatively impacted if the algorithm has previously seen the test photographs while it was in the training phase. On the other hand, a smaller data set would lead to training that is underfitted to the data and would not provide enough information for successful prediction. As a result, about 80% of the entire data set is utilised for the purposes of training, while the remaining 20% is utilised for the purposes of actual evaluation.

5. Results and Discussion of CNN Analysis

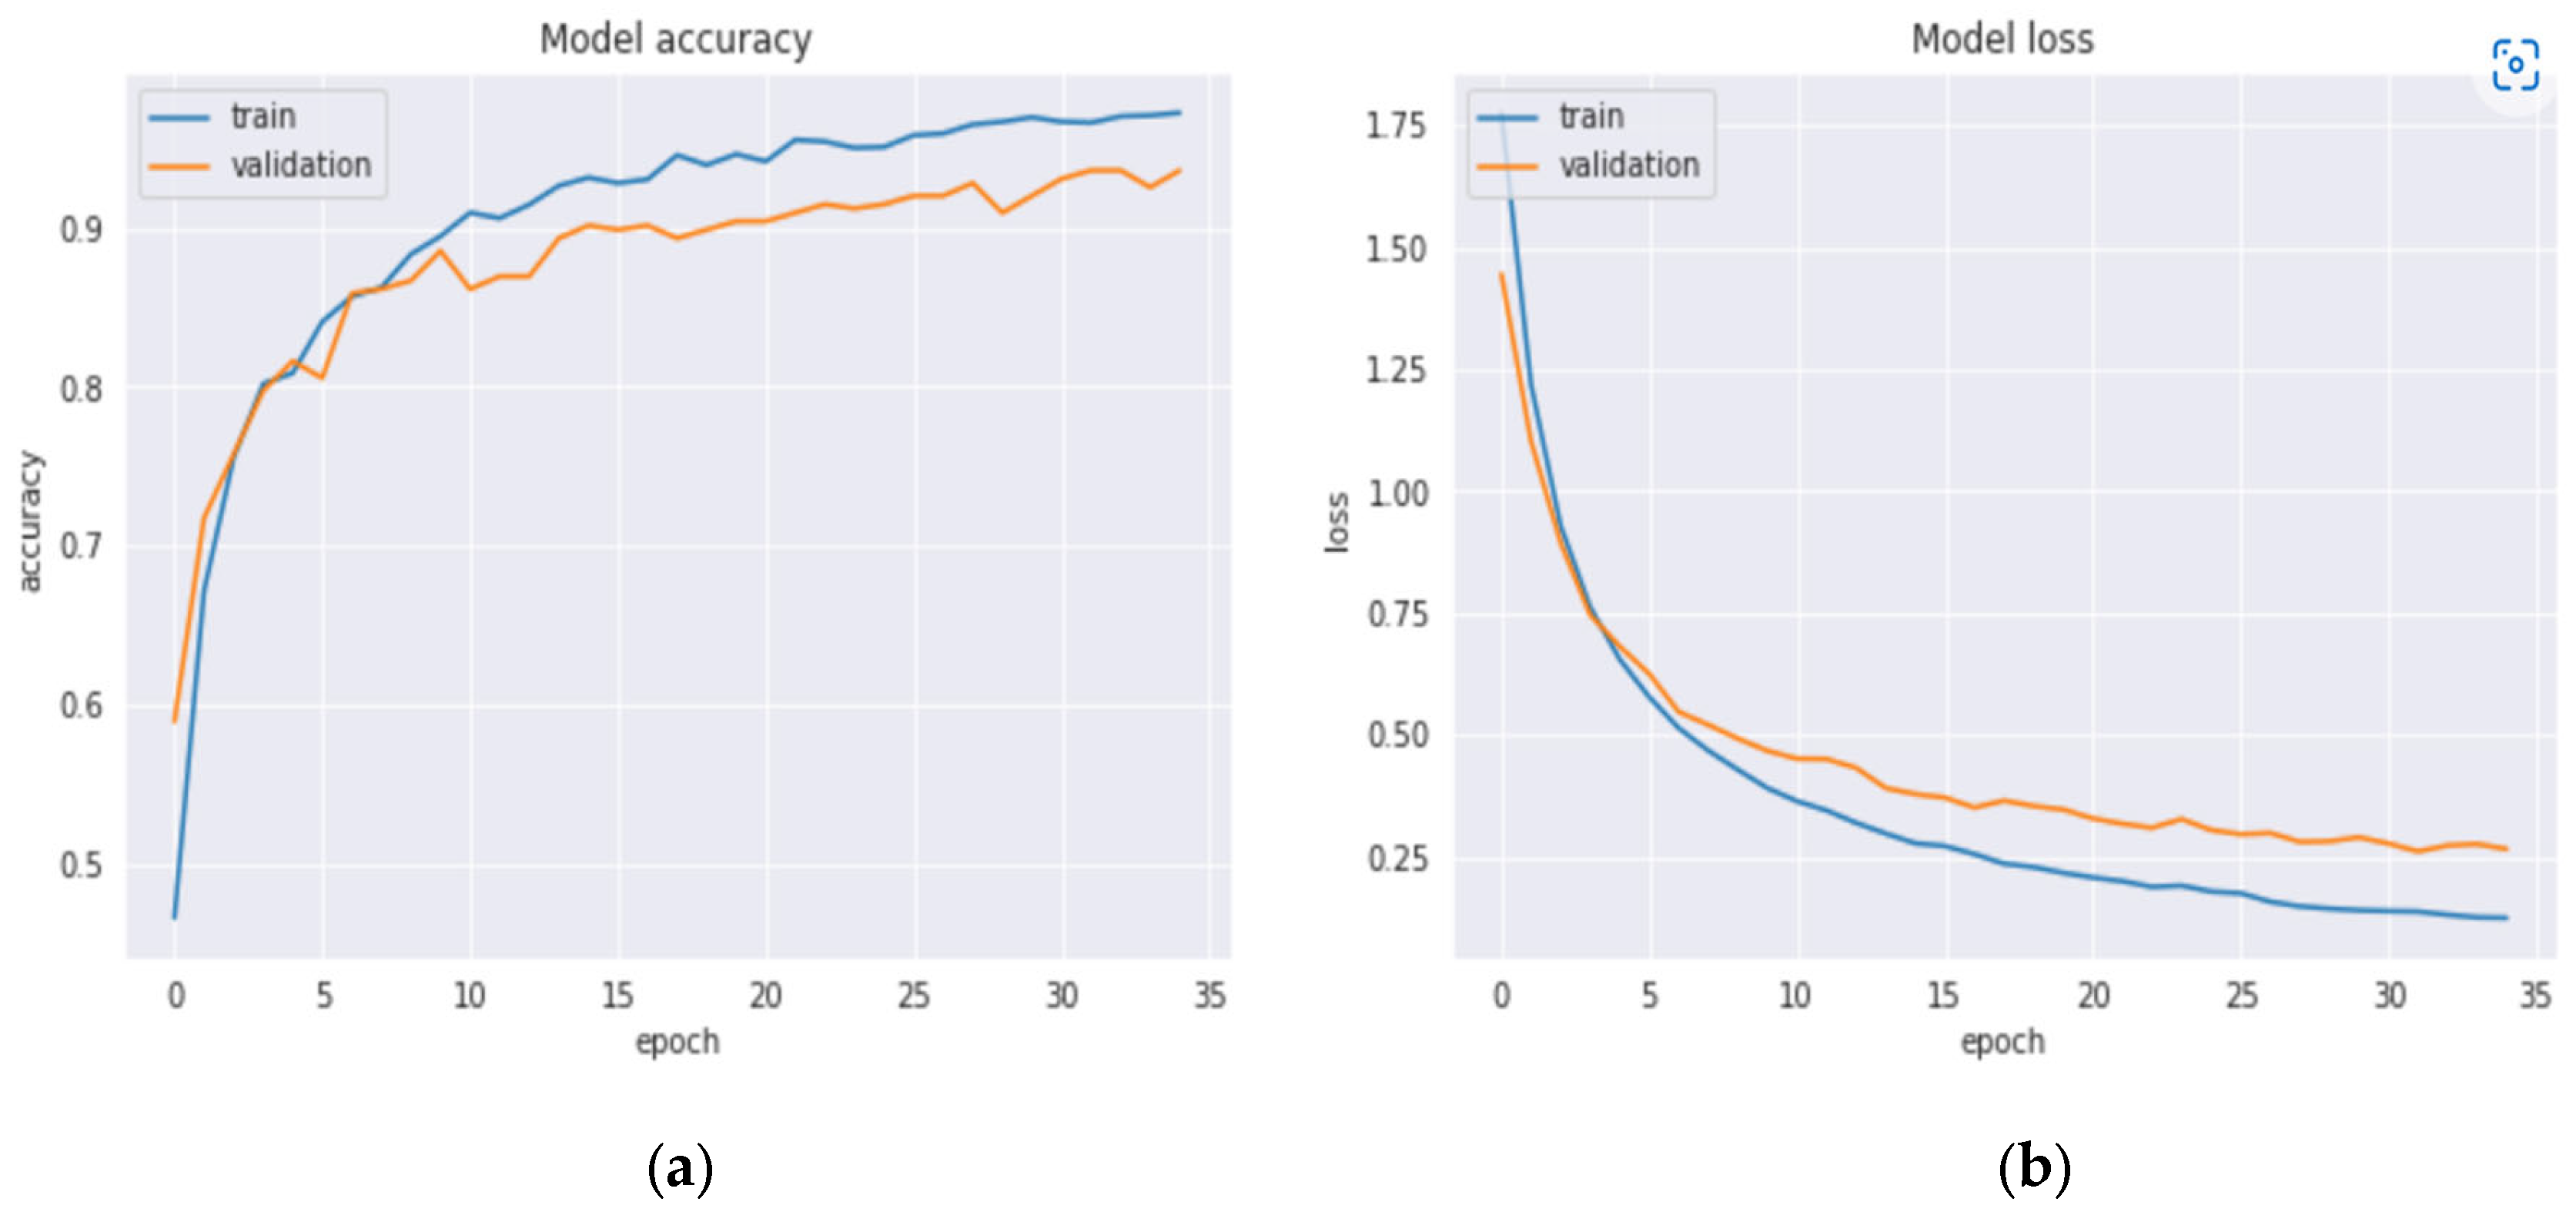
In the beginning stages of learning, while we were in the first epoch, the accuracy was less than 70%. As the training continued with new data, it became increasingly accurate in its predictions of the photos. As a result, it demonstrated a rising profile of accuracy as the training continued, while simultaneously displaying a decreasing profile of loss. Due to the fact that infrared thermal images lack pixel resolution and colour separation as a result of the surface temperature, the program had a tough time correctly classifying the images. The forecast became more accurate with each successive epoch through iterative training. Infrared thermal images had a less clear and crisp pixel separation at the edges because the pixel colour difference depends on the temperature of the surface.
As a direct result of this, the fluctuation in pixel value was gradual and in accordance with the temperature profile. As a direct consequence of this, the capacity of algorithm to extract features from images gradually decreased, and accuracy levels of less than 90% were attainable. The accuracy index was 0.3 during the initial epoch, but it went on to reach 0.93 in the following epochs. The loss index exhibits a curve that gradually descends to a lower value with each successive epoch. After the completion of the most recent period, the total loss amounted to 0.27. The accuracy score for the whole analysis came in at 93.56% (see Figure 12).
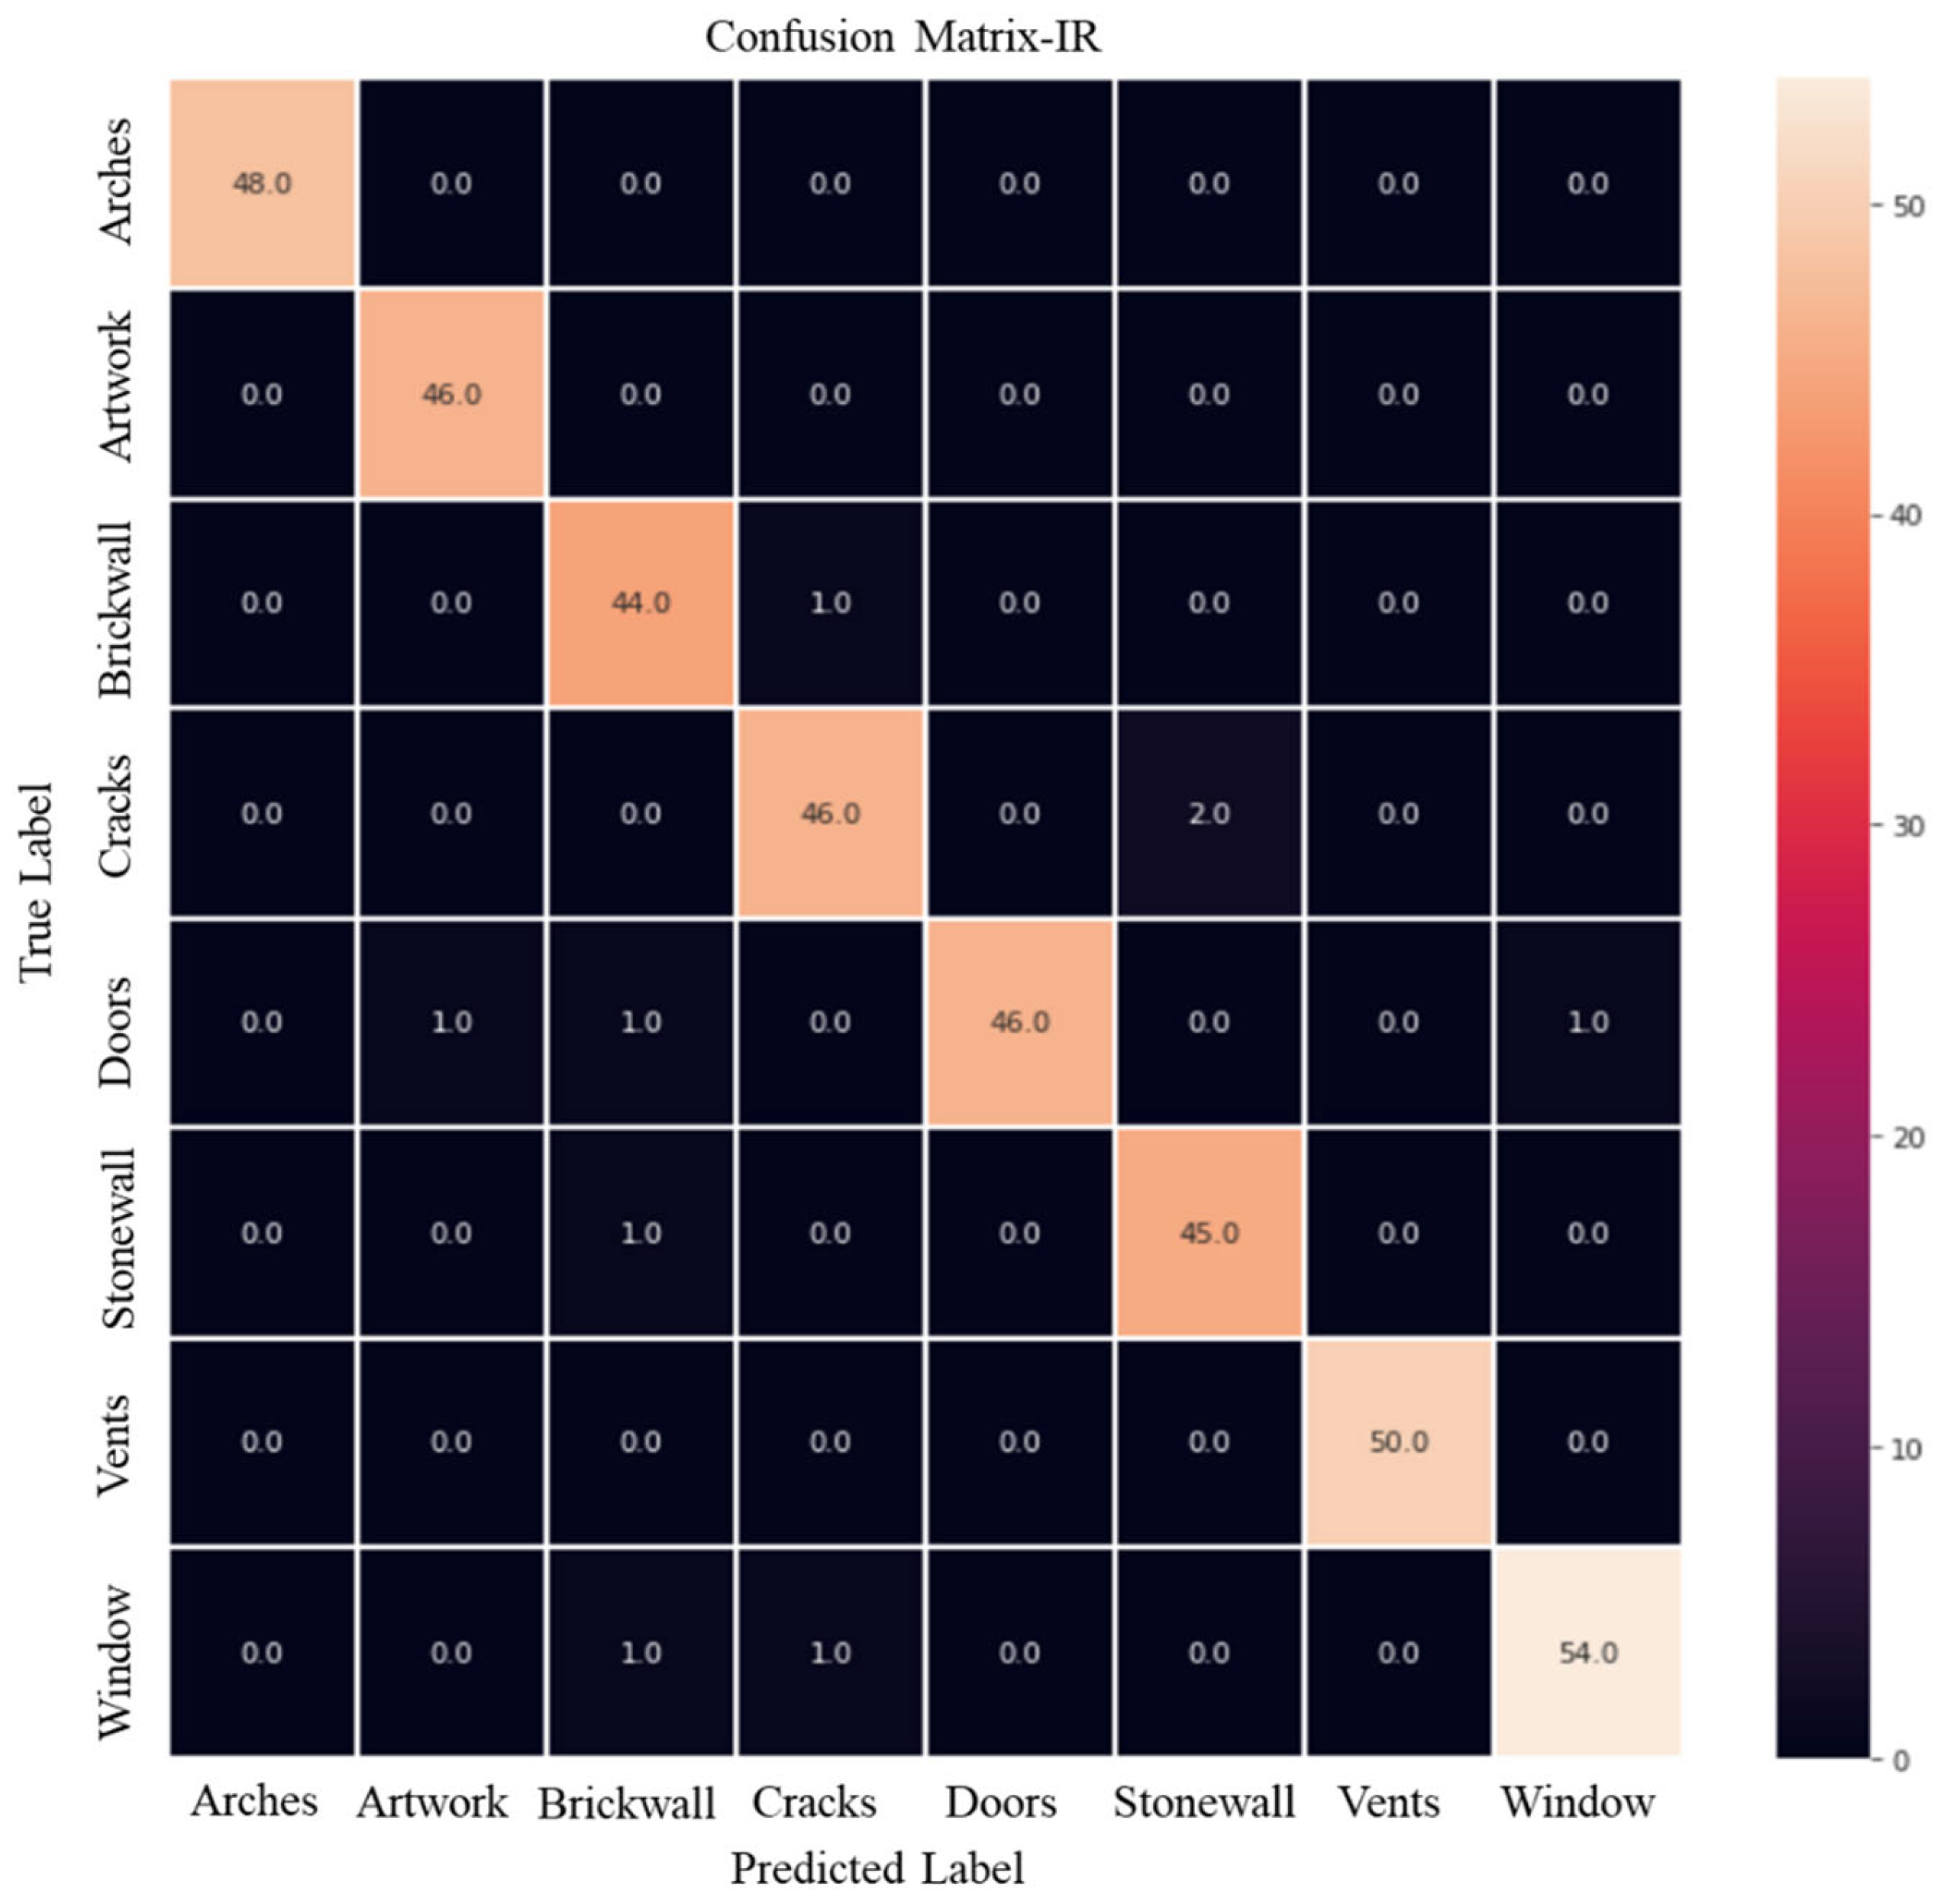
The evaluation data of accuracy and losses give the overall effectiveness of the model. In this paper, a confusion matrix is used to define the performance of a CNN classification algorithm that can visualize and summarize the performance of a classification algorithm. The confusion matrix shows which features of the categories are classified more accurately and highlights those that were challenging to classify based on the projected values and actual values. Additionally, a comparative study can be performed by comparing the matrices of two different image types to determine which feature of the category is predicted more accurately in each type of image. A confusion matrix gives insight to the number of images that are accurately predicted by the system and the misclassified images by each category.
Figure 13 shows the result of the confusion matrix when the categories of thermal infrared images are classified by the CNN algorithm. In arches, artworks, and vents, all thermal infrared images were correctly classified. As analysed in Figure 8, the door is misclassified as artwork and a brick wall shows a similar histogram pattern. It also misclassified the window due to the similar energy pattern shape in the 3D colour scale. The brick wall had an error because it was misclassified as a crack image due to the similar pattern of the histogram as analysed in Figure 10. Stonewall resulted in misclassification as a brick wall, because of the similarity in histogram and 3D colour scale in Figure 10. The window was misclassified as a brick wall and crack due to its rectangular shape. Cracks also showed high classification accuracy, but resulted in misclassification as stonewall, which had a similar pattern to the histogram in Figure 10.
In order to evaluate the performance of the proposed method against the most advanced methods, performance analysis in terms of precision, recall, accuracy, and F measure for each classifier was performed. These indicators are based on the true positive (TP) which represents the correct decision of the classifier when a positive sample is detected; true negative (TN) which represents the correct decision of the classifier in the presence of negative samples; false positive (FP) which is the negative sample marked as positive; and false negative (FN) which occurs when a positive sample is rejected by the classifier [42]. Precision is the expected probability that a randomly selected sample from a pool of samples drawn is relevant, and recall is the expected probability that a randomly selected sample from a pool of relevant samples will be retrieved [43]. Precision can be calculated as shown in Equation (1).
Precision = TP TP + FP
Recall provides a measure of a classifier’s ability to recover the maximum number of relevant samples and it can be calculated as follows:
Recall = TP TP + FN
The accuracy measure yields an evaluation of the accuracy of the classifier by calculating the ratio between the true (positive and negative) results and the total number of checked samples. It is calculated as follows.
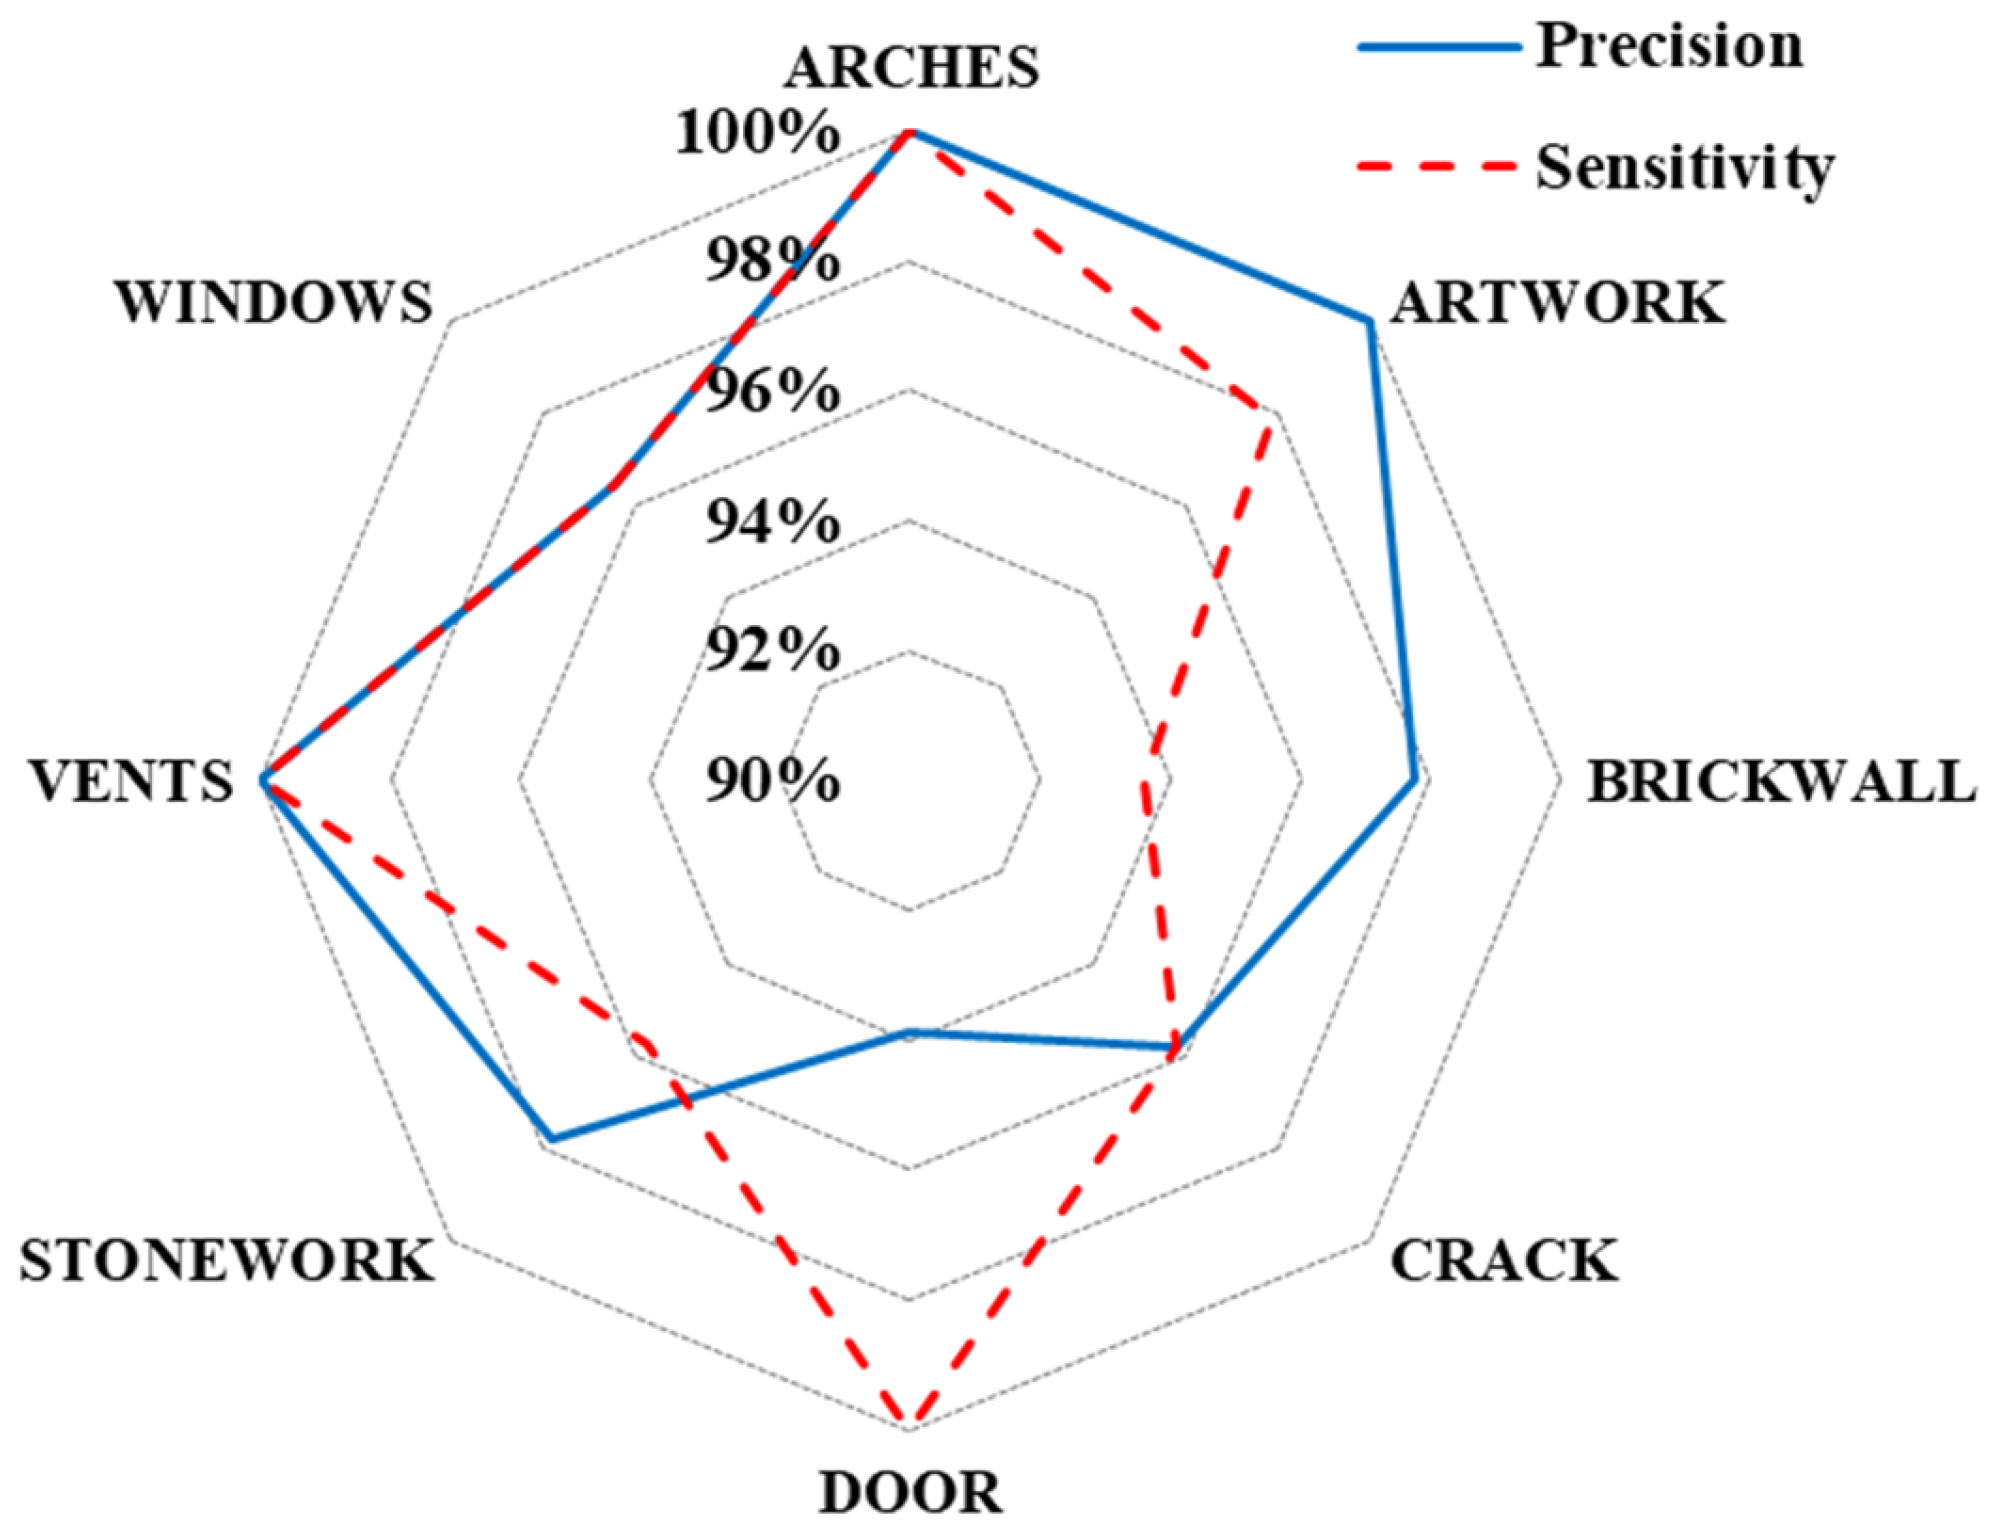
Accuracy measures yield an evaluation of the accuracy of a classifier by calculating the ratio between the true positive and negative results and the total number of samples identified. Accuracy can be calculated as shown in Equation (3), and the calculated results are show in Figure 14.
Accuracy = TP + TN TP + FP + TN + FN
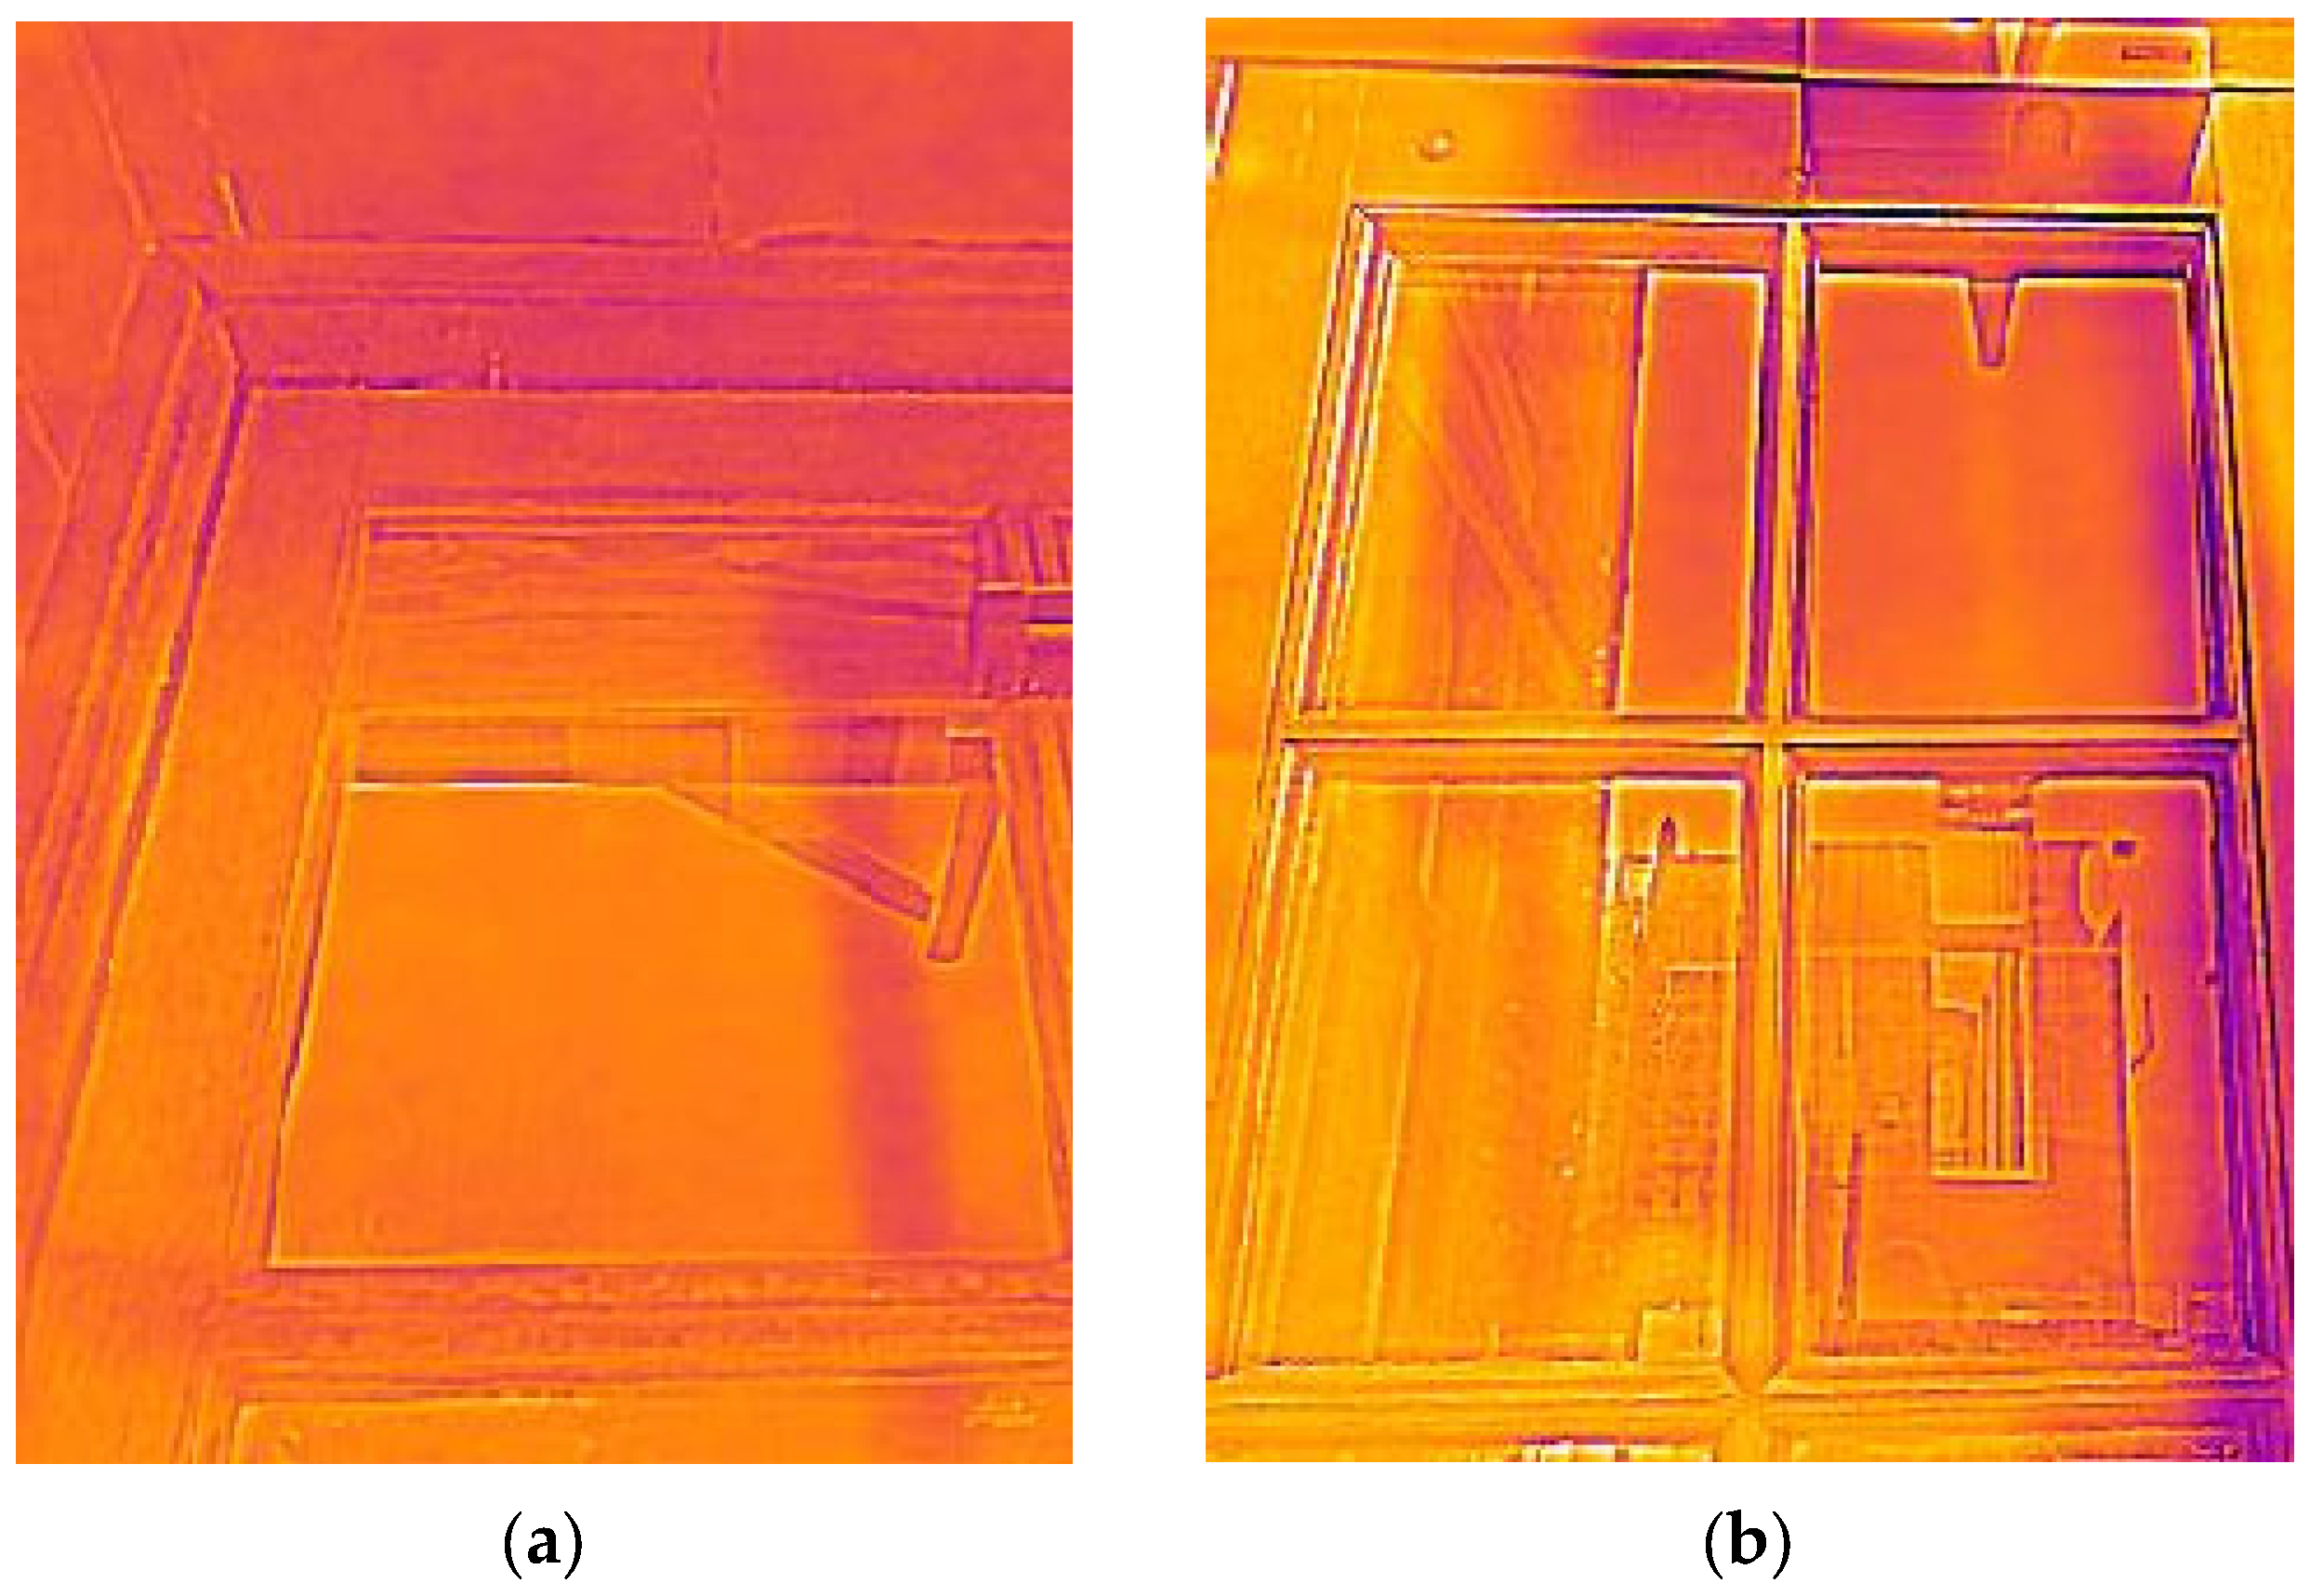
In this paper, misclassified images are analysed in order to understand the causes of the misclassification of infrared thermal images in detail. This paper defined the causes of misclassification as the following two causes: misclassification by multiple objects and misclassification by the perception of the CNN algorithm. Misclassification by multiple objects can occur due to the functional limitations of the applied CNN algorithm, and a detailed example is shown in Figure 15. Figure 15a misclassifies a crack as stonewall, and a crack exists in stonewall. Figure 15b misclassifies a door as artwork, and both a door and artwork exist in one image. Figure 15c is an example of misclassifying a window as a brick wall, and a window and a brick wall exist together in one image. Therefore, when two categories exist together in one image, the CNN algorithm functionally selects and classifies one category. This is a limitation when classifying cracks and other objects in heritage buildings using the CNN algorithm. Therefore, it can be confirmed that the accuracy can inevitably be lowered when objects exist in one image.
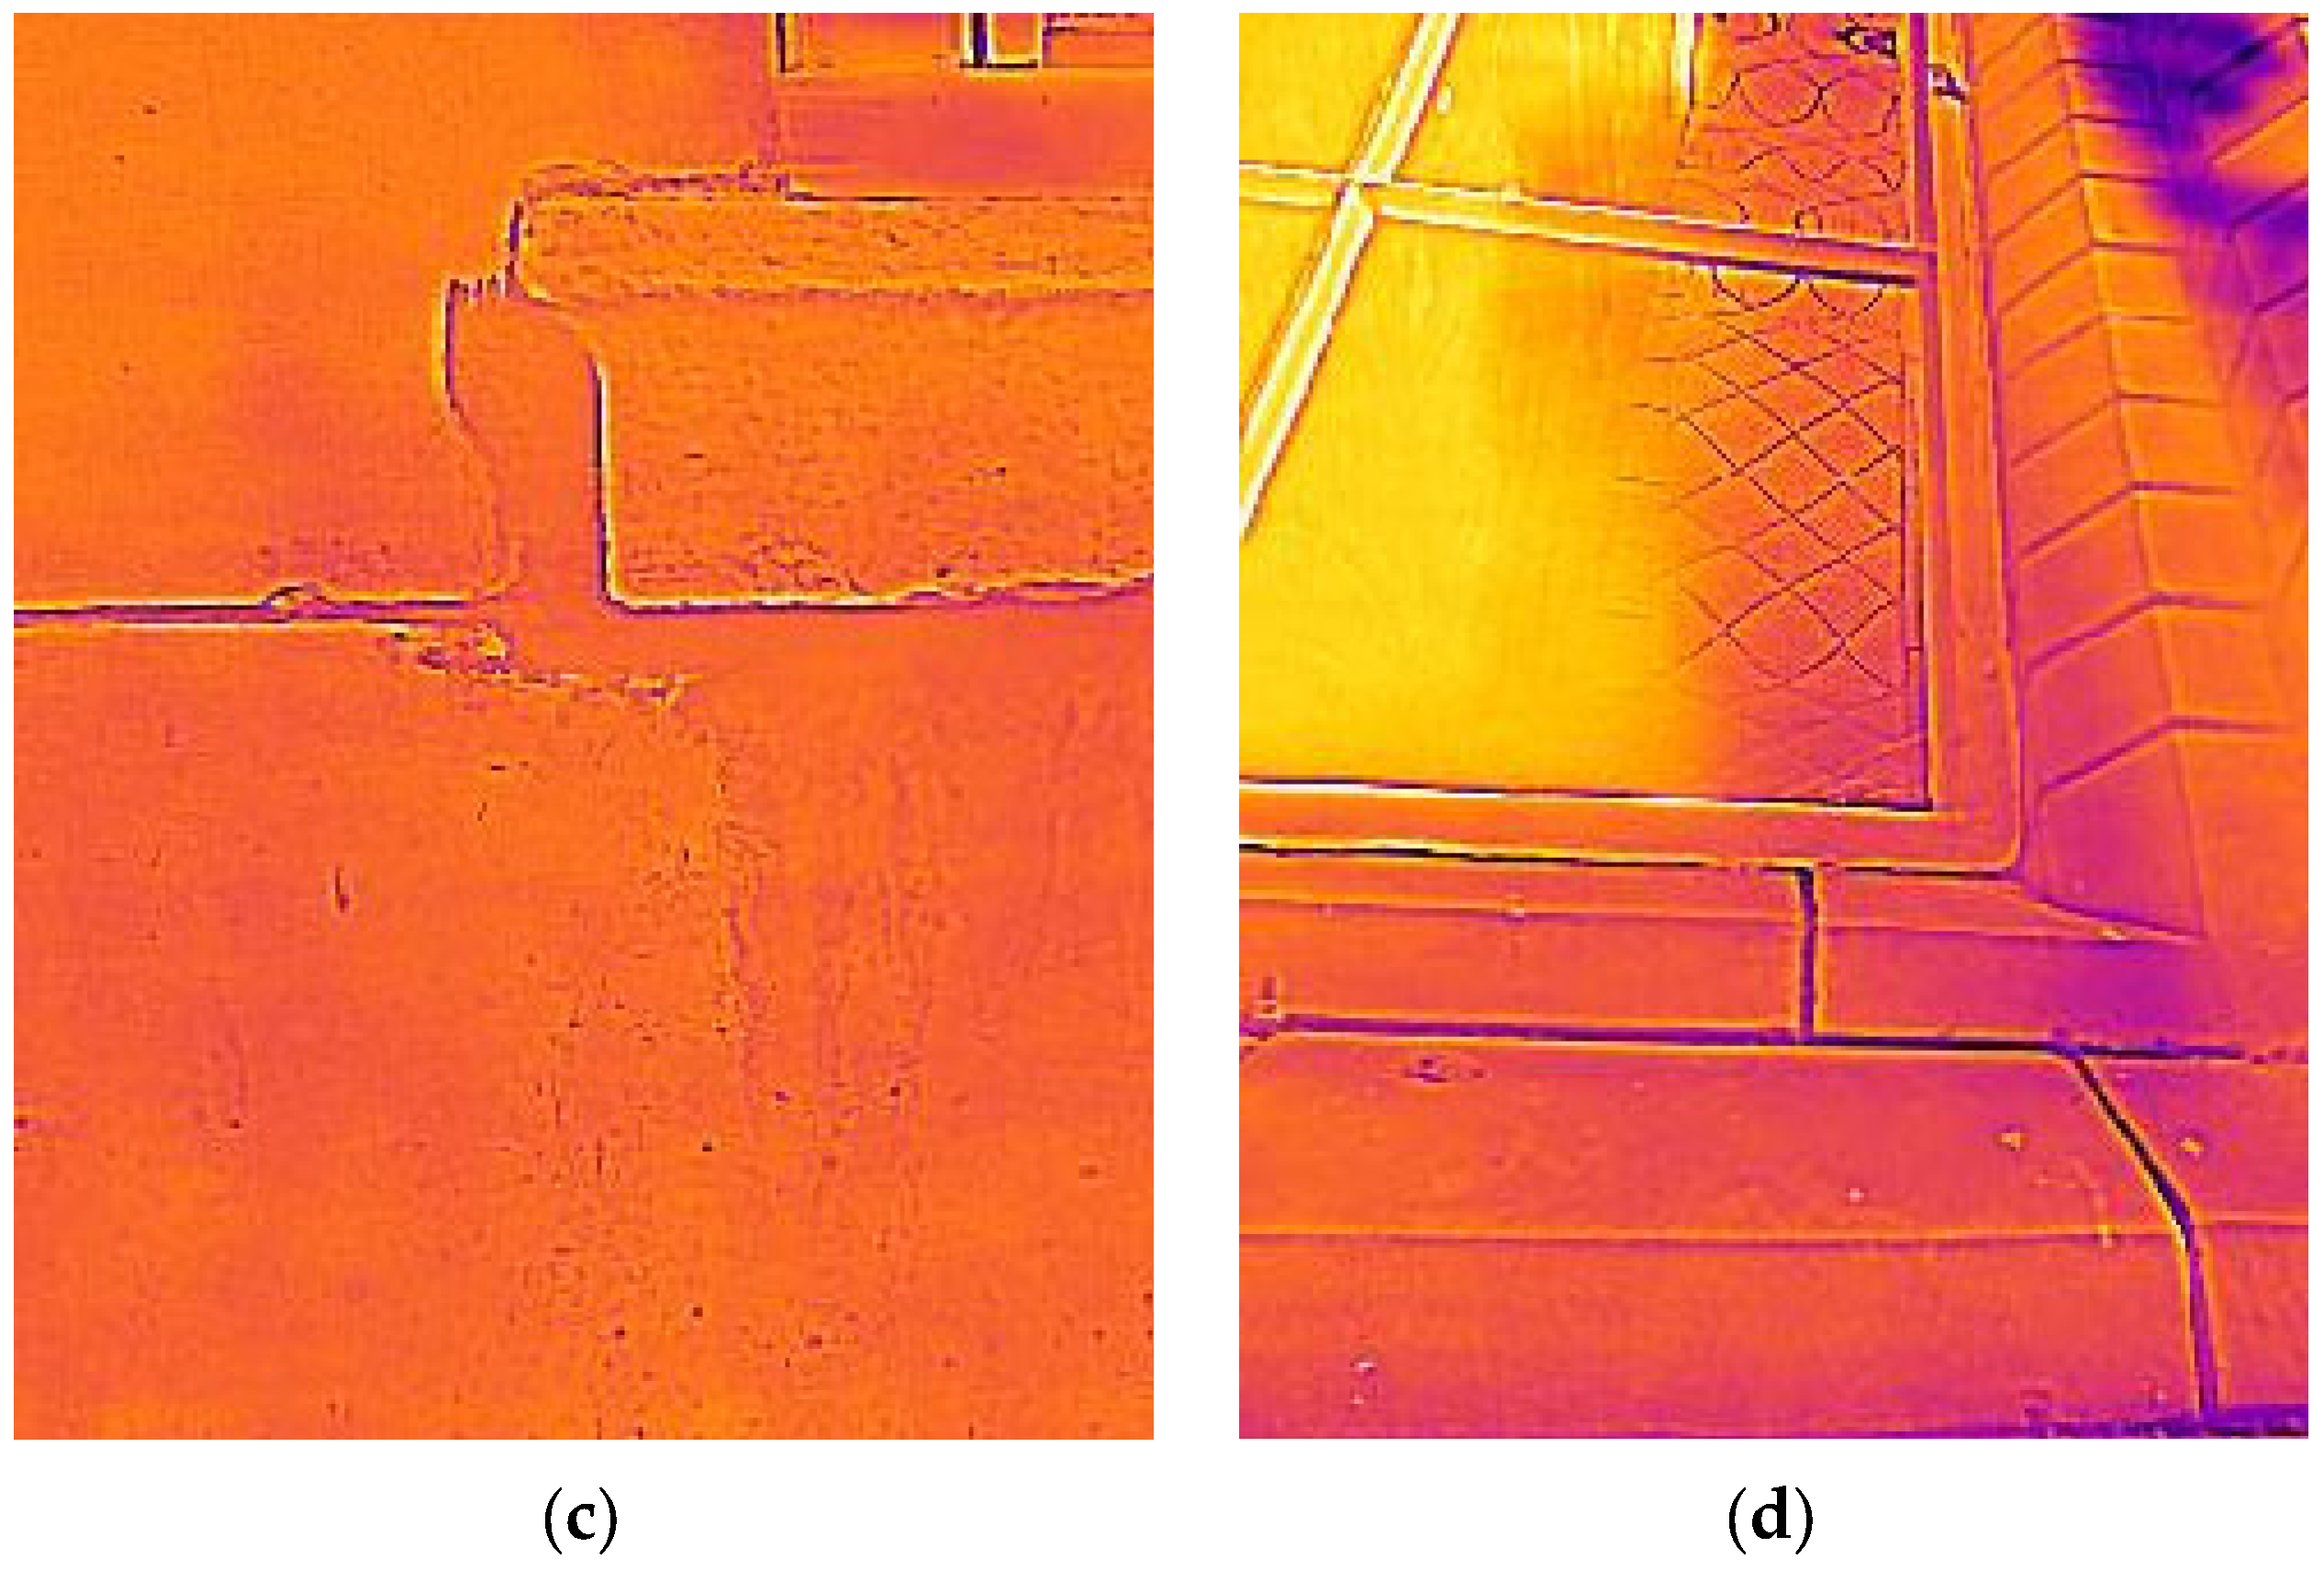
Figure 16 shows an example of misclassification by the perception of the CNN algorithm. Figure 16a shows an example that a door is misclassified as a brick wall. In the case of a door, the pieces in the door that are similar to the brick size or the shape of the door can be classified as a brick by the CNN algorithm by the scale of the picture. However, misclassification can be minimized if a digital image capable of distinguishing the colours of the two objects is applied. Figure 16b is an example that a door is misclassified as a window. In the histogram of Figure 9, in which the histogram of the thermal infrared image is analysed, pixels with a low grey channel are widely distributed in the window. Even if it is a thermal infrared image of a door, when there are many pixels with low thermal energy in the image, the CNN algorithm can misclassify the door as a window. Figure 16c is a stone wall but is classified as a brick wall. The biggest difference between stonewall and a brick wall was the size and colour. However, if there are joints in the stonewall and they have an image similar to that of the brick wall, the CNN algorithm can classify stonewall as a brick wall. If a technique that reflects the surface colour of an object, together with a digital image, is used as raw data for CNN analysis together with thermal infrared imaging, this misclassification can be prevented. Figure 16d shows an example in which a specific image reflected in a window was misclassified as a crack. Windows can reflect various images, and when a reflected image appears within a thermal image, CNN algorithms can misclassify the window as another image. A thermal infrared image can induce a CNN algorithm to find a feature through a thermal energy difference occurring at an object and a boundary between objects. However, it was confirmed that misclassification occurs due to the perception of the CNN algorithm when only thermal infrared images are used. Therefore, in order to minimize such misclassifications, it is expected that the classification accuracy can be improved if the data used for CNN analysis are applied together with digital images and other image techniques.

6. Conclusions

In this paper, automatic classification was performed using a CNN algorithm after taking multi-category infrared thermal images to perform multi-label classification and automatic damage detection of the heritage building. The Victoria Gallery and Museum is one of the representative heritage buildings in Liverpool, UK, built with red brick in the era of the first Industrial Revolution, and the detailed conclusions from monitoring and analysing this heritage building are as follows:
(1)
A total of 2400 infrared thermal images were collected by selecting 8 multi-labels of the heritage building. In the infrared thermal image, the thermal energy change appeared at the boundary of each object, and the thermal energy change became a feature that can classify multi-labels in the deep-learning algorithm. The collected images were analysed with a grey channel histogram and a 3D colour scale. Among the eight multi-labels, doors and artworks had a majority of pixels with a greyscale of over 200, and arches, vents, and windows showed a wide distribution of low thermal energy in the histogram. It is confirmed that the stonewall, brick wall, and cracks have a similar histogram distribution pattern but are distinguished by the three-dimensional colour scale.
(2)
In this paper, the CNN algorithm is applied for multi-label classification and automatic damage detection of the heritage building. Brick wall, stonewall, and window showed 97.78%, 97.82%, and 96.42% precision, respectively, and cracks showed 95.83% precision. Door showed the lowest precision of 93.87%. The door that showed the lowest precision showed a sensitivity of 100%. Although the detection accuracy of the door is lower than others, it can be seen that the classifier reacts sensitively to the door. Artwork, brick wall, and stonewall showed lower sensitivity than precision at 97.87%, 93.61%, and 95.74%, respectively. Cracks showed sensitivity equal to precision at 95.83%. The average precision and average sensitivity for the eight categories of heritage buildings were 97.72% and 97.43%, respectively.
(3)
The misclassified images are analysed in order to understand the causes of the misclassification of infrared thermal images in detail. This paper defined the causes of misclassification as the following two causes: misclassification by multiple objects and misclassification by the perception of the CNN algorithm. In order to minimize such misclassification, it is expected that the classification accuracy can be improved if the data used for CNN analysis are applied together with digital images and other image techniques.
This paper collected data in the summer of 2022, and further studies comparing it with winter data are needed to confirm the seasonal effect.

Author Contributions

Conceptualisation, supervision, final report approval, data pre-processing, and document writing, including original draft and final draft: H.S.; Data collection and data pre-processing: A.D.R.; Coding and data pre-processing: C.C.; Paper review: C.Z. All authors have read and agreed to the published version of the manuscript.

Funding

This research is supported by the Royal Society (Grant Number: IEC\NSFC\211145) and RESEARCH ENGLAND, UK (Grant Number: 178716).

Data Availability Statement

The data that support the findings of this study are available from the corresponding author [Hyungjoon Seo] upon reasonable request.

Acknowledgments

This work was supported by the Royal Society [grant number: IEC\NSFC\211145] and Research England (grant number: 178716). In particular, the authors would like to thank Nicola Euston (Head of Victoria Gallery and Museum) and her team for providing the site and supporting us on the site.

Conflicts of Interest

The authors declare no conflict of interest. The authors hereby declare that there were no known competing financial interests or personal relationships that could have influenced the work in this paper.

References

  1. Almssad, A.; Almusaed, A.; Homod, R.Z. Masonry in the Context of Sustainable Buildings: A Review of the Brick Role in Architecture. Sustainability 2022, 14, 14734. [Google Scholar] [CrossRef]
  2. Yavartanoo, F.; Kang, T.H.-K. Retrofitting of unreinforced masonry structures and considerations for heritage-sensitive constructions. J. Build. Eng. 2022, 49, 103993. [Google Scholar] [CrossRef]
  3. Uzdil, O.; Cosgun, T.; Sayin, B.; Akcay, C. Seismic performance evaluation and strengthening proposal for a reconstruction project of a historic masonry building demolished in the 1940s. J. Build. Eng. 2023, 66, 105914. [Google Scholar] [CrossRef]
  4. Mesquita, E.; Arêde, A.; Pinto, N.; Antunes, P.; Varum, H. Long-term monitoring of a damaged historic structure using a wireless sensor network. Eng. Struct. 2018, 161, 108–117. [Google Scholar] [CrossRef]
  5. Shen, L.; Yang, B.; Yang, Y.; Yang, X.; Zhu, W.; Wang, Q. Real-Time Monitoring for Monolithic Movement of a Heritage Curtilage Using Wireless Sensor Networks. Buildings 2022, 12, 1785. [Google Scholar] [CrossRef]
  6. Diz-Mellado, E.; Mascort-Albea, E.J.; Romero-Hernández, R.; Galán-Marín, C.; Rivera-Gómez, C.; Ruiz-Jaramillo, J.; Jaramillo-Morilla, A. Non-destructive testing and Finite Element Method integrated procedure for heritage diagnosis: The Seville Cathedral case study. J. Build. Eng. 2021, 37, 102134. [Google Scholar] [CrossRef]
  7. Tejedor, B.; Lucchi, E.; Bienvenido-Huertas, D.; Nardi, I. Non-destructive techniques (NDT) for the diagnosis of heritage buildings: Traditional procedures and futures perspectives. Energy Build. 2022, 263, 112029. [Google Scholar] [CrossRef]
  8. Jalón, M.L.; Chiachío, J.; Gil-Martín, L.M.; Hernández-Montes, E. Probabilistic identification of surface recession patterns in heritage buildings based on digital photogrammetry. J. Build. Eng. 2021, 34, 101922. [Google Scholar] [CrossRef]
  9. Lerones, P.M.; Vélez, D.O.; Rojo, F.G.; Gómez-García-Bermejo, J.; Casanova, E.Z. Moisture detection in heritage buildings by 3D laser scanning. Stud. Conserv. 2016, 61, 46–54. [Google Scholar] [CrossRef]
  10. Zahiri, Z.; Laefer, D.F.; Gowen, A. Characterizing building materials using multispectral imagery and LiDAR intensity data. J. Build. Eng. 2021, 44, 102603. [Google Scholar] [CrossRef]
  11. Moyano, J.; Justo-Estebaranz, Á.; Nieto-Julián, J.E.; Barrera, A.O.; Fernández-Alconchel, M. Evaluation of records using terrestrial laser scanner in architectural heritage for information modeling in HBIM construction: The case study of the La Anunciación church (Seville). J. Build. Eng. 2022, 62, 105190. [Google Scholar] [CrossRef]
  12. Costanzo, A.; Falcone, S.; Piana, C.L.; Lapenta, V.; Musacchio, M.; Sgamellotti, A.; Buongiorno, M.F. Laser Scanning Investigation and Geophysical Monitoring to Characterise Cultural Heritage Current State and Threat by Traffic-Induce Vibrations: The Villa Farnesina in Rome. Remote Sens. 2022, 14, 5818. [Google Scholar] [CrossRef]
  13. Nagy, G.; Ashraf, F. HBIM platform & smart sensing as a tool for monitoring and visualizing energy performance of heritage buildings. Dev. Built Environ. 2021, 8, 100056. [Google Scholar] [CrossRef]
  14. Silva, H.E.; Coelho GB, A.; Henriques FM, A. Climate monitoring in World Heritage List buildings with low-cost data loggers: The case of the Jerónimos Monastery in Lisbon (Portugal). J. Build. Eng. 2020, 28, 101029. [Google Scholar] [CrossRef]
  15. Haugen, A.; Bertolin, C.; Leijonhufvud, G.; Olstad, T.; Broström, T. A Methodology for Long-Term Monitoring of Climate Change Impacts on Historic Buildings. Geosciences 2018, 8, 370. [Google Scholar] [CrossRef]
  16. Hatır, M.E.; İnce, İ.; Bozkurt, F. Investigation of the effect of microclimatic environment in historical buildings via infrared thermography. J. Build. Eng. 2022, 57, 104916. [Google Scholar] [CrossRef]
  17. Mishra, M. Machine learning techniques for structural health monitoring of heritage buildings: A state-of-the-art review and case studies. J. Cult. Herit. 2021, 47, 227–245. [Google Scholar] [CrossRef]
  18. Mishra, M.; Bhatia, A.S.; Maity, D. Predicting the compressive strength of unreinforced brick masonry using machine learning techniques validated on a case study of a museum through nondestructive testing. J. Civ. Struct. Health Monit. 2020, 10, 389–403. [Google Scholar] [CrossRef]
  19. Mishra, M.; Barman, T.; Ramana, G.V. Artificial intelligence-based visual inspection system for structural health monitoring of cultural heritage. J. Civ. Struct. Health Monit. 2022. [Google Scholar] [CrossRef]
  20. Boesgaard, C.; Hansen, B.V.; Kejser, U.B.; Mollerup, S.H.; Ryhl-Svendsen, M.; Torp-Smith, N. Prediction of the indoor climate in cultural heritage buildings through machine learning: First results from two field tests. Herit. Sci. 2022, 10, 176. [Google Scholar] [CrossRef]
  21. Monna, F.; Rolland, T.; Denaire, A.; Navarro, N.; Granjon, L.; Barbé, R.; Chateau-Smith, C. Deep learning to detect built cultural heritage from satellite imagery. -Spatial distribution and size of vernacular houses in Sumba, Indonesia-. J. Cult. Herit. 2021, 52, 171–183. [Google Scholar] [CrossRef]
  22. Cui, L.; Shao, X.; Mago, B.; Ravi, R.V. Digital intangible cultural heritage management using deep learning models. Aggress. Violent Behav. 2021, 101680. [Google Scholar] [CrossRef]
  23. Chandra, S.; AlMansoor, K.; Chen, C.; Shi, Y.; Seo, H. Deep Learning Based Infrared Thermal Image Analysis of Complex Pavement Defect Conditions Considering Seasonal Effect. Sensors 2022, 22, 9365. [Google Scholar] [CrossRef] [PubMed]
  24. Chen, C.; Seo, H.; Zhao, Y. A novel pavement transverse cracks detection model using WT-CNN and STFT-CNN for smartphone data analysis. Int. J. Pavement Eng. 2022, 23, 4372–4384. [Google Scholar] [CrossRef]
  25. Chen, C.; Seo, H.; Jun, C.H.; Zhao, Y. A potential crack region method to detect crack using image processing of multiple thresholding. Signal Image Video Process. 2022, 16, 1673–1681. [Google Scholar] [CrossRef]
  26. Chen, C.; Chandra, S.; Seo, H. Automatic pavement defect detection and classification using RGB-thermal images based on hierarchical residual attention network. Sensors 2022, 22, 5781. [Google Scholar] [CrossRef]
  27. Chen, C.; Chandra, S.; Han, Y.; Seo, H. Deep Learning-Based Thermal Image Analysis for Pavement Defect Detection and Classification Considering Complex Pavement Conditions. Remote Sens. 2022, 14, 106. [Google Scholar] [CrossRef]
  28. Seo, H.; Zhao, Y.; Chen, C. Displacement Mapping of Point Clouds for Retaining Structure Considering Shape of Sheet Pile and Soil Fall Effects during Excavation. J. Geotech. Geoenviron. Eng. 2022, 148, 04022016. [Google Scholar] [CrossRef]
  29. Zhao, Y.; Seo, H.; Chen, C. Displacement analysis of point cloud removed ground collapse effect in SMW by CANUPO machine learning algorithm. J. Civ. Struct. Health Monit. 2022, 12, 447–463. [Google Scholar] [CrossRef]
  30. Zhao, Y.; Seo, H.; Chen, C. Displacement mapping of point clouds: Application of retaining structures composed of sheet piles. J. Civ. Struct. Health Monit. 2021, 11, 915–930. [Google Scholar] [CrossRef]
  31. Seo, H. Long-term Monitoring of zigzag-shaped concrete panel in retaining structure using laser scanning and analysis of influencing factors. Opt. Lasers Eng. 2021, 139, 106498. [Google Scholar] [CrossRef]
  32. Seo, H. Monitoring of CFA pile test using three dimensional laser scanning and distributed fiber optic sensors. Opt. Lasers Eng. 2020, 130, 106089. [Google Scholar] [CrossRef]
  33. Seo, H.; Zhao, Y.; Chen, C. Displacement Estimation Error in Laser Scanning Monitoring of Retaining Structures Considering Roughness. Sensors 2021, 21, 7370. [Google Scholar] [CrossRef] [PubMed]
  34. Seo, H. Tilt mapping for zigzag-shaped concrete panel in retaining structure using terrestrial laser scanning. J. Civ. Struct. Health Monit. 2021, 11, 851–865. [Google Scholar] [CrossRef]
  35. Seo, H. 3D roughness measurement of failure surface in CFA pile samples using three-dimensional laser scanning. Appl. Sci. 2021, 11, 2713. [Google Scholar] [CrossRef]
  36. Seo, H.; Choi, H.; Park, J.; Lee, I.M. Crack detection in pillars using infrared thermographic imaging. Geotech. Test. J. 2016, 40, 371–380. [Google Scholar] [CrossRef]
  37. Sihombing, J.; Farisi, R.R.; Ardiansyah, P.R. Analysis of relationship between strength compression and young modulus of red brick and white brick on application of strength and stiffness building construction with linear regression test. J. Civ. Eng. Environ. Sci. 2020, 6, 16–21. [Google Scholar] [CrossRef]
  38. Seo, H. Infrared thermography for detecting cracks in pillar models with different reinforcing systems. Tunn. Undergr. Space Technol. 2021, 116, 104118. [Google Scholar] [CrossRef]
  39. Zhao, Y.; Han, Y.; Chen, C.; Seo, H. Crack detection in frozen soils using infrared thermographic camera. Sensors 2022, 22, 885. [Google Scholar] [CrossRef]
  40. Mostafa, S.; Wu, F.-X. Neural Engineering Techniques for Autism Spectrum Disorder, Volume 1: Imaging and Signal Analysis; Elsevier: Amsterdam, The Netherlands, 2021; pp. 23–38. [Google Scholar]
  41. Djordjevic, I.B. Quantum Information Processing, Quantum Computing, and Quantum Error Correction: An Engineering Approach, 2nd ed.; Elsevier: Amsterdam, The Netherlands, 2021; pp. 619–701. [Google Scholar]
  42. Chen, C.; Seo, H.; Jun, C.H.; Zhao, Y. Pavement crack detection and classification based on fusion feature of LBP and PCA with SVM. Int. J. Pavement Eng. 2022, 23, 3274–3283. [Google Scholar] [CrossRef]
  43. Cakir, F.; He, K.; Xia, X.; Kulis, B.; Sclaroff, S. Deep metric learning to rank. In Proceedings of the 2019 IEEE/CVF Conference on Computer Vision and Pattern Recognition (CVPR), Long Beach, CA, USA, 15–20 June 2019; pp. 1861–1870. [Google Scholar] [CrossRef]
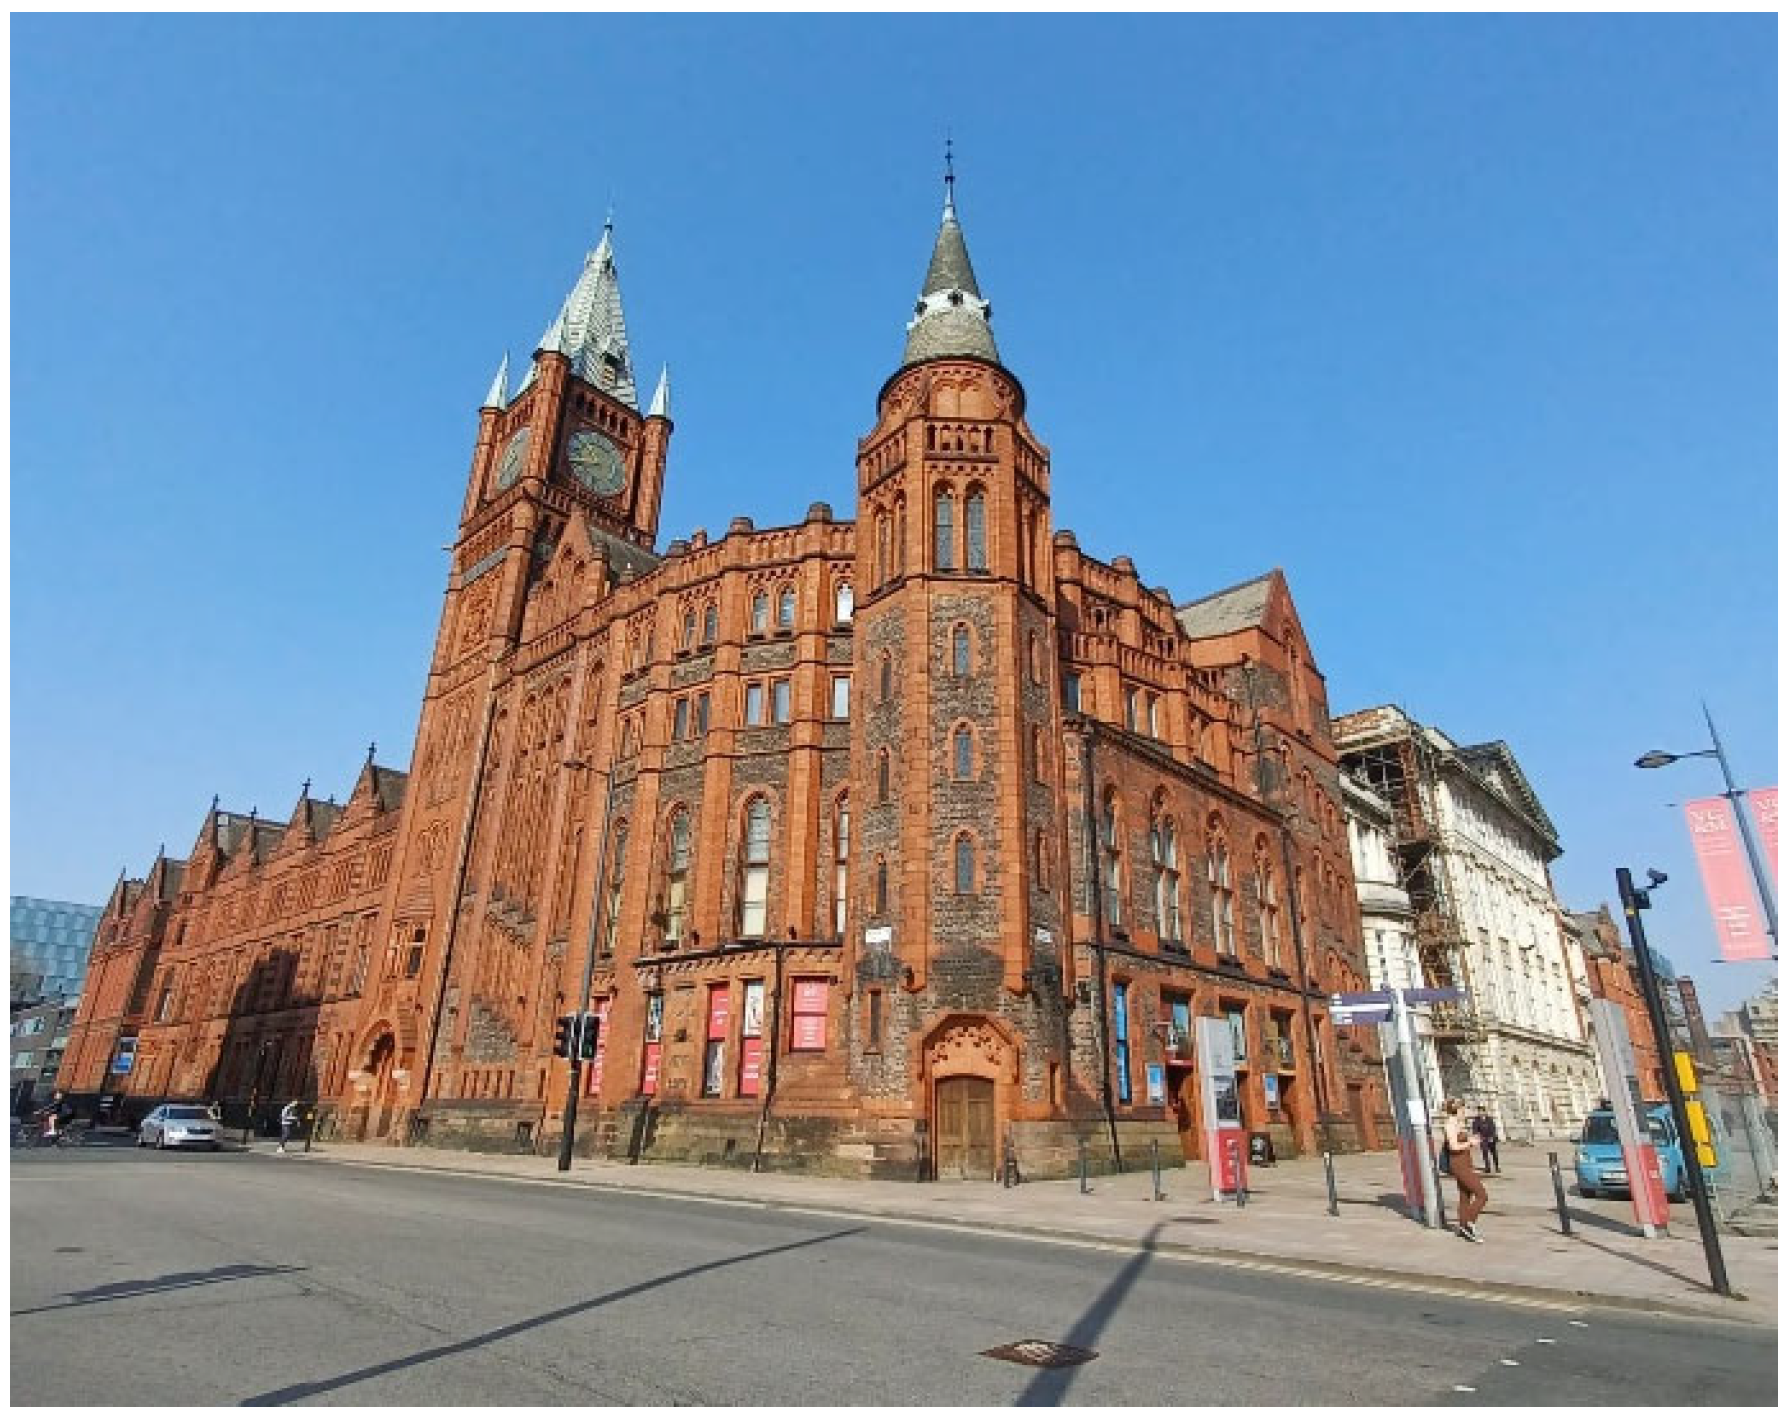
Figure 1. Victoria Gallery and Museum in Liverpool.
Remotesensing 15 02517 g001
Figure 2. Thermal infrared camera.
Remotesensing 15 02517 g002
Figure 3. Digital and infrared images of Victoria Gallery and Museum. (a) Digital image; (b) Infrared thermal image.
Remotesensing 15 02517 g003
Figure 4. Categories of objects in heritage building.
Remotesensing 15 02517 g004
Figure 5. Data collection using infrared thermal camera. (a) Distance between object and camera; (b) Infrared photography.
Remotesensing 15 02517 g005
Figure 6. Example of infrared thermal images in each category.
Remotesensing 15 02517 g006
Figure 7. RGB channel value interpretation.
Remotesensing 15 02517 g007
Figure 8. Histogram and 3D colour scale of IR images in door and artwork. (a) Door; (b) Artwork.
Remotesensing 15 02517 g008
Figure 9. Histogram and 3D colour scale of IR images in arch, vent, and window. (a) Arch; (b) Vent; (c) Window.
Remotesensing 15 02517 g009aRemotesensing 15 02517 g009b
Figure 10. Histogram and 3D colour scale of IR images in stonewall, brick wall, and crack. (a) stonewall; (b) brick wall; (c) crack.
Remotesensing 15 02517 g010
Figure 11. Framework of convolutional neural network in this study. (a) Structure of convolutional neural network; (b) Convolutional and pooling layers.
Remotesensing 15 02517 g011
Figure 12. Test and evaluation. (a) Model accuracy; (b) Model losses.
Remotesensing 15 02517 g012
Figure 13. Confusion matrix of CNN analysis.
Remotesensing 15 02517 g013
Figure 14. Precision and sensitivity.
Remotesensing 15 02517 g014
Figure 15. Misclassification by multiple objects. (a) Crack: misclassified as stonewall; (b) Door: misclassified as artwork; (c) Window: misclassified as brick wall.
Remotesensing 15 02517 g015
Figure 16. Misclassification by perception of CNN algorithm. (a) Door: misclassified as brick wall; (b) Door: misclassified as window; (c) Stonewall: misclassified as brick wall; (d) Window: misclassified as crack.
Remotesensing 15 02517 g016aRemotesensing 15 02517 g016b
Table 1. Specifications of FLIR ONE TG165-X.
ParameterTechnical Specifications
Dimension (L × W × H)210 × 64 × 81 mm
IR resolution80 × 60 pixels
USB standardUSB Type-C
Thermal sensitivity<70 mK
Field of view (FOV)51° × 66°
FocusFixed
Frame rate8.7 Hz
Display resolution1600 × 1200 pixels
Image adjustmentAutomatic
Accuracy50 °C to 100 °C (122 °F to 212 °F), acc. ±1.5 °C (±3 °F); 0 °C to 50 °C (32 °F to 122 °F) and 100 °C to 300 °C (212 °F to 572 °F), acc. ±2.5 °C (±5 °F); −25 °C to 0 °C (−13 °F to 32 °F), acc. ±3 °C (±7 °F)
Object temperature range−25 °C to 300° C
Image modesMSX® (Multi Spectral Dynamic Imaging), visual
Disclaimer/Publisher’s Note: The statements, opinions and data contained in all publications are solely those of the individual author(s) and contributor(s) and not of MDPI and/or the editor(s). MDPI and/or the editor(s) disclaim responsibility for any injury to people or property resulting from any ideas, methods, instructions or products referred to in the content.