Article

Economic Fruit Forest Classification Based on Improved U-Net Model in UAV Multispectral Imagery

1
Department of Geographic Information Engineering, College of Land Science and Technology, China Agricultural University, No. 2 West Old Summer Palace Road, Haidian District, Beijing 100193, China
2
Key Laboratory for Agricultural Land Quality Monitoring and Control, Ministry of Natural Resources, Beijing 100193, China
*
Author to whom correspondence should be addressed.
Remote Sens. 2023, 15(10), 2500; https://doi.org/10.3390/rs15102500
Submission received: 21 March 2023 / Revised: 7 May 2023 / Accepted: 8 May 2023 / Published: 10 May 2023

Abstract

:
Economic fruit forest is an important part of Chinese agriculture with high economic value and ecological benefits. Using UAV multi-spectral images to research the classification of economic fruit forests based on deep learning is of great significance for accurately understanding the distribution and scale of fruit forests and the status quo of national economic fruit forest resources. Based on the multi-spectral remote sensing images of UAV, this paper constructed semantic segmentation data of economic fruit forests, conducted a comparative study on the classification and identification of economic fruit forests of FCN, SegNet, and U-Net classic semantic segmentation models, and proposed an improved ISDU-Net model. The recognition accuracies of the ISDU-Net were 87.73%, 70.68%, 78.69%, and 0.84, respectively, in terms of pixel accuracy, average intersection ratio, frequency weight intersection ratio, and Kappa coefficient, which were 3.19%, 8.90%, and 4.51% higher than the original U-Net model. The results showed that the improved ISDU-Net could effectively improve the learning ability of the model, perform better in the prediction of short sample categories, obtain a higher classification accuracy of fruit forest crops, and provide a new idea for the research on accurate fruit forest identification.

1. Introduction

Economic fruit forest is an important part of agriculture and has played an irreplaceable role in increasing farmers’ income, developing green agriculture, and implementing rural revitalization [1]. In recent years, with the continuous adjustment of China’s agricultural industrial structure, the planting area and output of fruit forests continue to rank first in the world [2,3], becoming an industry second only to grain, vegetable, and oil crop areas, which have further increased. Therefore, it is very important to carry out accurate economic fruit forest classification [4,5,6]. The traditional ground survey of economic fruit forests is time-consuming and laborious. The emergence of remote sensing images has made quick identification possible [7].
UAV remote sensing technology has developed rapidly in various fields, especially in the field of identification and classification, and has become a new way of acquiring remote sensing images. UAV remote sensing has great potential, mainly due to its flexibility, high efficiency, and strong ability to classify agricultural fields, such as crop identification and resource investigation [8,9,10], and it has gradually become the main force in the field of identification and classification [11,12,13,14,15,16]. In recent years, the deep learning model has gradually developed and matured, becoming a popular research direction for image processing tasks, and has a wide range of applications in various fields [17,18,19,20,21,22]. Compared with machine learning models, deep learning models do not rely on manual feature selection [23,24], and the classification efficiency is greatly improved by automatically extracting features and performing category probability calculations [25]. In the research on UAV remote sensing image classification, the classification accuracy is further improved after using deep learning algorithms, such as using the improved deep learning model to identify sunflower lodging information [26], using deep learning models to classify crops, the classification models [27,28,29,30], using U-Net to segment the canopy of walnut trees [31], and using the deep learning semantic segmentation model to identify the canopy of kiwi fruit in the orchard [32]. At present, most researchers focus on exploring and improving the deep learning model to process remote sensing image classification tasks more efficiently, and exploit a new path for the field of UAV and other types of remote sensing image data processing [33], such as using a lightweight convolutional neural network structure to classify tree species, which solves the problem of limited monitoring of forest land by satellite images [34], and using the improved U-Net model to classify crops, which has significantly improved the classification accuracy compared to the original U-Net model [35].
In summary, although many methods have been provided for the classification and identification of UAV remote sensing technology in the existing literature, there is little research on the classification and identification of economic fruit forests based on UAV remote sensing images, and the accuracy is limited by the classic deep learning model.
In this study, a new method for economic fruit forest information recognition based on UAV image data is proposed. We selected a farmland in Zibo City, Shandong Province, as the research area. By comparing it with the classical semantic segmentation model, U-Net was selected as the basic model and improved to obtain the ISDU-Net model, which was used to explore the feature differences between different crops, improve the classification accuracy and extraction efficiency of economic fruit forests, improve the classification recognition effect of the semantic segmentation model on small samples obtained from a small number of samples, and provide a reference for the scientific, convenient, and efficient identification of economic fruit forest spatial distribution information.

2. Materials and Methods
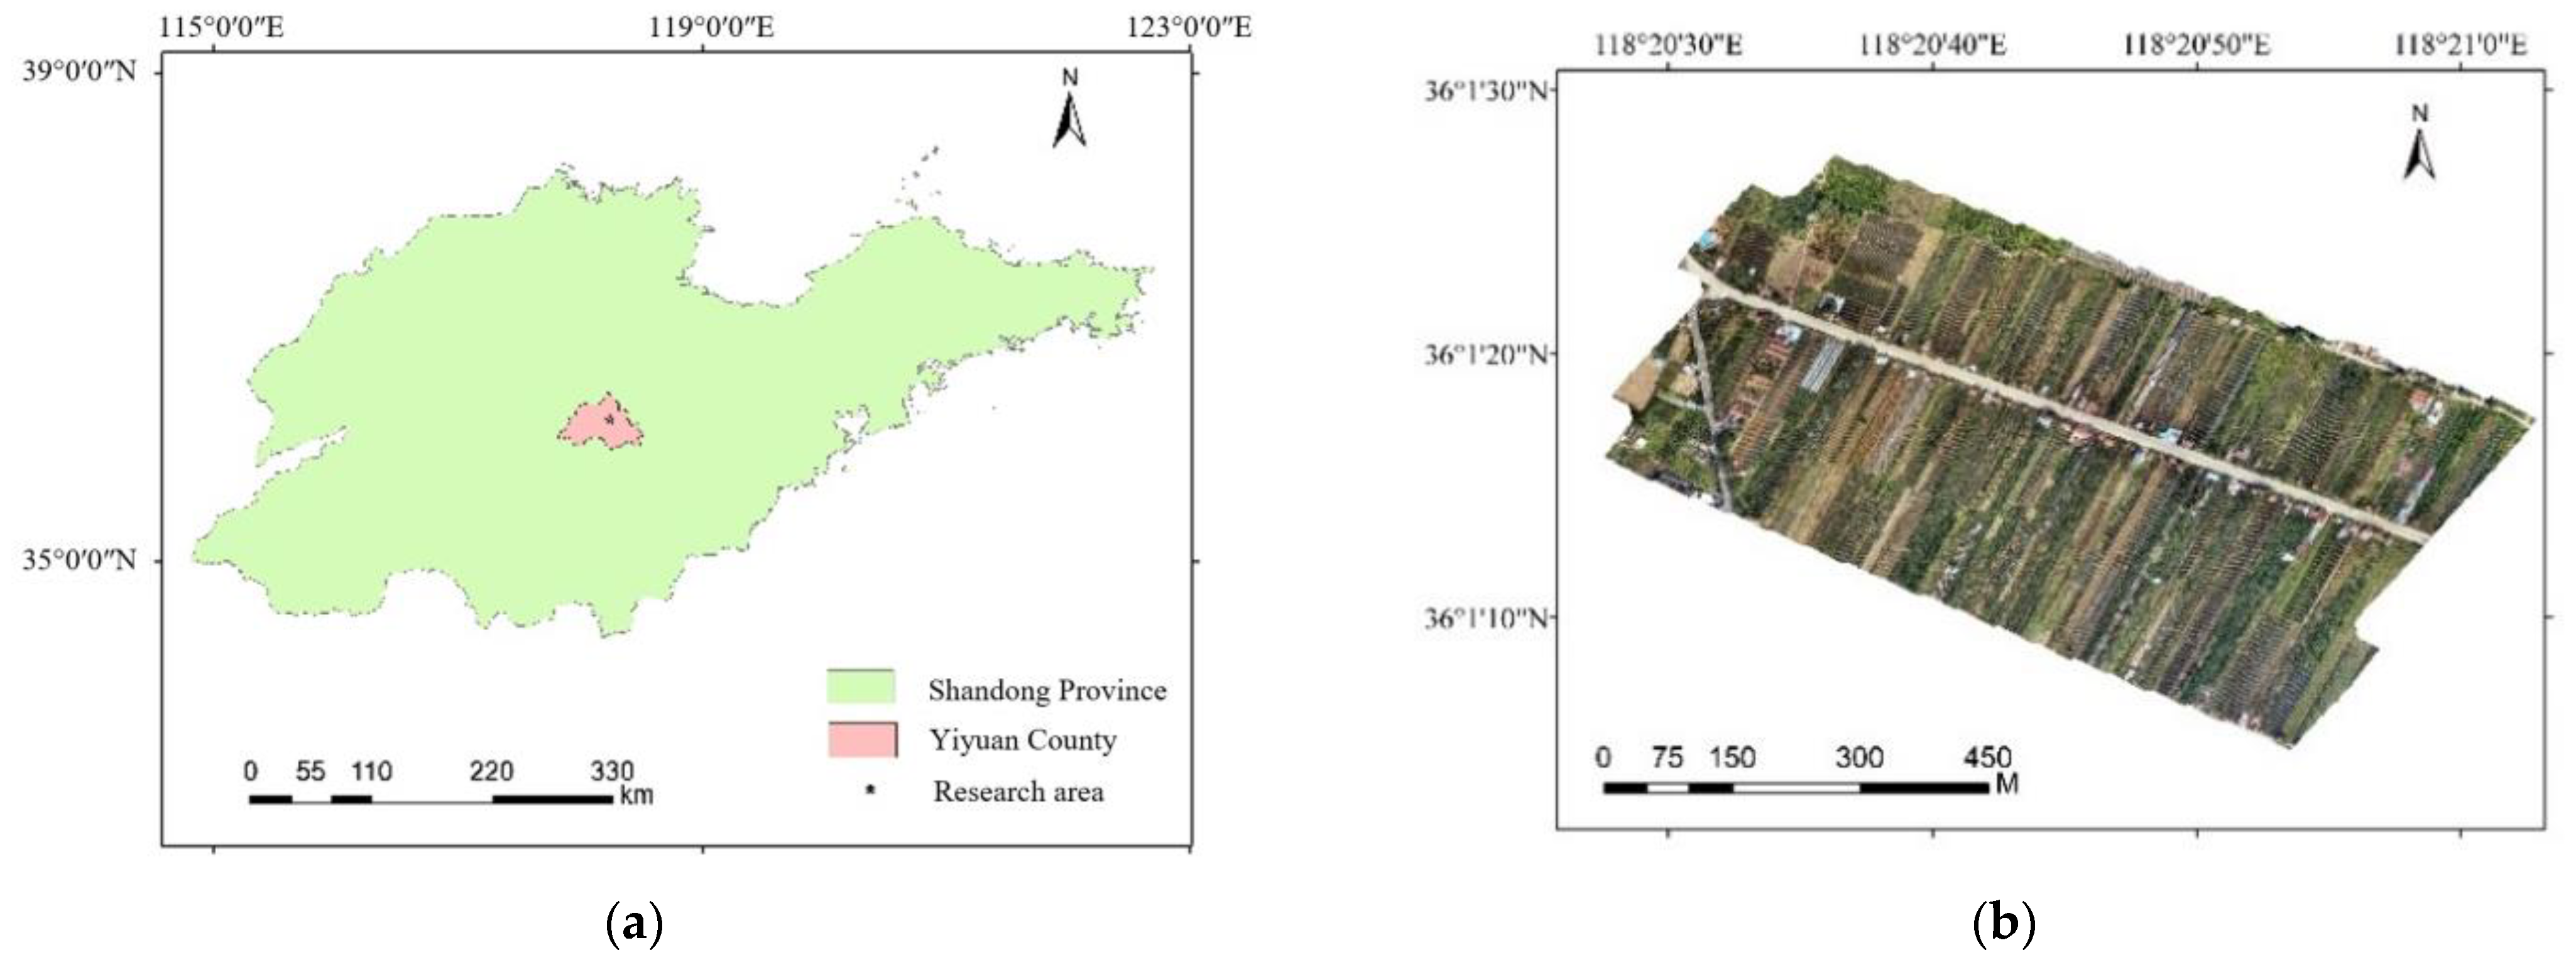
2.1. Study Area

Shandong Province is located in the eastern coastal area of China and is known as the “Hometown of Fruits” in the north. By 2020, the total fruit planting area of Shandong Province accounted for 4.77% of China, and the total fruit output accounted for 10.24% of the country, ranking first in China [36,37,38]. Yiyuan County, Zibo City, is located in the middle of Shandong Province (Figure 1a) and has a temperate continental monsoon climate. The study area is located at 118°20′24″E to 118°21′36″E and 36°0′36″N to 36°1′12″N, which is an agricultural economic forest in the middle section of the Yihe River, Zhongzhuang Town, Yiyuan County, Zibo City, Shandong Province (Figure 1b), with a total area of about 0.47 km2. The study area has many kinds of fruit trees, which are planted in a strip arrangement, and the main economic crops are grapes, peaches, apples, cherries, etc.
The phenology of the fruits in the study area is quite different as shown in Figure 2. Grapes mainly enter the budding stage in early April, the flowering stage in May, and start fruiting in June; the fruits are mature by August and harvested in September. Peaches begin flowering in April and are harvested in July. The main variety of apples is Red Fuji, which blooms in April, is bagged in May after flowering, picked in October, covered with reflective paper under the tree to color the apples, and picked after 5 to 6 days, lasting until November. Cherries bloom in March, bear fruit in April, mature in early May, and are picked in May. During the data collection period, apples in the study area were in the fruiting stage; grapes, peaches, and cherries were in the full leaf stage; and corns were in the dry leaf stage [39].

2.2. Data

2.2.1. Data Source

The aircraft used in this study was the Dajiang Phantom 4 four-rotor UAV multispectral version. The flight parameter settings for the field image acquisition in the study area are shown in Table 1 [40].
The experimental data were collected at noon on 2 October 2021. At this time, the influence of the solar altitude angle on the image was minimal, and the shadows of the ground objects could be minimized. The UAV flight path preferentially selected the best flight path that ensured the coverage of the target area and met the minimum power consumption at the same time. The flight path and operation image interface of the study area are shown in Figure 3. During the flight, the battery was replaced four times.
The sample points were manually collected using a handheld GPS to obtain the ground object categories and geographical coordinates. Samples should be selected as much as possible on the basis of sufficient manpower, and distributed evenly in the study area as far as possible. According to the actual percentage of crop species planted in the study area, the approximate number of selections for each category was determined. The samples in each category included 17 apples, 23 grapes, 10 other trees, 17 peaches, 8 cherries, and 11 corns. The other trees were trees other than fruit trees such as poplars and so on. The samples of other trees, cherries, and corn in the study area were all about 10, accounting for 11.6%, 9.3%, and 12.8% of the total samples, respectively. The sample size of these three categories was small, so the category with less than 15 samples is defined as small samples in this paper. The above samples were generated into sample point files, which were superimposed on the image of the study area through Google Earth to facilitate the production of category labels for semantic segmentation models, as shown in Figure 4.

2.2.2. Data Processing

Automatic radiation correction, deformation correction, and image mosaic were carried out by using the Dajiang Intelligent Map v3.0.0 software. Using ArcGIS 10.5 band synthesis tool, five single-band images of red, green, blue, red edge, and near-infrared after orthophoto image mosaic were synthesized into five-band images. A raster data-cutting tool was used to cut the research area according to the square, and 16 regular rectangular images with the size of 2136 × 2629 pixels were obtained. A Python script was written to convert 16-scene 32-bit images into 8-bit images in batches, which was convenient for the normalization of UAV multi-band orthophoto images [41,42].

2.3. Methods

2.3.1. Sample Set Construction and Sample Labeling

The sample set construction was divided into three parts. First, it was necessary to label the samples and generate a label file. Then, the dataset was divided into a train set, validation set, and test set, and the train set and validation set were enhanced. The sample set construction process is shown in Figure 5. In this study, 16 images obtained from preprocessing were randomly divided into train sets and validation sets according to the ratio of 8:2, two images were randomly selected as test sets for prediction and accuracy evaluation, and the remaining 14 images were used as train sets and validation sets for model training [43].
To avoid the size of the single scene shadow image after preprocessing, the remote sensing image and the corresponding label image were cut at the same time. According to the existing experience and the acceptance ability of the model, a sliding window of 256 × 256 size and 0.5 overlap rate was used to cut the image and label the image synchronously, and the initial sample set was obtained, which had 5995 images. Since the deep learning model relies on a large number of sample data, the model accuracy is improved by multiple iterations of full learning [44]. In this study, horizontal flip, vertical flip, and diagonal mirror flip of geometric transformation were selected for data augmentation. Through sliding window cropping and data augmentation, a total of 17,985 256 × 256 images and their corresponding label images were obtained, of which the train set size was 14,400 images and the validation set size was 3585 images.
The deep learning semantic segmentation model is pixel-based image classification, which aims to perform pixel-by-pixel recognition on an image and annotate each pixel with a class label [45]. The classification system used in this study was grape, peach, apple, cherry, corn, other trees, and other features (any ground object except for the other six features). Corn was the main crop in the study area besides fruit forest, so it was included as a separate class. RGB labels were assigned to each class, the boundaries of each crop were sketched and colored using Photoshop, the label RGB values are shown in Table 2, and the label map that was made is shown in Figure 6.

2.3.2. U-Net Model Improvement

Using FCN, SegNet, and U-Net classical models for the initial classification, U-Net performed better than FCN and SegNet in all aspects. Therefore, the improved model was based on the U-Net model, which was in a “U” shape and consisted of an Encoder part and a Decoder part. In the Encoding part, the form of 2D convolution was adopted, and the number of filters was increased layer by layer. There were five layers of subsampled structures; each of the first three layers was an inception structure, the last two layers were subsampled structures, and each layer contained three convolutional layers, three BN layers, three “ReLU” activation layers, and a pooling layer. In the decoding part, transposed convolution was used to decrease the number of filters layer-by-layer to restore the original resolution of the image so as to achieve the purpose of pixel-by-pixel classification. The high-level and low-level feature fusion form was used to fuse with the feature layer obtained in the coding part, and then 2D convolution was used for feature extraction. The upsampled structure had five layers, and the SE-Block was added before upsampling in each layer, which is the squeeze-and-excitation module [46,47]. Figure 7 shows the structure of the improved model.
The Inception Module in the improved model used the ReLU activation function for each layer of convolution, and a BN layer was added to speed up network training and convergence and prevent gradient disappearance and overfitting. In order to increase the number of features obtained by the model and reduce the computational cost, GoogleNet proposed the Inception Module. Its main principle is to refer to the sparse connection characteristics of the biological nervous system, replace the fully connected layer with a sparse connection, and increase the depth and width of the network without increasing the amount of calculation through a parallel convolution structure and a smaller convolution kernel. The Inception Module could obtain more sample feature information, so this paper replaced the first three layers of the original U-Net model with the Inception Module, and increased the width of the subsampled part in order to improve the model’s learning ability for small sample types and improve the problem of unbalanced samples in some categories. The receptive field of the model features was widened to obtain more effective information [48].
In this study, based on the original U-Net model, the subsampled part was properly deepened in order to improve the expression and feature extraction ability of the model. The subsampled part of the original U-Net model contained two convolutions in each layer. In addition to using the inception structure to replace ordinary convolution in the first three layers of the subsampled layer to make the network deeper and wider, the last two layers of the model subsampled were appropriately adjusted, and the two 2D convolutions were changed into three so as to improve the learning ability of the model and obtain more feature information [49].
Due to the large number of bands involved in the original UAV multi-spectral remote sensing image dataset, the feature layers obtained after the early inception structure and deeper multi-layer convolution were complex. In the ordinary convolutional pooling process, the importance of each channel is generally regarded as equal; however, the importance of different channels to the classification results is different. The SE-Block focuses on the relationship and importance of different channels, and through the SE-Block, the model can learn the importance of different channel features to make better judgments. Therefore, when feature fusion was performed in the decoding part using the SE-Block for channel importance consideration before fusion, a better classification effect and more comprehensive channel information could be obtained [50].
The accuracy of the deep learning model is not only affected by the model structure but also largely depends on the adjustment of the model parameters. The parameters of deep learning models are usually divided into two categories: model parameters and hyperparameters. The model parameters are adjusted based on a data-driven approach. Through continuous iterative learning, the model adjusts the weight data in the model using the obtained data. The hyperparameters do not depend on the data and are directly adjusted by human intervention. After adjusting the model by setting the initial value and so on, the optimal parameters are tested. In this study, the model hyperparameters were adjusted and comparative experiments were conducted to obtain the optimal parameter settings so as to obtain the optimal model. In this study, two hyper-parameters, learning rate, and batch size, were adjusted to compare and analyze the optimal parameter settings.

2.3.3. Experimental Environment

This experiment used the Keras deep learning framework of the Tensorflow platform, and the language environment was Python 3.7.10. The experiments were accelerated using a GPU. Each hardware and software configuration is shown in Table 3. The libraries for cutting samples, reading, passing to the model, and finally visualizing were Python-based GDAL, OpenCV, Numpy, and Matplotlib.

3. Results

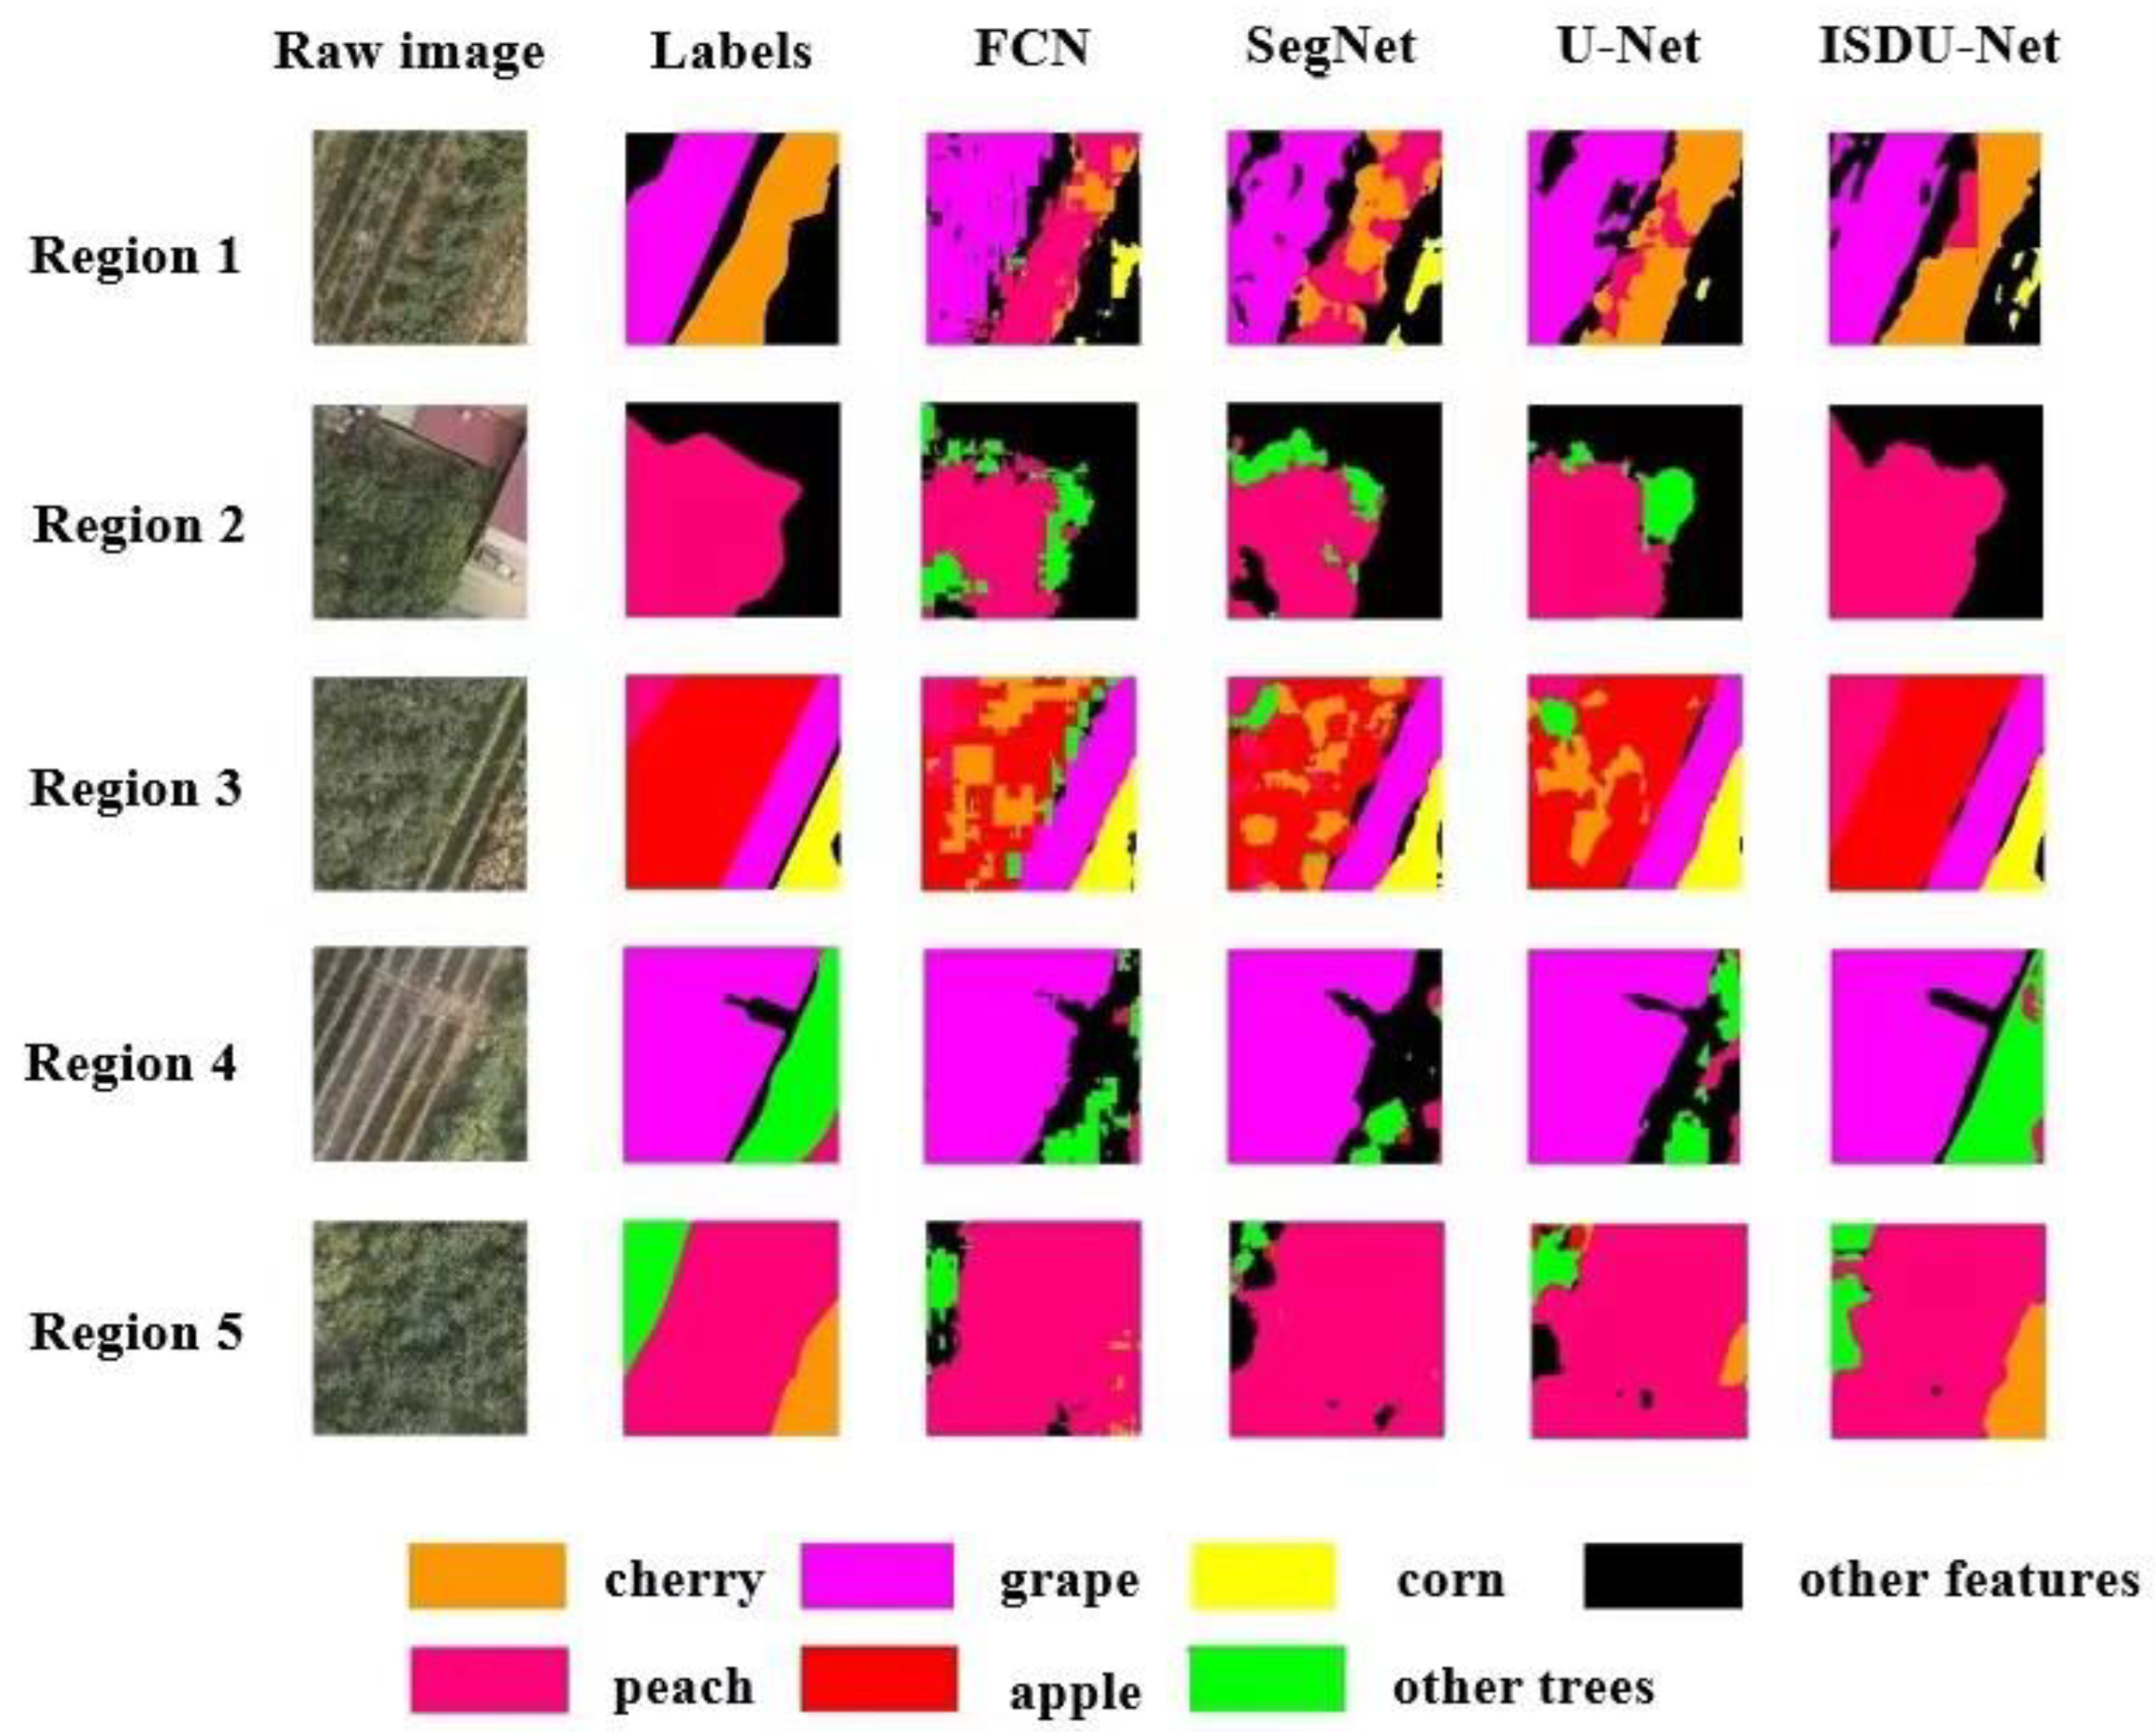
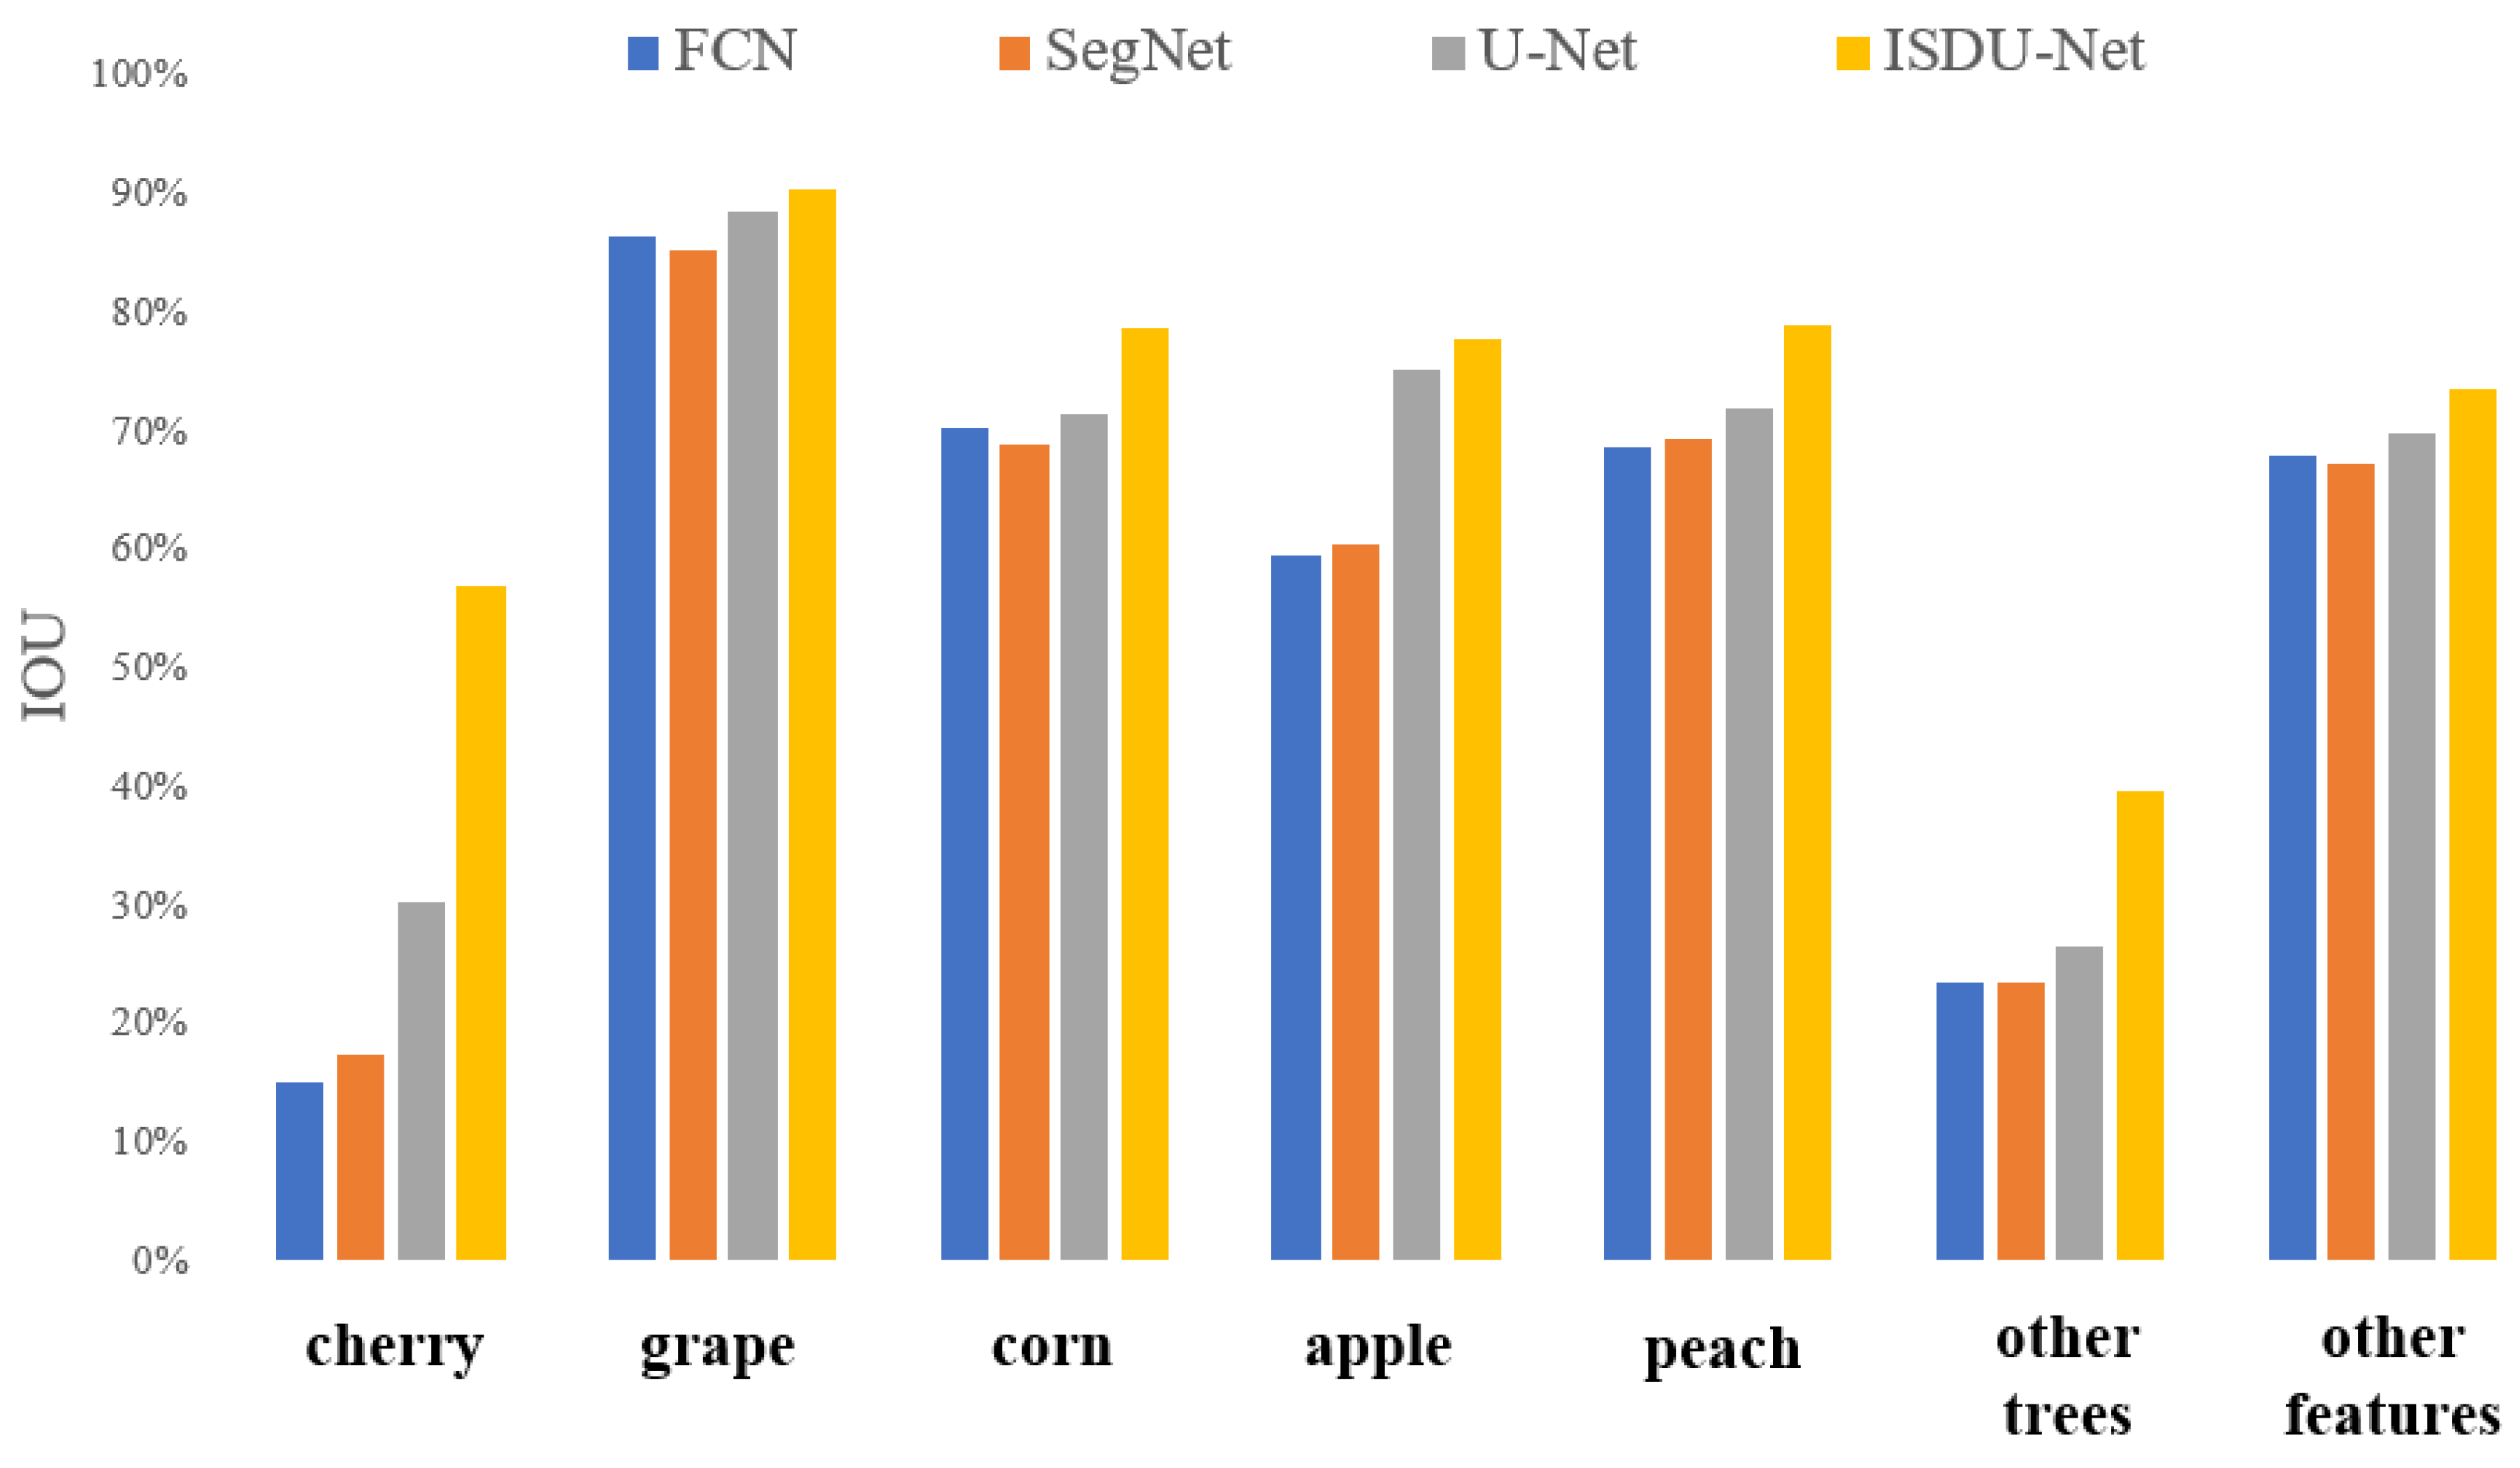
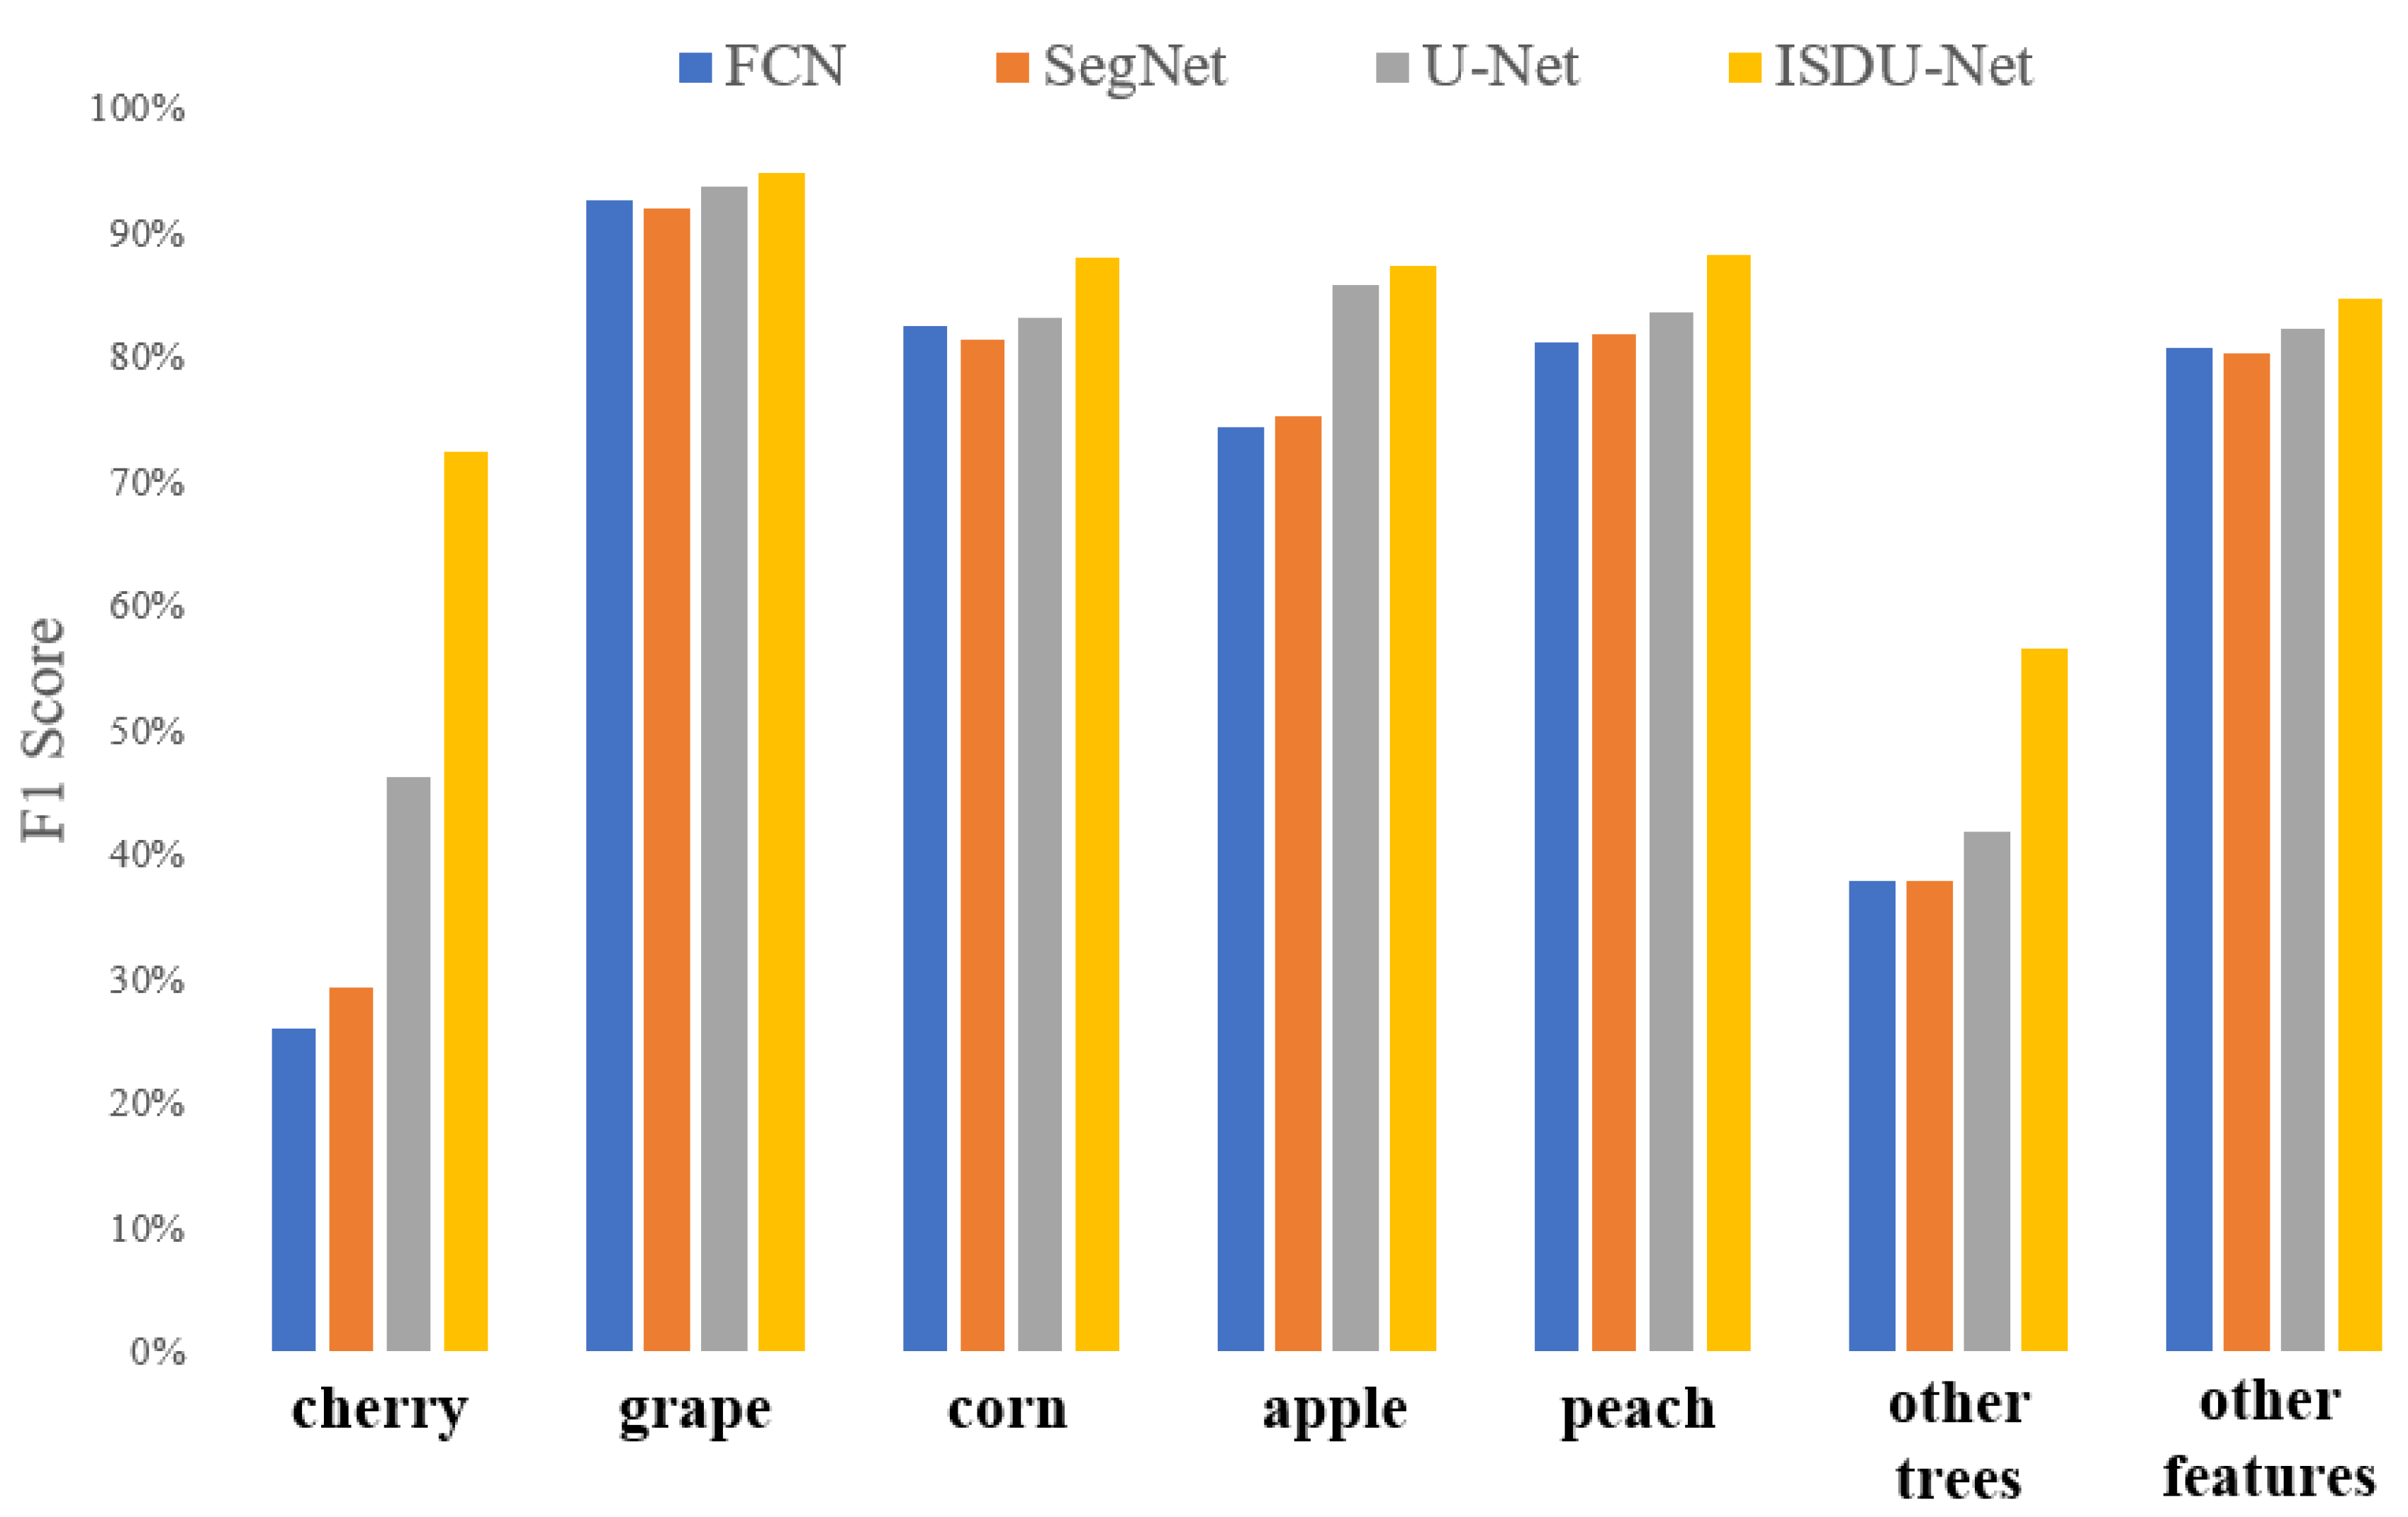
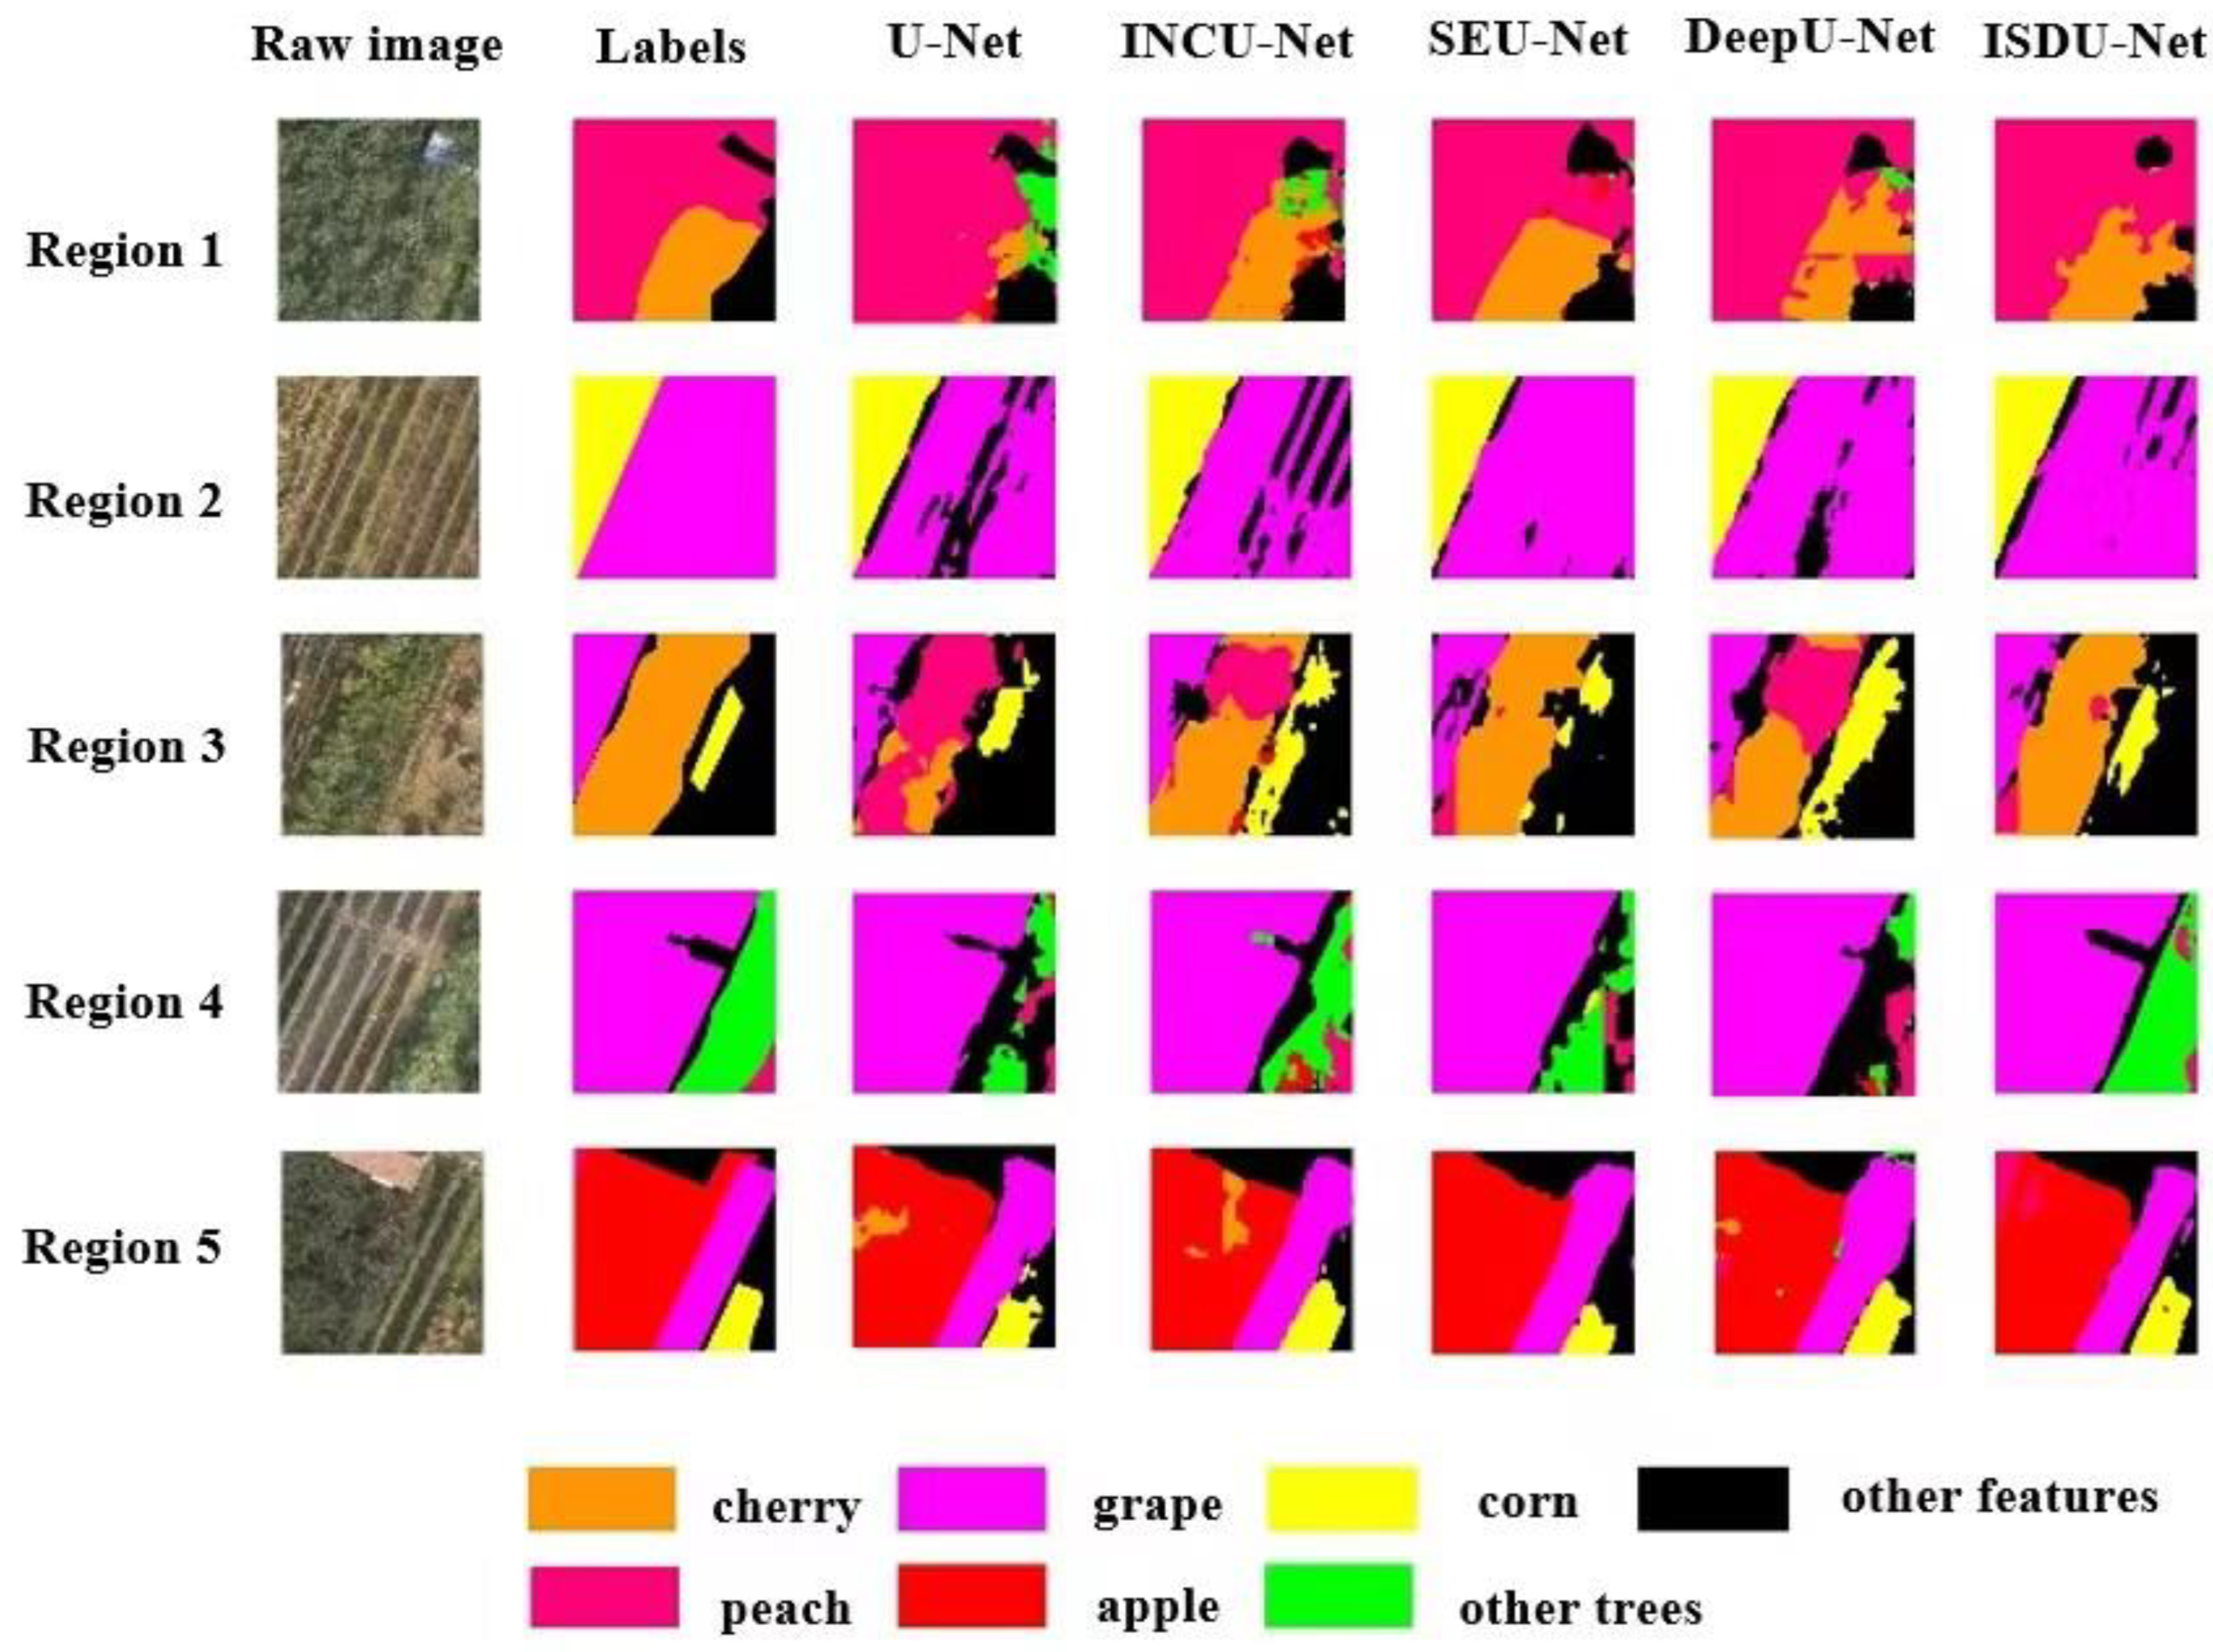
3.1. Comparative Analysis of Improved U-Net and Classical Network Model

The improved U-Net model was named ISDU-Net, and ISDU-Net was compared with the FCN, SegNet, and U-Net models to analyze the qualitative and quantitative results [51,52,53,54,55,56,57,58,59,60,61,62].
The prediction results of some typical regions of the test set for each model are shown in Figure 8. All four models could segment the approximate position and contour of the crop type, but the segmentation details were very different. The prediction results obtained by the FCN model were fragmented and grained significantly, the coherence of the same crop area was poor, and there were many misclassified pixel blocks. Compared with the FCN model, the SegNet model obtained more coherent prediction results and smoother boundaries, but it also had serious misclassification. Compared with the FCN and SegNet models, the U-Net and ISDU-Net models had better classification effects, which could effectively identify the crop boundary, and the segmented crop plots were coherent and complete, indicating that the fusion of different levels of semantic features could better identify the specific category details, but U-Net also had serious mixing of some categories. Compared with the other three models, the ISDU-Net model had a better effect, could effectively distinguish different crops, and the segmentation plots were complete and coherent with less misclassification.
Figure 9 shows that the evaluation results of the U-Net model in the test set were significantly higher than those of the FCN and SegNet models. It can be seen from Table 4 that the pixel accuracy, mean intersection over union, frequency weight intersection over union, and Kappa coefficient of ISDU-Net on the test set were 3.19%, 8.90%, 4.51%, and 0.05 higher than the U-Net model, and all the evaluation indicators were improved, proving that after adding the Inception Module and SE-Block Module and deepening the network to the U-Net model, the network could obtain more effective information so as to obtain a better classification effect.
The classification intersection over union of each model for different category classifications is shown in Table 5 and Figure 10. The ISDU-Net achieved different degrees of improvement compared with U-Net. The accuracy of the cherry prediction results was significantly improved, which was 26.85% higher than that of the U-Net model. Grapes had the best overall classification effect among all models, with less misclassification and mixing, and were only mixed at the edge of the plot and the edge of other features. The ISDU-Net was 1.88% higher than the U-Net. The classification accuracies of corn, apple, and peach were improved by 7.25%, 2.53%, and 7.11%, respectively, and ISDU-Net improved the classification effect of other trees by 13.07% and other features by 3.67% compared with the U-Net model.
The F1 scores of each model for the different categories are shown in Table 6 and Figure 11. The accuracy of ISDU-Net for cherry prediction results was significantly improved, which was 26.34% higher than that of the U-Net model. The overall classification effect of grape was the best, and the ISDU-Net model was 1.04% higher than that of the U-Net model. The ISDU-Net model improved the classification accuracy of corn, apple, and peach, which was 4.74%, 1.62%, and 4.63% higher than that of the U-Net model, respectively. In addition, the classification effect of other trees significantly improved by 14.82%, and that of other features increased by 2.47%. In general, the ISDU-Net model improved the classification effect of all categories.
From the confusion matrix of the three models in Table 7, Table 8 and Table 9, it can be seen that the U-Net model was better than the FCN and SegNet models in terms of the number of correct classifications of grape, apple, peach, and other features, whereas SegNet was slightly better than the U-Net model in terms of the number of correct classifications of cherry and corn. Among the other trees, the FCN had a slight advantage over the U-Net. In terms of the number of correct classifications of each class of the three basic models, the overall classification accuracy of the U-Net model was higher, but it was slightly inferior for the classification of small samples. In Table 7, Table 8, Table 9 and Table 10, the ISDU-Net model was slightly inferior to the U-Net model for other features, but it was better than the FCN, SegNet, and U-Net models in terms of the number of correct classifications of the other five categories. The improved model improved the overall learning ability at the same time, and compared with the basic U-Net model, the learning ability of small samples was improved significantly.

3.2. Comparative Analysis of Improved U-Net Optimization Model

The ablation experiment was used to analyze the influence of each module on the original model. Each module was embedded into the U-Net model separately using the control variable method for training and testing, and the test results were compared with the test results of the original model to determine the gain effect of each module on the model.
The original U-Net model was compared with the U-Net model embedded with the Inception Module alone (INCU-Net), SE-Block Module alone (SEU-Net), network deepening alone (DeepU-Net), overall improved U-Net (ISDU-Net), and the difference between the predictions of the model on the test set, respectively. The prediction results of some typical regions of the test set for each model are shown in Figure 12. The U-Net network with the Inception Module alone shows a great improvement in the recognition effect compared with U-Net for categories with a small sample size. The SE-Block Module was introduced separately, the fragmentation degree of each type of block was lower, and the details and integrity of the various types of identification were improved. Increasing the network depth alone increased the accuracy of cherry identification.
For INCU-Net, Table 11 shows that, compared with the U-Net model, the pixel accuracy, average intersection over union, frequency weight intersection over union, and Kappa coefficient increased by 1.64%, 6.21%, 2.12%, and 0.03, respectively. For SEU-Net, it can be seen from Table 11 that its pixel accuracy, average intersection over union, frequency weight intersection over union, and Kappa coefficient increased by 1.54%, 4.40%, 2.11%, and 0.02, respectively, compared with the U-Net model. For DeepU-Net, it can be seen from Table 11 that its pixel accuracy, average intersection over union, frequency weight intersection over union, and Kappa coefficient increased by 1.66%, 4.81%, 1.98%, and 0.03, respectively, compared with the U-Net model. The line chart of the accuracy evaluation results of each model is shown in Figure 13.
The intersection over union of each model classification is shown in Table 12 and Figure 14. The U-Net network had a poor classification effect for cherry and other trees, and the intersection over union of cherry and other trees in the INCU-Net model increased by 24.38% and 10.02%, respectively, proving that the Inception Module played an important role in improving the classification accuracy of small sample categories. To a certain extent, widening the network could obtain more effective information and enhance the learning ability of the network for the categories with a small proportion. The addition of the SE-Block Module improved certain prediction effects for the different categories. Compared with the U-Net network, the classification intersection over union of the SEU-Net model for grape and peach significantly improved by 1.07% and 5.05%, respectively, proving that increasing the model’s attention to each feature channel could effectively improve its learning ability. The model prediction was more refined and complete. The DeepU-Net model significantly improved the classification intersection over union of corn, apple, and other features compared with the U-Net network, which increased by 4.47%, 1.22%, and 1.66%, respectively, proving that deepening the network could lead to learning more feature differences so as to obtain better classification accuracy.
Table 13 and Figure 15 show that the U-Net network, after introducing the Inception Module, increased the F1 scores of the cherry and other tree classifications by 24.30% and 11.61%, respectively. The U-Net network with SE-Block improved the prediction effect for different categories, except for apples. Compared with U-Net, DeepU-Net had an F1 score for cherry and other trees that increased by 20.75% and 5.44%, respectively, and the classification effect of other features also improved. The ISDU-Net model improved the classification effect of all categories after integrating the advantages of the above models.

3.3. Analysis of the Influence of Network Parameters on Classification Accuracy

(1) Control experiments with different initial learning rates
To determine the appropriate learning rate, a control trial was conducted by modifying only the initial learning rate while keeping the other hyperparameters unchanged. Adam optimizer was used to train the model, which could automatically adjust the learning rate during the training process, had high computational efficiency, and requires small memory. The Early Stopping mechanism was used to determine whether the loss function of the model validation set decreases or not, and the model training was stopped automatically when the loss function did not decrease for many consecutive times to prevent overfitting. In the experiment, the initial learning rates were set as 0.01, 0.001, 0.0001, and 0.00001 for comparison. The evaluation results of the models with different learning rate settings on the test set are shown in Table 14 and Figure 16.
According to the evaluation results of the test set, when the initial learning rate was set to 0.0001, each accuracy evaluation index was better than the other values, so the initial learning rate of the experimental model was set to 0.0001.
(2) Control test of different batch sizes
To determine the appropriate training batch size, only the batch size was modified for the control test while keeping the other hyperparameters unchanged. According to the actual hardware situation and model volume, the training batch size was set to 4, 6, 8, and 10 for comparison. The evaluation results of the models with different batch size settings on the test set are shown in Table 15 and Figure 17.
According to the evaluation results of the test set, when the batch size was set to 8, each accuracy evaluation index was better than the other values, so the batch size of this experimental model was set to 8.
The best learning rate (0.0001) and the best batch size (8) were applied to the ISDU-Net models in Section 3.1 and Section 3.2.

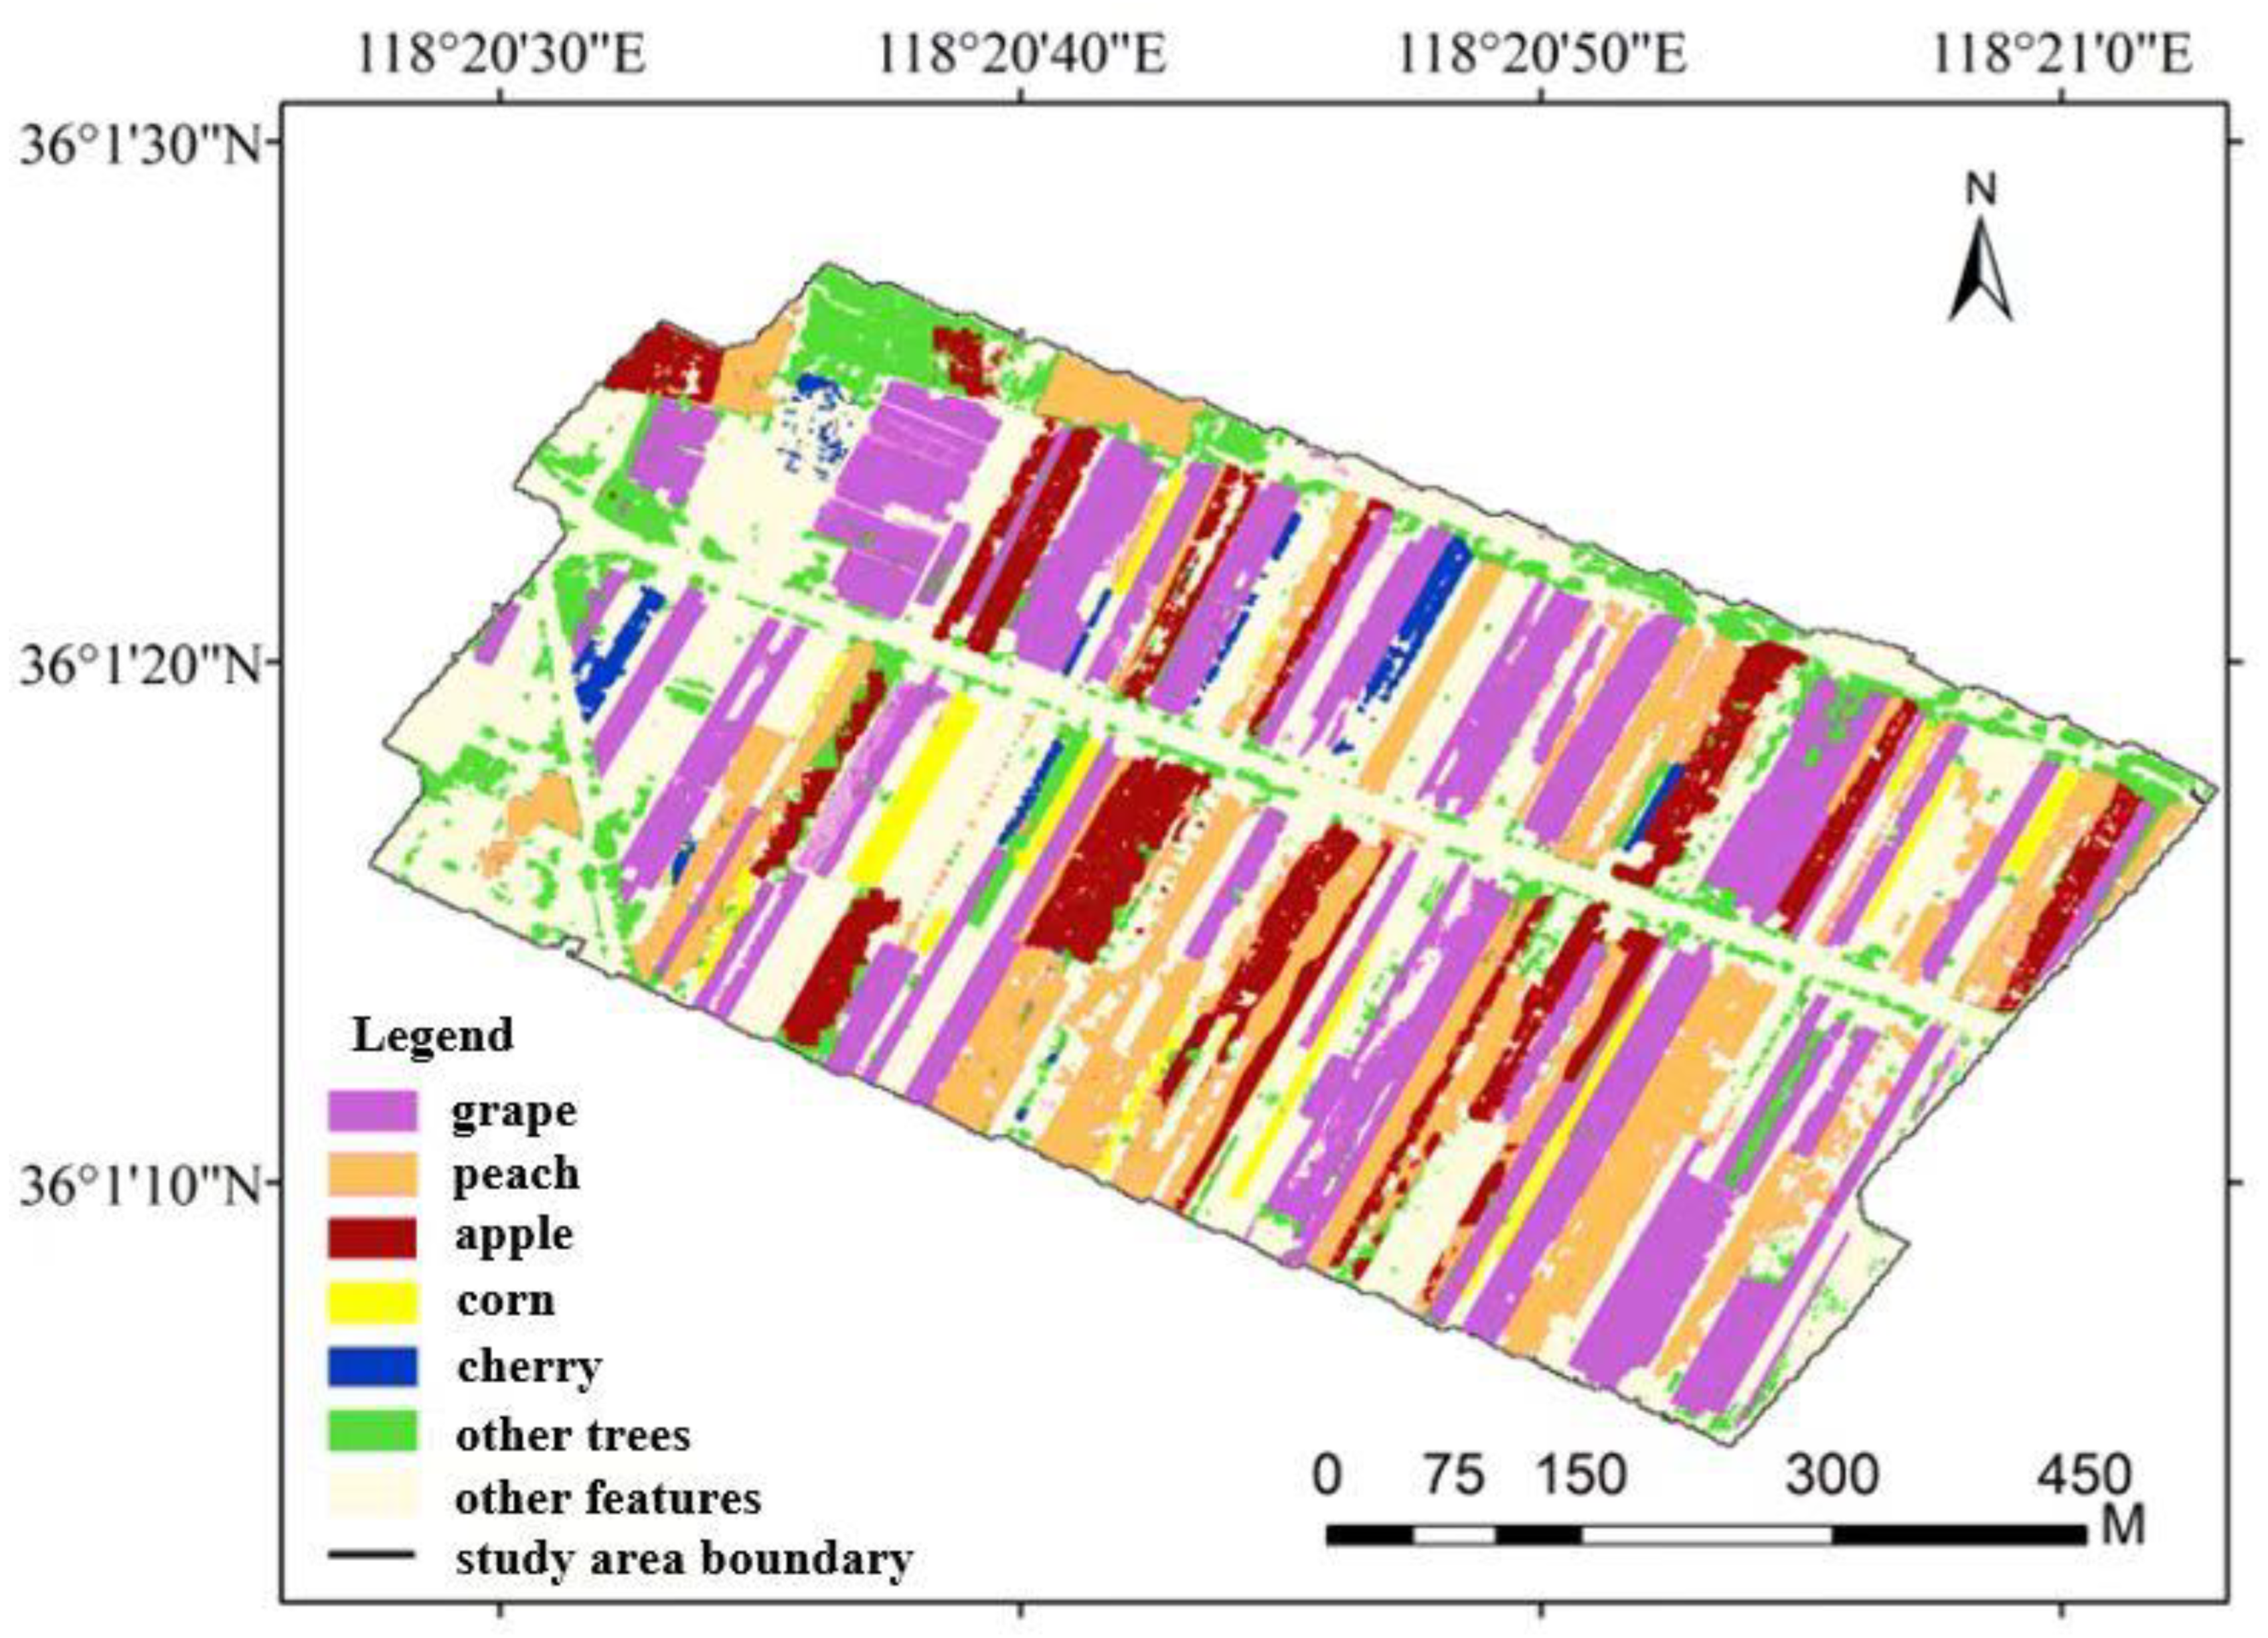
3.4. Classification and Mapping of Economic Fruit Forests in the Study Area

According to the optimal model and parameters, the fruit forest crops in the study area were classified and mapped, and the results are shown in Figure 18. As can be seen from Figure 18, the grape planting area is the largest, followed by the peach and apple planting areas, and the cherry and corn planting areas are the smallest. The fruit trees were planted in strips and arranged at intervals, whereas the non-fruit trees were mostly located on both sides of the road and were sparse.
According to a comparison of the actual planting situation in the study area, it was found that the overall recognition effect of grapes was good, and there was basically no mixing. Peaches were mixed with cherries, apples, or other trees to different degrees, and were most easily confused with other trees. Apples were also partially identified as cherries or other trees, and the overall situation of corn was relatively good, with a small amount of mixed classification with other features. Due to the small proportion of cherries and their similar morphology to peaches, the recognition accuracy of cherries was lower than that of other features. On the whole, all kinds of plots were clearly identified, the boundaries were clear, and the planting distribution was in line with the actual situation.

4. Discussion

In this study, an improved U-Net model was constructed to classify economic fruit forests in the study area, which achieved a high classification accuracy. However, there are still shortcomings. The thinking behind this research and the next research direction are summarized below:
(1) Data acquisition time
The UAV data collection time in this experiment was in early October, which was the harvest season for apples. Corn was in the dry leaf stage, and its characteristics were obviously different from those of other crops. Peaches, cherries, and other trees were in the full leaf stage, and there might be little difference in shape and texture. Phenology can be used to collect data when the phenology of each crop is quite different, or multi-temporal image datasets can also be used, which can effectively improve the classification accuracy in theory.
(2) Learning balance
The dataset of this study involved a variety of crop categories. In order to ensure the training effect of the deep learning model, the UAV image data obtained were utilized to the maximum without considering the quantity balance of various samples. In practical applications, the semantic segmentation of multiple categories often encounters the same problem; it is difficult to obtain balance because of the small amount of data in some categories or the high cost of constructing balanced category datasets. To solve this problem, this study proposes an improved U-Net model. Although the classification effect greatly improved in the category of a small sample size, the accuracy was still low compared with other features of a large sample size. How to balance the learning performance of the model for various samples by building modules or adjusting the model remains to be studied.
(3) Lightweight model
In order to improve the segmentation accuracy of small sample types, this study adopted a variety of ways to modify the network structure to widen and deepen the network, which could learn more effective features through a larger receptive field. Although some operations were adopted to limit the number of parameters, the model volume was still large and the computational memory consumption was still large due to the overall structural characteristics of U-Net. With the development of various research fields, the lightweight model may become a more noteworthy target. For example, when the UAV is applied in agriculture, if the UAV is equipped with a high-precision model of real-time classification, it will provide greater convenience for scientific research or practical applications. A smaller volume of deep learning models can be investigated without changing the accuracy.
(4) Unsupervised semantic segmentation model
At present, the construction of a semantic segmentation dataset requires manual labeling of a large number of sample labels, and pixel-based labeling is time-consuming and laborious. How to reduce the annotation effort or use unsupervised learning for the semantic segmentation of images can be the focus of subsequent research.
(5) Identification model of high and low yield economic fruit forest
The economic fruit forest in the study area selected in this paper had high local yields, and the economic fruit forest with low yields was not covered. However, the crop yield may also determine the identification method and its difficulty. Future research can focus on the identification of economic fruit forests with low yields, and a model satisfying the identification of both high-yield and low-yield economic fruit forests can be explored.

5. Conclusions

Based on UAV high-resolution multispectral remote sensing images, this study optimized the network structure and parameters based on the U-Net model and carried out crop identification and classification research on an economic fruit forest farmland in Zhongzhuang Town, Yiyuan County, Shandong Province. The following conclusions were obtained:
(1) The semantic segmentation dataset of the UAV multi-spectral economic fruit forest constructed in this paper solved the problem of a few relevant public datasets.
At present, there are few public datasets based on semantic segmentation tasks involving remote sensing images. Most remote sensing semantic segmentation datasets are satellite image datasets with low image resolution, and the main classification system is constructed based on land use types. A small number of UAV datasets only have RGB band images, and there is a serious lack of crop-related semantic segmentation in public datasets. In this study, multi-band UAV remote sensing images were obtained through field collection and processing, and combined with field sample positioning, various crops were manually labeled, label images were generated, and images and labels were cut and augmented. The semantic segmentation dataset of UAV remote sensing fruit forest crop multi-spectral images was constructed to fill the gaps in related datasets.
(2) This paper compared and analyzed classical semantic segmentation models, and determined that U-Net was better in crop classification tasks. Using the classification method based on the U-Net network structure constructed in this paper, fruit forest crops can be accurately classified.
In this study, an improved U-Net semantic segmentation model, ISDU-Net, was constructed for the situation where it is difficult to learn the features of categories with a small sample size. The experimental results showed that the pixel accuracy, mean intersection over union, frequency weight intersection over union, and Kappa coefficient of the ISDU-Net on the test set were 87.73%, 70.68%, 78.69%, and 0.84, respectively, which were improved compared with those of the U-Net model for all evaluation indicators. It was proved that the U-Net could effectively improve the learning ability of the model and obtain better prediction results after adding the Inception Module and SE-Block Module and deepening the network. After adjusting the parameters of the improved model, the initial learning rate and batch size of the model were determined, and the fruit forest crop classification and mapping in the study area were realized. The ISDU-Net has been greatly improved in many aspects, which can provide a reference for crop classification research.

Author Contributions

Conceptualization, C.W. and J.Y.; methodology, W.J.; software, W.J.; validation, W.J., T.Z. and A.D.; writing—original draft preparation, C.W. and J.Y.; writing—review and editing, C.W., W.J. and J.Y.; visualization, W.J. and H.Z.; supervision, J.Y. and T.Z.; project administration, C.W., J.Y. and A.D. All authors have read and agreed to the published version of the manuscript.

Funding

This research was funded by the National Key R&D Program of China “study on farmland utilization dynamic monitoring and grain Productivity Evaluation Technology”, through grant 2022YFB3903504. The funding unit is the Ministry of Science and Technology of the People’s Republic of Chinese.

Data Availability Statement

The data presented in this study are available upon request from the corresponding authors.

Conflicts of Interest

The authors declare no conflict of interest.

References

  1. Wang, Q.; Sun, B.; Xiong, M.; Yang, Y. Effects of different economic fruit forests on soil nutrients in Qingxi small watershed. IOP Conf. Series. Earth Environ. Sci. 2019, 295, 42118. [Google Scholar] [CrossRef]
  2. Deng, X.; Shu, H.; Hao, Y.; Xu, Q.; Han, M.; Zhang, S.; Duan, C.; Jiang, Q.; Yi, G.; Chen, H. Review on the Centennial Development of Pomology in China. J. Agric. 2018, 8, 24–34. [Google Scholar]
  3. Liu, F.; Wang, H.; Hu, C. Current situation of main fruit tree industry in China and it’s development countermeasure during the “14th five-year plan” period. China Fruits 2021, 1, 1–5. [Google Scholar] [CrossRef]
  4. Ma, J.; Li, F.; Zhang, H.; Khan, N. Commercial cash crop production and households’ economic welfare: Evidence from the pulse farmers in rural China. J. Integr. Agric. 2022, 21, 3395–3407. [Google Scholar] [CrossRef]
  5. Li, J.; Zhang, Z.; Jin, X.; Chen, J.; Zhang, S.; He, Z.; Li, S.; He, Z.; Zhang, H.; Xiao, H. Exploring the socioeconomic and ecological consequences of cash crop cultivation for policy implications. Land Use Policy 2018, 76, 46–57. [Google Scholar] [CrossRef]
  6. Su, S.; Zhou, X.; Wan, C.; Li, Y.; Kong, W. Land use changes to cash crop plantations: Crop types, multilevel determinants and policy implications. Land Use Policy 2016, 50, 379–389. [Google Scholar] [CrossRef]
  7. Toosi, A.; Daass Javan, F.; Samadzadegan, F.; Mehravar, S.; Kurban, A.; Azadi, H. Citrus orchard mapping in Juybar, Iran: Analysis of NDVI time series and feature fusion of multi-source satellite imageries. Ecol. Inform. 2022, 70, 1–23. [Google Scholar] [CrossRef]
  8. Zhang, J.; Xu, S.; Zhao, Y.; Sun, J.; Xu, S.; Zhang, X. Aerial orthoimage generation for UAV remote sensing: Review. Inf. Fusion 2023, 89, 91–120. [Google Scholar] [CrossRef]
  9. Liao, X.; Zhang, Y.; Su, F.; Yue, H.; Ding, Z.; Liu, J. UAVs surpassing satellites and aircraft in remote sensing over China. Int. J. Remote Sens. 2018, 39, 7138–7153. [Google Scholar] [CrossRef]
  10. Sishodia, R.P.; Ray, R.L.; Singh, S.K. Applications of Remote Sensing in Precision Agriculture: A Review. Remote Sens. 2020, 12, 3136. [Google Scholar] [CrossRef]
  11. Córcoles, J.I.; Ortega, J.F.; Hernández, D.; Moreno, M. Estimation of leaf area index in onion (Allium cepa L.) using an unmanned aerial vehicle. Biosyst. Eng. 2013, 115, 31–42. [Google Scholar] [CrossRef]
  12. Ballesteros, R.; Ortega, J.F.; Hernández, D.; Moreno, M. Applications of georeferenced high-resolution images obtained with unmanned aerial vehicles. Part I: Description of image acquisition and processing. Precis. Agric. 2014, 15, 579–592. [Google Scholar] [CrossRef]
  13. Lelong, C.C.; Burger, P.; Jubelin, G.; Roux, B.; Labbé, S.; Baret, F. Assessment of Unmanned Aerial Vehicles Imagery for Quantitative Monitoring of Wheat Crop in Small Plots. Sensors 2008, 8, 3557–3585. [Google Scholar] [CrossRef] [PubMed]
  14. Ye, H.; Huang, W.; Huang, S.; Cui, B.; Dong, Y.; Guo, A.; Ren, Y.; Jin, Y. Recognition of Banana Fusarium Wilt Based on UAV Remote Sensing. Remote Sens. 2020, 12, 938. [Google Scholar] [CrossRef]
  15. Nevalainen, O.; Honkavaara, E.; Tuominen, S.; Viljanen, N.; Hakala, T.; Yu, X.; Hyyppä, J.; Saari, H.; Pölönen, I.; Imai, N.; et al. Individual Tree Detection and Classification with UAV-Based Photogrammetric Point Clouds and Hyperspectral Imaging. Remote Sens. 2017, 9, 185. [Google Scholar] [CrossRef]
  16. Deng, X.; Tong, Z.; Lan, Y.; Huang, Z. Detection and Location of Dead Trees with Pine Wilt Disease Based on Deep Learning and UAV Remote Sensing. AgriEngineering 2020, 2, 294–307. [Google Scholar] [CrossRef]
  17. Yang, Z.; Yu, X.; Dedman, S.; Rosso, M.; Zhu, J.; Yang, J.; Xia, Y.; Tian, Y.; Zhang, G.; Wang, J. UAV remote sensing applications in marine monitoring: Knowledge visualization and review. Sci. Total Environ. 2022, 838 Pt 1, 155939. [Google Scholar] [CrossRef]
  18. Jiao, L.; Zhao, J. A Survey on the New Generation of Deep Learning in Image Processing. IEEE Access 2019, 7, 172231–172263. [Google Scholar] [CrossRef]
  19. Xu, F.; Hu, C.; Li, J.; Plaza, A.; Datcu, M. Special focus on deep learning in remote sensing image processing. Sci. China Inf. Sci. 2020, 63, 140300. [Google Scholar] [CrossRef]
  20. Li, L.; Han, L.; Ding, M.; Cao, H.; Hu, H. A deep learning semantic template matching framework for remote sensing image registration. ISPRS J. Photogramm. Remote Sens. 2021, 181, 205–217. [Google Scholar] [CrossRef]
  21. Osco, L.P.; Marcato Junior, J.; Marques Ramos, A.P.; Castro Jorge, L.A.; Narges Fatholahi, S.; Andrade Silva, J.; Matsubara, E.T.; Pistori, H.; Gonçalves, W.N.; Li, J. A review on deep learning in UAV remote sensing. Int. J. Appl. Earth Obs. Geoinf. 2021, 102, 102456. [Google Scholar] [CrossRef]
  22. de Oliveira, R.P.; Barbosa Júnior, M.R.; Pinto, A.A.; Pereira Oliveira, J.L.; Zerbato, C.; Angeli Furlani, C.E. Predicting Sugarcane Biometric Parameters by UAV Multispectral Images and Machine Learning. Agronomy 2022, 12, 1992. [Google Scholar] [CrossRef]
  23. Parsons, M.; Bratanov, D.; Gaston, K.J.; Gonzalez, F. UAVs, Hyperspectral Remote Sensing, and Machine Learning Revolutionizing Reef Monitoring. Sensors 2018, 18, 2026. [Google Scholar] [CrossRef] [PubMed]
  24. Sun, Q.; Zhang, R.; Chen, L.; Zhang, L.; Zhang, H.; Zhao, C. Semantic segmentation and path planning for orchards based on UAV images. Comput. Electron. Agric. 2022, 200, 107222. [Google Scholar] [CrossRef]
  25. Wang, T.; Thomasson, J.A.; Yang, C.; Isakeit, T.; Nichols, R. Automatic Classification of Cotton Root Rot Disease Based on UAV Remote Sensing. Remote Sens. 2020, 12, 1310. [Google Scholar] [CrossRef]
  26. Li, G.; Han, W.; Huang, S.; Ma, W.; Ma, Q.; Cui, X. Extraction of Sunflower Lodging Information Based on UAV Multi-spectral Remote Sensing and Deep Learning. Remote Sens. 2021, 13, 2721. [Google Scholar] [CrossRef]
  27. Haq, M.A.; Rahaman, G.; Baral, P.; Ghosh, A. Deep Learning Based Supervised Image Classification Using UAV Images for Forest Areas Classification. J. Indian Soc. Remote Sens. 2021, 49, 601–606. [Google Scholar] [CrossRef]
  28. Kwak, G.; Park, N. Impact of Texture Information on Crop Classification with Machine Learning and UAV Images. Appl. Sci. 2019, 9, 643. [Google Scholar] [CrossRef]
  29. Bah, M.; Hafiane, A.; Canals, R. Deep Learning with Unsupervised Data Labeling for Weed Detection in Line Crops in UAV Images. Remote Sens. 2018, 10, 1690. [Google Scholar] [CrossRef]
  30. Reedha, R.; Dericquebourg, E.; Canals, R.; Hafiane, A. Transformer Neural Network for Weed and Crop Classification of High Resolution UAV Images. Remote Sens. 2022, 14, 592. [Google Scholar] [CrossRef]
  31. Anagnostis, A.; Tagarakis, A.C.; Kateris, D.; Moysiadis, V.; Sørensen, C.G.; Pearson, S.; Bochtis, D. Orchard Mapping with Deep Learning Semantic Segmentation. Sensors 2021, 21, 3813. [Google Scholar] [CrossRef]
  32. Niu, Z.; Deng, J.; Zhang, X.; Zhang, J.; Pan, S.; Mu, H. Identifying the Branch of Kiwifruit Based on Unmanned Aerial Vehicle (UAV) Images Using Deep Learning Method. Sensors 2021, 21, 4442. [Google Scholar] [CrossRef] [PubMed]
  33. Hu, G.; Wang, T.; Wan, M.; Bao, W.; Zeng, W. UAV remote sensing monitoring of pine forest diseases based on improved Mask R-CNN. Int. J. Remote Sens. 2022, 43, 1274–1305. [Google Scholar] [CrossRef]
  34. Egli, S.; Höpke, M. CNN-Based Tree Species Classification Using High Resolution RGB Image Data from Automated UAV Observations. Remote Sens. 2020, 12, 3892. [Google Scholar] [CrossRef]
  35. Liu, Z.; Su, B.; Lv, F. Intelligent Identification Method of Crop Species Using Improved U-Net Network in UAV Remote Sensing Image. Sci. Program. 2022, 2022, 9717843. [Google Scholar] [CrossRef]
  36. Zhang, H.; Du, H.; Zhang, C.; Zhang, L. An automated early-season method to map winter wheat using time-series Sentinel-2 data: A case study of Shandong, China. Comput. Electron. Agric. 2021, 182, 105962. [Google Scholar] [CrossRef]
  37. Wang, L.; Wu, C.; Li, X. Suitability Evaluation of Apple Planting Area in Shandong Province Based on GIS and AHP. J. Shandong Agric. Univ. 2022, 53, 531–537. [Google Scholar]
  38. Wang, J.; Yang, X.; Wang, Z.; Ge, D.; Kang, J. Monitoring Marine Aquaculture and Implications for Marine Spatial Planning—An Example from Shandong Province, China. Remote Sens. 2022, 14, 732. [Google Scholar] [CrossRef]
  39. Ou, C.; Yang, J.; Du, Z.; Zhang, T.; Niu, B.; Feng, Q.; Liu, Y.; Zhu, D. Landsat-Derived Annual Maps of Agricultural Greenhouse in Shandong Province, China from 1989 to 2018. Remote Sens. 2021, 23, 4830. [Google Scholar] [CrossRef]
  40. Chaudhry, M.H.; Ahmad, A.; Gulzar, Q. Impact of UAV Surveying Parameters on Mixed Urban Landuse Surface Modelling. ISPRS Int. J. Geo-Inf. 2020, 9, 656. [Google Scholar] [CrossRef]
  41. Bie, D.; Li, D.; Xiang, J.; Li, H.; Kan, Z.; Sun, Y. Design, aerodynamic analysis and test flight of a bat-inspired tailless flapping wing unmanned aerial vehicle. Aerosp. Sci. Technol. 2021, 112, 106557. [Google Scholar] [CrossRef]
  42. Guimarães, N.; Pádua, L.; Marques, P.; Silva, N.; Peres, E.; Sousa, J.J. Forestry Remote Sensing from Unmanned Aerial Vehicles: A Review Focusing on the Data, Processing and Potentialities. Remote Sens. 2020, 12, 1046. [Google Scholar] [CrossRef]
  43. Hao, Z.; Post, C.J.; Mikhailova, E.A.; Lin, L.; Liu, J.; Yu, K. How Does Sample Labeling and Distribution Affect the Accuracy and Efficiency of a Deep Learning Model for Individual Tree-Crown Detection and Delineation. Remote Sens. 2022, 7, 1561. [Google Scholar] [CrossRef]
  44. Ma, D.; Tang, P.; Zhao, L. SiftingGAN: Generating and Sifting Labeled Samples to Improve the Remote Sensing Image Scene Classification Baseline In Vitro. IEEE Geosci. Remote Sens. Lett. 2019, 7, 1046–1050. [Google Scholar] [CrossRef]
  45. Yang, M.; Tseng, H.H.; Hsu, Y.C.; Yang, C.Y.; Lai, M.H.; Wu, D.H. A UAV Open Dataset of Rice Paddies for Deep Learning Practice. Remote Sens. 2021, 13, 1358. [Google Scholar] [CrossRef]
  46. Szegedy, C.; Liu, W.; Jia, Y.; Sermanet, P.; Reed, S.; Anguelov, D.; Erhan, D.; Vanhoucke, V.; Rabinovich, A. Going Deeper with Convolutions. arXiv 2014, arXiv:1409.4842. [Google Scholar]
  47. Hu, J.; Shen, L.; Albanie, S.; Sun, G.; Wu, E. Squeeze-and-Excitation Networks. IEEE Trans. Pattern Anal. Mach. Intell. 2020, 42, 2011–2023. [Google Scholar] [CrossRef] [PubMed]
  48. Liu, P.; Wei, Y.; Wang, Q.; Chen, Y.; Xie, J. Research on Post-Earthquake Landslide Extraction Algorithm Based on Improved U-Net Model. Remote Sens. 2020, 12, 894. [Google Scholar] [CrossRef]
  49. Tian, S.; Dong, Y.; Feng, R.; Liang, D.; Wang, L. Mapping mountain glaciers using an improved U-Net model with cSE. Int. J. Digit. Earth 2021, 15, 463–477. [Google Scholar] [CrossRef]
  50. Fan, X.; Yan, C.; Fan, J.; Wang, N. Improved U-Net Remote Sensing Classification Algorithm Fusing Attention and Multiscale Features. Remote Sens. 2022, 14, 3591. [Google Scholar] [CrossRef]
  51. Ji, S.; Zhang, Z.; Zhang, C.; Wei, S.; Lu, M. Learning discriminative spatiotemporal features for precise crop classification from multi-temporal satellite images. Int. J. Remote Sens. 2019, 41, 3162–3174. [Google Scholar] [CrossRef]
  52. Deng, T.; Fu, B.; Liu, M.; He, H.; Fan, D.; Li, L.; Huang, L.; Gao, E. Comparison of multi-class and fusion of multiple single-class SegNet model for mapping karst wetland vegetation using UAV images. Sci. Rep. 2022, 12, 13270. [Google Scholar] [CrossRef] [PubMed]
  53. Mohammadi, S.; Belgiu, M.; Stein, A. Improvement in crop mapping from satellite image time series by effectively supervising deep neural networks. ISPRS J. Photogramm. Remote Sens. 2023, 198, 272–283. [Google Scholar] [CrossRef]
  54. Wei, S.; Zhang, H.; Wang, C.; Wang, Y.; Xu, L. Multi-Temporal SAR Data Large-Scale Crop Mapping Based on U-Net Model. Remote Sens. 2019, 11, 68. [Google Scholar] [CrossRef]
  55. Yang, M.; Tseng, H.; Hsu, Y.; Tsai, H.P. Semantic Segmentation Using Deep Learning with Vegetation Indices for Rice Lodging Identification in Multi-date UAV Visible Images. Remote Sens. 2020, 12, 633. [Google Scholar] [CrossRef]
  56. Zunair, H.; Ben Hamza, A. Sharp U-Net: Depthwise convolutional network for biomedical image segmentation. Comput. Biol. Med. 2021, 136, 104699. [Google Scholar] [CrossRef]
  57. Pan, Z.; Xu, J.; Guo, Y.; Hu, Y.; Wang, G. Deep Learning Segmentation and Classification for Urban Village Using a Worldview Satellite Image Based on U-Net. Remote Sens. 2020, 12, 1574. [Google Scholar] [CrossRef]
  58. Colligan, T.; Ketchum, D.; Brinkerhoff, D.; Maneta, M. A Deep Learning Approach to Mapping Irrigation Using Landsat: IrrMapper U-Net. IEEE Trans. Geosci. Remote Sens. 2022, 60, 1–11. [Google Scholar] [CrossRef]
  59. Giang, T.; Dang, K.; Le, Q.; Nguyen, V.G.; Tong, S.S.; Pham, V.M. U-Net Convolutional Networks for Mining Land Cover Classification Based on High-Resolution UAV Imagery. IEEE Access 2020, 8, 186257–186273. [Google Scholar] [CrossRef]
  60. Martinez, J.; Rosa, L.; Feitosa, R.; Sanches, I.D.; Happ, P.N. Fully convolutional recurrent networks for multidate crop recognition from multitemporal image sequences. ISPRS J. Photogramm. Remote Sens. 2021, 171, 188–201. [Google Scholar] [CrossRef]
  61. Rao, B.; Hota, M.; Kumar, U. Crop Classification from UAV-Based Multi-spectral Images Using Deep Learning. Comput. Vis. Image Process. 2021, 1376, 475–486. [Google Scholar] [CrossRef]
  62. Yan, C.; Fan, X.; Fan, J.; Wang, N. Improved U-Net Remote Sensing Classification Algorithm Based on Multi-Feature Fusion Perception. Remote Sens. 2022, 14, 1118. [Google Scholar] [CrossRef]
Figure 1. Geographical map of the study area. (a) Location Map of Yiyuan County. (b) Drone imagery of the study area.
Remotesensing 15 02500 g001
Figure 2. Crop phenology in the study area.
Remotesensing 15 02500 g002
Figure 3. Flight path and operational images.
Remotesensing 15 02500 g003
Figure 4. Distribution of field sample points.
Remotesensing 15 02500 g004
Figure 5. Flowchart of sample set construction.
Remotesensing 15 02500 g005
Figure 6. Category label graph.
Remotesensing 15 02500 g006
Figure 7. Improved U-Net model structure.
Remotesensing 15 02500 g007
Figure 8. Typical area display of the prediction results of each model.
Remotesensing 15 02500 g008
Figure 9. Line chart of the accuracy evaluation results of each model.
Remotesensing 15 02500 g009
Figure 10. Bar chart of classification intersection over union results of each model.
Remotesensing 15 02500 g010
Figure 11. Histogram of F1 score results for classification of each model.
Remotesensing 15 02500 g011
Figure 12. Typical area display of the prediction results of each optimization model.
Remotesensing 15 02500 g012
Figure 13. Line chart of accuracy evaluation results of each optimization model.
Remotesensing 15 02500 g013
Figure 14. Bar chart of classification intersection over union results of each optimization model.
Remotesensing 15 02500 g014
Figure 15. Histogram of F1 score results for classification of each optimization model.
Remotesensing 15 02500 g015
Figure 16. Evaluation index change curves of different learning rate models in the test set.
Remotesensing 15 02500 g016
Figure 17. Evaluation index change curves of different batch size models in the test set.
Remotesensing 15 02500 g017
Figure 18. Classification of economic fruit forests in the study area.
Remotesensing 15 02500 g018
Table 1. UAV flight parameters.
OptionParameters
Resolution ratio5 cm/pix
Flight altitude95 m
Heading overlap rate70%
Lateral overlap rate50%
Flight speed5 m/s
Number of control points521
Flight distance10,669.0 m
Table 2. Labels correspond to RGB values.
Class of LandGrapePeachAppleCheeryCornOther
Trees
Other
Features
RGB value(255, 0, 255)(255, 0, 120)(255, 0, 0)(255, 150, 0)(255, 255, 0)(0, 255, 0)(0, 0, 0)
Table 3. Experimental software and hardware environment.
ContentHardware and Software Parameters
CPUIntel(R) Xeon(R) Gold 5218 CPU @ 2.30 GHz
GPUNvidia GeForce RTX 2080 Ti 10 G×2
Running memory128 G
Operating systemLinux 4.15.0
Computing platformCUDA 10.1 + cuDNN 7.6.5
Development languagePython 3.7.10
Processing platforms and frameworksTensorflow 1.14.0 + Keras 2.3.1
Table 4. Accuracy evaluation results of each model.
ModelPixel Accuracy/%Mean Intersection over Union/%Frequency Weight Intersection over Union/%Kappa
Coefficient
FCN81.4755.7470.360.75
SegNet81.3555.8670.020.75
U-Net84.5461.7874.180.79
ISDU-Net87.7370.6878.690.84
Table 5. Classification intersection over union results of each model.
ModelIoU (%)
CherryGrapeCornApplePeachOther
Trees
Other
Features
FCN14.9386.3470.1259.3168.4523.3067.73
SegNet17.2185.1868.7260.3169.1423.3367.11
U-Net29.9988.2871.2775.0371.7226.4169.73
ISDU-Net56.8490.1678.5277.5678.8339.4873.40
Table 6. F1 scores of each model classification.
ModelF1 Score (%)
CherryGrapeCornApplePeachOther
Trees
Other
Features
FCN25.9892.6782.4374.4681.2637.8080.76
SegNet29.3692.0081.4675.2481.7637.8480.32
U-Net46.1493.7883.2385.7483.5341.7982.17
ISDU-Net72.4894.8287.9787.3688.1656.6184.64
Table 7. Confusion matrix results of FCN model.
FCN
Confusion Matrix
Predicted Value
CherryGrapeCornApplePeachOther
Trees
Other
Features
True valuecherry38,21926791372081,827469942,638
grape4073,314,8783307259915,9118567226,266
corn1043439276,0792840245419,895
apple86,93126,5281813662,25248,52364,535161,605
peach58,3861523805278,3331,619,909120,330233,845
other trees190573,13258714,16647,808165,018163,304
other features19,293195,32171,18240,802125,90094,9312,999,177
Table 8. Confusion Matrix results of SegNet model.
SegNet
Confusion Matrix
Predicted Value
CherryGrapeCornApplePeachOther
Trees
Other
Features
True valuecherry59,25654560365278,320174828,159
grape29023,267,1044973604712,6838289269,937
corn2142813280,070492457738115,076
apple89,39130,0073447687,35551,25928,299162,429
peach56,256372196991,9781,664,24176,622228,940
other trees910724,563210718,82078,901142,616189,806
other features21,319168,981101,80142,857132,57591,1142,987,959
Table 9. Confusion matrix results of U-Net model.
U-Net
Confusion Matrix
Predicted Value
CherryGrapeCornApplePeachOther
Trees
Other
Features
True valuecherry56,45412106938679,624201829,522
grape1223,412,449123681116,67214,784190,924
corn02606275,1210402859621,272
apple30,96326,9649211887,94330,25922,641128,466
peach43,47016713,05050,6991,703,47375,686166,763
other trees45864392580631,764164,79499,069
other features13,551203,362103,46141,259161,48773,3423,028,692
Table 10. Confusion matrix results of ISDU-Net model.
ISDU-Net
Confusion Matrix
Predicted Value
CherryGrapeCornApplePeachOther
Trees
Other
Features
True valuecherry152,10043228032,632159730,933
grape303,479,39334345711,15520,037119,805
corn7941364348,2031030332717833,876
apple14,11616,3635299931,75028,536899991,152
peach18,198569336945,9881,723,64153,381138,054
other trees04264078224,953227,871187,493
other features16,738218,79145,60956,823102,67151,3852,984,775
Table 11. Accuracy evaluation results of each optimization model.
ModelPixel Accuracy/%Average Intersection over Union/%Frequency Weight Intersection over Union/%Kappa Coefficient
U-Net84.5461.7874.180.79
INCU-Net86.1867.9976.300.82
SEU-Net86.0666.1876.290.81
DeepU-Net86.2066.5976.160.82
ISDU-Net87.7370.6878.690.84
Table 12. Classification intersection over union results of each optimization model.
ModelIoU (%)
CherryGrapeCornApplePeachOther
Trees
Other
Features
U-Net29.9988.2871.2775.0371.7226.4169.73
INCU-Net54.3787.9474.4875.7675.5636.4371.36
SEU-Net45.0889.3574.3671.9976.7734.5471.20
DeepU-Net48.0288.2775.7476.2575.5630.9171.39
ISDU-Net56.8490.1678.5277.5678.8339.4873.40
Table 13. Classification F1 score results of each optimization model.
ModelF1 Score (%)
CherryGrapeCornApplePeachOther
Trees
Other
Features
U-Net46.1493.7883.2385.7483.5341.7982.17
INCU-Net70.4493.5885.3786.2186.0853.4083.29
SEU-Net62.1594.3785.3083.7186.8651.3583.18
DeepU-Net64.8993.7786.1886.5386.0847.2383.30
ISDU-Net72.4894.8287.9787.3688.1656.6184.64
Table 14. Evaluation results of different learning rate models in the test set.
Initial Learning RatePixel Accuracy/%Average Intersection over Union/%Frequency Weight Intersection over Union/%Kappa Coefficient
0.0180.4461.0369.280.74
0.00185.7869.4777.540.83
0.000187.7370.6878.690.84
0.0000186.3866.7176.360.82
Table 15. Evaluation results of different batch size models in the test set.
Batch SizePixel Accuracy/%Average Intersection over Union/%Frequency Weight Intersection over Union/%Kappa Coefficient
485.5665.6275.100.81
686.1869.4477.540.83
887.7370.6878.690.84
1085.9768.6376.110.83
Disclaimer/Publisher’s Note: The statements, opinions and data contained in all publications are solely those of the individual author(s) and contributor(s) and not of MDPI and/or the editor(s). MDPI and/or the editor(s) disclaim responsibility for any injury to people or property resulting from any ideas, methods, instructions or products referred to in the content.

