Abstract
Synthetic Aperture Radar (SAR) interferometry is a formidable technique to monitor surface deformation with a millimeter detection resolution. This study applies the Persistent Scatter-Interferometric Synthetic Aperture Radar (PSInSARTM) technique to measure ground subsidence related to a twin-tunnel excavation in downtown Los Angeles, USA. The PSInSARTM technique is suitable for urban settings because urban areas have strong reflectors. The twin tunnels in downtown Los Angeles were excavated beneath a densely urbanized area with variable overburden depths. In practice, tunneling-induced ground settlement is dominantly vertical. The vertical deformation rate in this study is derived by combining Line of Sight (LOS) deformation velocities obtained from SAR images from both ascending and descending satellite orbits. Local and uneven settlements up to approximately 12 mm/year along the tunnel alignment are observed within the allowable threshold. No severe damages to aboveground structures were reported. Furthermore, ground movements mapped one year before tunnel construction indicate that no concentrated ground settlements pre-existed. A Machine Learning (ML)-based permutation feature importance method is used for a parametric study to identify dominant factors associated with the twin-tunneling induced uneven ground subsidence. Six parameters are selected to conduct the parametric study, including overburden thickness, i.e., the thickness of artificial fill and alluvium soils above the tunnel springline, the distance between the two tunnel centerlines, the depth to the tunnel springline, building height, the distance to the tunnel, and groundwater level. Results of the parametric analysis indicate that overburden thickness, i.e., the thickness of artificial fill and alluvium soils above the tunnel springline, is the dominant contributing factor, followed by the distance between tunnel centerlines, depth to the tunnel springline, and building height. Two parameters, the distance to the tunnel, and the groundwater level, play lesser essential roles than others. In addition, the geological profile provides comprehension of unevenly distributed ground settlements, which are geologically sensitive and more concentrated in areas with thick artificial fill and alluvium soils, low tunnel depth, and high groundwater levels.
1. Introduction
Interferometric Synthetic Aperture Radar (InSAR) is a valuable geodetic technique to detect the Earth’s surface motion with millimeter accuracy [1], which is increasingly used to measure tunneling-induced surface deformation in urban areas [2,3]. While current tunneling technologies minimize the ground volume lost during excavation, ground movements cannot be avoided entirely. Deformation mapping from InSAR can cover areas well beyond the immediate surroundings of the excavation site, which can detect potentially unexpected deformation phenomena that may be linked to the construction works.
Conventional geodetic methods, such as total station, electrolevels, displacement gauges, and precision leveling, can measure limited areas along the tunnel alignment. However, due to the high cost of installing and maintaining ground-based monitoring systems, priority is typically given to vulnerable buildings or structures with high historical value [4,5]. Free satellite data and the InSAR technique can serve as a promising alternative in such a case [6,7]. Space-borne InSAR systems operate remotely and image large areas of the Earth’s surface every few days, providing large datasets of previously unavailable field observations. Basic InSAR technology, i.e., Differential Interferometric Synthetic Aperture Radar (DInSAR), compares the phase difference of two Synthetic Aperture Radar (SAR) images acquired over the same area at different times. Phase difference indicates the target motion occurring along the sensor-target Line of Sight (LOS) direction during that time interval. Advanced InSAR techniques provide more accurate displacement measurements by analyzing the phase information of a stack of SAR data acquired over the same area, i.e., Multi-Temporal InSAR (MT-InSAR) [8,9]. MT-InSAR can overcome the limitations of conventional InSAR, such as uncorrelated phase noises, and reduce errors in deformation estimates. A widely used MT-InSAR technique in urban civil engineering is the Persistent Scatterer InSAR (PSInSARTM) developed by Ferretti et al. [10]. The potential and capabilities of the PSInSARTM technique using Sentinel-1 data have been presented in many urban tunnel projects [11,12,13,14,15,16].
PSInSARTM identifies and monitors point-wise Permanent Scatterers (PS), whose pixels display both stable amplitude and a coherent phase throughout every dataset image. Specifically, PS is related to natural radar targets such as engineered structures, an un-vegetated Earth surface, rocky outcrops, concrete dikes, any linear structure that can reflect a signal back to the satellite, artificially placed corner reflectors, etc. These stable radar reflectors make the PSInSARTM technique suitable and effective to be applied in urban settings. Furthermore, the PSInSARTM technique provides broad coverage and a high density of information remotely, with hundreds of measurement points per square kilometer in urban environments.
Using Persistent Scatterer Interferometry (PSI), time-series deformation can be derived from terrestrial radar observations, such as average LOS velocity and cumulative deformation [17]. In addition, the PSInSARTM technique is suitable for areas with very slow (16 mm/year~1.6 m/year) or prolonged slow (<16 mm/year) displacements [18]. Slow movement with a few centimeters is the typical pattern induced by underground exaction in soft ground settings. In many urban tunnel cases not involving significant dewatering or being constructed in very soft clays like London clay, very slow and unevenly distributed subsidence along the tunnel alignment has been commonly observed [19,20,21]. Typically, surface settlements that occur during the excavation of a shield tunnel have a magnitude range of a few millimeters to a few centimeters [22].
Besides identifying the spatiotemporal evolution of ground deformation patterns during tunneling activities, the PSInSARTM technique based on the C-band Sentinel-1 product can also be a surveying tool to examine abnormal settlement before tunnel construction [3]. This analysis can reveal the stability of the Study’s Area of Interest (AOI) and serve as a baseline for settlement analysis during tunnel construction [23]. Once pre-existing settlements are detected, localization of settlement around tunnel alignment can be considered as merely being induced by tunneling activities.
Additionally, InSAR-based investigations of the spatial extent of ground deformation and the affected areas are limited by the understanding of causal factors on the resulting spatiotemporal subsidence [24]. Manual inspection and expert interpretation of geotechnical engineering can further expand the application of InSAR measurements and provide insight into the uneven subsidence field [25,26]. In order to fulfill this need, a Machine Learning (ML)-based parametric study can be applied to investigate the relationship between the measured ground subsidence field and correlated factors, such as the ML-based permutation feature importance technique. In the permutation feature importance method, the importance of a feature can be measured by calculating the increase in the ML model’s error after permuting the feature [27,28,29,30]. A feature is considered significant if shuffling its values increases the model error. The underlying reasons for uneven subsidence can be investigated according to feature importance analysis.
This study utilizes Sentinel-1 SAR Interferometry to map tunneling-induced uneven ground subsidence that occurred concurrently with the construction of twin tunnels in downtown Los Angeles, USA. LOS deformation rates are derived from ascending and descending orbits using the PSInSARTM technique. The vertical subsidence rate can be constrained by combining the average LOS deformation velocities from two independent tracks [31,32,33]. Furthermore, the ML-based permutation feature importance technique is applied to investigate the uneven subsidence with correlated factors to better understand this geotechnical phenomenon.
2. Study Area
Downtown Los Angeles, covering 15.1 , is the central business district of Los Angeles, California. Five Metro Lines connect regions of the Los Angeles metropolitan area to downtown Los Angeles (Figure 1a), including Metro L (Gold), A (Blue), B (Red), D (Purple), and E (Expo) Lines (Figure 1b). However, disconnections among these rail transit lines exist, such that the riders need to transfer trains multiple times to travel from one region to the other, crossing the metropolitan area. Therefore, the Regional Connector Transit Corridor (RCTC) project is proposed to link the gap between several metro lines and improve mobility. Figure 1c shows that the RCTC project scope includes twin bored tunnels (red lines), cut-and-cover structures (purple lines), crossover caverns excavated by the sequential excavation method (SEM) (yellow lines), and three stations between tunnel sections (black circles). In practice, crossover caverns and three stations are also bored during the twin-tunnel excavation.
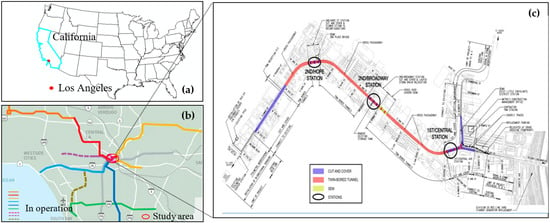
Figure 1.
Study site: (a) location map of the study area, (b) LA county Metro Transit System, and (c) project alignment (revised from [23]).
The AOI in this study covers twin-bored tunnel alignment. Twin-bored tunnels were excavated by a pressurized-face Tunnel Boring Machine (TBM) with an excavated diameter of approximately 22 ft. The tunnels were driven starting at the east end of the project, which is a curve project.
The ground cover depth varies greatly, ranging from approximately 7.6 to 39.6 m. Specifically, the bored tunnels encounter artificial fill, colluviums, Pleistocene- and Holocene-age alluviums, and Pliocene-age sedimentary strata of the Fernando formation [34]. More detailed information can be found on the United States Geological Survey (USGS) website (https://mrdata.usgs.gov/geology/state/, accessed on 1 September 2022). The USGS also provides the preliminary geological map of the study area, presented in Figure 2a. In addition, the geological section and Geotechnical Baseline Report (GBR) (https://partners.skanska.com, accessed on September 1, 2022) indicate the primary geological conditions of the tunnel construction (Figure 2b).
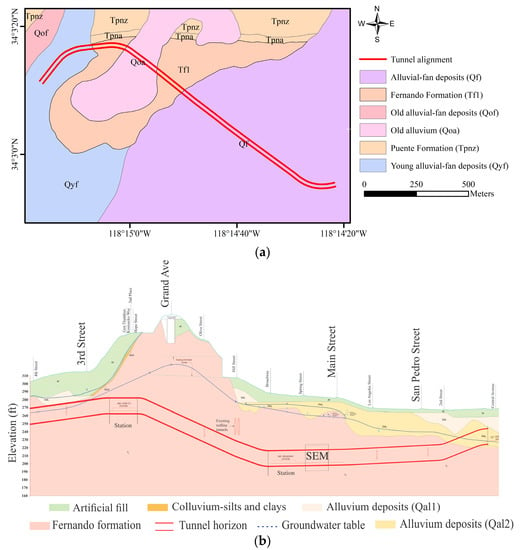
Figure 2.
(a) A preliminary geologic map of the study area and (b) a geological section of twin-bored tunnels.
Figure 2b indicates that artificial fill of variable thickness underlines the ground surface along much of the alignment. The fill consists of gravel, sand, silt, and clay mixtures along with construction debris. Deposits inferred to be of colluvial origin were encountered merely beneath the thick artificial fill between 3rd Street and Hope Street. These deposits are about 1.5 m thick and primarily consist of medium-dense clayey sand and stiff to very stiff, sandy-to-clayey silt. Coarser-grained alluvial deposits are widely present along the alignment beneath a variably thick artificial fill. Pleistocene-age (Qal2) and Holocene-age (Qal1) alluviums are predominantly made up of sandy soils. Geotechnical/foundation investigations and boring data indicate that the upper Qal1 alluvium is less dense than the lower Qal2 alluvium. The bedrock formations are unconformably overlain by colluvium or alluvium sediments, consisting of siltstone to silty claystone with an undrained shear strength of 28 to 55 Mpa. Additionally, the geological formation includes sandy layers, concretions, and nodules that range from moderately to strongly cemented.
The bored tunnels are excavated beneath a densely urbanized area. Portions of twin tunnels are beneath buildings or passing existing pile foundations. For instance, the alignment passes under an existing bridge in the proximity of its pile foundations, indicating a minimum of 0.75 m separation between the tunnels and existing piles. In addition, the alignment passes under an existing operational subway line with a 1.5 m vertical separation between tunnels [33].
3. Data Collection
3.1. SAR Acquisitions
The TBM was launched in February 2017 to excavate the first tunnel in this project. Digging of the second tunnel began in late September 2017, and the second tunnel was completed in January 2018. The TBM in the project traveled a maximum of 57.91 m in a single day and averaged more than 122 m per week. Accordingly, Sentinel-1 acquisitions in January 2017–February 2018 were downloaded to investigate the displacements that occurred concurrently with the tunnel construction. Additionally, SAR data from January to December 2016 were investigated to map ground subsidence one year before tunnel construction.
The PSInSARTM technique requires many images to provide precise, accurate, and reliable results. Studies in the literature suggest that at least 15 to 20 images are required for reliable outputs [35] because the high number of interferograms increases the reliability of the estimated deformation scatter points. This project uses SAR data from a descending track to map ground subsidence before tunneling. Twenty-seven acquisitions were available over the study area in 2016, and ascending track data are missing. Two tracks of Sentinel-1 data over the study area work for concurrent tunneling analysis. The ascending and descending datasets consist of 32 and 35 acquisitions, respectively. Each frame provides its own distinct viewing geometry.
Table 1 provides the summary of collected SAR data. One SAR image is acquired every six or max. twelve days. Figure 3 plots the perpendicular baseline information with the temporal difference, which determines the PSInSARTM interferogram network.

Table 1.
Data used in the PSInSARTM processing.

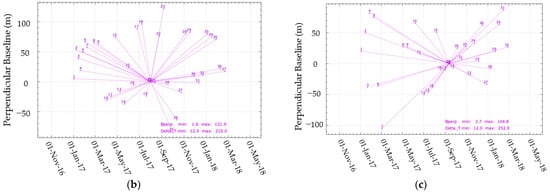
Figure 3.
Sentinel-1 interferogram network (single master PS analysis) for the ascending and descending frames. (a) Descending frame no.71 (Reference date: 20160731); (b) Ascending frame no.64 (Reference date: 201707801); and (c) Descending frame no.71 (Reference date: 20170912).Each point represents a SAR image, and each line represents an interferogram. X−axis: temporal baseline of the acquisitions. Y−axis: perpendicular baseline of the acquisitions. (a) indicates that 27 interferograms comprise the interferogram network for mapping ground subsidence before tunneling. For analysis of ground behavior during the tunneling process, ascending (b) and descending (c) frames consist of 37 and 32 interferograms, respectively.
3.2. Underground Parameters
Six correlated parameters are selected. Corresponding datasets are collected to conduct the parametric analysis, including the distance between tunnel centerlines (), depth to the tunnel springline (), distance to the tunnel (), artificial fill and alluvium soils above tunnel alignment (), building height (), and the groundwater level (). Table 2 provides the corresponding ranges of values for these 6 parameters.

Table 2.
Characteristic parameters and ranges of values in feet for parametric analysis.
In the ML-based permutation feature importance model, when two features are correlated with one permutated, the model will still have access to the feature through its correlated feature. This approach will result in a lower importance value for both features where they might be necessary. Thus, the coherent matrix of collected datasets is calculated and plotted in Figure 4. All the parameters show a relatively low correlation, with the Pearson correlation coefficient less than 0.8 (R < 0.8).
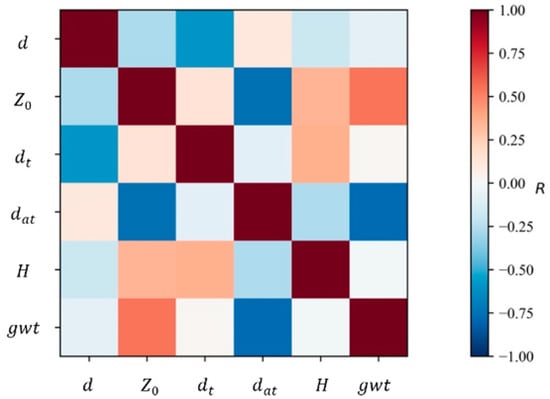
Figure 4.
Variable correlation matrix.
4. Methodology
4.1. Mapping Tunneling-Induced Ground Subsidence Using Sentinel-1 SAR Interferometry
This study utilizes Sentinel-1 SAR interferometry to measure and investigate tunnel-induced ground subsidence. The PSInSARTM technique is applied to ascending and descending tracks for measuring deformation velocity in the LOS direction. In PSInSARTM, interferograms are formed using a single master scene and analyzed at a single look resolution to maximize the signal. All the salve images are co-registered with the geometry of the master image. By processing a stack of SAR acquisitions and generating an interferogram network, the LOS deformation rate can be derived. The PSInSARTM analysis is performed with GAMMA software in a computer-aided process [36].
A unique characteristic of the InSAR technique for addressing tunneling-related concerns is identifying ground conditions prior to construction by exploiting archived historical satellite imagery. Prior to tunnel construction, InSAR can be used to understand the stability of the area of interest. Specifically, critical areas where pre-existing deformation could potentially interfere with tunnel construction can be identified. In addition, InSAR mapping before tunneling helps determine the position and distribution of coherent measurement points. In this study, ground deformation before tunneling will be mapped from descending track merely since the ascending track does not cover the study area during this period. Hence, ground subsidence before tunneling will be investigated in the LOS direction.
Other tunnel-related activities, such as Sequential Excavation Method (SEM) tunneling and station construction, are immediately conducted after this twin tunnel excavation. These activities can affect settlement assessment after tunneling. Therefore, post-tunneling subsidence is out of this study’s scope.
Data from ascending and descending tracks are available concurrently with the tunneling process. Therefore, the vertical settlement velocity can be derived from two tracks based on the assumption that the north-south motion is zero. Specifically, the methodology to derive a vertical deformation field consists of four main steps. First, a co-registered interferogram stack is prepared in Step I. Step II chooses the area of interest (AOI). Step III is the PSInSARTM analysis, which derives the tunneling-induced ground deformation in the LOS direction. Finally, Step IV combines displacements from ascending and descending orbits to derive the vertical deformation field. The following subsections explain each step in implementing this case study, with the flowchart shown in Figure 5.
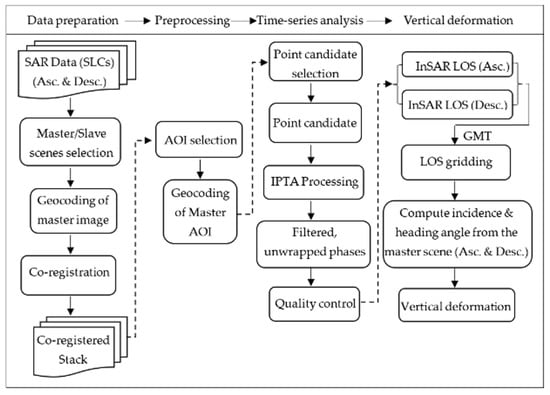
Figure 5.
The flowchart of deriving tunneling-induced ground deformation from the PSInSARTM technique.
4.1.1. Step I—Data Preparation
Ground deformation measurements associated with the twin-bored tunnels are acquired by processing Single Look Complexes (SLCs) from two Sentinel-1 orbits, i.e., ascending and descending tracks. These two satellites pass over the area of interest from north to south in descending orbit and from south to north in ascending orbit. Each path is separately processed. Additionally, displacement analysis was performed specifically in the VV polarization due to more backscattered persistent scatterers than the HH polarization.
The time-series analysis of InSAR interferograms is achieved by the PSInSARTM technique, which computes ground displacement via the phase difference between one master SAR acquisition and all other slave acquisitions. The master image is determined according to the temporal and perpendicular baseline information. In the selection of the master scene, the distribution of the perpendicular baseline values is as low as possible while still maximizing the expected stack coherence of the interferometric stack. Once the master scene is chosen for each data path, the geocoding is conducted before all slave images are co-registered to the geometry of the chosen master scenes. Topographic phase contribution was removed via the Digital Surface Model (DSM), which captures the urban environment’s natural and built/artificial features. The Digital Terrain Model (DEM) is a three-dimensional, bare-earth representation of terrain or surface topography. The DSM is a three-dimensional representation of the heights of the Earth’s surface, including natural or man-made objects located on it.
4.1.2. Step II—Preprocessing
Step I prepares two-burst interferograms in this study. Step II narrows down the burst scale to a relatively small area covering the tunnel alignment, considering that the InSAR data processing is time and space demands.
4.1.3. Step III—Time-Series Analysis
GAMMA’s Interferometric Point Target Analysis (IPTA) [36], a well-established time-series analysis technique, exploits the temporal and spatial characteristics of interferometric data collected from point targets. Specifically, point candidates are initially identified by calculating spectral diversity and then determined based on average spectral diversity and backscatter variability. Adaptive point density reduction is applied to reduce point density in very high point density areas. A quality value of 1.15 for each point candidate is used. IPTA is applied to process reduced points. Next, solutions of reduced candidates are expanded to entire identified points to obtain filtered and unwrapped phases. In the IPTA processing, the atmospheric phase contribution from the master scene is extracted using a low-pass temporal filter of the residual phase and removed from all interferograms since it correlates in space and time. At the end of the time-series analysis, quality control improves and modifies the results by estimating temporal coherence, detecting outliers, checking the solution with local processing, etc.
4.1.4. Step IV—Vertical Deformation
The interferometric phase is observed in the slant range geometry. This viewing geometry results that InSAR measure can only measure deformation along the sensor-target LOS direction, which connects the sensor and the ground target. However, vertical deformation is the most concerning for a specific tunneling case because it is reasonable to assume tunneling-induced displacements are predominantly vertical in practice [25,31].
Based on the geometry of SAR imaging, the LOS displacement () is composed of the three-dimensional (3D) deformation components: , and [35]. Parameters , and in Equation (1) represent deformations in vertical, north–south (N–S), and west–east (W–E) directions, respectively.
where parameters and α represent the incidence and heading angle (positive clockwise from the north), respectively.
Because of satellite acquisition geometry, the SAR data are insensitive to N-S motion, with the satellite moving in the N-S direction. Therefore, the N-S motion is typically assumed to be zero in subsidence study cases [37]. The availability of Sentinel-1 acquisitions for ascending and descending at across-track view allows estimating 2D displacement vectors, i.e., vertical and east-west (horizontal) components (Figure 6). Such a procedure is possible when LOS measurements are available for the same period and over the same study area.
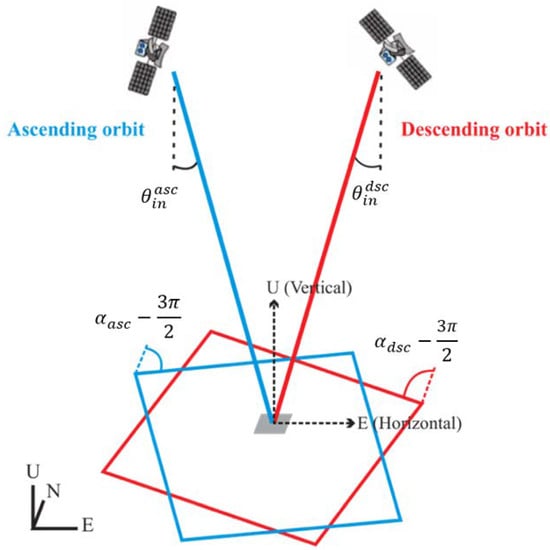
Figure 6.
Acquisition geometry of the ascending and descending SAR tracks. The viewing geometry of the satellite LOS is mainly defined by the incidence angle () and satellite heading (α). Based on such a geometric simplification, the vertical and horizontal components can be solved.
Spatial interpolation is the first step to deriving vertical components since InSAR pixels in each stack of SAR images are selected at different locations, i.e., PS scatters from ascending and descending orbits have different geometric locations. Ascending and descending LOS mean deformations are gridded using the Generic Mapping Tools (GMT) nearest-neighbor gridding method [38,39]. The GMT is an open-source collection of computer collection tools for data processing and display. The nearest-neighbor function assigns an average value to each node with at least one or more PS points within a radius centered on the node. The average value is calculated as a weighted mean of the nearest PS point from each sector inside the search radius [39]. As a result, the gridded outcome creates new resampled pixels at a specific radius (2 m in this case).
The next step is to compute local incidence and heading angles based on a master SAR scene used by the earlier co-registration process in Step I. Vertical () and horizontal () components for the mean velocity can therefore be calculated using the Original Least Square (OLS) method [40].
4.2. ML-Based Parametric Analysis of Tunneling-Induced Ground Settlements
Theoretically, the tunneling-induced ground deformation in soft grounds is generally related to ground loss. Peck’s [41] method idealizes the settlement occuring in the shape of an inverted Gaussian trough for a single tunnel. Two Gaussian curves are superimposed depending on the distance between the tunnel axes () when the combined effect of twin tunnels is considered [42]. As a result, the settlement profile of the twin tunnel can be described by a shifted Gaussian function in Equation (2) [43]:
where represents surface settlement at a transverse distance x from the centerline of twin tunnels, represents maximum settlement (at = 0), x represents the horizontal distance from the centerline of twin tunnels, represents the trough parameter, represents the depth from the ground surface to the tunnel spring line, and a represents a shifted distance from the twin tunnel centerline.
Based on the underlying physics-based model of tunneling-induced ground deformation, case history reviews [42,44], and geological condition of the studied twin-tunnel alignment. Six correlated parameters are selected to conduct the parametric study, including the distance between tunnel centerlines (d), depth to the tunnel springline (), distance to the tunnel (), artificial fill and alluvium soils above tunnel alignment (), building height (), and the groundwater level ().
ML-based permutation feature importance is applied to conduct the parametric analysis and retrieve their relationships. The applied ML technique is a decision tree algorithm. The permutation feature importance refers to the decrease in a model score when a single feature value is randomly shuffled. The drop in the model score indicates how “important” the feature is for the decision tree model, which is a non-parameter supervised learning algorithm.
First, Inputs for the ML-based permutation feature importance are fitted decision tree model collected dataset. Then, the calculation of feature importance can be generally implemented in the following two steps. Every feature is shuffled many times () and returns the feature importance.
Step 1: Compute the reference scores of the decision tree model on a collected dataset, which typically is value.
Step 2: For each feature :
- (1)
- For each repetition in 1, …, :Randomly shuffle column to generate a corrupted version of the data.Compute the score of the decision tree model on computed corrupted data;
- (2)
- Compute the importance for feature defined as .
5. Results
5.1. Tunneling-Induced Uneven Ground Subsidence
Figure 7 presents an overview of the average LOS subsidence velocity estimated from Sentinel-1 SAR interferometry. The InSAR technique offers a high density of measurement points over a large area (Figure 7a,c). Figure 7b,d are contours derived from Figure 7a,c for better visualization. Specifically, the Radial Basis Function (RBF) extract interpolator is applied to produce smooth surfaces from a large number of data points.
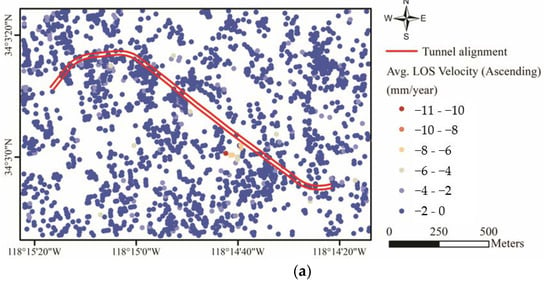
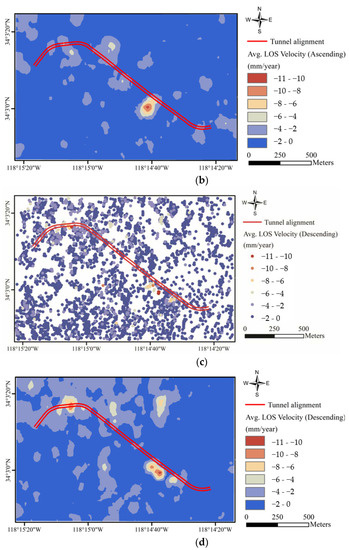
Figure 7.
Average LOS settlement map for ascending and descending orbits. (a,b) present the LOS velocity from the ascending orbit (path 64). (c,d) show the LOS velocity obtained from the descending orbit (path 71). Negative values indicate ground subsidence.
According to the uneven subsidence field mapped from both ascending and descending orbits, most areas around the tunnel alignment show an extremely slow settlement velocity of less than 6 mm/year in the LOS direction. Localized areas appearing in yellow to red contours experience a subsidence velocity greater than 6 mm/year.
The vertical subsidence map (Figure 8) is derived from the LOS subsidence from ascending and descending orbits. Figure 8 indicates that uneven settlement is concentrated within approximately 6 to 7 times the twin-tunnel diameter buffer. No prominent settlements were found outside this scope. Additionally, the measured maximum settlement rate reaches approximately 12 mm/year. Most areas show an average settlement velocity of less than 5 mm/year. Two localized areas appear in yellow and red contours, with average subsidence rates reaching 7 and 12 mm/year. Furthermore, measured ground subsidence is within the allowable threshold. No severe damages to aboveground structures were reported.
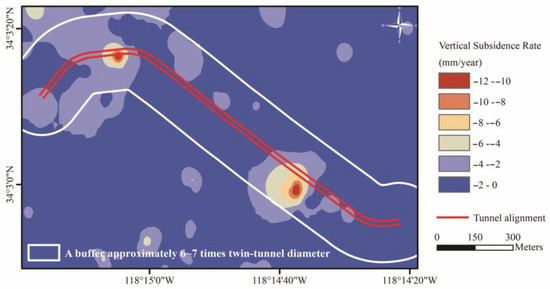
Figure 8.
Average vertical settlement map along the twin-tunnel alignment.
5.2. Ground Subsidence before Tunneling
InSAR data can provide valuable ground displacement behavior information before and during tunneling operations. Therefore, in addition to mapping ground settlements during tunnel construction, presented in Figure 8. The PSInSARTM technique also investigates ground behavior before tunneling. Figure 9 indicates that the overall study area had an extremely slow settlement velocity of less than 6 mm/year in the LOS direction before tunnel construction. Two yellow dashed squares in Figure 9b indicate concentrated settlement locations mapped in Figure 8. No apparently concentrated pre-existing ground movements have been identified in these two locations. The tunneling-induced uneven ground subsidence along tunnel alignment is identified again from such a perspective.
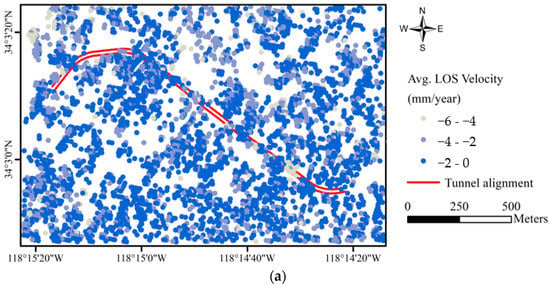
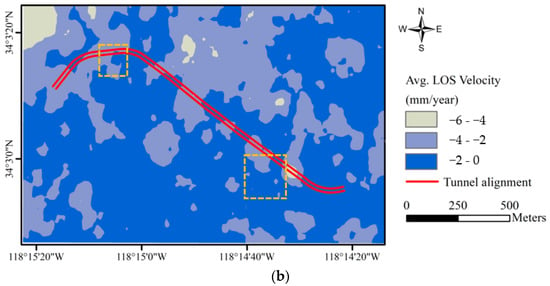
Figure 9.
Average LOS settlement map before tunneling. (a) shows a high density of measurement points over the study area. (b) is the contour derived from (a). Two yellow dashed squares in (b) indicate concentrated settlement locations mapped in Figure 8 correspondingly.
5.3. Parametric Analysis of Uneven Ground Settlement
Six correlated parameters are selected for the parametric analysis, including the distance between tunnel centerlines, depth to the tunnel springline, distance to the tunnel, the thickness of artificial fill and alluvium soils above the tunnel alignment, building height, and groundwater level. A permutation feature importance analysis based on the decision tree algorithm has been conducted. As a result, the importance of the six parameters is assessed quantitatively and presented in Figure 10. Results of the parametric analysis indicate that the thickness of artificial fill and alluvium soils above the tunnel springline is the dominant parameter, followed by the distance between tunnel centerlines, depth to the tunnel springline, and building height. Two parameters, building height and groundwater level, play a less important role than other parameters.
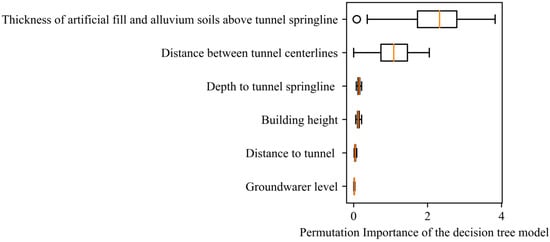
Figure 10.
Parametric analysis of above- and underground features.
6. Discussions
The results obtained in this study suggest that localized and unevenly distributed vertical settlements are identified by the PSInSARTM method. The ML-based parametric analysis is derived from a data-driven perspective, indicating that unevenly distributed ground subsidence is geologically sensitive. In addition to the quantitative analysis, Figure 11 links the ground settlement map with the underground geological profile to provide qualitative insight.
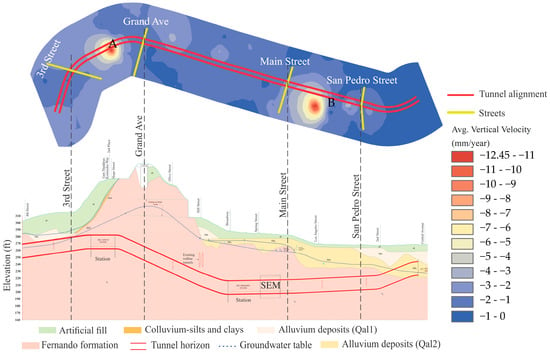
Figure 11.
Ground settlement field (above figure) and corresponding geological conditions (below figure).
Deep artificial fills, to depths of approximately 7.62 to 10.67 m below the ground surface, are located below the first localized settlement area indicated in letter A in Figure 11. Artificial fills were backfilled in past civil projects such as the abandoned Pacific Electric tunnel, the storm drain excavations, and other structure excavations. Additionally, colluvial deposits approximately 1.52 m thick were encountered beneath thick and artificial between 3rd Street and Hope Street, which primarily consist of medium dense clayey sand.
No obvious settlements were measured between Grand Ave. and the Main Street section. The corresponding geological section shows the geomaterials are bedrock or laterally thin alluvium deposits. Then an eastward increase in alluvial deposit thickness and increased tunnel depth were found near the east side of Main Street, where the second localized settlements indicated by the letter B in Figure 11 were measured. The existing Redline Tunnel passes this underground section, which might contribute to the localized ground settlement. Perched groundwater generally exists within the lower portion of the alluvial deposits due to the relatively low permeability of the underlying Fernando formation.
Intuitively, from the geological section, ground settlements are concentrated in areas with thick overburdened artificial fill and alluvium deposits, low tunnel depth, and high groundwater levels. However, when the geological settings are similar, the ground behavior could be determined by other parameters such as the distance between tunnel alignments, the depth to the tunnel spring, building heights, etc.
The soil properties and geological background have been considered a fundamental reason for subsidence [45,46]. Integrating expert interpretation of geotechnical engineering with formidable InSAR mapping can further expand the application of InSAR measurements.
7. Conclusions
This study highlighted the usefulness of the Sentinel-1 SAR interferometry applied to mapping ground subsidence induced by an urban twin tunnel in downtown Los Angeles, USA. The Sentinel-1 mission provides extensive spatial coverage, regular acquisitions, and open availability. InSAR monitoring can provide data to understand the relationship between tunneling construction activities and ground settlement throughout all project phases.
SAR images were acquired from ascending and descending tracks covering the time span concurrent with twin-tunnel excavation and then possessed by the PSInSARTM technique. The vertical subsidence rate was derived by combining LOS deformation velocities obtained from ascending and descending orbits. Localized but uneven vertical settlement velocities of up to 12 mm/year were detected in the study area. In addition, the subsidence field within an approximately 6- to 7-times twin-tunnel diameter buffer was identified. Most areas showed settlement velocities less than 6 mm/year along the tunnel alignment. No significant effects on the aboveground building were reported during the tunnel construction period since the maximum settlement is within the allowable threshold.
Besides subsidence patterns during tunneling, InSAR data provided valuable ground displacement behavior information before tunneling constructions. Because satellite data archives can be processed to provide historical movement trends and assess the stability of the AOI, results showed that no concentrated pre-existing ground movements had been identified. The tunneling-induced uneven ground subsidence along tunnel alignment is recognized again from such a perspective.
InSAR-based investigations of ground deformation are typically limited by the understanding of the causal factors on the resulting spatiotemporal subsidence. In order to explain such an unevenly distributed settlement field in this case study, the ML-based permutation feature importance technique was applied to analyze the relationship between tunneling-induced ground subsidence and correlated factors. The parametric analysis was conducted using six parameters: the distance between tunnel centerlines, the depth to the tunnel springline, the distance to the tunnel, the thickness of artificial fill and alluvium soils above the tunnel alignment, the building height, and the groundwater level. Results showed that the dominant parameter is the thickness of artificial fill and alluvium soils above tunnel alignment. In addition to such a quantitative analysis, the surface settlement map has been correlated to the underground geological map for qualitatively analyzing such a geologically sensitive ground behavior. The outcomes indicate that ground settlements are more concentrated in thick artificial fill and alluvium deposits, low tunnel depth, and high groundwater levels.
This study demonstrated that the InSAR technique could be a periodic monitoring technique to measure ground deformation induced by ongoing tunnel construction in urban areas. Sentinel missions supply free worldwide coverage and open-access data. However, achieving the same spatial and temporal measurements as the conventional geodetic method will involve much higher costs.
Author Contributions
Conceptualization, L.L. and W.Z.; methodology, L.L and W.Z..; software, L.L. and W.Z.; validation, L.L.; formal analysis, L.L., W.Z. and M.G.; investigation, L.L.; resources, L.L., W.Z. and M.G.; data curation, L.L. and W.Z.; writing—original draft preparation, L.L.; writing—review and editing, W.Z and M.G.; visualization, L.L.; supervision, W.Z. and M.G.; project administration, W.Z. and M.G.; funding acquisition, M.G. All authors have read and agreed to the published version of the manuscript.
Funding
This work was supported by the University Transportation Center for Underground Transportation Infrastructure (UTC-UTI) at the Colorado School of Mines under Grant No. 69A3551747118 from the U.S. Department of Transportation (DOT). The opinions expressed in this paper are those of the authors and not the DOT.
Data Availability Statement
Publicly available datasets were analyzed in this study. Sentinel-1 data can be downloaded from the Alaska Satellite Facility (https://search.asf.alaska.edu/, accessed on 1 January 2022). DSM data map is available at https://www.eorc.jaxa.jp/ALOS/en/aw3d30/data/index.htm, accessed on 1 January 2022.
Conflicts of Interest
The authors declare no conflict of interest.
References
- Ferretti, A.; Savio, G.; Barzaghi, R.; Borghi, A.; Musazzi, S.; Novali, F.; Prati, C.; Rocca, F. Submillimeter accuracy of InSAR Time Series: Experimental validation. IEEE Trans. Geosci. Remote Sens. 2007, 5, 1142–1153. [Google Scholar] [CrossRef]
- Wnuk, K.; Zhou, W.; Gutierrez, M. Mapping urban excavation induced deformation in 3D via multiplatform InSAR time-series. Remote Sens. 2021, 13, 4748. [Google Scholar] [CrossRef]
- Ramirez, R.A.; Lee, G.J.; Choi, S.K.; Kwon, T.H.; Kim, Y.C.; Ryu, H.H.; Kim, S.; Bae, B.; Hyun, C. Monitoring of construction-induced urban ground deformations using Sentinel-1 PSInSAR: The case study of tunneling in Dangjin, Korea. Int. J. Appl. Earth Obs. Geoinf. 2022, 108, 102721. [Google Scholar] [CrossRef]
- Talledo, D.A.; Miano, A.; Bonano, M.; Carlo, F.D.; Lanari, R.; Manunta, M.; Meda, A.; Mele, A.; Prota, A.; Saetta, A.; et al. Satellite radar interferometry: Potential and limitations for structural assessment and monitoring. Build. Eng. 2022, 46, 103756. [Google Scholar] [CrossRef]
- Macchiarulo, V.; Milillo, P.; DeJong, M.J.; Martí, J.G.; Sanchez, J.; Giardina, G. Integrated InSAR monitoring and structural assessment of tunneling-induced building deformations. Struct. Control Health Monit. 2021, 28, e2781. [Google Scholar] [CrossRef]
- Duysak, H.; Yigit, E. Investigation of the Performance of Different Wavelet-Based Fusions of SAR and Optical Images Using Sentinel-1 and Sentinel-2 Datasets. Int. J. Geotech. Eng. 2021, 7, 81–90. [Google Scholar] [CrossRef]
- Ahady, A.B.; Kaplan, G. Classification comparison of Landsat-8 and Sentinel-2 data in Google Earth Engine, study case of the city of Kabul. Int. J. Eng. Geol. 2021, 7, 24–31. [Google Scholar] [CrossRef]
- Crosetto, M.; Monserrat, O.; Cuevas-González, M.; Núria, D.; Bruno, C. Persistent scatterer interferometry: A review. ISPRS J. Photog. Remote Sens. 2016, 115, 78–89. [Google Scholar] [CrossRef]
- Wnuk, K.; Walton, G.; Zhou, W. Four-dimensional filtering of InSAR persistent scatterers elucidates subsidence induced by tunnel excavation in the Sri Lankan highlands. J. Appl. Remote Sens. 2019, 13, 034508. [Google Scholar] [CrossRef]
- Ferretti, A.; Prati, C.; Rocca, F. Permanent scatterers in SAR interferometry. IEEE Trans. Geosci. Remote Sens. 2001, 39, 8–20. [Google Scholar] [CrossRef]
- García, A.J.; Marchamalo, M.; Martínez, R.; González-Rodrigo, B.; Gonzálezc, C. Integrating geotechnical and SAR data for the monitoring of underground works in the Madrid urban area: Application of the Persistent Scatterer Interferometry technique. Int. J. Appl. Earth Obs. Geoinf. 2019, 74, 27–36. [Google Scholar] [CrossRef]
- Macchiarulo, V.; Giardina, G.; Milillo, P.; Martí, J.G.; Sanchez, J.; DeJong, M.J. Settlement-induced building damage assessment using MT-InSAR data for the Crossrail case study in London. In Proceedings of the International Conference on Smart Infrastructure and Construction 2019 (ICSIC), Cambridge, UK, 8–10 July 2019; pp. 721–727. [Google Scholar] [CrossRef]
- Milillo, P.; Giardina, G.; DeJong, M.J.; Perissin, D.; Milillo, G. Multi-temporal InSAR structural damage assessment: The London Crossrail case study. Remote Sens. 2018, 10, 287. [Google Scholar] [CrossRef]
- Gheorghe, M.; Armaş, I.; Dumitru, P.; Calin, A.; Badescu, O.; Necsoiu, M. Monitoring subway construction using Sentinel-1 data: A case study in Bucharest, Romania. Int. J. Remote Sens. 2020, 41, 2644–2663. [Google Scholar] [CrossRef]
- Reinders, K.J.; Hanssen, R.F.; Leijen, F.V.; Korff, M. Augmented satellite InSAR for assessing short-term and long-term surface deformation due to shield tunnelling. Tunn. Undergr. Space Technol. 2021, 101, 103745. [Google Scholar] [CrossRef]
- Perissin, D.; Wang, T. Time-series InSAR applications over urban areas in China. IEEE J. Sel. Top. Appl. Earth Observ. Remote Sens. 2011, 4, 92–100. [Google Scholar] [CrossRef]
- Cavur, M.; Moraga, J.; Duzgun, H.S.; Soydan, H.; Jin, G. Displacement analysis of geothermal field based on PSInSAR and SOM clustering algorithms: A case study of Brady Field, Nevada-USA. Remote Sens. 2021, 13, 349. [Google Scholar] [CrossRef]
- Wang, H.; Feng, G.; Xu, B.; Yu, Y.P.; Li, Z.; Du, Y.N.; Zhu, J.J. Deriving spatio-temporal development of ground subsidence due to subway construction and operation in delta regions with PSInSAR data: A case study in Guangzhou, China. Remote Sens. 2017, 9, 1004. [Google Scholar] [CrossRef]
- Roccheggiani, M.; Piacentini, D.; Tirincanti, E.; Perissin, D.; Menichetti, M. Detection and monitoring of tunneling induced ground movements using Sentinel-1 SAR interferometry. Remote Sens. 2019, 11, 639. [Google Scholar] [CrossRef]
- Anantrasirichai, N.; Biggs, J.; Kelevitz, K.; Sadeghi, Z.; Wright, T.; Thompson, J.; Achim, A.M.; Bull, D. Detecting ground deformation in the built environment using sparse satellite InSAR data with a convolutional neural network. IEEE Trans. Geosci. Remote Sens. 2020, 59, 2940–2950. [Google Scholar] [CrossRef]
- Khan, R.; Li, H.; Afzal, Z.; Basir, M.; Arif, M.; Hassan, W. Monitoring subsidence in urban area by PSInSAR: A case study of Abbottabad City, Northern Pakistan. Remote Sens. 2021, 13, 1651. [Google Scholar] [CrossRef]
- Broere, W.; Festa, D. Correlation between the kinematics of a tunnel boring machine and the observed soil displacements. Tunn. Undergr. Space Technol. 2017, 70, 125–147. [Google Scholar] [CrossRef]
- Sepehrmanesh, M.; Nasri, V.; Allahverdi, N. Impact of EPB Tunneling on Pile Foundations and Existing Tunnels. In Proceedings of the North American Tunneling: 2014 Proceedings, The Society for Mining, Metallurgy and Exploration, Los Angeles, CA, USA, 22–25 June 2014. [Google Scholar] [CrossRef]
- Wang, R.; Yang, M.S.; Dong, J.; Liao, M.S. Investigating deformation along metro lines in coastal cities considering different structures with InSAR and SBM analyses. Int. J. Appl. Earth Obs. Geoinf. 2022, 115, 103099. [Google Scholar] [CrossRef]
- O’Reilly, M.P.; New, B.M. Settlements above Tunnel in the UK-Their Magnitude and Prediction, Presented at Tunneling; Institution of Mining and Metallurgy: London, UK, 1982; pp. 173–181. [Google Scholar]
- Zhou, W.; Li, S.; Chen, G.; Ke, J. InSAR Application in Assessment of Oilfield Subsidence in North Slope of Alaska, Golden Rocks. In Proceedings of the 41st U.S. Rock Mechanics Symposium, Golden, CO, USA, 17–21 June 2006. [Google Scholar]
- Liu, L.; Zhou, W.; Gutierrez, M. Effectiveness of predicting tunneling-induced ground settlements using machine learning methods with small datasets. J. Rock Mech. Geotech. Eng. 2022, 14, 1028–1041. [Google Scholar] [CrossRef]
- Liu, L.; Zhou, W.; Gutierrez, M. Physics-informed ensemble machine learning framework for better predicting tunneling-induced ground settlement. Transp. Geotech. 2023. Under review. [Google Scholar]
- Kai, L.; Xiangyu, L.; Zhihui, Z.; Lodewijk, B.; Hua, W. Factor-Bounded Nonnegative Matrix Factorization. ACM Trans. Knowl. Discov. Data 2021, 15, 111. [Google Scholar] [CrossRef]
- Xiangyu, L.; Hua, W. Adaptive Principal Component Analysis. In Proceedings of the 2022 SIAM International Conference on Data Mining (SDM), Alexandria, VA, USA, 28–30 April 2022; pp. 486–494. [Google Scholar] [CrossRef]
- Chou, W.I.; Bobet, A. Predictions of ground deformations in shallow tunnels in clay. Tunn. Undergr. Space Technol. 2022, 17, 3–19. [Google Scholar] [CrossRef]
- Perissin, D.; Wang, Z.; Lin, H. Shanghai subway tunnels and highways monitoring through COSMO-SkyMed Persistent Scatterers. ISPRS J. Photog. Remote Sens. 2012, 73, 58–67. [Google Scholar] [CrossRef]
- Choia, S.J.; Chaudhurib, D.; Hudsonb, M.B.; Hansmire, W.H. Geotechnical Investigation for Regional Connector Transit Corridor Project in Los Angeles, California. In Proceedings of the 15th Pan-American Conference on Soil Mechanics and Geotechnical Engineering, Buenos Aires, Argentina, 15–18 November 2015; pp. 15–18. [Google Scholar] [CrossRef]
- Gibbard, P.; Kolfschoten, V.T. The Pleistocene and Holocene Epochs. In Geologic Time Scale 2020; Gradstein, F.M., Ogg, J.G., Schmitz, M.D., Ogg, G.M., Eds.; Elsevier: Amsterdam, The Netherlands, 2004; pp. 441–452. [Google Scholar]
- Hanssen, R.F. Radar Interferometry: Data Interpretation and Error Analysis (Remote Sensing and Digital Image Processing); Springer: Amsterdam, The Netherlands, 2022; ISBN 978-0-7923-6945-5. [Google Scholar] [CrossRef]
- Werner, C.; Wegmuller, U.; Strozzi, T.; Wiesmann, A. Interferometric point target analysis for deformation mapping. In Proceedings of the 2003 IEEE International Geoscience and Remote Sensing Symposium. Proceedings (IEEE Cat. No. 03CH37477), Toulouse, France, 21–25 July 2003; pp. 4362–4364. [Google Scholar] [CrossRef]
- Fuhrmann, T.; Garthwaite, M.C. Resolving three-dimensional surface motion with InSAR: Constraints from multi-geometry data fusion. Remote Sens. 2019, 11, 241. [Google Scholar] [CrossRef]
- Ebdon, D. Statistics in Geography; Blackwell: Oxford, UK, 1985; Volume 754. [Google Scholar]
- Wessel, P.; Smith, W.; Scharroo, R.; Luis, J.F.; Wobbe, F. The Generic Mapping Tools. Eos Trans. Am. Geophys. Union 2019, 94, 409–410. [Google Scholar] [CrossRef]
- Isya, N.H.; Niemeier, W.; Gerke, M. 3D estimation of slow ground motion using InSAR and the slope aspect assumption, a case study: The puncak pass landslide, Indonesia. ISPRS Ann. Photogramm. Remote Sens. Spat. Inf. Sci. 2019, 4, 623–630. [Google Scholar] [CrossRef]
- Peck, R. Deep excavations and tunneling in soft ground. In Proceedings of the 7th International Conference on Soil Mechanics and Foundation Engineering, Mexico City, Mexico; 1969; pp. 225–290. [Google Scholar]
- Giardina, G.; Milillo, P.; DeJong, M.J.; Perissin, D.; Milillo, G. Evaluation of InSAR monitoring data for post-tunnelling settlement damage assessment. Struct. Control Health Monit. 2019, 26, e2285. [Google Scholar] [CrossRef]
- New, B.M.; Bowers, K.H. Ground movement model validation at the Heathrow express train tunnel. In Proceedings of the Tunnelling 94, IMM, London, UK; 1993; pp. 301–329. [Google Scholar]
- Suwansawa, S.; Einstein, H.H. Describing settlement troughs over twin tunnels using a superposition technique. J. Geotech. Geoenviron. 2007, 133, 445–468. [Google Scholar] [CrossRef]
- Holzer, T.L.; Johnson, A.I. Land subsidence caused by ground water withdrawal in urban areas. GeoJournal 1985, 11, 245–255. [Google Scholar] [CrossRef]
- Khorrami, M.; Abrishami, S.; Maghsoudi, Y.; Alizadeh, B.; Perissin, D. Extreme subsidence in a populated city (Mashhad) detected by PSInSAR considering groundwater withdrawal and geotechnical properties. Sci. Rep. 2020, 10, 11357. [Google Scholar] [CrossRef] [PubMed]
Disclaimer/Publisher’s Note: The statements, opinions and data contained in all publications are solely those of the individual author(s) and contributor(s) and not of MDPI and/or the editor(s). MDPI and/or the editor(s) disclaim responsibility for any injury to people or property resulting from any ideas, methods, instructions or products referred to in the content. |
© 2022 by the authors. Licensee MDPI, Basel, Switzerland. This article is an open access article distributed under the terms and conditions of the Creative Commons Attribution (CC BY) license (https://creativecommons.org/licenses/by/4.0/).