Article

QuickOSSE Research on the Impact of Airship-Borne Doppler Radar Radial Winds to Predict the Track and Intensity of a Tropical Cyclone

1
State Key Laboratory of Severe Weather, Chinese Academy of Meteorological Sciences, China Meteorological Administration (CMA), Beijing 100081, China
2
National Meteorological Centre, Beijing 100081, China
*
Author to whom correspondence should be addressed.
Remote Sens. 2023, 15(1), 191; https://doi.org/10.3390/rs15010191
Submission received: 9 November 2022 / Revised: 4 December 2022 / Accepted: 26 December 2022 / Published: 29 December 2022

Abstract

:
Different from the aircraft TC reconnaissance flight missions before, a tropical cyclone (TC) field campaign project with a Doppler radar equipped on an airship that could hang over on the top of a TC (about 20 km) has been recently carried out in China. To understand the impact of airship-borne radar radial wind observations in TC forecasting, this work conducted quick observation simulation system experiments (QuickOSSE) by assimilating simulated airship-borne Doppler radar radial winds with an Ensemble Kalman Filter (EnKF) algorithm. The results show that airship-borne radial winds assimilation reproduces the forecasted track and minimum sea level pressure of the nature run. The forecast of dynamic and thermodynamic TC structures, such as tangential wind, secondary circulation, and warm core, are also improved. In addition, two determining factors, the radar depression angle (D-ang) and the distance from the airship to the TC center (DIS), are found to primarily affect the forecast of the TC track and intensity, respectively. Benefiting from a larger horizontal coverage, observations under a smaller D-ang improved the track more significantly. Meanwhile, the intensity forecast error with a DIS around the radius of the maximum wind is the smallest among several sensitive experiments, which may because the peak-velocity winds representing the TC’s intensity could be observed by radar. The results are expected to help establish an observational strategy for upcoming airship flight missions in practice.

1. Introduction

Compared to the markedly improved forecast skills of the track of tropical cyclones (TCs) over recent decades, forecasting the intensity of TCs remains a challenge for which the improvement rate in the western North Pacific is only 1–2% yr−1 [1]. One major reason for this could be due to the factors/processes related to TC intensity and structure changes being complex and numerous. For instance, the initial wind profile [2], eyewall contraction [3], vertical wind shear [4], boundary layer processes [5], and microphysics processes [6] have been shown to affect TC development. These complicated processes, along with their interactions, bring large nonlinearity into the development of TC, resulting in an increasing demand for an accurate initial condition in numerical weather prediction (NWP).
The precise initial condition of TC generally comes from a proper vortex initialization or data assimilation. In vortex initialization, an empirically [7,8,9] or dynamically initialized [10] vortex whose intensity is comparable to the real-time report is inserted into the model background. Although great improvement [11,12] has been achieved by vortex initialization, the deficiency in real observed information restrains its further development. On the other hand, based on data assimilation, numerous types of observations have proven to be useful in enhancing the forecast skill of TC, including dropsondes [13,14,15], satellite infrared radiance [16,17], microwave radiance [18,19], and many kinds of satellite-derived products [20,21]. The Hurricane Weather Research and Forecasting (HWRF) Model, which couples ocean model and assimilates multiple satellite [22,23] and radar observations [24], is operationally running to forecast the TCs in the Atlantic Ocean. Moreover, its excellent performance on TC track and intensity forecast [25] partly comes from an accurate initial condition after data assimilation.
Among the various types of observations, Doppler radar has greatly contributed to the forecast of TC, as it detects intricate wind and cloud microphysics structures in TCs’ inner-core region. Many studies have illustrated the positive impact of assimilating ground-based radar observations to determine the track [26,27], intensity [28,29,30], and rainfall of landfalling TCs [24,31,32]. However, the detection range of the coastal radar is too limited to observe TCs in the open ocean. In 1976, NOAA started an operational aircraft observation campaign for TCs in the Atlantic Ocean using customized P-3 aircraft and observed 134 TCs till 2006 [33]. A C-band Doppler radar was equipped in the tail of P-3 aircraft to detect wind and cloud information in the rear space of the TC. The effectiveness of the airborne radar radial wind to track, intensity, and structure has been evaluated via both single cases [34] and multiple cases [35]. Based on these findings, the PSU WRF-EnKF system was developed to forecast the TCs in the Atlantic Ocean with operational applications. The mean absolute error is 15–43% lower than the official forecast from NHC for lead times of at least 24 h [36].
Several airplane observation experiments for TCs in the north Pacific Ocean have also been conducted. The U.S. Department of Defense has performed routine aircraft reconnaissance into TCs in the Northwest Pacific for more than 40 years, starting in the last century. The aircraft observations are not only used to estimate the real-time TC position and intensity [37] but also to understand the climate character of the wind structure of the TC [38] and the variability in the intensity and eye size of the TC [39]. However, due to funding limitations, this operational flight project was terminated in 1987. In 2002, an operational aircraft field campaign was conducted by Taiwan, namely, Dropsonde Observation for Typhoon Surveillance near the Taiwan Region (DOTSTAR), in which 35 TCs with 45 DOTSTAR surveillance cases were carried out from 2003 to 2009. It was found that the mean 1- to 5-day track forecast error was reduced by 10–20% with dropsonde data assimilated in the NCEP system [40]. The Hong Kong Observatory (HKO) conducted a flight observation experiment for TC Nida (2016). The wind, temperature, humidity, and pressure observations collected by the in-flight measurement significantly improved the precise TC wind structure [31].
TC airplane observation experiments in the North Pacific have been rarely conducted after 2012, and the precise wind in TCs’ inner core was rarely observed in the previous project. Recently, China carried out a field campaign project on TCs in the North Pacific. The observing platform was an airship that hung over on the top (~20 km) of a TC and was equipped with a Doppler radar and multiple dropsondes. Based on the better detection of the structure of TC inner-core, the project aimed to support a study on the mechanisms of TC development, as well as enhance the accuracy of TC forecast. However, the associated equipment and instrument are still in design and preparation, and the real observation has not been collected so far. An observation simulation system experiment (OSSE) is used to evaluate the impact of data from a new observational platform, instrument, or new assimilation technique in the NWP before a real observational field study is conducted [41,42]. Many new kinds of observations, including satellite radio occultations [43] and radiance [44], radar observation [41,45], and dropsoude from new aircraft platforms [46] are simulated from a “ture” state (refer to nature run) and asimilated via an OSSE framework before its real observing program is conducted [47]. Contrary to a full OSSE, whose nature run is a long period model simulation distinct from reality, a QuickOSSE is frequently used a for a specific high-impact weather event, in which a short-term, high resolution forecast serves as the nature run [43,48]. Here, this study adopts the QuickOSSE approach to reveal the possible impact of the airship-borne Doppler radar radial wind on forecasts of the track, intensity, and structure of TCs. Multiple experiments with different radar-observed coverages are further performed and analyzed to provide a useful reference for designing the future airship observing strategy.
The rest of the paper is organized as follows. The details of the model configuration, experimental design, and case description are introduced in Section 2. In Section 3, the impact of assimilating airship-borne radar radial winds to forecast the track, intensity, and structure of TC Molave is analyzed. The forecast sensitivity to the airship-borne radar depression angle (D-ang) and the distance from the airship to the TC center (DIS) are further analyzed in Section 4. A summary and discussion are provided in Section 5.

2. Method

2.1. Model and Data Assimilation Configuration

The forecast model used is the Weather Research and Forecasting model (i.e., WRF-ARW) as in an advanced research version of 3.8.1. The initial and boundary conditions were derived from NCEP final analyses (FNL) at 1 ° × 1 ° with a 6-h interval. The detailed model configuration is listed in Table 1.
Data assimilation is performed with a multiscale data assimilation and application system based on Ensemble Kalman Filter (EnKF). Several works in the literature [31,32] have demonstrated its great performance in forecasting landfalling TC through assimilation of ground-based radar radial winds. The experiment process is shown in Figure 1. Following many previous studies [28,32,34,54,55,56], the dynamic balanced initial perturbations were first generated with the WRFDA-3DVAR program under “cv3” background error covariance setting, and then injected into NCEP FNL to generate 60 ensemble members at 00:00 UTC on 26 October 2020. The averaged standard deviations over all domain grids for pressure, horizontal wind components, potential temperature, and water vapor mixing ratio are about 0.4 hPa, 1. S−1, 0.7 K, and 0.75 g kg−1, respectively, which are consistent with many prior studies [32,54]. The same measurement is also performed to obtain lateral boundary condition perturbations for each ensemble member. A short-range ensemble forecast (~6 h) was carried out to develop flow-dependent background error covariance structures relevant to the scale at which the EnKF is performed. The simulated airship-borne radial velocity data from the nature run are assimilated at 06:00 UTC 26, October 2020. This is the same as Feng, Duan, Wan, Hu, and Pu [32], as 20% and 80% of the total radar data are randomly selected and assimilated in d02 and d03 with a localization radius of 450 and 150 km, respectively. After assimilation, a 42-h deterministic forecast is initiated with the ensemble mean of the updated members. The observation operator of airship-borne radar radial wind in EnKF is introduced in Section 3.1.

2.2. Nature Run

The nature run is the forecast of Typhoon Regional Assimilation and Predication System (T-RAPS) that started at 00:00 UTC on 26 October 2020. T-RAPS [31] is a quasi-operational TC prediction system developed by the Chinese Academy of Meteorological Sciences, which consists of a TC dynamic initialization (DI) scheme [10] and WRF-ARW model. The DI approach spins up the axisymmetric component of the TC vortex using 6-h cycle runs that start 6 h before the forecast/simulation (i.e., 18:00 UTC on 25 October 2020). The DI procedure is stopped when the TC intensity is comparable with the observation, and the vortex after DI is utilized as the initial condition to warm-start the model. Many prior studies [31,57,58] have demonstrated the competitive performance of T-RPAS on modeling of TC’s track, intensity, and structure. More detailed descriptions of the DI scheme can be found in Cha and Wang [10], Wang et al. [59], and Liu, Wang, Xu, and Duan [11]. In addition to the nature run, two experiments are performed with and without simulated radar radial winds assimilated, named EnKF and noDA, respectively. The model configuration of nature run, EnKF, and noDA experiment are listed in Table 1. To consider the influence of model error in the QuickOSSE, the model setting of the nature run is artificially different from that of the EnKF/noDA experiment. The following modifications are made to produce a realistic nature run with enough model deviations to amount to a respectable model error [60]:
(1)
The horizontal resolution of the nature run (2 km) is nearly half that in the EnKF/noDA experiment (4.5 km);
(2)
The model top altitude, number of vertical levels, and sigma value of each model level in terrain-following coordinates differ between the twin experiments;
(3)
The initial and boundary condition of the nature run comes from the NCEP GFS forecast (with a 0.5 ° × 0.5 ° resolution) that started at 18:00 UTC on 25 October 2020, whereas the NCEP FNL (with a 1 ° × 1 ° resolution) is adopted in the EnKF/noDA experiment, and its initial time is 6 h later than the nature run;
(4)
Two vortex-following inner domains (d02/d03) are implemented in the nature run throughout the simulation period. The inner domains of the EnKF/noDA experiment remain static during the ensemble spin-up period and move with TC in the 42-h deterministic forecast.

2.3. Case Description

In this study, TC Molave (2020) is used as the case to illustrate the impact of airship-borne Doppler radial winds. TC Molave was generated in the western Pacific Ocean at 00:00 UTC on 23 October 2020 and then moved eastward through the Philippine Islands. After entering the South China Sea on October 26, Molave experienced a rapid intensification (RI) period, with peak intensity reaching 48 m/s (940 hPa), and finally made landfall off the coast of Vietnam at 08:00 UTC on 28 October 2020. The losses caused by Molave reached up to 115 deaths and more than USD 742 million in property damage. The best track and the simulation of the TC track and minimum sea-level pressure (minSLP) in the nature run are shown in Figure 2. It is shown that both track and intensity of nature run are comparable to the CMA best track and nature run successfully simulate the RI period with a similar RI rate, although the intensity is slightly stronger. In the following parts, the nature run is treated as the truth to illustrate the potential benefit of assimilating airship-borne Doppler winds.

3. Impacts of the Simulated Observations

3.1. Simulation of the Airship-Borne Doppler Wind Observations

The simulated airship flies on top of the TC at an altitude of 20 km above the sea surface, following the design height of the airship in a real flight mission. In the experiment mentioned in this section, the airship is set at 50 km east of the TC center horizontally (13.37°N, 19.89°E). The flight speed of the airship is about 30 km/h, and it only moved about 300 m within the time required for the radar to complete a 360-azimuth scan (less than 1 min). Therefore, the simulated radar observation is considered a snapshot of the wind field of the nature run at 06:00 UTC on 26 October 2020. According to the parameters of the NOAA P-3 air-borne radar, the maximum detection distance of the radar was set to 75 km, with a radial resolution of 150 m and an azimuthal resolution of 1 degree [61]. Radar bins along each ray are individually created according to the latitude/longitude of the airship, the azimuth, and the elevation of the ray, as well as the distance from the radar. The Doppler radial wind observations are then estimated by interpolating the wind components of the nature run to each radar bin location by the forward operator, as shown below [61]:
V r = u s i n φ c o s θ + v c o s φ c o s θ + ( w v T ) s i n θ
where V r is the simulated Doppler radial speed, and u, v, and w refer to the zonal, meridional, and vertical wind speed, respectively. φ and θ represent the azimuth and angle of depression (D-ang) of the radar beam relative to the ground. Large raindrops (with a diameter of around 5 mm) have terminal velocities ( v T ) of approximately 10 m/s [62]. This results in an inaccuracy of approximately 5 m/s in the region with high rainfall intensity (such as a TC eyewall or rainband) when the D-ang is only 30 degrees. Under the special toward-ground scanning method of the airship-borne radar, the influence of precipitation particles will become increasingly strong along with the enlargement in the D-ang. Hence, the effect of the terminal velocity of falling precipitation particles should be considered during the simulation of the radial winds [63]. Following the parameter scheme in the variational Doppler radar analysis system (VDRAS) [64], the mass-weighted hydrometeor terminal velocity ( v T ) is calculated by
V T = 5.4 α q r 0.125
The formula for calculating the correction factor α is as follows:
α = ( p 0 p ¯ ) 0.4
where p ¯ is the pressure at the base state and p 0 is the ground surface pressure. The same observation operator (Equation (1)) was developed in the EnKF assimilation system to absorb simulated radar observations.
Similar to the OSSE setup in Maldonado et al. [65], the additive random noise, normally distributed with a mean of 0 m/s and a variance of 1 m/s, is applied to simulate the instrument error. The diagonal component of the observation error covariance matrix is simulated since observation errors are considered uncorrelated. Because the spatial resolution of the radar observation is much higher than that of the model grid, a data-thinning strategy is implemented to avoid large correlations among the raw data and reduce the calculation cost [31,66]. Following Weng and Zhang [33], the airship-borne Doppler winds in a small region (referes as a bin) are averaged to generate the finally assimilated Super-Observation (SO) that matches the model grid density. The averaging bin is confined within 4 km in the radial direction and 5deg in the azimuthal direction.
The schematic diagram of airship-borne Doppler radar observation space is shown in Figure 3a. According to the maximum detection distance of the radar (75 km) and the flying height of the airship (20 km), the horizontal (R) and vertical (H) detection ranges are determined once the D-ang is given. Figure 3b shows the simulated radar radial wind field with a D-ang of 30 degrees and the airship posited 50 km from the center of the TC. In this condition, the horizontal (R) and vertical (H) observation range is 55 km and 20 km, respectively, and the east side and the eye of the TC can be observed. An evident cyclonic wind field is captured in the radar radial wind observations. The strong winds (more than 40 m/s) near the radius of maximum wind (RMW) in the lower layer are also involved.

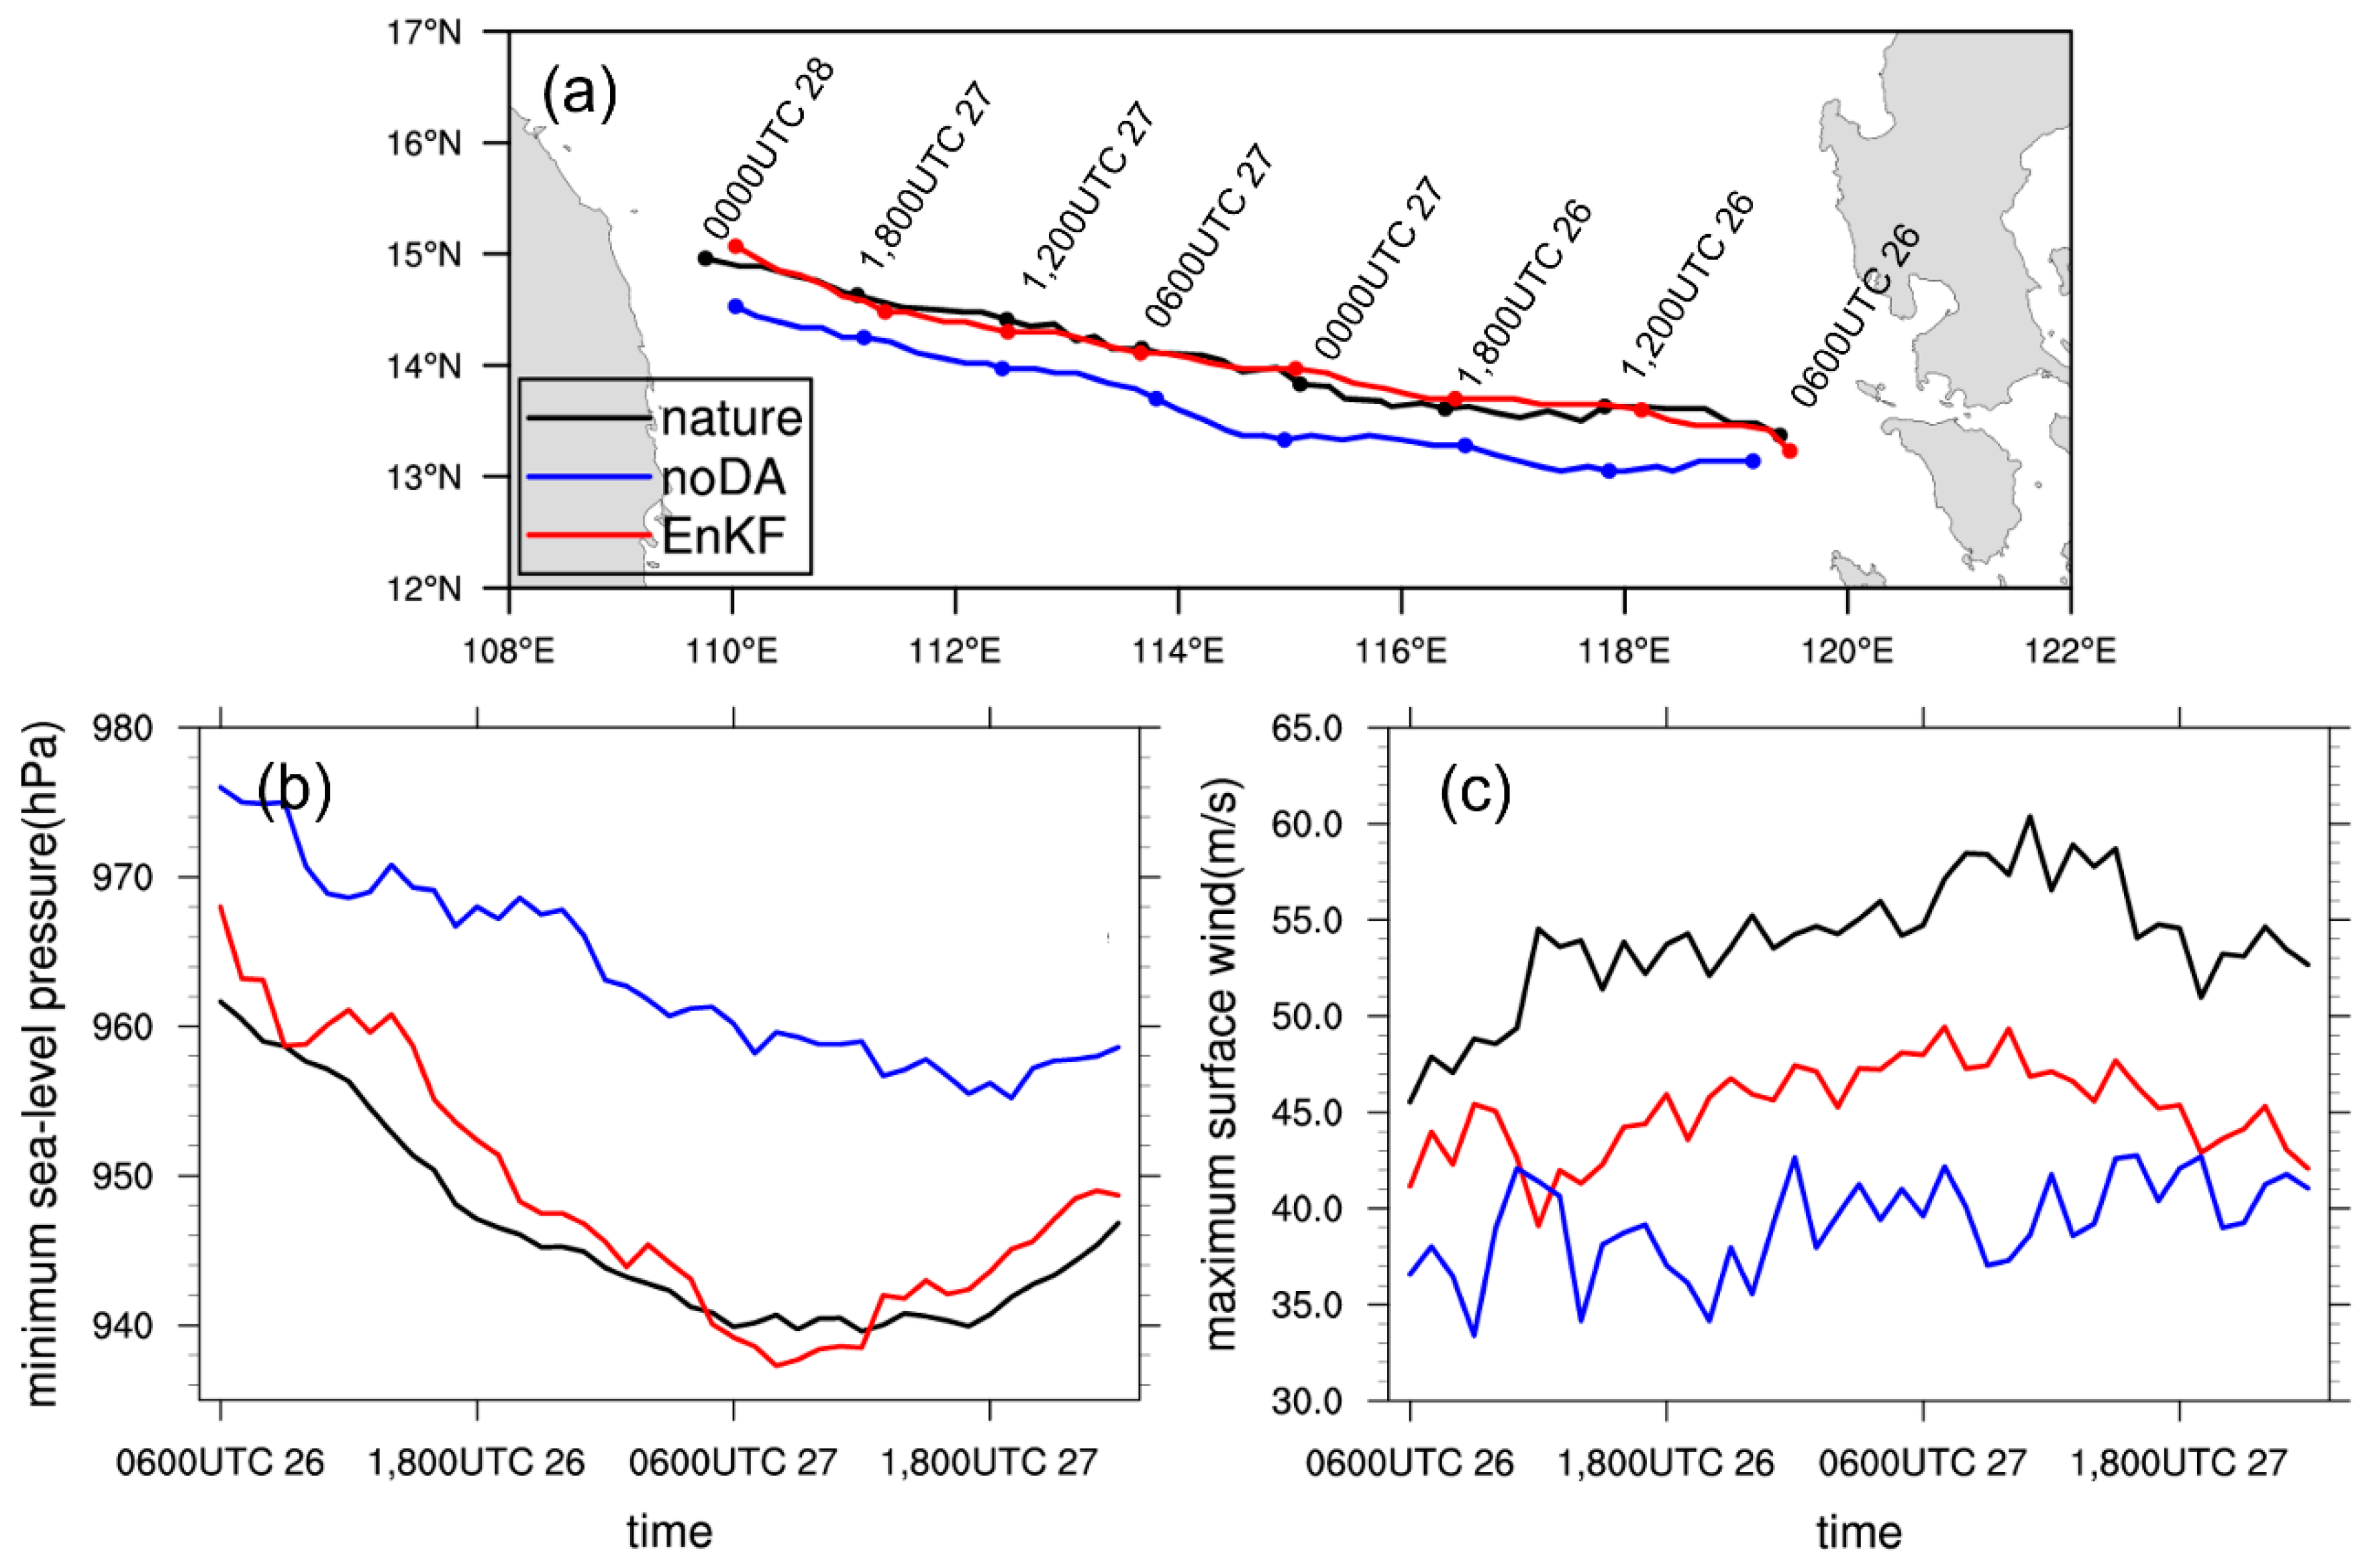
3.2. Impacts on TC Track and Intensity

In comparison with the nature run, the simulation after assimilating the airship-borne Doppler radar radial wind fairly reproduces the track and intensity of the TC (Figure 4). The track error of EnKF is generally less than 100 km during the 42-h simulation. Given that the complete wind field of TC eye and eyewall was captured in the radar observation, the initial position of the TC center of EnKF is closer to the nature run, with a position error reduced by 40 km compared to noDA. Due to the west–northward migration of the initial TC location, the TC track of the EnKF experiment reaches further north than that in the noDA experiment. Meanwhile, corresponding to the length scale of localization of 450 km in domain 02, the assimilation increment could cover the area of 1000 km and impact the steering flow of the TC. Hence, the TC track forecast is improved to a certain degree, similar to many previous works on ground-based or airborne radar data assimilation [33,54,55]. As for the intensity of the TC, significant improvements are found after assimilating the airship-borne radar radial winds. The minimum sea-level pressure (MinSLP, Figure 4b) agreed well with the nature run during the simulation period, becoming 8–16 hPa closer to the nature run than that in the noDA. The maximum surface wind speed (MaxWSP, Figure 4c) was enhanced by 5–10 m/s over the noDA during most of the simulation. Similar to some literature associated with Doppler radar data assimilation [32,33], the MinSLP and MaxWSP are not consistent with the best track or nature run simultaneously, which may be related to the model error. Although the MaxWSP was between 3 and 48 m/s and did not show a significant enhancement trend, the MinSLP decreased significantly during the model integration, and the value and the occurrence time of the lowest MinSLP are highly consistent with the nature run. It is noted that regardless of whether the airship-borne radar observation was assimilated, the increasing/decreasing trend of both MinSLP and MaxWSP did not change during the model’s integration. This indicates that the evolution of the TC intensity, along with time for this individual case, is determined more by the physical process of the model itself instead of the difference in the initial intensity, although it can affect the magnitude of the intensity in the following integration process.

3.3. Impacts on TC Structure

Besides improving the forecasted track and intensity of TC, the data assimilation also had a significant impact on its wind and thermal structure in the forecast. The results of 3 h and 18 h of model integration (09:00 UTC and 18:00 UTC on 26 October 2020) were selected to reflect the influence of data assimilation on the early and late stages of TC simulation. As shown in Figure 5, the vortex circulation in noDA is much weaker than in the nature run at both the early and late stages. After data assimilation, the 50 m/s maximum tangential wind is below 3 km in the vortex of EnKF (Figure 5c,f) for both stages, which is enhanced by 10 to 15 m/s compared to noDA (Figure 5b,e). In addition to the notable increases in the wind speed maxima near the surface, the tangential winds in the middle and upper levels (4–12 km) of the TC were also significantly enhanced (around 5 m/s) after assimilation, and the 25 m/s isobars stretched further upward by about 2 km during the entire simulation period. Unlike the tangential wind, the secondary circulation of the TC is not significantly intensified at the early stage of the simulation (09:00 UTC on 26 October 2020); after the 18-h dynamic adjustment, the enhanced tangential wind drives the increase in the low-level inflow and high-level outflow of the TC (both increase by 5 m/s compared to noDA), which is close to the structure in the nature run. Additionally, consistent with the nature run, a continuous vertical updraft with a maximum vertical velocity of 1.5 m/s emerges at the TC eyewall, connecting the higher-level outflow and lower-level inflow.
For the warm core structure directly related to the storm’s intensity [67,68,69], the assimilation of airship-borne radar data also brings a substantial contribution. Similar to the measurement of previous studies [67,70], the warm core here is represented by the potential temperature anomaly concerning the reference environmental temperature profile that averaged 300–750 km from the TC center. Compatible with a stronger circulation, the EnKF (Figure 6c,f) shows a stronger warm core in the eye region. Compared with noDA (Figure 6b,e), the spatial range of temperature perturbation over 8 K after assimilation is notably larger (Figure 6c,f). Additionally, the maximum anomaly reaches 12 K, similar to the nature run (Figure 6a,d). In total, the assimilation of airship-borne Doppler radar observations showed a distinct impact on TC dynamic and thermal structure and could build a strengthened TC vortex.

4. Sensitivity Analysis to Storm-Relative Distance and Radar Depression Angle

Apart from validating the possible impact of a new type of observation or observing platform, QuickOSSE could provide helpful suggestions in designing an observation strategy for real TC flight. Two factors, the distance from the airship to the TC center (DIS) and the radar depression angle (D-ang), could be essential to airship-borne radar radial winds and their assimilation’s impact on the forecast of TC. This section attempts to reveal the influence of these two factors on airship-borne radar radial winds and TC forecasts.

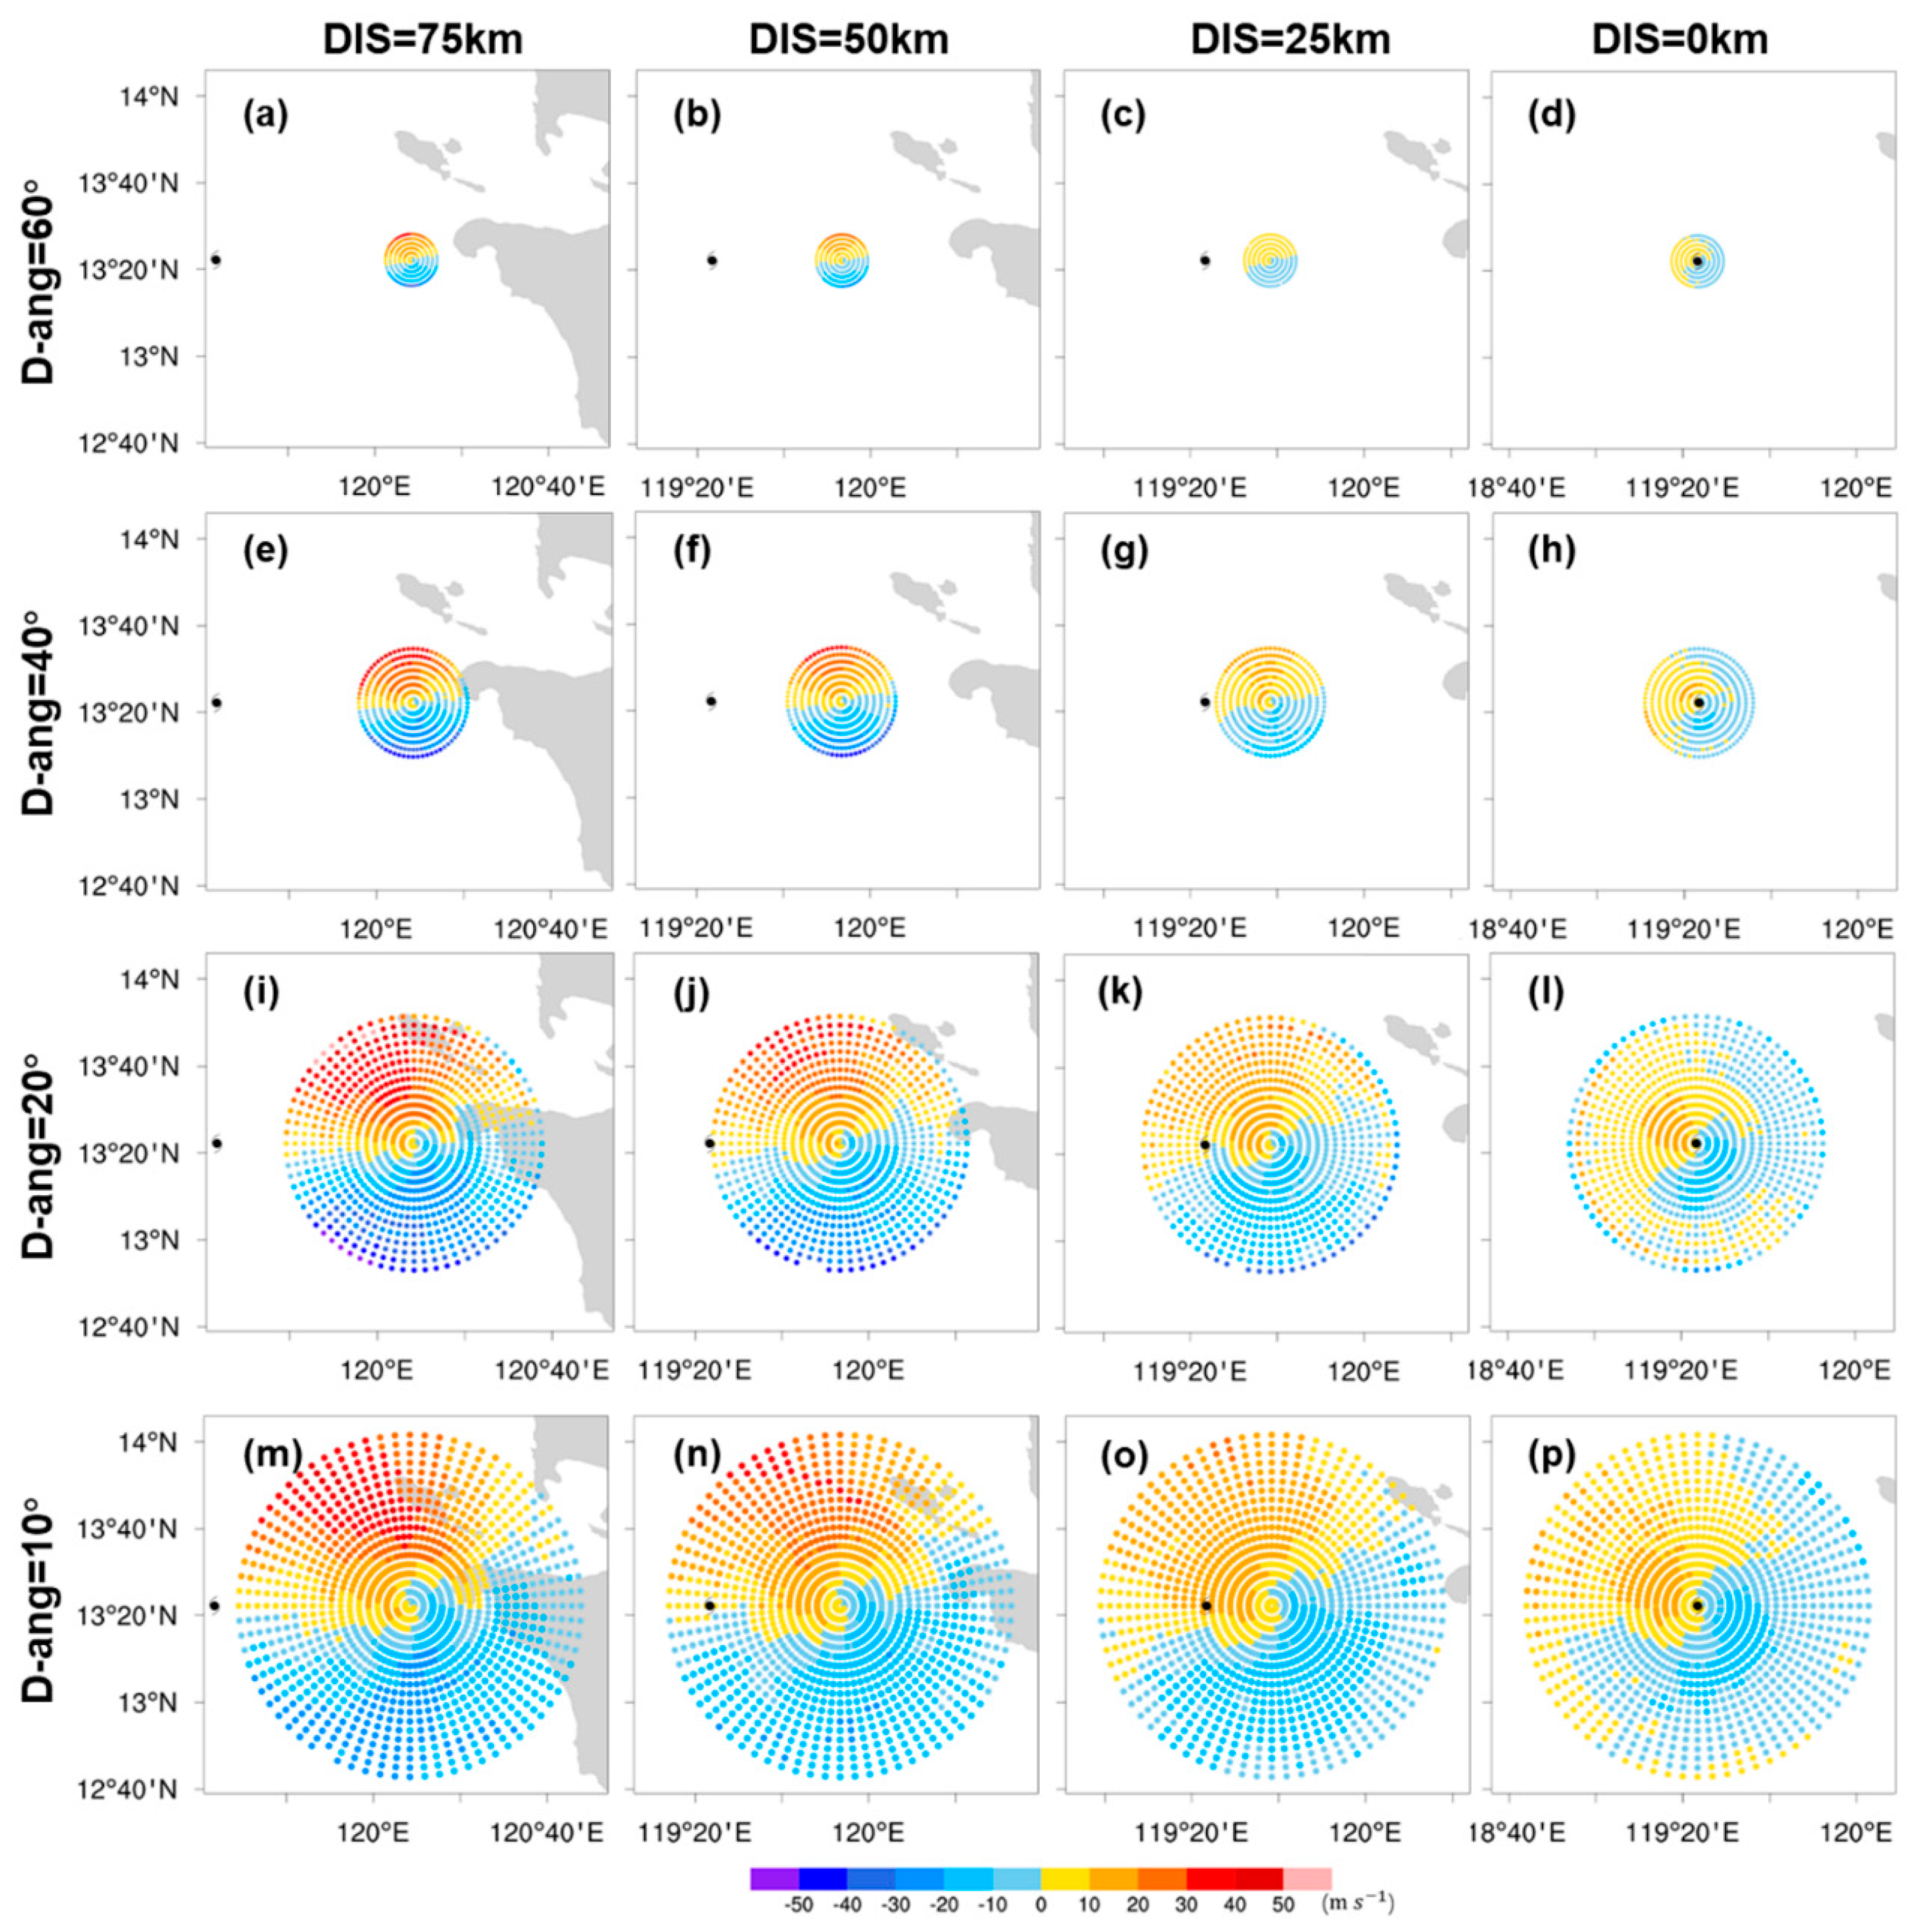
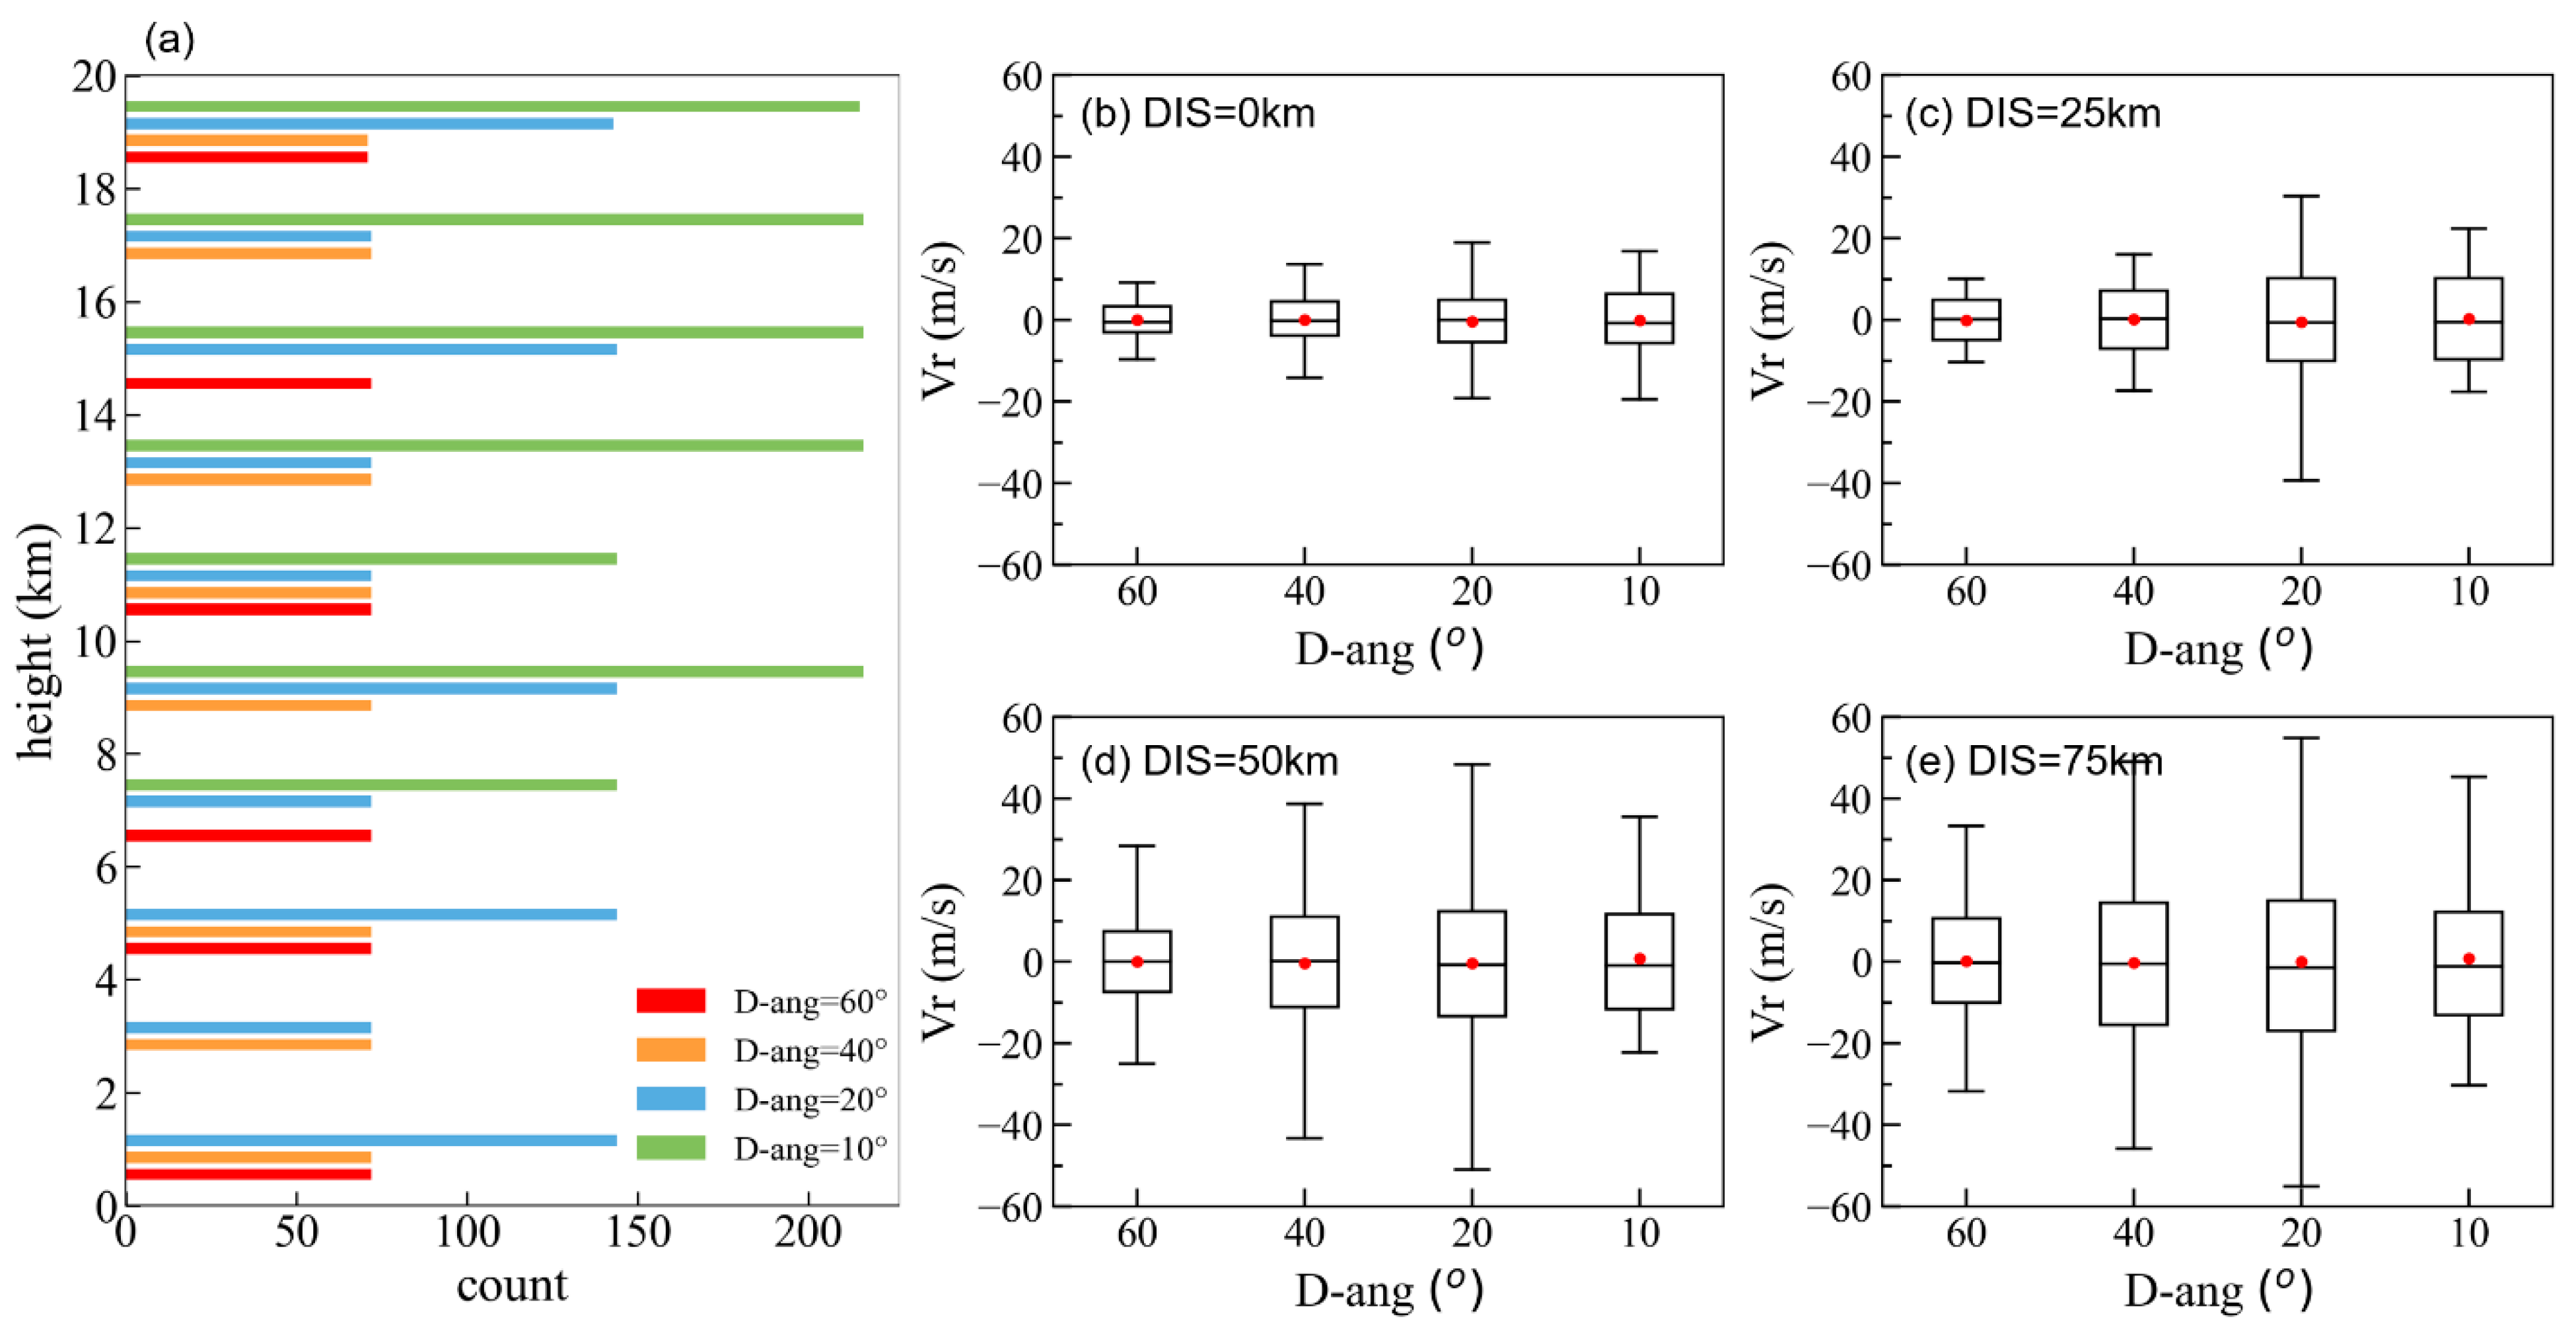
4.1. Simulated Observations under Various Conditions

As shown in Figure 7, D-ang determines the horizontal distance detected by the airship radar. When the radar D-ang equals 60°, 40°, 20°, and 10°, the corresponding horizontal detection radius ranges (R of Table 2) are about 12 km, 24 km, 55 km, and 72 km, respectively. When the D-ang is too large, the radar beam is too close to the vertical direction, which severely reduces the horizontal range of the radar detection. When the D-ang is too small (e.g., 10°), the vertical depth of the radar scanning volume is only 13 km due to the restriction of the maximum detection distance of the radar (75 km), despite the horizontal range of the radar detection being able to reach further than 70 km. Under such a setting with a small D-ang, the low-level area would be a blind spot for the airship-borne radar (Figure 8a). For other D-angs, the radar observations are uniformly distributed in the vertical direction from the bottom ocean surface to the flight level. Because the detection range of radar (L of Table 2) is restricted by the airship flight height at a large D-ang, the total number of radar observations varies with the D-ang. The smaller the D-ang, the larger the quantity of the SO.
The DIS, D-ang, and the size of the TC affect not only the detection range of the airship-borne radar but also the character of radar radial winds. If the airship is located right above the TC center (i.e., the DIS is equal to 0), the radar beam direction is roughly perpendicular to the direction of the TC tangential wind circulation so that only the TC secondary circulation component and the easterly and south-easterly airflow at high altitudes above the TC can be detected. Due to the inflow and outflow usually being much weaker than the primary cyclonic circulation of the TC, the radar observations are generally small, with a maximum value of little more than 20 m/s (Figure 8b). When there is a certain distance between the airship and the TC’s center, more tangential wind components of the TC can be observed by radar, resulting in a much higher maximum speed of the radial wind (Figure 8c–e). Under a certain DIS, the maximum radar wind may be larger if the D-ang is smaller, resulting in a larger scanning region. In addition, the size of the TC can affect the statistics of the radial winds jointly with the DIS and D-ang. For example, the radius of the maximum wind speed (RMW) of Molave is about 60 km, and the averaged tangential wind in the circular area 50–80 km from the TC’s center exceeds 50 m/s. The location of the maximum wind speed radius of the TC can be observed either when DIS is almost equal to the RMW (50 km or 75 km) with a D-ang of 20 degrees or when DIS is slightly larger than the RMW (i.e., 75 km) with a relatively large D-ang (e.g., 40 degrees, Figure 7e,i,j). Under the above conditions, a wind speed of 50 m/s can be observed by the airship-borne Doppler radar (Figure 8d,e).

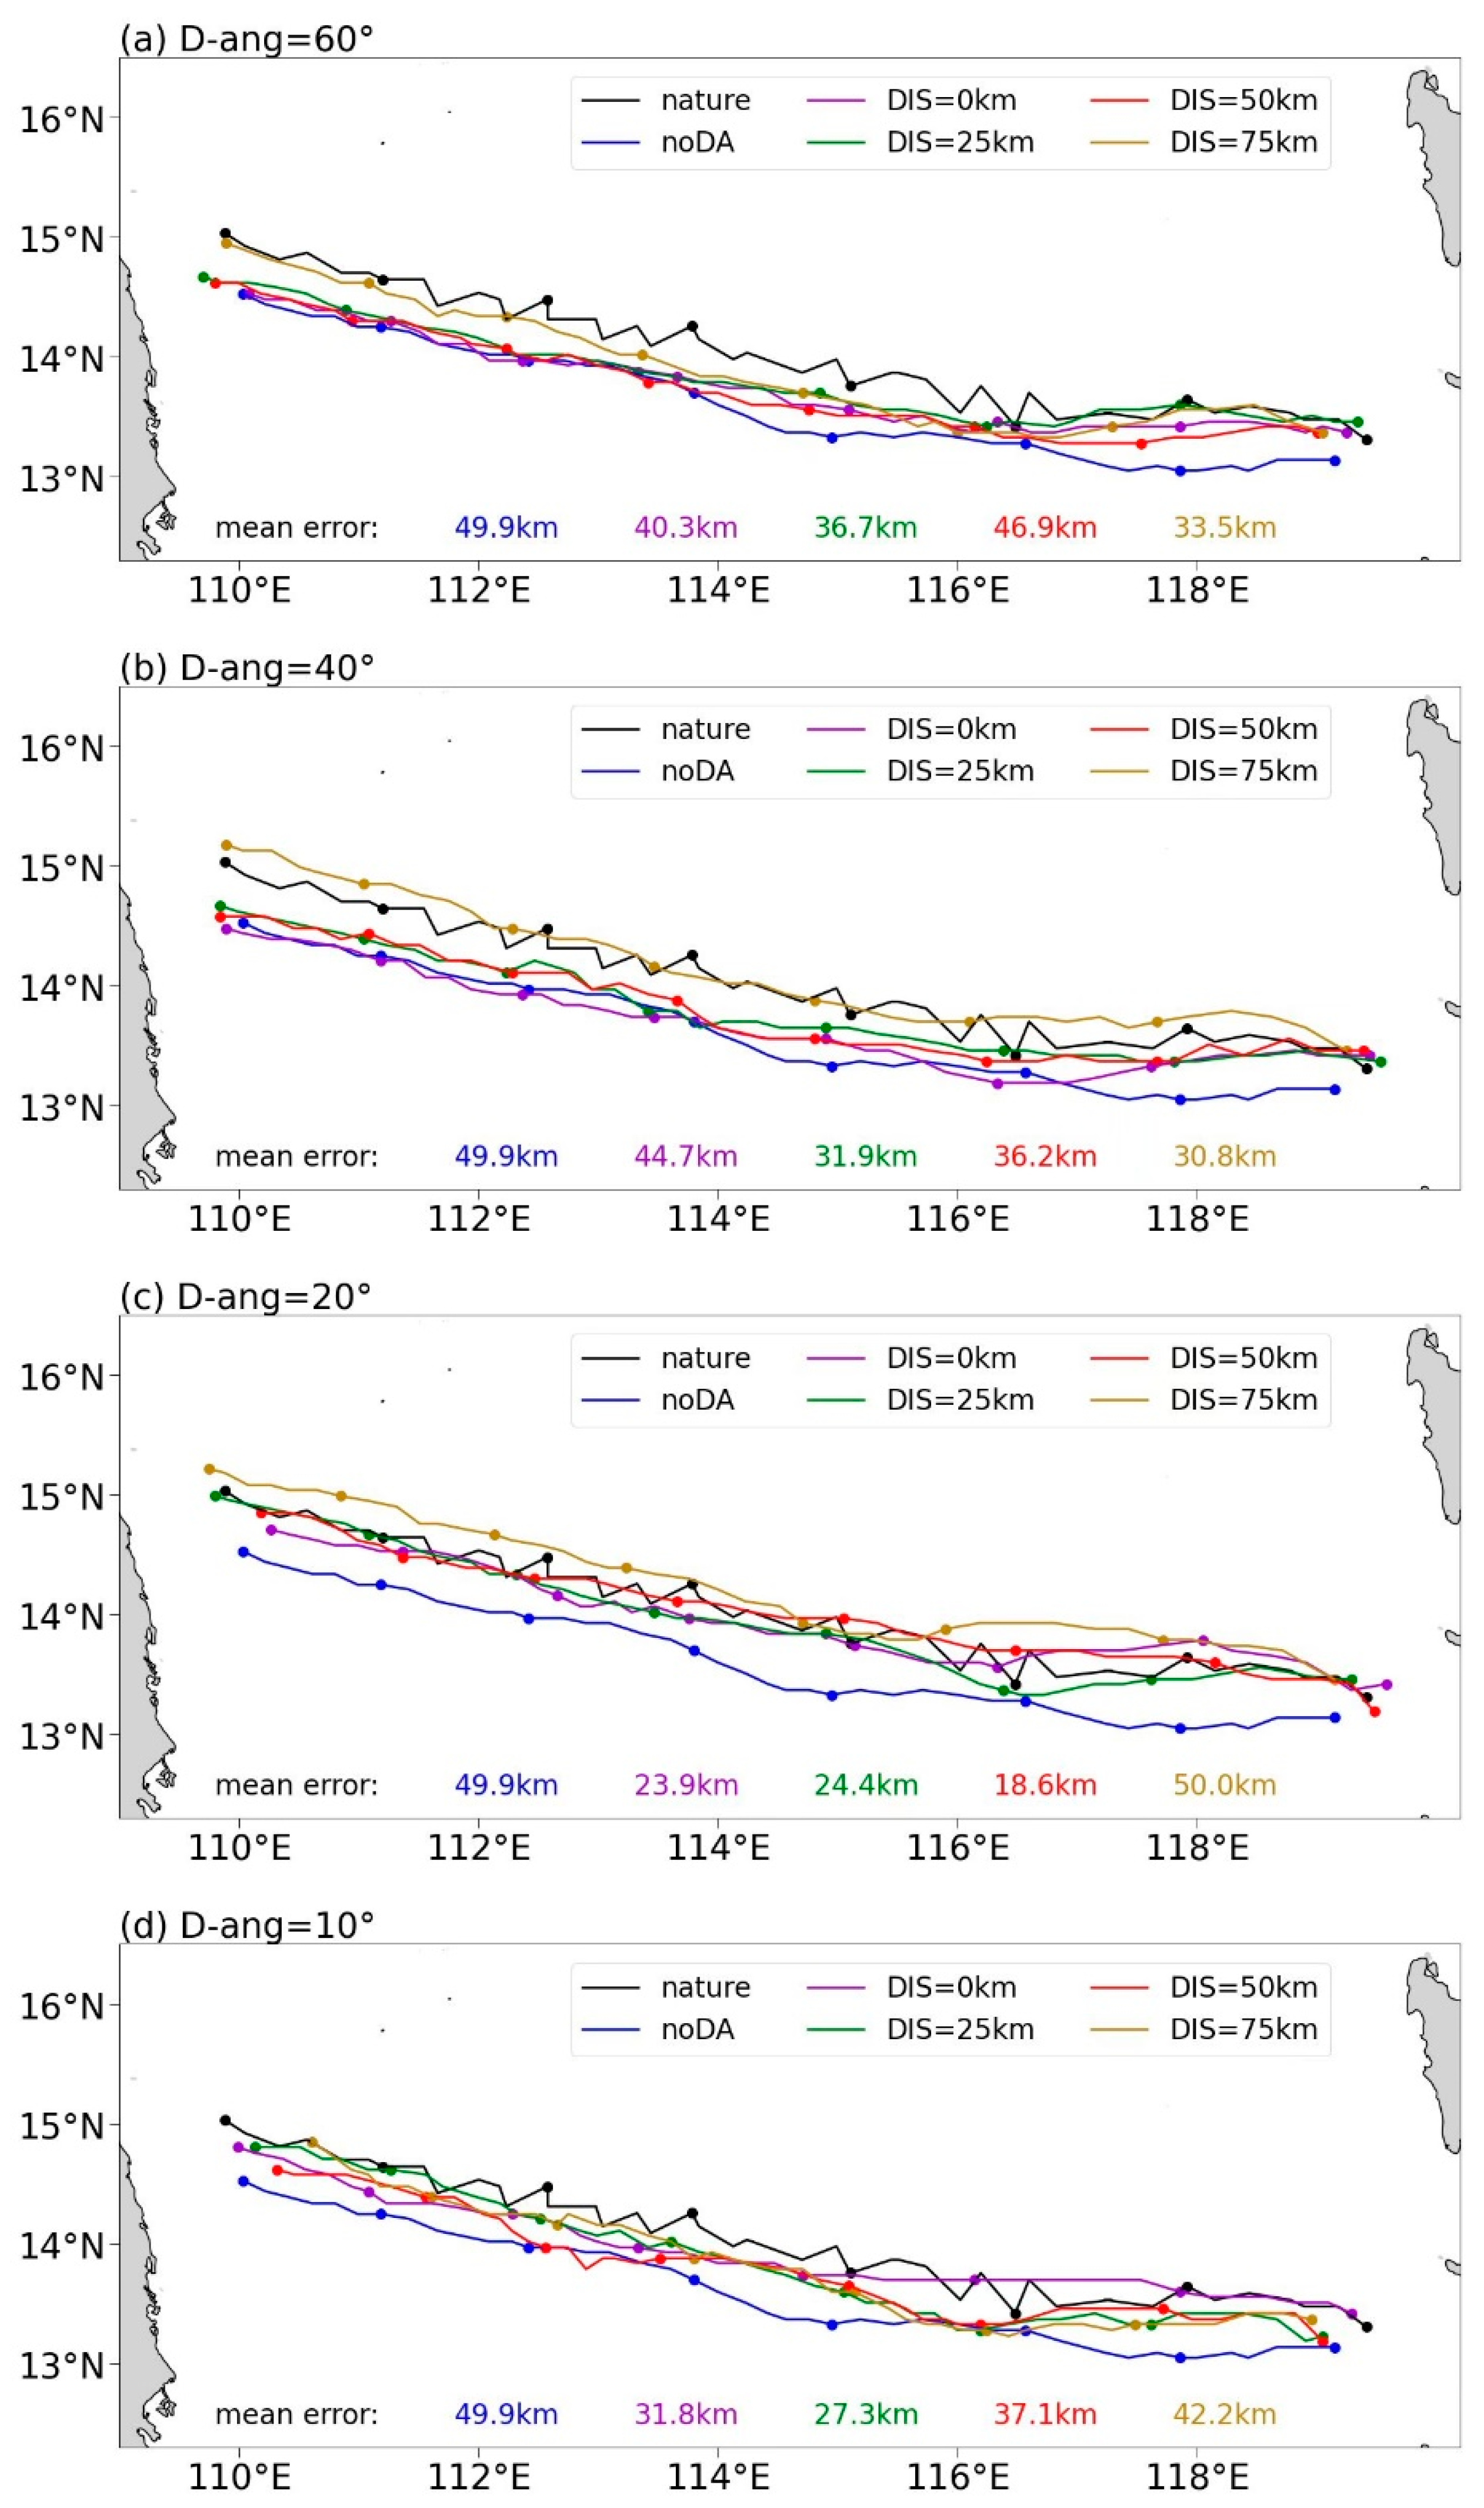
4.2. Sensitivity Analysis

To better evaluate the assimilation impact of airship-borne radar radial winds under the impacts of DIS and D-ang, sixteen experiments with different DISs (i.e., 0, 25, 50, and 75 km) and D-angs (10°, 20°, 40°, and 60°) are performed in this section. Figure 9 shows the track forecast of the sensitivity experiments. The initial position of TC in noDA is to the south, resulting in a southerly track bias in the following simulation. After data assimilation, given the apparent positive–negative radial winds gap in the radar observations in all sixteen conditions, the initial location of the TC’s center in each experiment was moved northerly to some degree. Additionally, it caused an evident improvement in the first 12 h forecast of the TC in all sixteen experiments. Except for the initial location error, the environment steering flow affects the TC track, especially for the track forecasts for a longer time. Beyond the first 12 h, many cases with shorter radar observation coverage stayed the same as noDA. Comparing three sets of tracks, the smaller the D-ang, the smaller the track forecast, especially in the 13–42-h simulation period. This result suggests the importance of the observation coverage for the long-time track forecast of a TC. If the observation coverage is too limited, the adjustment of the environment steering flow after assimilation seems insufficient to drive the track of the TC differently from the noDA after a 12-h simulation. Moreover, due to the deficiency of middle and low-level winds when the D-ang equals 10°, the track improvement is less than that with a D-ang of 20°.
Different from track prediction, whose performance is related to D-ang, the intensity forecasts were primarily influenced by DIS. As a result, the minSLP forecast curves were plotted in four panels with different DISs in Figure 10 (the maxWSP is similar to minSLP, so the figure is omitted). The results indicated that the radar observations with a certain DIS are crucial to intensify the TC vortex, and the initial intensity of TC is a key factor in the following forecast of TC intensity. If the airship hovers near the TC center (i.e., the DIS equals 0 or 25 km), the initial minSLP of TC remains unchanged or slightly higher than noDA, and a similar performance on the intensity forecast can be seen in the following period, regardless of the D-ang. When the airship flies 75 km from the TC center, the TC initial intensity can be enhanced by at least 10 hPa in an experiment with a D-ang of 60°, 40°, and 20°, and the forecast error can be reduced sharply. If the observations at the low level are not used in the assimilation, the initial errors for the intensity are similar to the noDA, resulting in a limited forecast improvement after assimilation. According to these results, the observations in the TC inner-core region, particularly for the winds near RMW at the low level, are crucial to generate an initial vortex with a lower minSLP. With a stronger initial TC, the intensity forecast error for all 42 h can be significantly reduced. This result is consistent with Emanuel and Zhang [71], who demonstrated that the intensity error growth in the first few days is approximately determined by the initial intensity error.

5. Summary and Discussion

In this study, the impact of airship-borne Doppler radar radial winds in the forecast of the tropical cyclone (TC) Molave (2020) is examined via a quick observation system simulation experiment (QuickOSSE), in which the radar radial wind observations are simulated based on the wind field of a nature run and then assimilated through the ensemble Kalman filter (EnKF). It is found that assimilating airship-borne Doppler radar radial wind can significantly improve the track and intensity forecast of Molave under an airship-borne radar depression angle (D-ang) of 20° and a distance from the airship to the TC center (DIS) of 50 km. The initial location error of the TC center, initial MinSLP, and MaxWSP error can be reduced by 40 km, 9 hPa, and 5 m/s, respectively, compared with the experiment with no data assimilated (noDA). This resulted in a better initial condition of the TC vortex and steering flow, and the track forecast in EnKF migrated to the north of the track in noDA, matching well with the nature run. The forecast of MinSLP in EnKF reproduced the RI phase of the nature run, with a nearly 940 hPa peak intensity.
The assimilation of airship-borne Doppler radar also changed the structure of the TC in terms of the circulation and temperature field. After 18 h of model integration, the primary and the secondary circulation of TC were enhanced by 23% and 50% through dynamic model integration, respectively. The enhanced updraft near the TC eyewall connected the inflow and outflow, establishing a strong TC secondary circulation in EnKF. On the temperature field, the increasing similarity between the EnKF and the nature run was found in both the increase in the maximum temperature anomaly concerning the environment and the vertical stretch of temperature anomaly larger than 8 K.
In addition, D-ang and DIS affected the observation characteristics and the forecasted TC. D-ang determined the horizontal and vertical range of the radar observation, and the radar with a smaller D-ang gave a larger horizontal scanning coverage. If the D-ang was larger than 40°, an airship-borne radar observation only covered a narrow circle region with a radius of less than 25 km. However, if the D-ang were too small (e.g., equal to 10°), the region within 7 km above the ocean would be a blind spot due to the detection range limitation of the radar beam. Meanwhile, the DIS determined the maximum Doppler wind speed. An appropriate DIS about RMW enables the involvement of heavy wind observations near RMW, which enlarges the spread of the wind speeds in one scanning volume.
Assimilating radar observations with various DIS/D-ang combinations creates a significant difference in the TC track and intensity forecast. The TC initial positions in all experiments with observations assimilated moved northward near the nature run. This resulted in a larger horizontal coverage in a smaller D-ang condition; the track forecast improved significantly compared to that with a large D-ang. While the intensity forecast was primarily correlated with the DIS selection, assimilating observations with a small DIS (e.g., 0 and 25 km) showed no improvement in intensity forecasts, which may stem from a lack of large winds of TC tangential circulation that represented the TC intensity. In other words, the observations near the TC’s RMW may be the key to improving the TC intensity forecast. Similar to the study of TC predictability [58], the intensity forecast error of the TC Molave was found to be closely related to its initial error.
To summarize, our results suggest that proper assimilation of airship-borne Doppler radar radial winds can improve the forecast of TC from different perspectives, ranging from the track and intensity to the structure. The sensitivity analysis showed that assimilating radar observations under a DIS near the RMW and a small (i.e., 20°) D-ang improved the forecast of the TC most significantly. This preliminary result examines the impact of airship-borne radar radial winds in the track and intensity forecast of TCs and is expected to provide a useful reference to the observing strategy of practical airship flight missions. Admittedly, although D-ang significantly affects TC analysis and forecast as investigated in this study, for real airship-borne radar manufacturing, a radar with multiple D-angs, is the best choice if possible. It should be mentioned that the above results were obtained from a single TC case and are by no means sufficient, and the OSSE system is not fully validated. Moreover, the detection sensitivity of airship-borne radar was not considered. More experiments with various TCs and more realistic observations considering the scattering characteristic of the frequency band of the radar should be performed.

Author Contributions

Conceptualization, J.F. and Y.D.; data curation, Q.W.; funding acquisition, Y.D.; methodology, J.F., Y.D. and X.L.; project administration, Y.D. and X.L.; resources, Y.D., X.L. and Q.W.; validation, J.F. and T.L.; visualization, J.F., W.S., T.L. and Q.W.; writing—original draft, J.F.; writing—review and editing, J.F., X.L. and W.S. All authors have read and agreed to the published version of the manuscript.

Funding

This study was supported in part by the National Key Research and Development Program of China (no. 2020YFE0201900); the National Natural Science Foundation of China under grant no. 61827901, 42192554, 42175007, 42005141, and 41905053; the S&T Development Fund of CAMS 2021KJ031 and 2022KJ012; the Basic Research Fund of CAMS 2022Y006; and the Beijing Nova Program under grant no. Z211100002121100.

Data Availability Statement

Not applicable.

Acknowledgments

The authors would like to express their sincere thanks to Qilin Wan from Guangdong–Hong Kong–Macao Greater Bay Area Weather Research Center for Monitoring Warning and Forecasting for data assimilation technique supporting and training. The authors also thank the journal reviewers and associate editor for their thorough and careful reviews and helpful suggestions and comments.

Conflicts of Interest

The authors declare no conflict of interest.

References

  1. Huang, X.; Peng, X.; Fei, J.; Cheng, X.; Ding, J.; Yu, D. Evaluation and Error Analysis of Official Tropical Cyclone Intensity Forecasts during 2005–2018 for the Western North Pacific. J. Meteorol. Soc. Jpn. Ser. II 2021, 99, 139–163. [Google Scholar] [CrossRef]
  2. Li, Y.; Wang, Y.; Tan, Z.M. Why Does the Initial Wind Profile Inside the Radius of Maximum Wind Matter to Tropical Cyclone Development? J. Geophys. Res.-Atmos. 2022, 127, e2022JD037039. [Google Scholar] [CrossRef]
  3. Li, Y.; Wang, Y.; Lin, Y. Revisiting the Dynamics of Eyewall Contraction of Tropical Cyclones. J. Atmos. Sci. 2019, 76, 3229–3245. [Google Scholar] [CrossRef]
  4. Ryglicki, D.R.; Doyle, J.D.; Jin, Y.; Hodyss, D.; Cossuth, J.H. The Unexpected Rapid Intensification of Tropical Cyclones in Moderate Vertical Wind Shear. Part II: Vortex Tilt. Mon. Weather Rev. 2018, 146, 3801–3825. [Google Scholar] [CrossRef]
  5. Fei, R.; Wang, Y. Tropical Cyclone Intensification Simulated in the Ooyama-type Three-layer Model with a Multilevel Boundary Layer. J. Atmos. Sci. 2021, 78, 3799–3813. [Google Scholar] [CrossRef]
  6. Deng, L.; Gao, W.; Duan, Y.; Wang, Y. Microphysical Properties of Rainwater in Typhoon Usagi (2013): A Numerical Modeling Study. Adv. Atmos. Sci. 2019, 36, 510–526. [Google Scholar] [CrossRef]
  7. Holland, G.J. An Analytic Model of the Wind and Pressure Profiles in Hurricanes. Mon. Weather Rev. 1980, 108, 1212–1218. [Google Scholar] [CrossRef]
  8. Rappin, E.D.; Nolan, D.S.; Majumdar, S.J. A Highly Configurable Vortex Initialization Method for Tropical Cyclones. Mon. Weather Rev. 2013, 141, 3556–3575. [Google Scholar] [CrossRef]
  9. Kwon, I.-H.; Cheong, H.-B. Tropical Cyclone Initialization with a Spherical High-Order Filter and an Idealized Three-Dimensional Bogus Vortex. Mon. Weather Rev. 2010, 138, 1344–1367. [Google Scholar] [CrossRef]
  10. Cha, D.-H.; Wang, Y. A Dynamical Initialization Scheme for Real-Time Forecasts of Tropical Cyclones Using the WRF Model. Mon. Weather Rev. 2013, 141, 964–986. [Google Scholar] [CrossRef]
  11. Liu, H.-Y.; Wang, Y.; Xu, J.; Duan, Y. A Dynamical Initialization Scheme for Tropical Cyclones under the Influence of Terrain. Weather Forecast. 2018, 33, 641–659. [Google Scholar] [CrossRef]
  12. Shi, D.; Chen, G.; Wang, K.; Bi, X.; Chen, K. Evaluation of Two Initialization Schemes for Simulating the Rapid Intensification of Typhoon Lekima (2019). Adv. Atmos. Sci. 2020, 37, 987–1006. [Google Scholar] [CrossRef]
  13. Wu, C.C.; Chen, S.G.; Yang, C.C.; Lin, P.H.; Aberson, S.D. Potential Vorticity Diagnosis of the Factors Affecting the Track of Typhoon Sinlaku (2008) and the Impact from Dropwindsonde Data during T-PARC. Mon. Weather Rev. 2012, 140, 2670–2688. [Google Scholar] [CrossRef]
  14. Feng, J.; Wang, X. Impact of Assimilating Upper-Level Dropsonde Observations Collected during the TCI Field Campaign on the Prediction of Intensity and Structure of Hurricane Patricia (2015). Mon. Weather Rev. 2019, 147, 3069–3089. [Google Scholar] [CrossRef]
  15. Zhang, S.; Pu, Z. Numerical Simulation of Rapid Weakening of Hurricane Joaquin with Assimilation of High-Definition Sounding System Dropsondes during the Tropical Cyclone Intensity Experiment: Comparison of Three- and Four-Dimensional Ensemble–Variational Data Assimilation. Weather Forecast. 2019, 34, 521–538. [Google Scholar] [CrossRef]
  16. Zhang, F.; Minamide, M.; Nystrom, R.G.; Chen, X.; Lin, S.-J.; Harris, L.M. Improving Harvey Forecasts with Next-Generation Weather Satellites: Advanced Hurricane Analysis and Prediction with Assimilation of GOES-R All-Sky Radiances. Bull. Am. Meteorol. Soc. 2019, 100, 1217–1222. [Google Scholar] [CrossRef]
  17. Honda, T.; Miyoshi, T.; Lien, G.-Y.; Nishizawa, S.; Yoshida, R.; Adachi, S.A.; Terasaki, K.; Okamoto, K.; Tomita, H.; Bessho, K. Assimilating All-Sky Himawari-8 Satellite Infrared Radiances: A Case of Typhoon Soudelor (2015). Mon. Weather Rev. 2018, 146, 213–229. [Google Scholar] [CrossRef]
  18. Zhu, Y.; Liu, E.; Mahajan, R.; Thomas, C.; Groff, D.; Van Delst, P.; Collard, A.; Kleist, D.; Treadon, R.; Derber, J.C. All-Sky Microwave Radiance Assimilation in NCEP’s GSI Analysis System. Mon. Weather Rev. 2016, 144, 4709–4735. [Google Scholar] [CrossRef]
  19. Grasso, L.D.; Zupanski, M.; Wu, T.-C.; Kummerow, C.D.; Boukabara, S.-A. All-Sky Radiance Assimilation of ATMS in HWRF: A Demonstration Study. Mon. Weather Rev. 2019, 147, 85–106. [Google Scholar] [CrossRef]
  20. Feng, J.; Qin, X.; Wu, C.; Zhang, P.; Yang, L.; Shen, X.; Han, W.; Liu, Y. Improving typhoon predictions by assimilating the retrieval of atmospheric temperature profiles from the FengYun-4A’s Geostationary Interferometric Infrared Sounder (GIIRS). Atmos. Res. 2022, 280, 106488. [Google Scholar] [CrossRef]
  21. Lu, J.; Feng, T.; Li, J.; Cai, Z.; Xu, X.; Li, L.; Li, J. Impact of Assimilating Himawari-8-Derived Layered Precipitable Water With Varying Cumulus and Microphysics Parameterization Schemes on the Simulation of Typhoon Hato. J. Geophys. Res.-Atmos. 2019, 124, 3050–3071. [Google Scholar] [CrossRef]
  22. Velden, C.; Lewis, W.E.; Bresky, W.; Stettner, D.; Daniels, J.; Wanzong, S. Assimilation of High-Resolution Satellite-Derived Atmospheric Motion Vectors: Impact on HWRF Forecasts of Tropical Cyclone Track and Intensity. Mon. Weather Rev. 2017, 145, 1107–1125. [Google Scholar] [CrossRef]
  23. Pu, Z.; Yu, C.; Tallapragada, V.; Jin, J.; McCarty, W. The Impact of Assimilation of GPM Microwave Imager Clear-Sky Radiance on Numerical Simulations of Hurricanes Joaquin (2015) and Matthew (2016) with the HWRF Model. Mon. Weather Rev. 2019, 147, 175–198. [Google Scholar] [CrossRef]
  24. Wang, Y.; Pu, Z. Assimilation of Radial Velocity from Coastal NEXRAD into HWRF for Improved Forecasts of Landfalling Hurricanes. Weather Forecast. 2021, 36, 587–599. [Google Scholar] [CrossRef]
  25. Zhang, Z.; Zhang, J.A.; Alaka, G.J.; Wu, K.; Mehra, A.; Tallapragada, V. A Statistical Analysis of High-Frequency Track and Intensity Forecasts from NOAA’s Operational Hurricane Weather Research and Forecasting (HWRF) Modeling System. Mon. Weather Rev. 2021, 149, 3325–3339. [Google Scholar] [CrossRef]
  26. Shen, F.; Xu, D.; Min, J. Effect of momentum control variables on assimilating radar observations for the analysis and forecast for Typhoon Chanthu (2010). Atmos. Res. 2019, 230, 104622. [Google Scholar] [CrossRef]
  27. Shen, F.; Xu, D.; Min, J.; Chu, Z.; Li, X. Assimilation of radar radial velocity data with the WRF hybrid 4DEnVar system for the prediction of hurricane Ike (2008). Atmos. Res. 2020, 234, 104771. [Google Scholar] [CrossRef]
  28. Zhu, L.; Wan, Q.; Shen, X.; Meng, Z.; Zhang, F.; Weng, Y.; Sippel, J.; Gao, Y.; Zhang, Y.; Yue, J. Prediction and Predictability of High-Impact Western Pacific Landfalling Tropical Cyclone Vicente (2012) through Convection-Permitting Ensemble Assimilation of Doppler Radar Velocity. Mon. Weather Rev. 2016, 144, 21–43. [Google Scholar] [CrossRef]
  29. Xu, D.; Shen, F.; Min, J. Effect of background error tuning on assimilating radar radial velocity observations for the forecast of hurricane tracks and intensities. Meteorol. Appl. 2019, 27, e1820. [Google Scholar] [CrossRef] [Green Version]
  30. Xu, D.; Shen, F.; Min, J. Effect of Adding Hydrometeor Mixing Ratios Control Variables on Assimilating Radar Observations for the Analysis and Forecast of a Typhoon. Atmosphere 2019, 10, 415. [Google Scholar] [CrossRef]
  31. Duan, Y.; Wan, Q.; Huang, J.; Zhao, K.; Yu, H.; Wang, Y.; Zhao, D.; Feng, J.; Tang, J.; Chen, P.; et al. Landfalling Tropical Cyclone Research Project (LTCRP) in China. Bull. Am. Meteorol. Soc. 2019, 100, ES447–ES472. [Google Scholar] [CrossRef]
  32. Feng, J.; Duan, Y.; Wan, Q.; Hu, H.; Pu, Z. Improved Prediction of Landfalling Tropical Cyclone in China Based on Assimilation of Radar Radial Winds with New Super-Observation Processing. Weather Forecast. 2020, 35, 2523–2539. [Google Scholar] [CrossRef]
  33. Aberson, S.D.; Black, M.L.; Black, R.A.; Burpee, R.W.; Cione, J.J.; Landsea, C.W.; Marks, F.D. Thirty Years of Tropical Cyclone Research with the Noaa P-3 Aircraft. Bull. Am. Meteorol. Soc. 2006, 87, 1039–1056. [Google Scholar] [CrossRef] [Green Version]
  34. Weng, Y.; Zhang, F. Assimilating Airborne Doppler Radar Observations with an Ensemble Kalman Filter for Convection-Permitting Hurricane Initialization and Prediction: Katrina (2005). Mon. Weather Rev. 2012, 140, 841–859. [Google Scholar] [CrossRef] [Green Version]
  35. Zhang, F.; Weng, Y.; Gamache, J.F.; Marks, F.D. Performance of convection-permitting hurricane initialization and prediction during 2008-2010 with ensemble data assimilation of inner-core airborne Doppler radar observations. Geophys. Res. Lett. 2011, 38, L15810. [Google Scholar] [CrossRef] [Green Version]
  36. Zhang, F.; Weng, Y. Predicting Hurricane Intensity and Associated Hazards: A Five-Year Real-Time Forecast Experiment with Assimilation of Airborne Doppler Radar Observations. Bull. Am. Meteorol. Soc. 2015, 96, 25–33. [Google Scholar] [CrossRef] [Green Version]
  37. Gray, W.M.; Neumann, C.; Tsui, T.L. Assessment of the Role of Aircraft Reconnaissance on Tropical Cyclone Analysis and Forecasting. Bull. Am. Meteorol. Soc. 1991, 72, 1867–1883. [Google Scholar] [CrossRef]
  38. Weatherford, C.L.; Gray, W.M. Typhoon Structure as Revealed by Aircraft Reconnaissance. Part I: Data Analysis and Climatology. Mon. Weather Rev. 1988, 116, 1032–1043. [Google Scholar] [CrossRef]
  39. Weatherford, C.L.; Gray, W.M. Typhoon Structure as Revealed by Aircraft Reconnaissance. Part II: Structural Variability. Mon. Weather Rev. 1988, 116, 1044–1056. [Google Scholar] [CrossRef]
  40. Chou, K.-H.; Wu, C.-C.; Lin, P.-H.; Aberson, S.D.; Weissmann, M.; Harnisch, F.; Nakazawa, T. The Impact of Dropwindsonde Observations on Typhoon Track Forecasts in DOTSTAR and T-PARC. Mon. Weather Rev. 2011, 139, 1728–1743. [Google Scholar] [CrossRef]
  41. Liu, C.; Xue, M.; Kong, R. Direct Assimilation of Radar Reflectivity Data Using 3DVAR: Treatment of Hydrometeor Background Errors and OSSE Tests. Mon. Weather Rev. 2019, 147, 17–29. [Google Scholar] [CrossRef]
  42. Zeng, X.; Atlas, R.; Birk, R.J.; Carr, F.H.; Carrier, M.J.; Cucurull, L.; Hooke, W.H.; Kalnay, E.; Murtugudde, R.; Posselt, D.J.; et al. Use of Observing System Simulation Experiments in the United States. Bull. Am. Meteorol. Soc. 2020, 101, E1427–E1438. [Google Scholar] [CrossRef]
  43. Leidner, S.M.; Nehrkorn, T.; Henderson, J.; Mountain, M.; Yunck, T.; Hoffman, R.N. A Severe Weather Quick Observing System Simulation Experiment (QuickOSSE) of Global Navigation Satellite System (GNSS) Radio Occultation (RO) Superconstellations. Mon. Weather Rev. 2017, 145, 637–651. [Google Scholar] [CrossRef]
  44. Zhang, F.; Minamide, M.; Clothiaux, E.E. Potential impacts of assimilating all-sky infrared satellite radiances from GOES-R on convection-permitting analysis and prediction of tropical cyclones. Geophys. Res. Lett. 2016, 43, 2954–2963. [Google Scholar] [CrossRef] [Green Version]
  45. Pan, S.; Gao, J.; Stensrud, D.J.; Wang, X.; Jones, T.A. Assimilation of Radar Radial Velocity and Reflectivity, Satellite Cloud Water Path, and Total Precipitable Water for Convective-Scale NWP in OSSEs. J. Atmos. Ocean. Technol. 2018, 35, 67–89. [Google Scholar] [CrossRef]
  46. Delgado, J.; Bucci, L.; Ryan, K.; Atlas, R.; Murillo, S. Impact of Gulfstream-IV Dropsondes on Tropical Cyclone Prediction in a Regional OSSE System. Mon. Weather Rev. 2019, 147, 2961–2977. [Google Scholar] [CrossRef]
  47. Hoffman, R.N.; Atlas, R. Future Observing System Simulation Experiments. Bull. Am. Meteorol. Soc. 2016, 97, 1601–1616. [Google Scholar] [CrossRef]
  48. Atlas, R.; Bucci, L.; Annane, B.; Hoffman, R.; Murillo, S. Observing System Simulation Experiments to Assess the Potential Impact of New Observing Systems on Hurricane Forecasting. Mar. Technol. Soc. J. 2015, 49, 140–148. [Google Scholar] [CrossRef]
  49. Noh, Y.; Cheon, W.G.; Hong, S.Y.; Raasch, S. Improvement of the K-profile Model for the Planetary Boundary Layer based on Large Eddy Simulation Data. Bound.-Layer Meteorol. 2003, 107, 401–427. [Google Scholar] [CrossRef] [Green Version]
  50. Mlawer, E.J.; Taubman, S.J.; Brown, P.D.; Iacono, M.J.; Clough, S.A. Radiative transfer for inhomogeneous atmospheres: RRTM, a validated correlated-k model for the longwave. J. Geophys. Res.-Atmos. 1997, 102, 16663–16682. [Google Scholar] [CrossRef]
  51. Dudhia, J. Numerical Study of Convection Observed during the Winter Monsoon Experiment Using a Mesoscale Two-Dimensional Model. J. Atmos. Sci. 1988, 46, 3077–3107. [Google Scholar] [CrossRef]
  52. Hong, S.-Y.; Dudhia, J.; Chen, S.-H. A Revised Approach to Ice Microphysical Processes for the Bulk Parameterization of Clouds and Precipitation. Mon. Weather Rev. 2004, 132, 103–120. [Google Scholar] [CrossRef]
  53. Kain, J.S. The Kain–Fritsch Convective Parameterization: An Update. J. Appl. Meteorol. 2004, 43, 170–181. [Google Scholar] [CrossRef]
  54. Zhang, F.; Weng, Y.; Sippel, J.A.; Meng, Z.; Bishop, C.H. Cloud-Resolving Hurricane Initialization and Prediction through Assimilation of Doppler Radar Observations with an Ensemble Kalman Filter. Mon. Weather Rev. 2009, 137, 2105–2125. [Google Scholar] [CrossRef] [Green Version]
  55. Yue, J.; Meng, Z. Impact of assimilating Taiwan’s coastal radar radial velocity on forecasting Typhoon Morakot (2009) in southeastern China using a WRF-based EnKF. Sci. China Earth Sci. 2017, 60, 315–327. [Google Scholar] [CrossRef]
  56. Yue, J.; Meng, Z.; Yu, C.-K.; Cheng, L.-W. Impact of coastal radar observability on the forecast of the track and rainfall of Typhoon Morakot (2009) using WRF-based ensemble Kalman filter data assimilation. Adv. Atmos. Sci. 2017, 34, 66–78. [Google Scholar] [CrossRef]
  57. Zhang, X.; Duan, Y.; Wang, Y.; Wei, N.; Hu, H. A high-resolution simulation of Supertyphoon Rammasun (2014)—Part I: Model verification and surface energetics analysis. Adv. Atmos. Sci. 2017, 34, 757–770. [Google Scholar] [CrossRef]
  58. Wang, H.; Wang, Y. A Numerical Study of Typhoon Megi (2010). Part I: Rapid Intensification. Mon. Weather Rev. 2014, 142, 29–48. [Google Scholar] [CrossRef]
  59. Wang, H.; Wang, Y.; Xu, H. Improving simulation of a tropical cyclone using dynamical initialization and large-scale spectral nudging: A case study of Typhoon Megi (2010). Acta Meteorol. Sin. 2013, 27, 455–475. [Google Scholar] [CrossRef]
  60. Xu, H.; Wang, H.; Duan, Y. An Investigation of the Impact of Different Turbulence Schemes on the Tropical Cyclone Boundary Layer at Turbulent Gray-Zone Resolution. J. Geophys. Res.-Atmos. 2021, 126, e2021JD035327. [Google Scholar] [CrossRef]
  61. Aksoy, A.; Lorsolo, S.; Vukicevic, T.; Sellwood, K.J.; Aberson, S.D.; Zhang, F. The HWRF Hurricane Ensemble Data Assimilation System (HEDAS) for High-Resolution Data: The Impact of Airborne Doppler Radar Observations in an OSSE. Mon. Weather Rev. 2012, 140, 1843–1862. [Google Scholar] [CrossRef] [Green Version]
  62. Spilhaus, A.F. Raindrop size, shape and falling speed. J. Atmos. Sci. 1948, 5, 108–110. [Google Scholar] [CrossRef]
  63. Lippi, D.E.; Carley, J.R.; Kleist, D.T. Improvements to the Assimilation of Doppler Radial Winds for Convection-Permitting Forecasts of a Heavy Rain Event. Mon. Weather Rev. 2019, 147, 3609–3632. [Google Scholar] [CrossRef]
  64. Sun, J.; Crook, N.A. Dynamical and Microphysical Retrieval from Doppler Radar Observations Using a Cloud Model and Its Adjoint. Part II: Retrieval Experiments of an Observed Florida Convective Storm. J. Atmos. Sci. 1998, 55, 835–852. [Google Scholar] [CrossRef]
  65. Maldonado, P.; Ruiz, J.; Saulo, C. Parameter sensitivity of the WRF-LETKF system for assimilation of radar observations: Imperfect-model observing system simulation experiments. Weather Forecast. 2020, 35, 1345–1362. [Google Scholar] [CrossRef]
  66. Waller, J.A.; Bauernschubert, E.; Dance, S.L.; Nichols, N.K.; Potthast, R.; Simonin, D. Observation Error Statistics for Doppler Radar Radial Wind Superobservations Assimilated into the DWD COSMO-KENDA System. Mon. Weather Rev. 2019, 147, 3351–3364. [Google Scholar] [CrossRef] [Green Version]
  67. Munsell, E.B.; Zhang, F.; Braun, S.A.; Sippel, J.A.; Didlake, A.C. The Inner-Core Temperature Structure of Hurricane Edouard (2014): Observations and Ensemble Variability. Mon. Weather Rev. 2018, 146, 135–155. [Google Scholar] [CrossRef]
  68. Zhang, D.-L.; Chen, H. Importance of the upper-level warm core in the rapid intensification of a tropical cyclone. Geophys. Res. Lett. 2012, 39, L02806. [Google Scholar] [CrossRef] [Green Version]
  69. Gao, S.; Wang, D.; Hong, H.; Wu, N.; Li, T. Evaluation of Warm-Core Structure in Reanalysis and Satellite Data Sets Using HS3 Dropsonde Observations: A Case Study of Hurricane Edouard (2014). J. Geophys. Res.-Atmos. 2018, 123, 6713–6731. [Google Scholar] [CrossRef]
  70. Wang, X.; Jiang, H. A 13-Year Global Climatology of Tropical Cyclone Warm-Core Structures from AIRS Data. Mon. Weather Rev. 2019, 147, 773–790. [Google Scholar] [CrossRef]
  71. Emanuel, K.; Zhang, F. On the Predictability and Error Sources of Tropical Cyclone Intensity Forecasts. J. Atmos. Sci. 2016, 73, 3739–3747. [Google Scholar] [CrossRef]
Figure 1. Schematic flowchart for the nature run, EnKF, and noDA experiments. The three blue parallel arrows represent ensemble spin-up before the DA cycles. The red arrows show the assimilation of simulated radar observation at 06:00 UTC on 26 October 2020. The blue arrows present forecasts with the ensemble mean of EnKF or FNL initial condition (noDA experiment).
Remotesensing 15 00191 g001
Figure 2. The track (a) and intensity (b) of nature run (solid line) and CMA best track (dashed line) for TC Molave.
Remotesensing 15 00191 g002
Figure 3. (a) Schematic diagram of airship-borne Doppler radar observation space. θ, L, H, and R denote the radar depression angle (D-ang), radar maximum detection distance, vertical detection range, and horizontal detection range, respectively. (b) The simulated radial winds of TC Molave in nature run when D-ang equals 30° and distance of the airship from the TC center equals 75 km.
Remotesensing 15 00191 g003
Figure 4. The (a) track, (b) minimum sea-level pressure, and (c) maximum surface wind forecast of TC Molave in EnKF (red curve), noDA (blue curve), and nature run (black curve).
Remotesensing 15 00191 g004
Figure 5. Azimuthal averaged tangential wind speed (shaded) and radial wind of TC Molave in nature run (left column), noDA (middle column), and EnKF (right column) at 09:00 UTC (ac) and 18:00 UTC (df) on 26 October 2020.
Remotesensing 15 00191 g005
Figure 6. The vertical cross-section of potential temperature anomaly (see text for the description) in nature run (the left column), noDA (the middle column), and EnKF (the right column) at 09:00 UTC (ac) and 18:00 UTC (df) on 26 October 2020.
Remotesensing 15 00191 g006
Figure 7. The simulated radar radial wind observations under different angles of depression (D-angs) and different distances from the airship to the TC center (DISs). (ad) D-ang = 60°, (eh) D-ang = 40°, (il) D-ang = 20°, (mp) D-ang = 10°; (a,e,i,m) DIS = 75 km, (b,f,j,n) DIS = 50 km, (c,j,k,o) DIS = 25 km, (d,h,l,p) DIS = 0 km.
Remotesensing 15 00191 g007
Figure 8. (a) The number of the simulated Doppler radar radial winds under various radar D-ang configurations. The box plot of the simulated radar radial winds when DIS equals (b) 0 km, (c) 25 km, (d) 50 km, (e) 75 km.
Remotesensing 15 00191 g008
Figure 9. The track forecast of assimilating airship-borne radar observations under a D-ang of (a) 60°, (b) 40°, (c) 20°, and (d) 10°. The track forecasts under various DISs are shown in different colors. The mean track error during simulating period of each experiment is noted in the figure with the color corresponding to the track line.
Remotesensing 15 00191 g009
Figure 10. The minimum sea-level pressure of TC forecast when DIS equals (a) 0, (b) 25 km, (c) 50 km, and (d) 75 km. The intensity forecast under various D-angs is shown by different colors. The mean absolute intensity error during simulating period of each experiment is noted in the figure with the corresponding color.
Remotesensing 15 00191 g010
Table 1. Description of model configuration for the nature run, EnKF, and noDA experiment.
Nature RunEnKF/noDA
Vertical levels50, top at 10 hPa43, top at 50 hPa
Grid nestingThree two-way nested domains (d01/d02/d03)
Horizontal resolution18 km/6 km/2 km40.5 km/13.5 km/4.5 km
Domain grid size311 × 251, 271 × 271, and 211 × 211120 × 100, 151 × 151, and 169 × 169
Planetary boundary layerYonsei University (YSU) scheme [49]
Longwave radiationRapid radiative transfer model (TTRM) longwave radiation physics scheme [50]
Shortwave radiationDudhia shortwave radiation physics scheme [51]
MicrophysicsWRF single-moment six-class microphysics (WSM6) scheme [52]
CumulusKain–Fritsch cumulus scheme [53].
Table 2. The detection range (L), horizontal scanning radius (R), vertical scanning depth (H), and total radar SO number in various radar D-ang settings.
D-ang (θ)L (km)R (km)H (km)Total SO Number
60°23.111.520.0431
40°31.123.820.0575
20°58.454.820.01079
10°75.073.913.01367
Disclaimer/Publisher’s Note: The statements, opinions and data contained in all publications are solely those of the individual author(s) and contributor(s) and not of MDPI and/or the editor(s). MDPI and/or the editor(s) disclaim responsibility for any injury to people or property resulting from any ideas, methods, instructions or products referred to in the content.

